800
700
600
500
400
300
200
100
0
8007006005004003002001000
Universita degli Studi di MilanoFacolta di Scienze Matematiche, Fisiche e Naturali
Universita Cattolica del Sacro CuoreFacolta di Scienze Matematiche, Fisiche e Naturali
Dottorato di Ricerca in Fisica,Astrofisica e Fisica Applicata
Thermomechanics of
Hypersonic Phononic Crystals
Settore Scientifico Disciplinare FIS/03
Coordinatore: Prof. Marco Bersanelli
Tutore: Dott. Gabriele Ferrini
Co-Tutore: Prof. Fulvio Parmigiani
Tesi di Dottorato di:
Damiano Nardi
Ciclo XXII
Anno Accademico 2008-2009
800
700
600
500
400
300
200
100
0
8007006005004003002001000
Scuola di Dottorato in
Fisica, Astrofisica e Fisica
Applicata
Ciclo XXII
Universita degli Studi di Milano
Facolta di Scienze Matematiche, Fisiche e Naturali
Dipartimento di Fisica
Milano (Italy)
Universita Cattolica del Sacro Cuore
Facolta di Scienze Matematiche, Fisiche e Naturali
Dipartimento di Matematica e Fisica
Brescia (Italy) - Sede Consorziata
Prof. Marco Bersanelli Director
Dott. Gabriele Ferrini Supervisor
Prof. Fulvio Parmigiani Promoter
c©Damiano Nardi 2009
http://www.dmf.unicatt.it/elphos

Contents
Contents I
1 Introduction 1
1.1 Overview . . . . . . . . . . . . . . . . . . . . . . . . 1
1.2 Outline . . . . . . . . . . . . . . . . . . . . . . . . . 3
2 State of the art 5
2.1 Picosecond ultrasonics . . . . . . . . . . . . . . . . . 6
2.2 Sub-nanosecond thermal transport . . . . . . . . . . 9
3 Pseudosurface acoustic waves in hypersonic surface
phononic crystals 11
3.1 Introduction . . . . . . . . . . . . . . . . . . . . . . . 13
3.2 Mechanical model . . . . . . . . . . . . . . . . . . . . 16
3.3 Pseudo-SAW . . . . . . . . . . . . . . . . . . . . . . 19
3.4 Frequency gap . . . . . . . . . . . . . . . . . . . . . 25
- I -

3.5 Mechanical energy radiation . . . . . . . . . . . . . . 30
3.6 Summary . . . . . . . . . . . . . . . . . . . . . . . . 33
4 Calorimetry at the nanoscale 35
4.1 Introduction . . . . . . . . . . . . . . . . . . . . . . . 37
4.2 Nanocalorimetry . . . . . . . . . . . . . . . . . . . . 38
4.3 Simple analytic approach . . . . . . . . . . . . . . . 44
4.4 Full thermodynamical model . . . . . . . . . . . . . 48
4.5 Results and discussion . . . . . . . . . . . . . . . . . 53
4.6 Summary . . . . . . . . . . . . . . . . . . . . . . . . 58
5 Thermomechanics of hypersonic surface phononic crys-
tals 61
5.1 Introduction . . . . . . . . . . . . . . . . . . . . . . . 62
5.2 Time-dependent model for time-resolved diffraction
measurements . . . . . . . . . . . . . . . . . . . . . . 63
5.3 Impulsive heat-driven displacement . . . . . . . . . . 67
5.4 Coupling to bulk modes and lifetime . . . . . . . . . 70
5.5 Extension to the 3D case . . . . . . . . . . . . . . . 76
5.6 Summary . . . . . . . . . . . . . . . . . . . . . . . . 88
6 Conclusions 89
6.1 Summary . . . . . . . . . . . . . . . . . . . . . . . . 89
6.2 Perspectives . . . . . . . . . . . . . . . . . . . . . . . 91
Bibliography 95
- II -

List of publications 103
Acknowledgments 105
- III -

Chapter 1
Introduction
1.1 Overview
The interest in the field of thermomechanics at the nanoscale has grown
at a tremendous pace in the last decade, thanks to the availability of
novel material processing and growth techniques and to the emergence
of new detection methods. The interest is both scientific and technolog-
ical.
The mechanics and thermal dynamics are expected to drastically
change as objects dimensions shrink. Mode quantization, both bulk and
surface, become important. Fluctuations in both sample dimensions and
“environment” temperature start affecting the macroscopic response.
The thermomechanical dynamics takes places on a time scale ranging
from few picoseconds to tens of nanosecond and on sub-µm length scales.
These scales question the applicability of theoretical frames so far applied
1

2 Introduction chap. 1
to bulk systems and call for experiments providing fast-time resolution
and low-perturbing sensitive probes.
Under an applicative standpoint, issues such as thermal manage-
ment in nanoelectronic devices, thermomechanical responses in Micro-
ElectroMechanical Systems (MEMS) and Opto-Acoustical devices in the
hypersonic frequency range for both high resolution imaging and mass
trafficking, just to mention a few, are of paramount importance.
The present work stems from this context and focuses on surface-
based phononic crystals as toy systems allowing to access, in conjunction
with time-resolved ultrafast optics, both thermal and mechanical prop-
erties of nanosystems. These systems are periodic elastic composites of
two or more vibrating materials, obtained patterning the surface of a
substrate material either by metal deposition or substrate etching.
All-optical time-resolved experiments on a periodic optical lattice
such as a surface phononic crystal, allow to deliver an energy density
dUV to the nanostructure. The same technique allows to follow, in the
time domain, the energy relaxation dUV from the nanostructure to the
substrate, serving as an external bath. Both the thermal δQV and me-
chanical energy δWV , branching from the absorbed total energy dUV ,
can be followed. The optical probe, besides providing time-resolution, is
a non-contact low-perturbing probe. This peculiarity is particularly im-
portant for detection of minute thermal fluxes and displacements fields.
As far as applications, assessing the role of geometry and material
parameters of surface phononic crystals, with respect to surface wave
generation, paves the way to the engineering of hypersonic surface acous-
tic waves generators and detectors beyond a trial-and-error approach.
Surface-based phononic crystals, in conjunction with ultrafast optics,
thus provide an ideal system to investigate both nanocalorimetry and

sec. 1.2 Outline 3
nanomechanics and a valuable generation/detection scheme for hyper-
sonic surface waves.
1.2 Outline
This work is organized as follows: in Chapter 2 we review the background
and advances on ultrafast generation and detection of thermal gradients
and pseudosurface acoustic waves in two-dimensional lattices of metal-
lic nanostructures. Comparing the experimental findings to the numeric
analysis of the thermomechanical problem, these materials emerge as
model systems to investigate both the mechanical and thermal energy
transfer at the nanoscale.
In Chapter 3 we present a theoretical framework allowing to properly
address the nature of surfacelike eigenmodes in a 2D hypersonic surface
phononic crystal. An overall comprehension of this physics is still miss-
ing, due to the fact that there is no distinction between the eigenmodes of
the surface-based nanostructures and the surface acoustic modes of the
semi-infinite substrate, the solution of the elastic equation being a pseu-
dosurface acoustic wave partially localized on the nanostructures and
radiating energy into the bulk. This problem is solved by introducing
a surface-likeness coefficient as a tool allowing to identify pseudosur-
face acoustic waves and to calculate their line shapes. Having accessed
the pseudosurface modes of the composite structure, the same theoret-
ical frame allows reporting on the gap opening in the now well-defined
pseudo-SAW frequency spectrum. We show how the filling fraction, mass
loading, and geometric factors affect both the frequency gap, and how

4 Introduction chap. 1
the mechanical energy is scattered out of the surface waveguiding modes.
In Chapter 4 we explore the heat transfer δQV from the nanostruc-
ture to the substrate. That is the realm of nanocalorimetry. Over the last
century calorimetry has been the method of choice for the investigation
on thermodynamic properties of matter. Conventional calorimetry, how-
ever, is limited to sample sizes of few tens of micrograms. To overcome
the downsizing limits of conventional calorimetry, we rely on all-optical
time-resolved techniques. In this Chapter the thermal dynamics occur-
ring in such experiments are theoretically investigated from 300 to 1.5
K. We report ab-initio calculations describing the temperature depen-
dence of the electron-phonon interactions for Cu nanodisks supported
on Si. The electrons and phonons temperatures are found to decouple
on the ns time scale at ∼ 10 K, which is two orders of magnitude in
excess with respect to that found for standard low-temperature trans-
port experiments. Accounting for the physics behind these results, we
suggest an alternative route for overhauling the present knowledge of the
electron-phonon decoupling mechanisms in nanoscale systems by replac-
ing the mK temperature requirements of conventional experiments with
experiments in the time-domain.
In Chapter 5 the mechanical energy transfer δWV from the nanos-
tructure to the substrate is explored. We present a theoretical frame-
work allowing to properly investigate the optical generation of pseudo-
surface acoustic waves in a hypersonic surface phononic crystal. Ex-
ploiting finite-elements analysis, together with the models developed in
Chapters 3 and 4, we follow in the time domain the initial impulsive heat-
driven displacement launching pseudo-SAWs and evaluate their lifetime.
We then test our approach against the results of time-resolved optical
diffraction experiments performed on the same composite systems [1].

Chapter 2
State of the art
The use of femtosecond laser pulses to impulsively excite thermal and me-
chanical transients in matter has led, in the last years, to the development
of picosecond acoustics. Recently, the pump-probe approach has been
applied to nanoengineered materials to optically generate and detect
acoustic waves in the GHz frequency range. In this Chapter, we review
the background and advances on ultrafast generation and detection of
thermal gradients and pseudosurface acoustic waves in two-dimensional
lattices of metallic nanostructures. Comparing the experimental findings
to the numeric analysis of the thermomechanical problem, these mate-
rials emerge as model systems to investigate both the mechanical and
thermal energy transfer at the nanoscale.
5
6 State of the art chap. 2
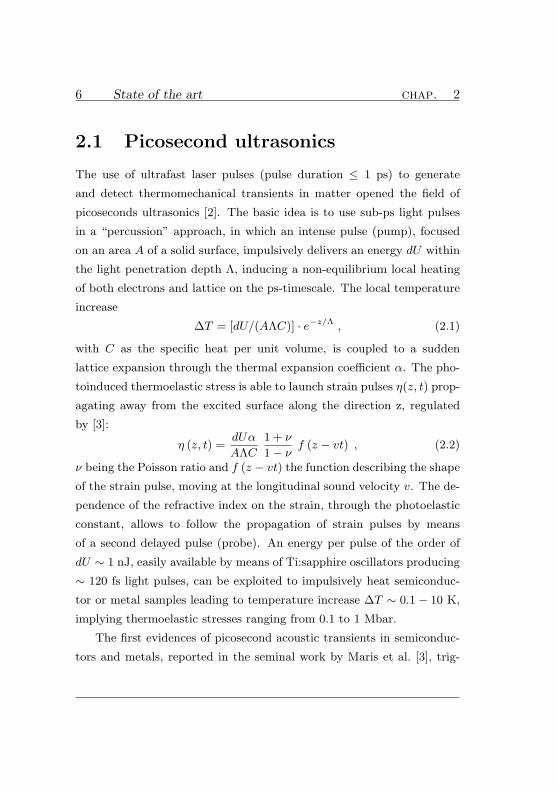
2.1 Picosecond ultrasonics
The use of ultrafast laser pulses (pulse duration ≤ 1 ps) to generate
and detect thermomechanical transients in matter opened the field of
picoseconds ultrasonics [2]. The basic idea is to use sub-ps light pulses
in a “percussion” approach, in which an intense pulse (pump), focused
on an area A of a solid surface, impulsively delivers an energy dU within
the light penetration depth Λ, inducing a non-equilibrium local heating
of both electrons and lattice on the ps-timescale. The local temperature
increase
∆T = [dU/(AΛC)] · e−z/Λ , (2.1)
with C as the specific heat per unit volume, is coupled to a sudden
lattice expansion through the thermal expansion coefficient α. The pho-
toinduced thermoelastic stress is able to launch strain pulses η(z, t) prop-
agating away from the excited surface along the direction z, regulated
by [3]:
η (z, t) =dUα
AΛC
1 + ν
1 − νf (z − vt) , (2.2)
ν being the Poisson ratio and f (z − vt) the function describing the shape
of the strain pulse, moving at the longitudinal sound velocity v. The de-
pendence of the refractive index on the strain, through the photoelastic
constant, allows to follow the propagation of strain pulses by means
of a second delayed pulse (probe). An energy per pulse of the order of
dU ∼ 1 nJ, easily available by means of Ti:sapphire oscillators producing
∼ 120 fs light pulses, can be exploited to impulsively heat semiconduc-
tor or metal samples leading to temperature increase ∆T ∼ 0.1 − 10 K,
implying thermoelastic stresses ranging from 0.1 to 1 Mbar.
The first evidences of picosecond acoustic transients in semiconduc-
tors and metals, reported in the seminal work by Maris et al. [3], trig-

sec. 2.1 Picosecond ultrasonics 7
gered the investigation of the microscopic mechanisms responsible for
the strain generation. At present, there is general agreement that, in
semiconductors, the accumulation of the long-lived photo-injected ex-
citations modifies the orbital population, inducing an electronic stress
coupled to an impulsive contraction or expansion of the lattice through
the deformation potential [4]. This mechanism is always accompanied
by the volume expansion related to the increase of the phonon popu-
lation through the anharmonicity of the crystal potential. The latter
effect, named lattice thermoelasticity, completely dominates in metals,
where a rapid intraband relaxation of high-energy electrons is achieved
by means of electron-phonon scattering. The temperature dynamics of
the photoinduced non-equilibrium electrons and phonons in metals can
be satisfactorily described by the two-temperature model (2TM) [5]. The
main prediction is a local quasi-thermalization at an effective tempera-
ture T ∗ of electrons and phonons, on the timescale of ∼ 1 ps. The short
thermalization time ensures that part of the energy dU of the pump pulse
is efficiently converted into strain energy. This characteristic made very
common the use of metal thin films as light-sound transducer to launch
ultrasonic acoustic pulses in materials [6, 7].
The use of high-energy amplified Ti:sapphire oscillators opened the
way to the investigation of the high-intensity strain regime, where the
non-linear effects become effective. Pump pulses with energy of the order
of dU ∼ 10−100 nJ generate acoustic pulses with strain amplitude of the
order of 10−3 and a time duration of the order of 10 ps. In this regime the
balance between the increase of the sound velocity with strain and the
decrease of the velocity of the high-frequency components of the strain
pulse, due to the flattening of the phonon dispersion, results in the gen-
eration of sub-THz acoustic solitons, described by a Korteweg-de Vries

8 State of the art chap. 2
equation [8]. After the first evidences of acoustic solitons generation in
semiconductor and transparent media, solitons have been exploited to
modulate the band gap of semiconductor quantum-wells, through the
deformation potential [9].
When exciting samples at surfaces, a particular class of solutions of
the elastic equation is constituted by surface acoustic waves (SAWs),
i.e. acoustic waves confined at the surface within a depth of the order
of their wavelength λ [10]. SAWs in the hypersonic frequency range
(≥ 1 GHz) are currently used to manipulate electrons in semiconductor
devices [11, 12] and photons in microcavities [13, 14, 15]. The quest
for efficient SAWs generation and detection techniques at ever higher
frequencies led to the investigation of SAWs generation by means of ul-
trashort laser pulses. In particular, when the pump pulse is focused on a
small area (A ∼ 1−10 µm2) of a solid surface, the large Fourier spectrum
allows launching SAWs at different k-wavevectors. Time-resolved imag-
ing techniques have been employed to follow on the ps timescale SAW
propagation on free surfaces [16, 17], through grain-boundaries [18], in
phononic crystals [19] and in resonators [20].
The possibility to selectively excite bulk quasi-monochromatic acous-
tic waves became real by employing engineered materials with artificial
periodicities of the elastic properties. In these systems, the pump pulse
induces an impulsive strain with the wavelength matching the periodicity
of the structure. The use of semiconductor superlattices allowed exciting
coherent THz acoustic phonons via impulsive stimulated Raman scatter-
ing [21] and, only recently, to access the dynamics of hypersonic acoustic
pulses confined into an acoustic nanocavities [22].
Parallel efforts have been devoted to the use of ultrafast light pulses
to excite acoustic eigenmodes of confined nanostructures, after the first

sec. 2.2 Sub-nanosecond thermal transport 9
study of the vibrational modes of gold nanostripes on a fused quartz sub-
strate [23]. Recently, advances in the preparation of quasi-monodispersed
nanostructures enabled, employing picosecond ultrasonic techniques, to
investigate photo-induced coherent oscillations in metallic nanoparti-
cles [24, 25], nanocolums [26] and nanoprisms [27, 28, 29, 30], achieving
optical control of the acoustic vibrations [31]. More recently, the feasi-
bility of pump-probe measurements on single metallic nanoparticles [30],
exploiting the surface plasmon resonance, opened the way to investigate
the mechanical properties of single nanostructures, whose shape and in-
teraction with the environment can be exactly determined by means of
electron microscopy techniques [32].
2.2 Sub-nanosecond thermal transport
Notably, the same pump probe technique can be applied to study heat
transport in matter [33]. The pump-induced ∆T triggers a heat flow on
the sub-ns timescale. The dependence of the refractive index on the tem-
perature enables following the propagation of heat pulses by means of
the probe pulse. This technique, named time-domain thermoreflectance,
has been employed to investigate the thermal conductance at metal-
metal [34] and metal-dielectric [33, 35] interfaces and to disentangle the
energy transport related to electron diffusion [34], anharmonic phonon
decay [35] and ballistic phonon transport [36]. Recently, the signature
of ballistic heat transport [37], at cryogenic temperatures, has been re-
ported for a GaAs crystal covered by a metallic thin film transducer [38].
The extension of this technique to the study of thermal transport be-
10 State of the art chap. 2
tween a single metallic nanoparticle and the environment is a more dif-
ficult task, due to the difficulties in controlling the properties of the
nanoparticle-environment interface [39].
The frontier in this intriguing research field is the investigation of
the thermo-mechanical transients in lattices of metallic nanostructures
on surfaces [1, 23, 40, 41, 42]. State of the art nanolithography and
patterning techniques allow obtaining metallic nanostructures, whose
shapes, dimensions, periodicities and interface properties can be care-
fully tuned. The interest in these systems is inherent to the following
features: i) the periodicity, scalable down to ∼ 50 nm [43], that can
be exploited to launch quasi-monochromatic SAWs in the substrate at
∼ 100 GHz [44]; ii) the periodicity of the elastic properties, that induces
the opening of a band gap in the acoustic modes (hypersonic phononic
crystals) [45]; iii) the fine control over the nanostructures-substrate in-
terface, mandatory to study heat transport at the nanoscale.

Chapter 3
Pseudosurface acoustic
waves in hypersonic
surface phononic
crystals
We present a theoretical framework allowing to properly address the na-
ture of surfacelike eigenmodes in a hypersonic surface phononic crystal,
a composite structure made of periodic metal stripes of nanometer size
and periodicity of 1 µm, deposited over a semi-infinite silicon substrate.
An overall comprehension of this physics is still missing, due to the fact
that there is no distinction between the eigenmodes of the surface-based
11
12 Pseudosurface acoustic waves in hyper. . . chap. 3
nanostructures and the surface acoustic modes of the semi-infinite sub-
strate, the solution of the elastic equation being a pseudosurface acous-
tic wave partially localized on the nanostructures and radiating energy
into the bulk. This problem is particularly severe in the hypersonic
frequency-range, where semi-infinite substrate’s surface acoustic modes
strongly couple to the periodic overlayer, thus preventing any perturba-
tive approach. The problem is solved by introducing a surface-likeness
coefficient as a tool allowing to identify pseudosurface acoustic waves and
to calculate their line shapes. Having accessed the pseudosurface modes
of the composite structure, the same theoretical frame allows reporting
on the gap opening in the now well-defined pseudo-SAW frequency spec-
trum. We show how the filling fraction, mass loading, and geometric
factors affect both the frequency gap, and how the mechanical energy is
scattered out of the surface waveguiding modes.

sec. 3.1 Introduction 13
3.1 Introduction
The idea of creating solids with artificial modulation in their physical
parameters [46] has proved fruitful both in the frame of coherent elec-
tronic transport and photonics [47, 48] with the advent of semiconductor
superlattices and photonic crystals [49, 50, 51], respectively. The anal-
ogy between photons and phonons suggested considering phononic crys-
tals [52], periodic elastic composites of two or more vibrating materials,
the interest being triggered by the possibility of achieving a frequency
gap in the elastic modes dispersion relations and the wealth of applica-
tions stemming from tailoring the gap itself.
Extensive investigation of acoustic band structures of periodic elas-
tic composite has been carried out on two-dimensional (2D) phononic
crystals both infinite [52] and surface terminated [53, 54]. The archety-
pal 2D structure consists of parallel rods embedded in an elastic back-
ground. Rods can be actual or virtual ones (drilled holes). In the real
case of a surface-terminated phononic crystal, an interesting class of
acoustic modes, addressed as surface acoustic waves (SAWs) (arising
from breaking of the translational symmetry when passing from an infi-
nite to a semi-infinite medium) propagate confined to the elastic medium
surface, the penetration depth being on the order of their spatial pe-
riod. Recent works elucidated some of the characteristics of surface
acoustic waves in 2D phononic crystals of different geometrical configu-
rations [55, 56, 57, 58].
The present Chapter focuses on pseudosurface acoustic modes, rem-
iniscent of surface acoustic waves, in surface-based phononic crystals.
These structures are obtained patterning the surface of a substrate ma-
terial either by metal deposition or substrate etching. The influence

14 Pseudosurface acoustic waves in hyper. . . chap. 3
of a periodically structured overlayer on the acoustic-field eigenmodes
of a thick or thin homogeneous slab has been studied by many research
groups and effects such as band folding [59, 60], mode leakage [61], open-
ing of frequency gaps [19, 59, 60, 61, 62, 63], and interaction between slab
and overlayer modes [63, 64, 65] have been discussed. Contrary to 2D
phononic crystals, for surface acoustic modes in surface-based phononic
crystals there is no distinction between the eigenmodes of the nanos-
tructures and SAWs, the solution of the elastic equation being a pseu-
dosurface acoustic wave partially localized on the nanostructures and
radiating energy into the bulk. This issue is particularly severe in the
hypersonic frequency range, where the semi-infinite substrate’s surface
acoustic modes strongly couple to the periodic overlayer, thus prevent-
ing any perturbative approach. In this physical scenario, we present a
theoretical framework allowing to properly address the nature of sur-
facelike eigenmodes in a hypersonic surface phononic crystal. We solve
the problem introducing a surface-likeness coefficient as a tool allowing
to find pseudosurface acoustic waves and to calculate their line shapes.
Having accessed the pseudosurface modes of the composite structure, the
same theoretical frame allows reporting on the gap opening in the now
well-defined pseudo-SAW frequency spectrum. We show how the filling
fraction, mass loading, and geometric factors affect both the frequency
gap, and how the mechanical energy is scattered out of the surface waveg-
uiding modes.
These results are of interest also from an applicative stand point. The
quest for hypersonic acoustic waveguides [66], sources of ultrafast coher-
ent acoustic waves and nano-optoacoustic transducers in general, oper-
ating at ever higher frequencies, requires patterning periodic structures
of ever decreasing periodicities. In this frame, surface-based phononic

sec. 3.2 Introduction 15
crystals provide a technological advantage over 2D phononic ones, the
processing technique involving the surface only, being easily scalable be-
low 100 nm and suitable for high-frequency transducers technology. The
theoretical tool here presented, together with the comprehension of how
the construction parameters affect the frequency gap and surface waveg-
uiding mode, will be a valuable tool for inspecting the pseudo-acoustic
modes relevant for applications in view of device engineering beyond a
trial-and-error approach.
This Chapter is organized as follows: in Section 3.2 we outline and
solve the full mechanical problem, calculating the vibrational normal
modes of the composite system. The presence of periodic nickel stripes
modifies the properties of surface waves [10, 67, 68]. The SAW is no
longer an eigenmode of the elastic eigenvalue problem. Proper assess-
ment of a pseudo-SAW in a surface-based phononic crystal is achieved
in Section 3.3. We introduce a SAW-likeness coefficient permitting to
discriminate pseudo-SAWs among the entire set of eigenmodes. Inves-
tigation of the gap opening in a surface-based phononic crystal as a
function of the filling fraction p, beyond a perturbative approach, is pre-
sented in Section 3.4. We show how the frequency gap depends on the set
of geometric factors p, h and mass loading m, ρ - m, ρ and h being
the nickel stripe’s mass, density and height, respectively. In Section 3.5
we analyze the energy distribution in the system as a function of p and
relate it to the scattering of SAWs into the bulk.

16 Pseudosurface acoustic waves in hyper. . . chap. 3
y
x
d
h
λ
Nickel stripes
Silicon substrate
Figure 3.1: Schematic diagram of the surface phononic crystal.
Isotropic nickel stripes of width d and height h are deposited on a
crystalline silicon substrate. The grating has period λ. Propagation
direction is along the x axis, surface normal to the bulk is along the
y axis.
3.2 Mechanical model
We assume the system to be an elastic continuum composed of a periodic
metallic grating deposited on a silicon substrate. In Fig. 3.1, we consider
the general configuration where elastic isotropic nickel stripes of width
d and height h = 50 nm are deposited on a crystalline silicon substrate.
The grating has period λ = 1 µm, thus ensuring pseudo-SAWs in the
hypersonic range. Calculations are performed increasing d, in order to
cover the entire filling fraction p range (0, 1), where p = d/λ, and ex-
plore different regimes, from a perturbative one (p ≪ 1) to substrate
full coverage (p = 1). The acoustic equation of motion governing the
displacement u(r, t) of the composite system is
∂j [cijmn (r) ∂num] = ρ (r) ui , (3.1)
where ρ (r) and cijmn (r) are the position-dependent mass density and
elastic stiffness tensor, respectively, and the summation convention over
repeated indices is assumed. For an harmonic time dependence eiωt+c.c.,

sec. 3.2 Mechanical model 17
Table 3.1: Material properties for Si substrate (Ref. [70]) and Ni
stripes (Ref. [71]): Young’s modulus E, Poisson’s ratio σ, and mass
density ρ.
E (GPa) σ ρ (Kg/m3)
Si substrate 131 0.27 2330
Ni stripes 219 0.31 8900
Eq. 3.1 reads
∂j [cijmn (r) ∂num] = −ρ (r) ω2ui . (3.2)
The eigenvalue problem is solved via the finite-elements method [69].
As shown in Fig. 3.2(a), the model consists of a two-dimensional silicon
rectangular cell with a nickel stripe on top. The material properties
for the silicon substrate and the nickel stripes, that enter in the expres-
sion of the elastic stiffness tensor, are reported in Table 3.1. The silicon
substrate’s crystalline orientation is accounted for in the expression of
the elastic stiffness tensor and, in the present case, the x axis is taken
along the Si(100) crystalline direction. To reproduce the entire nanos-
tructured composite from the single unit cell, the displacements u1 and
u2, calculated, respectively, on side 1 and 2 of the cell [see Fig. 3.2(a)],
are related by u1 = eiKx,nλ u2, as required by the Bloch theorem, where
Kx,n = kx +2πn/λ and kx ∈ (−π/λ, π/λ). The displacement is fixed to
zero on the base boundary and the height L of the cell is set to 100 µm,
two orders of magnitude greater than the system’s periodicity. This
condition is required to achieve a density of states fine enough to ap-
preciate the surface-confined system’s normal modes also for p ≪ 1 and

18 Pseudosurface acoustic waves in hyper. . . chap. 3
(a) (b)
(c)
(e)
1 2
1 µm
λ
B
A
C
(d)
(f)
ν u =
4.92
GH
zν u
= 4.
27 G
Hz
~~
ν u =
4.12
GH
z~
ν g =
4.60
GH
z~
ν g =
4.12
GH
z~
0
0
0
1
1
1 Total displacem
ent (arb. un.)T
otal displacement (arb. un.)
Total displacem
ent (arb. un.)
Figure 3.2: Nickel stripe on silicon substrate. (a) The top 2 µm portion
of the 2D rectangular unit cell is reported. Cell geometry: A. Ni stripe,
B. 1 µm top portion of Si substrate, C. 99-µm-thick Si bulk portion.
Bloch boundary conditions are set on sides 1 and 2 of the substrate.
The periodicity is λ = 1 µm. The height of the Si cell is 100 µm. The
Ni stripe is h = 50 nm high and, in this figure, d = 320 nm wide. In
figures (b) trough (f), the deformation and arrows correspond to the
displacement field, while the color scale refers to the normalized total
displacement. (b) Sin-like SAW solution for a pure silicon slab. The
orthogonal cos-like eigenfrequency degenerate solution is not reported.
(c) Cos-like and (d) sin-like pseudo-SAW solutions for d = 320 nm.
(e) Cos-like and (f) sin-like SAW eigenfrequency degenerate solutions
for substrate full coverage.

sec. 3.3 Pseudo-SAW 19
p ∼ 1, the eigenfrequencies spacing scaling as 1/L. Attention is devoted
in choosing the finesse of the quadratic-ordered mesh, enabling accurate
displacements calculations despite: i) the size discrepancy between the
nanostructure and the silicon cell; ii) the two orders of magnitude dif-
ference between L and λ. Unless otherwise stated, the calculations are
performed with n = 1 and kx = 0 (Kx,1 = 2π/λ), corresponding to the
first harmonic at the center of the surface Brillouin zone, calculation of
the eigenfrequencies as a function of the wave vector parallel to the sur-
face of the substrate not being the main scope of this work.
3.3 Pseudo-SAW
On the contrary to bulk modes, SAWs are confined in a thin layer start-
ing at the surface of the substrate. As seen in Fig. 3.2(b), in the case of a
pure silicon slab, without stripes on top, the displacement field vanishes
within a depth on the order of 1 µm, i.e. of the SAW wavelength, corre-
sponding to the chosen grating period λ. The total displacement color
scale normalized over its maximum value is reported, together with the
displacement field. These modes are the elastic analogs of the electronic
surface states [72] or the electromagnetic evanescent waves encountered
at the surface of a semi-infinite solid [73]. The surface wave is an exact
solution of the eigenvalue problem, twofold degenerate under transla-
tional symmetry. The two solutions uu and ug have, respectively, sin
(ungerade) and cos (gerade) symmetry. In Fig. 3.2(b) only the sin sym-
metry solution is reported. The calculation of the twofold-degenerate
eigenfrequency at the Brillouin-zone center (n = 1) gives ν = 4.92 GHz,

20 Pseudosurface acoustic waves in hyper. . . chap. 3
in agreement with data for a SAW propagating along Si(100) [67].
On a uniform flat surface a surface wave does not radiate into the bulk
and has a penetration depth ∼ λ [10]. The presence of periodic nanos-
tructures is expected to modify the properties of the SAW, perturbing
the stress and velocity fields associated with SAW propagation [1, 23, 74].
In the periodic composite system the SAW modes are not solutions of
the eigenvalue problem. The eigenmodes of the full structure, whose dis-
placement field most closely resemble the unperturbed SAWs, are shown
in Figs. 3.2(c) and 3.2(d). The twofold degeneracy is lifted and a band
gap opens: one mode, with sin symmetry, is found at νu = 4.27 GHz,
whereas a second mode, with cos symmetry, is found at νg = 4.60 GHz.
The calculated displacement field is Rayleigh-type in region B, evident
from the alike displacement fields of sin-like solutions in region B of
Figs. 3.2(b), 3.2(d) and 3.2(f), and bulk-like in region C, clear from the
field distribution in region C of Figs. 3.2(c) and 3.2(d). We address
these modes as pseudo-SAWs. Periodic nanostructures force the previ-
ously unperturbed surface waves to radiate elastic energy into the bulk.
The analog in the electromagnetic case is diffraction of surface plasmons
into far field by a periodic metallic grating deposited on the substrate
surface. In the acoustic case, the stress at the Ni-Si interface, needed to
force the stripes to follow the motion of the surface, acts as the source of
energy radiation into the bulk, as explained by Lin et al. [23]. In terms
of scattering of unperturbed SAWs, this effect can be rationalized as the
coupling of free-surface modes to the silicon bulk modes.
The eigenmodes for the case of full substrate coverage (p = 1) are
reported in Figs. 3.2(e) and 3.2(f). The band gap closes, the degeneracy
is recovered with ν = 4.12 GHz, and the eigenvectors are SAWs, hence
no energy is radiated in the bulk. The solution is similar to that reported

sec. 3.3 Pseudo-SAW 21
in Fig. 3.2(b) for p = 0; the overlay downshifts the value of ν.
In the previous discussion, the concept of pseudo-SAW was sug-
gested on the basis of similarities between its displacement field and
that of a pure SAW. Nevertheless the theory lacks a formal definition for
a pseudo-SAW or a procedure allowing to spot out such solutions from
the infinite eigenvalues set satisfying Eq. 3.2, in the present geometry.
With this aim in mind, the SAW-likeness coefficient is defined as
α(ν).=
〈EA(ν)〉 + 〈EB(ν)〉
〈Etot(ν)〉, (3.3)
where 〈EA(ν)〉, 〈EB(ν)〉, and 〈Etot(ν)〉 are the time-averaged mechani-
cal energy contents of u (r) in region A, B, and in the entire unit cell,
respectively [see Fig. 3.2(a)]. The calculation is here performed starting
from u (r),
α (ν) =
∫A
ρ (r)u2(r)d3r +∫
Bρ (r)u2(r)d3r∫
totρ (r)u2(r)d3r
. (3.4)
The SAW-likeness coefficient α (ν) outlines which eigenmodes of the sys-
tem have mechanical energy mainly localized within a depth λ (where
λ is both the nanostructure’s period and the penetration depth of an
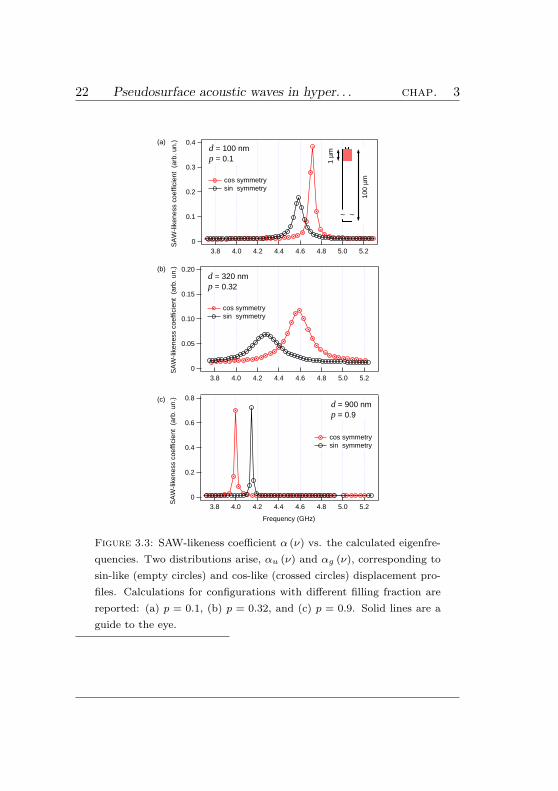
unperturbed SAW of the same wavelength). In Fig. 3.3, we report α (ν)
for three values of p. Two distributions, αg (ν) and αu (ν), emerge from
the plot, corresponding to the cos-like and sin-like displacement profiles,
respectively. We define pseudo-SAWs the eigenmodes with frequencies
νg and νu, corresponding to the two distributions’ maxima. The pseudo-
SAWs are the solutions that most likely resemble the unperturbed SAWs.
The eigenfrequency degeneracy is removed and the opening of a fre-
quency band gap is directly shown. We pinpoint that the SAW-likeness
coefficient is easily interpreted as the SAW line shape, the line shape
22 Pseudosurface acoustic waves in hyper. . . chap. 3
0.4
0.3
0.2
0.1
0SA
W-li
kene
ss c
oeffi
cien
t (a
rb. u
n.)
5.25.04.84.64.44.24.03.8
Frequency (GHz)
cos symmetry sin symmetry
d = 100 nmp = 0.1
~ ~
0.20
0.15
0.10
0.05
0SA
W-li
kene
ss c
oeffi
cien
t (a
rb. u
n.)
5.25.04.84.64.44.24.03.8
Frequency (GHz)
cos symmetry sin symmetry
d = 320 nmp = 0.32
0.8
0.6
0.4
0.2
0
SA
W-li
kene
ss c
oeffi
cien
t (a
rb. u
n.)
5.25.04.84.64.44.24.03.8
Frequency (GHz)
cos symmetry sin symmetry
d = 900 nmp = 0.9
100
µm
1 µm
(a)
(b)
(c)
Figure 3.3: SAW-likeness coefficient α (ν) vs. the calculated eigenfre-
quencies. Two distributions arise, αu (ν) and αg (ν), corresponding to
sin-like (empty circles) and cos-like (crossed circles) displacement pro-
files. Calculations for configurations with different filling fraction are
reported: (a) p = 0.1, (b) p = 0.32, and (c) p = 0.9. Solid lines are a
guide to the eye.

sec. 3.3 Pseudo-SAW 23
Table 3.2: Calculated pseudo-SAW frequencies, corresponding SAW-
likeness coefficients, and linewidth γ (FWHM) for both gerade and
ungerade distributions.
p 0.1 0.32 0.9
νg (GHz) 4.72 4.60 4.00
αg (νg) 0.38 0.12 0.70
γg (GHz) 0.064 0.231 0.013
νu (GHz) 4.59 4.27 4.15
αu (νu) 0.18 0.07 0.73
γu (GHz) 0.101 0.300 0.010
concept arising because, in the composite system, the SAW is not an
eigenmode. A more correct definition of SAW line shape and its relative
linewidth will be given in Section 5.4.
In Fig. 3.3(a) the calculation for a sample with p = 0.1 (d = 100 nm)
is reported. For small filling fractions, nickel stripes act as a weak
perturbation to the modes of the underlying substrate. The values of
the pseudo-SAW frequencies and the corresponding SAW-likeness coeffi-
cients, as well as the linewidth γ [full width at half maximum (FWHM)]
of the two distributions, are reported in Table 3.2. The fact that αg(νg) >
αu(νu) means that the grating affects the sin-like SAW more than the
cos-like one. Furthermore, the grating couples the unperturbed sin-like
SAW over a wider range of modes: γu > γg. The frequency gap is
∆ν = νg − νu = 0.13 GHz. Both νg and νu are lower than the unper-

24 Pseudosurface acoustic waves in hyper. . . chap. 3
turbed SAW eigenfrequency ν = 4.92 GHz.
Increasing the filling fraction to p = 0.32, we obtain the distributions
reported in Fig. 3.3(b). The physics is now well beyond the perturba-
tive approach: larger linewidths and lower values of the SAW-likeness
coefficient for the two pseudo-SAWs are the signatures of a stronger
SAW-stripes interaction, as compared to the case of p = 0.1. This leads
to a higher coupling of surface waves with the bulk modes of the system,
a confirmation to the evidence given in Figs. 3.2(c) and 3.2(d). The fre-
quency gap is ∆ν = 0.33 GHz. Both νg and νu are further downshifted
with respect to ν. The pseudo-SAW frequency lowering is strongly de-
pendent on the displacement field symmetry.
Increasing the filling fraction to p = 0.9, close to the silicon full cov-
erage [see Fig. 3.3(c)], narrow linewidths and high peaked distributions
resemble the frequency twofold-degenerate surface wave solutions shown
for p = 1 in Figs. 3.2(e) and 3.2(f), consistently with a reduced frequency
gap ∆ν = −0.15 GHz. Interestingly ∆ν changes sign and the ungerade
pseudo-SAW is now less affected by the periodicity as compared to its
gerade counterpart. For the case of p = 1, ν is in agreement with the
analytical theory developed by B. Auld [67].
To further test the soundness of the pseudo-SAW definition adopted
in the present work, we calculated for p= 0, 0.32, and 1, the dispersion
for the first harmonic pseudo-SAW modes: kx ∈ [−0.2π/λ, 0.2π/λ] and
n = 1. The outcome is shown in Fig. 3.4. The dispersion relation for
the semi-infinite silicon slab (p = 0) starts at ν = 4.92 GHz and is lin-
ear with a slope vs = 4900 m/s, in agreement with the speed of sound
reported for SAW on Si(100) [67]. For the full overlay case (p = 1), the
dispersion starts at 4.12 GHz. Both solutions are true SAW eigenmodes
of the system. For the case of p = 0.32, a gap opening is observed and

sec. 3.4 Frequency gap 25
6.0
5.5
5.0
4.5
4.0
3.5
SA
W f
requ
ency
(G
Hz)
0.200.150.100.050
kx (π/λ units)
SAW freq (Si, p = 0)pseudo-SAW freq (Ni stripes, p = 0.32)SAW freq (Ni overlay, p = 1)
Figure 3.4: Dispersion relations of the elastic surface modes for small
values of kx (in π/λ units) and n = 1, for a pure silicon slab (p = 0), for
silicon full coverage (p = 1) and for the configuration with Ni stripes
over Si substrate (p = 0.32). Solid lines are fits to data. Dotted lines
are a guide to the eye.
the two dispersion branches for the pseudo-SAWs remain correctly con-
fined between their p = 0 and p = 1 analogs.
3.4 Frequency gap
Having formally defined the pseudo-SAW, we now address the issue of
the frequency gap in the pseudo-SAW modes. In Fig. 3.5 the pseudo-
SAW frequencies and band gap calculated over the entire filling fraction

26 Pseudosurface acoustic waves in hyper. . . chap. 3
range are shown. For p 6= 0, the pure silicon slab eigenfrequency degen-
eracy is lifted. As p increases, νg decreases until it reaches a plateau
for p = 0.2. The plateau lasts for p ∈ (0.2, 0.5) then, for p > 0.5, νg
decreases monotonically till it jumps back to the SAW value for full cov-
erage as soon as the stripes’ width d reaches the size of the periodicity,
becoming a complete overlay. There is a geometrical explanation for the
discontinuity [see inset of Fig. 3.5]. For p = 1, periodic boundary condi-
tions become effective also on the stripe’s sides, the cos-like pseudo-SAW
solution ug undergoes a transition from free to constrained displacement
on the stripe’s lateral boundaries. The same constraints do not affect uu
because they are set where the nodes of the sin-like solution are found
[see Fig. 3.2(f)]. In an experiment, for the above mentioned discontinuity,
a steep positive derivative ∂νg/∂p for p → 1 should be expected in place
of an abrupt transition. Concerning νu, it is a monotonically decreasing
function of p. It decreases with a steep slope for p < 0.3. It then changes
slope stabilizing to an almost constant value all the way to p = 1. For
p < 0.75, νg > νu; at p = 0.75 the eigenvalues cross; for p > 0.75,
νg < νu; degeneracy is recovered for p = 1. In summary, the frequency
gap ∆ν opens as soon as p 6= 0. The maximum value ∆ν = 0.40 GHz
is attained when the silicon surface is close to half coverage. For higher
filling fractions, the gap decreases to ∆ν = 0 for p = 0.75. For values of p
in excess of 0.75, ∆ν < 0 and decreases till it makes an abrupt transition
back to ∆ν = 0 for p = 1.
The present results also show the limits of applicability of the per-
turbative approach [58]. Within a perturbative scheme the relative fre-
quency shift is proportional to the filling factor:
(ν(p) − ν(0))
ν(0)∝ (
h
λ)p . (3.5)

sec. 3.4 Frequency gap 27
6.0
5.5
5.0
4.5
4.0
pseu
do-S
AW
fre
quen
cy (
GH
z)
1.00.80.60.40.20.0
Filling fraction p
0.8
0.6
0.4
0.2
0.0
-0.2
-0.4
Frequency gap (G
Hz)
10008006004002000
Stripes width d (nm)
pseudo-SAW eigenmodes cos symmetry sin symmetry frequency gap
4.4
4.2
4.0
p-S
AW
fre
q (G
Hz)
1.000.950.900.85Filling fraction p
-0.4
-0.2
0.0
Freq gap (G
Hz)
Figure 3.5: Left axis: pseudo-SAW eigenfrequencies νg (crossed cir-
cles) and νu (empty circles) versus surface filling fraction p (or stripes
width d in nm, top axis). Right axis: pseudo-SAW frequency gap
∆ν (triangles). The horizontal line is the ∆ν = 0 line and refers to
right axis only. Inset: magnification of the graph for high filling frac-
tions p is shown. Lines are a guide to the eye only.
Calculation of the relative frequency shift, on the basis of the results
reported in Fig. 3.5, shows that linearity holds up to p ∼ 0.1. For values
of p in excess of 0.1 one has to rely on the full calculations here reported.
In the general case, for a fixed periodicity λ, the pseudo-SAW fre-
quencies (both gerade and ungerade) are functions of the parameters

28 Pseudosurface acoustic waves in hyper. . . chap. 3
p, h, m, ρ: ν = f (p, h, m, ρ). The four parameters are not mutually
independent, being ρ ∝ m/(hp). ν is then defined in a four-dimensional
space and it is a function of three parameters only, the fourth being fixed
by the choice of the other three. For instance, each data point reported
in Fig. 3.5 (left axis) is calculated having fixed p, h, and ρ independently.
The plots are then obtained spanning p over the range (0, 1), thus explor-
ing a particular trajectory ν(p, h = 50 nm, ρNi) on the hyper-surface
ν(p, h, ρ). A full description is computationally too time consuming and
would not add much to the comprehension of the physics without slicing
the hypersurface along particular hyperplanes or trajectories.
To get a deeper physical inside, the effects on ν of the geomet-
ric factors p, h and mass loading m, ρ, are here explored. We start
considering a reference system configuration with p = 0.2, h = 50 nm,
and ρ = ρNi, hence the value of m is fixed to m(ref). The pseudo-
SAW frequencies, calculated in the reference configuration, are ν(ref)g
and ν(ref)u . To test the contribution of the stripes’ geometry, m and ρ
are kept fixed at their reference values, while p is allowed to increase
from 0.2 to 0.9. Doing so, the value h decreases. In Fig. 3.6(a) the
dependences of νi − ν(ref)i (with i = g, u) and ∆ν on the geometric
factor p, h are shown. The geometric factor upshifts both frequencies,
νu being more affected than νg and ∆ν decreasing monotonically. The
effect of the geometry in surface-based phononic crystal fits well with
the results reported by Tanaka et al. [53] for a 2D phononic crystal in
which no mass loading effect is to be expected (the band-gap definition
is reversed in sign with respect to our case). This makes us confident
that we are properly disentangling the geometry from mass loading ef-
fects. To inspect the mass loading effect, p and h are kept fixed at their
reference values while ρ is raised up to 4.5 times the Ni density. Doing
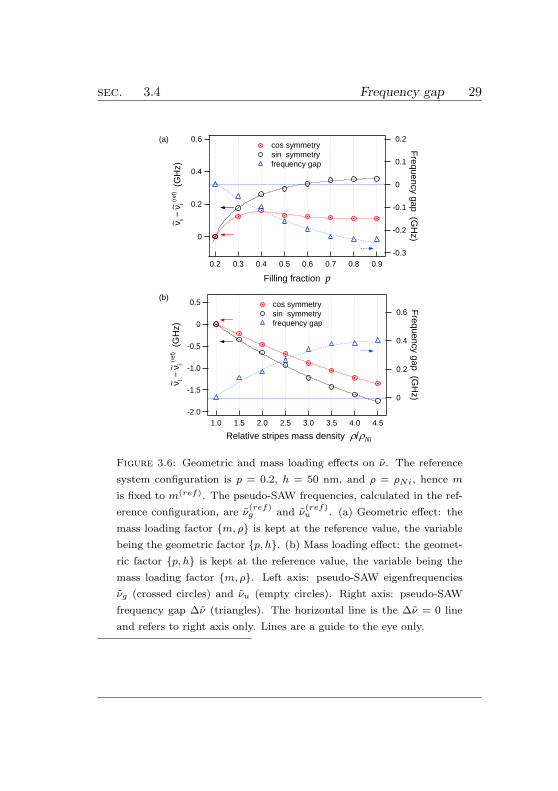
sec. 3.4 Frequency gap 29
0.6
0.4
0.2
0
ν i − ν
i (re
f) (
GH
z)
0.90.80.70.60.50.40.30.2
Filling fraction p
-0.3
-0.2
-0.1
0
0.1
0.2F
requency gap (GH
z) cos symmetry sin symmetry frequency gap
-2.0
-1.5
-1.0
-0.5
0
0.5
ν i − ν
i (re
f) (
GH
z)
4.54.03.53.02.52.01.51.0
Relative stripes mass density r/rNi
0.6
0.4
0.2
0
Frequency gap (G
Hz)
cos symmetry sin symmetry frequency gap
(a)
(b)
~~
~~
Figure 3.6: Geometric and mass loading effects on ν. The reference
system configuration is p = 0.2, h = 50 nm, and ρ = ρNi, hence m
is fixed to m(ref). The pseudo-SAW frequencies, calculated in the ref-
erence configuration, are ν(ref)g and ν
(ref)u . (a) Geometric effect: the
mass loading factor m, ρ is kept at the reference value, the variable
being the geometric factor p, h. (b) Mass loading effect: the geomet-
ric factor p, h is kept at the reference value, the variable being the
mass loading factor m, ρ. Left axis: pseudo-SAW eigenfrequencies
νg (crossed circles) and νu (empty circles). Right axis: pseudo-SAW
frequency gap ∆ν (triangles). The horizontal line is the ∆ν = 0 line
and refers to right axis only. Lines are a guide to the eye only.

30 Pseudosurface acoustic waves in hyper. . . chap. 3
so, the value of m increases. In Fig. 3.6(b) the dependences of νi − ν(ref)i
and ∆ν on the mass loading factor m, ρ are shown. The mass load-
ing downshifts both frequencies, νu being more affected than νg and ∆ν
increasing monotonically. The functions in Fig. 3.6(a) cannot be com-
pared with the ones reported in Fig. 3.6(b) nor the absolute values are of
relevance. The importance stands in the qualitative functions behavior,
showing the disentangled physical effects of geometry and mass loading
over νi and ∆ν. The present analysis shows that in a device the pseudo-
SAW frequency gap results from a combination of geometry and mass
loading factors, the two affecting the pseudo-SAW frequencies in oppo-
site ways. A trade-off between p and m has to be foreseen for tailoring
the pseudo-SAW frequencies or frequency gap in view of possible appli-
cations.
3.5 Mechanical energy radiation
In this Section, the energy distribution in the system, for both pseudo-
SAW eigenmodes ug and uu, is studied as a function of p. Energy dis-
tribution in surface-based phononic crystal can be attained from the
knowledge of the displacement or velocity and stress fields. The fields
are typically calculated via coupled-mode theory or scattering theory in
Born approximation. These are perturbative approaches. For instance,
in this latter approach the SAW solution for the half-infinite Si slab
is taken as the zero-order wave (impinging wave) used to evaluate the
scattering matrix (the interaction term being brought in by the grating)
together with final states modes (scattered waves). Such an approach
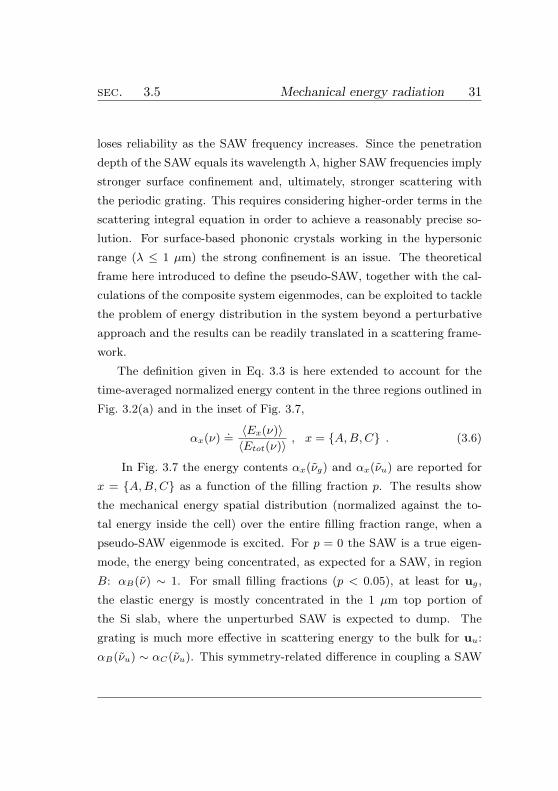
sec. 3.5 Mechanical energy radiation 31
loses reliability as the SAW frequency increases. Since the penetration
depth of the SAW equals its wavelength λ, higher SAW frequencies imply
stronger surface confinement and, ultimately, stronger scattering with
the periodic grating. This requires considering higher-order terms in the
scattering integral equation in order to achieve a reasonably precise so-
lution. For surface-based phononic crystals working in the hypersonic
range (λ ≤ 1 µm) the strong confinement is an issue. The theoretical
frame here introduced to define the pseudo-SAW, together with the cal-
culations of the composite system eigenmodes, can be exploited to tackle
the problem of energy distribution in the system beyond a perturbative
approach and the results can be readily translated in a scattering frame-
work.
The definition given in Eq. 3.3 is here extended to account for the
time-averaged normalized energy content in the three regions outlined in
Fig. 3.2(a) and in the inset of Fig. 3.7,
αx(ν).=
〈Ex(ν)〉
〈Etot(ν)〉, x = A, B, C . (3.6)
In Fig. 3.7 the energy contents αx(νg) and αx(νu) are reported for
x = A, B, C as a function of the filling fraction p. The results show
the mechanical energy spatial distribution (normalized against the to-
tal energy inside the cell) over the entire filling fraction range, when a
pseudo-SAW eigenmode is excited. For p = 0 the SAW is a true eigen-
mode, the energy being concentrated, as expected for a SAW, in region
B: αB(ν) ∼ 1. For small filling fractions (p < 0.05), at least for ug,
the elastic energy is mostly concentrated in the 1 µm top portion of
the Si slab, where the unperturbed SAW is expected to dump. The
grating is much more effective in scattering energy to the bulk for uu:
αB(νu) ∼ αC(νu). This symmetry-related difference in coupling a SAW

32 Pseudosurface acoustic waves in hyper. . . chap. 3
1.0
0.8
0.6
0.4
0.2
0.0
Mec
hani
cal e
nerg
y no
rmal
ized
1.00.80.60.40.20.0
Filling fraction p
10008006004002000
Stripes width d (nm)
ug cos symmetryuu sin symmetry
~ ~
A. stripe
B. substrate
C. bulk
Figure 3.7: Analysis of the spatial distribution of the mechanical en-
ergy in the composite system over different filling fraction configura-
tions, normalized against the total energy inside the cell. In the inset,
the circles represent the fraction of the mechanical energy confined in
the nickel stripes region A, the triangles are for the top 1 µm portion
B of Si substrate and the squares are associated with the silicon bulk
C. The dotted lines are a guide to the eye only.
to the bulk is a confirmation to the observed relationship γu ∼ 2γg of
Fig. 3.3(a). As p increases to half coverage, a greater amount of me-
chanical energy is transferred from the Si surface region B to the bulk
region C. From the eigenvalue problem perspective, a greater amount
of energy radiated into the bulk translates in energy distributed over a
wider range of eigenmodes of decreasing SAW-likeness coefficient α(ν),
γ increasing with p for both gerade and ungerade pseudo-SAWs [see

sec. 3.6 Summary 33
Fig. 3.3(b)]. The maximum values for both αC(νg) and αC(νu) are at-
tained for p = 0.4, the same filling fraction maximizing ∆ν. For p > 0.4
the trend reverses, being ∂αC(ν)/∂p < 0 whereas ∂αA,B(ν)/∂p > 0;
the relative energy content in the bulk region is transferred in region
B and A. For p ∼ 0.8 the energy content in the Ni stripe equals the
energy content in region B; the equality of energy content holds also
between sin and cos symmetry eigenmodes and pseudo-SAW frequency
crossing occurs [see Fig. 3.5]. As the Si full coverage configuration is
approached, the radiation into the bulk is further reduced in favor of a
strong mechanical energy confinement in the stripe and in the top 1 µm
portion of Si substrate, the crossing point being for p = 0.9. For p > 0.9,
the oscillation of the Ni stripe starts to energetically dominate and the
stripe behaves as a low-loss acoustic waveguide. The unperturbed SAWs,
eigenmodes of the semi-infinite slab, are now heavily scattered into the
Ni overlay. In the limit of Si full coverage (p = 1), the Ni overlay acts
as a lossless waveguide. The SAW is a true solution of the eigenvalue
problem, without coupling with bulk modes, and it is downshifted in
frequency with respect to the overlay-free SAW by ∼ 0.8 GHz.
3.6 Summary
In the present Chapter, we proposed a theoretical frame allowing to
access the physics of pseudosurface acoustic waves in surface phononic
crystals. The pursued strategy can be applied to any surface phononic
crystal, enabling investigation of pseudo-SAW line shapes, gap opening
and mechanical energy scattering beyond perturbative approaches, thus
34 Pseudosurface acoustic waves in hyper. . . chap. 3
finding application also in the hypersonic frequency range.
We applied the outlined theoretical framework to the case of a hy-
personic surface phononic crystal made of periodic nickel stripe on a
silicon substrate. We then investigated the pseudosurface acoustic wave
frequency gap over the entire filling fraction range, starting from the case
where the periodic nanostructures act as a perturbation, to finally reach
the substrate full coverage. A preliminary understanding of how the
construction parameters affect the frequency gap has been achieved. We
showed that the pseudo-SAW frequency gap results from a combination
of geometry p, h and mass loading m, ρ factors, the two affecting
the pseudo-SAW frequencies in opposite ways. A trade-off between p
and m is thus necessary for tailoring the pseudo-SAW frequencies or fre-
quency gap for the application at hand. The mechanical energy spatial
distribution of pseudo-SAW as a function of the filling fraction has been
studied, potentially allowing to tailor the device’s parameters in order
to minimize the energy content scattered out of the desired modes.

Chapter 4
Calorimetry at the
nanoscale
Over the last century, calorimetry has been the method of choice for
the investigation on thermodynamic properties of matter. Conventional
calorimetry, however, is limited to sample sizes of few tens of micrograms.
An alternative route, to overcome the downsizing limits of conventional
calorimetry, relies on all-optical time-resolved techniques. In the present
Chapter the thermal dynamics occurring in such experiments are theo-
retically investigated from 300 to 1.5 K. We report ab-initio calculations
describing the temperature dependence of the electron-phonon interac-
tions for Cu nanodisks supported on Si. The electrons and phonons
temperatures are found to decouple on the ns time scale at ∼ 10 K,
which is two orders of magnitude in excess with respect to that found for
35

36 Calorimetry at the nanoscale chap. 4
standard low-temperature transport experiments. By accounting for the
physics behind our results we suggest an alternative route for overhaul-
ing the present knowledge of the electron-phonon decoupling mechanisms
in nanoscale systems by replacing the mK temperature requirements of
conventional experiments with experiments in the time-domain.

sec. 4.1 Introduction 37
4.1 Introduction
In the last decade the advent of nanoprocessing techniques has empha-
sized the need for designing non-invasive methodologies to access the
realm of the thermal properties of nanoscale systems [75, 76]. As sam-
ples dimensions shrink a variety of new phenomena have been observed,
such as the quantum of thermal conductance [77], and new refrigeration
devices proposed [78]. From an applicative standpoint, issues related to
thermal management at the mesoscale constitutes a major technological
challenge and are of paramount importance for the electronic industry.
Over the last century calorimetry has been the method of choice for
the investigation on thermodynamic properties of matter. Conventional
calorimetry, however, is limited to sample sizes of few tens of micro-
grams. A successful improvement recently arose from micromembrane-
based nanocalorimeters [77, 79]. Such devices perform extremely well in
terms of sensitivity but their application range is limited to cryogenic
temperatures, they lack time-resolution capabilities and samples need
on-chip integration.
An alternative route relies on all-optical time-resolved techniques.
When tackling the problem of measuring the specific heat of a small
object a fast non-contact probe is the optimal choice. The speed re-
quirement is dictated by the fact that the heat exchange between the
sample and the thermal reservoir is proportional to the sample’s mass.
A contact probe of dimensions comparable to the sample’s one affects the
measurement in that one would access the specific heat of the nanosam-
ple and the probe itself. The idea underlying all-optical time-resolved
nanocalorimetry is as follows. A thin metal film or metallic nanosample
to be investigated is placed in thermal contact with a substrate serving

38 Calorimetry at the nanoscale chap. 4
as a thermal bath. An ultrafast laser pump beam serves as the power
source, delivering an energy density dUV to the nanosample. The sam-
ple’s temperature time relaxation to the substrate is measured via a
time-delayed probe beam. Several detection schemes can be exploited or
envisioned. Among them, the time-resolved Near-Infra Red Diffraction
(TR-NIRD) technique [1, 80] detects the changes in the diffracted signal
modulated by the ordered nanostructures thermal expansion.
4.2 Nanocalorimetry
Calorimetry is the method of choice for studying the heat transfer pro-
cess inside a system. By adopting a Time Relaxation technique, the heat
flux is determined from the temperature time evolution, the overall sys-
tem consisting in a sample in contact with a thermal bath. The aim of
an archetypal time-resolved calorimetry experiment is thus to measure
the thermalization time of the sample, to the thermal bath, after being
warmed up by an external heat source. The considerations made in the
present Section are independent from the specific mechanism of heating
and probing. The thermalization dynamics is described by means of a
Time Relaxation model in which it is assumed that the sample is warmed
up by an external heat source until time t0. As shown in Fig. 4.1, the
sample reaches the temperature T0 while the thermal bath temperature
Tsub remains unchanged. The thermal contact between sample and sub-
strate is described by a thermal resistance Rth, as schemed in Fig. 4.2,
and parallel channels of energy dissipation are assumed negligible. Under
these hypotheses, the temperature evolution in time follows an exponen-

sec. 4.2 Nanocalorimetry 39
0 t0
T0
T(t)
P(t)
Tsub
P0
t
t
Figure 4.1: Thermalization dynamics described by the Time Relax-
ation Model.
tial decay governed by a relaxation time τ :
∆T (t) = T (t) − Tsub = (∆T )0 e−t/τ , (4.1)
where
τ = CRth , (4.2)
being T (t) the sample temperature, Tsub the fixed thermal bath tem-
perature, Rth the thermal resistance, C = m · Cm the sample’s thermal
capacity, with m the sample’s mass and Cm the specific heat per unit of
mass. The thermal resistance is directly related to the interface thermal
resistivity ρth in terms of the equation:
Rth =ρth
A; (4.3)
ρth is a macroscopic quantity accounting for phonons dispersion mis-
match on the two sides of the interface and other eventual microscopic

40 Calorimetry at the nanoscale chap. 4
Rth
Figure 4.2: Standard calorimetry technique: (Left) Scheme of the
thermal contact between the sample (blue) and the thermal bath (red)
by means of a thermal resistance Rth. (Right) Sample holder for stan-
dard calorimetry measurements. The thermal contacts are evidenced
in yellow [81].
mechanisms limiting the heat flow between the sample and the substrate,
and A is the sample-thermal bath contact area.
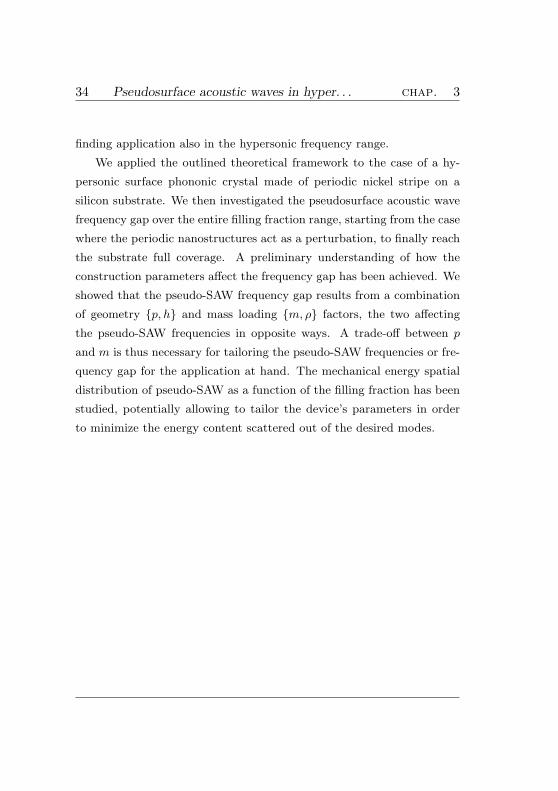
Two fundamental aspects of calorimetry measurements must be
considered. First, the thermalization time τ is proportional to the mass:
thermal equilibrium is achieved on a shorter time span by samples with
lower mass. Typically, as displayed in Fig. 4.3, samples with m ≥ 50 µg
have a relaxation time τ ranging from ms to hundreds of seconds, de-
pending on the material and the characteristics of the thermal contact
between sample and heat reservoir. Samples with mass on the order
of 10−13 − 10−15 g have τ ∼ ns. The second aspect refers to standard
techniques of temperature probing, that adopt thermocouples measuring
sec. 4.2 Nanocalorimetry 41
m > 50 µgτ ~ 0.1-100 s
m > 1 µgτ ~ 0.001-10 s
m ~ 10-15
gτ ~ 0.1-10 ns
Today
Hellmann 1993
Corbino 1910
m
τ
Figure 4.3: Examples of the thermalization time τ vs. sample mass
m proportionality.
a voltage drop proportional to the temperature variation [see Fig. 4.2].
The thermocouple probing mechanism does not perturb significantly the
system, as far as its mass is much lower compared to the sample’s. But as
the system dimensions shrink to the nanoscale, such standard calorime-
try technique results hard exploitable because when the sample mass is
easy comparable to the mass of the measurement apparatus, the thermal
capacitance will have similar contributions from the sample and the ther-
mocouple itself, influencing the system’s relaxation time and forbidding

42 Calorimetry at the nanoscale chap. 4
the measurement of the sample’s specific heat.
All-optical time-resolved calorimetry at the nanoscale is a good can-
didate to perform calorimetry on mesoscale and nanoscale samples, pro-
viding both adequate measuring speed and non-contact probe. For the
aim of this Chapter, the sample geometry consists of an array of Cu
nanodisks deposited on a Si substrate, the unit cell dimensions are re-
ported in Fig. 4.4. The nanodisks have mass of the order of 10−15 g.
The bottom of the Si substrate is kept at constant temperature Tcryo by
a cryostat, whereas insulating boundary conditions apply to the Si cell
lateral boundaries.
In a time-resolved framework, after excitation by a single Ti:sapphire
pump pulse (120 fs duration, 1 nJ per pulse, wavelength 800 nm, spa-
tial extension 40 µm at FWHM and 1 MHz repetition rate), the ther-
mal evolution problem investigated by the probe pulse is conveniently
schematized, at least at ambient temperature, in three steps. In the
first step, the laser pump pulse heats the electron gas of the metal-
lic nanodisks (sub-picosecond time scale). In the second step, the hot
electron gas thermalizes with the phonons within the disks (picosecond
time scale). Finally in the third step, the disk transfers heat δQV to
the silicon substrate thermalizing with it (nanosecond time scale). After
the pump pulse absorption, the nanodisks thermally expand in function
of the change in temperature and the metallic disk radius variation is
directly followed in the time-resolved probe reflected (or diffracted) sig-
nal R:
∆R
R∝
δa
a= α∆T , (4.4)
where a is the nanodisk radius, ∆T is the temperature variation in-
duced by the pump pulse absorption and α = 16.5 · 10−6 K−1 is the Cu

sec. 4.3 Nanocalorimetry 43
200
µm
300 nm
600
nm
h
~~
.
Top
Side
a
Figure 4.4: Side and Top views of the simulation unit cell geometry:
h = 30 nm.
linear thermal expansion coefficient at 297 K. In the present case, the
disk radius relative variation is 6.6 · 10−5, corresponding to an absolute
variation of 10−10 m. Among the advantages of the time-resolved all-
optical technique are the ability to measure relative variations of the Cu
nanodisks radius that can range up to 10−8, following α’s dependence
on temperature (5 · 10−9 K−1 at 4.2 K), and the possibility to take ad-
vantage of time resolution to access the nanostructures thermodynamics
in a time domain ranging from fs to ns (τ ∼ 1 ns).

44 Calorimetry at the nanoscale chap. 4
4.3 Simple analytic approach
An analytical description of the thermal problem is developed to evaluate
the temperature evolution in time and to access the relevant parameters
taking place during the third step of the thermal process [see Section 4.2
for thermal steps labeling]. The initial temperature of the system is as-
sumed to be Tcryo = 297 K and the specific heat of the system, together
with the thermal conductivity and interface resistance are considered,
for the time being and unless otherwise stated, temperature indepen-
dent. Further considerations are thus valid at Tcryo only, but they give
anyway an indication of the dynamics induced by a laser pulse on a
nanosystem.
The 800 nm laser pulse penetration depth in copper is ΛCu = 13 nm
and the reflectance at normal incidence is RCu = 0.93; both are derived
from copper’s optical constants at 297 K (n1 = 0.454, n2 = 4.978, from
Ref. [82]). Thus, the energy transmitted in the Cu nanodisk is absorbed
in half its volume, and the mechanism justifying an initially isothermal
nanodisk is ballistic electron transport on the sub-ps time scale [83, 84].
On the other hand, the laser penetration depth in silicon is 8 µm and,
considering Si optical constants and specific heat, the substrate’s temper-
ature increase after the pump pulse absorption is negligible compared to
the nanostructures. Under these conditions, the thermal problem can be
simply described beginning from a metallic disk at a uniform initial tem-
perature T0 in contact with a Si thermal bath at constant temperature
Tcryo. For simplicity, the problem is solved for a Cu film (h = 30 nm)
deposited on a Si substrate, reducing the thermal evolution to a 1D calcu-
lation in the spatial coordinate z and temporal t, as reported in Fig. 4.5.
A time t = 0 the pump pulse raises the film temperature to T0.

sec. 4.3 Simple analytic approach 45
Cu
Si
z
0 a
h
Figure 4.5: Geometry of the Cu film deposited on a Si substrate,
adopted in the analytical solution of the 1D thermal evolution problem.
Regarding the boundary conditions, the film’s top surface (z = 0) is
thermally insulated while there is a heat flux at z = h regulated by the
interface resistivity ρth. The problem is formulated beginning from the
diffusion equation [85]:
∂2T (z, t)
∂z2=
ρ Cs
k
∂T (z, t)
∂tfor 0 < z < h and t > 0 , (4.5)
with Cs as the specific heat per unit volume, ρ the film density and k
the thermal conductivity.
k∂T (z, t)
∂z= 0 for z = 0 and t > 0 (4.6)
k∂T (z, t)
∂z+
1
ρth(T (z, t) − Tcryo) = 0 for z = h and t > 0
T = T0 for 0 ≤ z ≤ h and t = 0

46 Calorimetry at the nanoscale chap. 4
3
2
1
0
-1
F(ξ
) , G
(ξ)
876543210
ξ
F(ξ) = Bi/ξ Bi=0.1 Bi=0.5 Bi=1 Bi=5
G(ξ) = tan(ξ)
Figure 4.6: Graphic solution of Eq. 4.8, for different values of the Biot
number.
The thermodynamics depends on ∆T = T −Tcryo and, setting Tcryo = 0,
the solution to the problem is found separating the variables:
T (z, t) = T0
∞∑
m=1
e−
κ
h2ξ2
mt 2Bi
(ξ2m + Bi2) + Bi
cos(
ξm
hz)
cos (ξm), (4.7)
where Bi = hkρth
is the Biot number, κ = kρCs
is the thermal diffusivity
of the material and ξm are roots of the equation:
ξmtan (ξm) = Bi . (4.8)
The nanodisk temperature dynamics is readily accessible provided the
Biot number Bi ≪ 1, meaning that the disk remains isothermal during
the thermal relaxation process to the substrate. The roots ξm depend

sec. 4.3 Simple analytic approach 47
on Bi, and as seen in Fig. 4.6, they are found from the intersection of
G(ξ) = tan(ξ) and F (ξ) = Bi/ξ, where
Bi → 0 ⇒
ξ1 → 0
ξm → (m − 1) π m ≥ 2. (4.9)
Eq. 4.7 shows the temperature dependence from a series of exponentials,
and writing their decaying time as
τm =h2
κξ2m
, (4.10)
we obtain, for Bi → 0,
τm
τ1=
ξ21
ξ2m
→0
((m − 1) π)2= 0 . (4.11)
Under this condition, terms with m ≥ 2 decay more rapidly with respect
to the m = 1 term and are negligible, and the temperature space profile
addressed in Eq. 4.7 approximates to
T (z, t) = T0 e−
κ
h2ξ2
1t 2Bi
(ξ21 + Bi2) + Bi
cos(
ξ1h
z)
cos (ξ1), (4.12)
with
ξ1tan (ξ1) ∼= ξ21 = Bi . (4.13)
Managing Eq. 4.12, under the condition Bi ≪ 1 one obtains
∆T
T=
T (0, t) − T (h, t)
T (0, t)= 1− cos (ξ1) ∼= 1−
(1 −
ξ21
2+ O
(ξ41
))∼=
Bi
2.
(4.14)
As shown, Bi ≪ 1 means a negligible thermal gradient between the top
and bottom surfaces of the metallic film (z axis), i.e. the nanostructures
remain spatially isothermal throughout the thermal relaxation process
to the substrate. On the contrary, a thermal gradient would carry a

48 Calorimetry at the nanoscale chap. 4
space dependence of the specific heat, hence the impossibility of defining
thermal properties of the nanosample as a whole.
Another point of view can be adopted to clarify the the physical
meaning of the Biot number, to this end is useful to compare the thermal
conductivity k, as the quantity indicating how effective heat diffusion
is within the sample’s material, to the interface thermal conductivity
kint = h/ρth, a parameter characterizing the effect of the interface and
sample’s size on the heat transfer process. The Biot number is then cast
as:
Bi =kint
k. (4.15)
Bi ≪ 1 implies that heat conduction inside the sample occurs on a faster
time scale when compared to heat dissipation trough the interface with
the thermal bath, giving a negligible temperature gradient inside the
sample and justifying its state as isothermal during the relaxation pro-
cess towards the substrate. This condition is satisfied for the h = 30 nm
Cu film on silicon: with kCu = 381 W/mK, ρth = 10−8 m2K/W, the
Biot number is Bi = 7.87 · 10−3 and estimating the thermal relaxation
time we obtain τ1 = ρCshρth ∼ 1 ns.
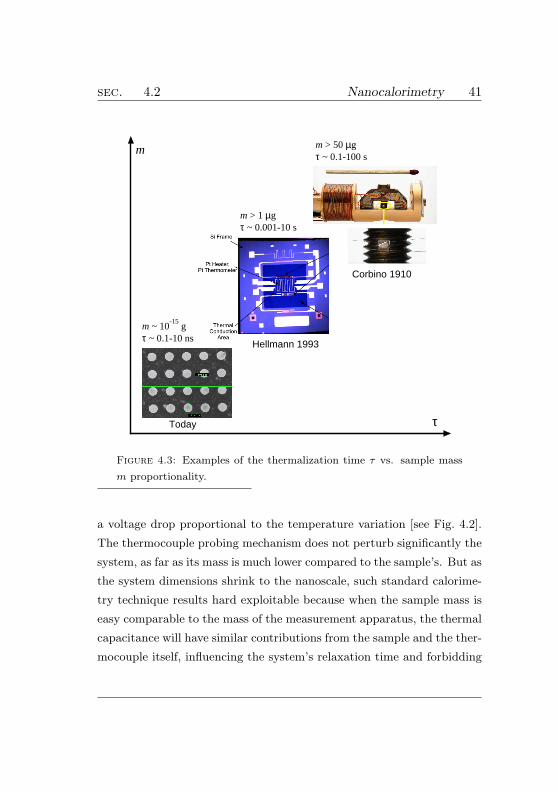
4.4 Full thermodynamical model
The physics entailed in the first two steps of the thermal evolution prob-
lem, described in Section 4.2, is well modeled by the Two Temperature

sec. 4.4 Full thermodynamical model 49
Model (2TM) [5]:
Cel(Tel)∂tTel = Pp(t) − Γ(Tel, Tph) + ~∇ · (kel(Tel)~∇Tel)
(4.16)
Cph(Tph)∂tTph = Γ(Tel, Tph) + ~∇ · (kph(Tph)~∇Tph)
k and C indicate the temperature thermal diffusion coefficient and spe-
cific heat per unit volume, respectively, while the reference to the elec-
trons (el) or Cu phonons (ph) is indicated by the subscript. Γ is the
electron-phonon coupling constant and Pp is the profile of the pulsed
power per unit volume absorbed by the sample.
The volumetric energy density absorbed by the sample is peaked
within the nanodisk, because of the difference in the optical penetration
depth between Cu and Si. This occurrence gives rise to the onset of
an heat flux from the nanodisk to the substrate, taking place on the
nanosecond time scale (third step). The thermal link translates in the
following boundary conditions at the disk-substrate interface:
nph · kph~∇Tph + (Tph − TSi)/ρth(Tph) = 0
(4.17)
−nSi · kSi~∇TpSi − (Tph − TSi)/ρth(Tph) = 0
nph and nSi being the outward unit vector normal to the disk and Si
boundary, respectively. As a thermodynamical parameter accounting
for microscopic processes such as phonon dispersion mismatch between
Cu and Si, the thermal boundary resistivity ρth actually depends on
the temperatures at both sides of the interface via the phonons Bose-
Einstein distributions [86, 87]. This dependence is seldom considered,
the two temperatures being almost the same, in most applications. In

50 Calorimetry at the nanoscale chap. 4
the present work, and on certain time scales, it occurs that Tph exceeds
TSi by several tens of degrees Kelvin. For this reason, following the idea
underlaying the formal treatment of the thermal boundary resistivity, the
temperature dependence is taken upon the hotter carrier temperature.
The temperature within the Si substrate is calculated via the Fourier
heat transfer equation.
This three-step sequence repeats itself upon arrival of a new laser
pulse, once every 1 µs [88]. The steady-state temperature distribution,
due to the pulses train, is modeled following Ref. [1]. This distribution
serves as the initial boundary condition for the thermal dynamics follow-
ing the arrival of a single pulse and is rather constant within the first
few microns region beneath the Si-nanodisk interface. In the following
the temperature in this region will be addressed as TSi, the temperature
calculated in a point positioned 5 nm beneath the disk-Si interface [see
Fig. 4.4]. The temperature-dependent specific heats and thermal con-
ductivities entering the equations have been taken from data available
in the literature [89].
A fundamental issue is the temperature dependence of the electron-
phonon coupling which, in the high temperature limit, reads Γ = G(Tel−
Tph). This approximation fails when the thermal dynamics spans the
entire temperature range from hundreds of degrees K to liquid Helium
temperature. For instance, with Tcryo set at 4.2 K, Tel rises to ∼ 100 K
within the pump pulse time width, relaxing back to ∼ 4.2 K on the ns
time scale. In order to properly account for the temperature dependence
over such a wide temperature range, the electron-phonon coupling is cast
as Γ = [I(Tel) − I(Tph)]/V where
I(T ) = 2πNcNEF
∫∞
0
dωα2F (ω)(~ω)2nBE(ω, T ) , (4.18)
sec. 4.4 Full thermodynamical model 51
104
106
108
1010
1012
1014
1016
1018
1020
I / V
(W
m-3
)
0.1 1 10 100Temperature (K)
0.15
0.10
0.05
0
α2F
86420Frequency (THz)
(a)
(b)
Figure 4.7: (a) Interaction term I(T )/V in log-log scale obtained from
numerical integration of Eq. 4.18. (b) Eliashberg function α2F obtained
from ab-initio Density Functional-based calculations.
with Nc the number of cells in the sample, NEFthe electronic DOS
at the Fermi level, nBE the Bose-Einstein distribution and α2F the
Eliashberg function [90], here calculated ab-initio within the frame of
Density-Functional Theory [91]. Simulations results are reliable down
to 0.6 THz, the electron-phonon interaction calculation failing for longer

52 Calorimetry at the nanoscale chap. 4
phonon wavelengths. For lower frequencies α2F = λω2/ω2D [90, 92], ωD
being the Debye frequency and λ a fitting parameter. The value λ has
been set as to have I(T ) matching the experimental data reported at
sub-K temperatures [78]. The coefficient G occurring in the expression
for the high temperature electron-phonon interaction, obtained from the
linear fit of I(T )/V for T ≥ ΘD, with ΘD the Debye temperature, is
8.43 · 1016 W/(m3K), in good agreement with experimental values re-
ported in the literature [93, 94]. Results for both I(T )/V and α2F are
shown respectively in Figs. 4.7(a) and 4.7(b). Attention is drawn on the
nine orders of magnitude change of the interaction term in the temper-
ature range of interest for this work, i.e. from ambient temperature to
1.5 K.
The thermal boundary resistivity is well modeled by the Acoustic
Mismatch Model (AMM): ρth(T ) = AbdT−3 for T ≤ T = 30 K with
Abd = 1.4 · 10−3 K4m2W−1 specific for a Cu-Si interface [95]. For higher
temperatures, ρth is taken at the constant value AbdT−3, that is within
the range of values reported for ambient temperature. Nevertheless, to
dissipate all doubts regarding the dependence of our findings on the de-
tailed value of T , calculations have been performed with values of T
spanning the range 20-50 K without affecting the physics.

sec. 4.5 Results and discussion 53
4.5 Results and discussion
The focus of the present Chapter is on the relaxation dynamics relevant
for nanocalorimetry, therefore only the time scale from 100 ps to 10 ns
will be discussed. Simulations results at ambient and liquid Nitrogen
temperatures are reported in Fig. 4.8. In both cases the temperature
within the nanodisk is well defined (Tel=Tph) and remains homogeneous
throughout its volume, thus assuring thermodynamical equilibrium be-
tween electrons and phonons and the technique’s applicability to inves-
tigate the nanodisk thermal dynamics.
At Tcryo=297.5 K the Si substrate acts as a thermal reservoir at
constant temperature, while the disk temperature time dependence is
fitted by a single decaying exponential with time constant τ1 = 1.1 ns
[Fig. 4.8(a)]. The maximum relative change of the nanodisk specific heat,
∆Cph/Cph=1.14·10−3, allows disregarding its temperature dependence.
These results suggest modeling the problem as an isothermal film, with
initial temperature 301 K, thermally linked with a reservoir at TSi=298 K
[see Section 4.3]. A value of the Biot number Bi = h/kphρth ∼ 10−3
guarantees the disk remains isothermal throughout the thermal relax-
ation process. Under these circumstances the analytic solution for the
disk temperature follows a single exponential decay [as in Section 4.3 and
Ref. [85]], with time constant τ = 1 ns, in agreement with the fit to the
numerical simulation, and the nanodisk specific heat is readily accessible
as τ/hρth.
At Tcryo = 77 K, the nanodisk temperature dynamics is well fitted by
a double exponential with decay times τ1 = 0.617 ns and τ2 = 6.286 ns,
respectively [Fig. 4.8(b)]. On the contrary to the previous case, TSi is not
constant, due to the diminishing of CSi with temperature. The physics
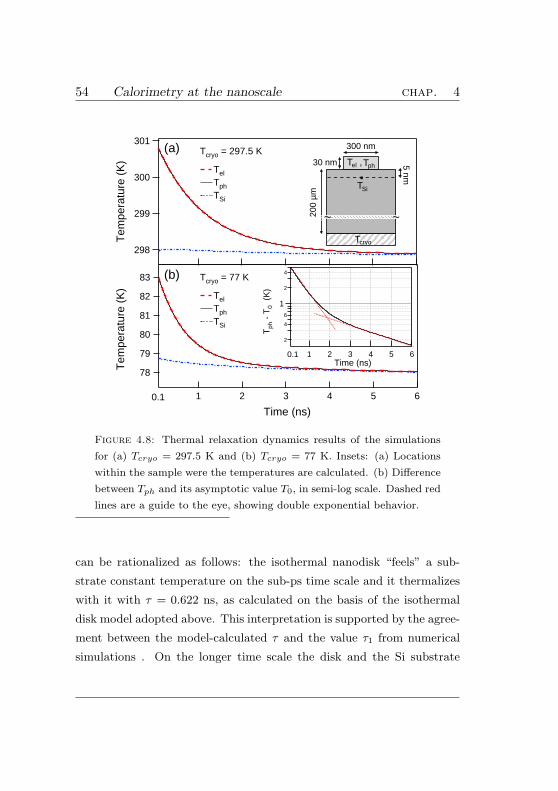
54 Calorimetry at the nanoscale chap. 4
83
82
81
80
79
78
654321
Time (ns)
301
300
299
298
Tem
pera
ture
(K
)T
empe
ratu
re (
K)
2
4
6
1
2
4T
ph -
T0
(K
)
654321Time (ns)
Tcryo = 297.5 K
Tel
Tph
TSi
Tcryo = 77 K
Tel
Tph
TSi
(a)
(b)
0.1
0.1
200
µm
300 nm
30 nm
~~
.TSi
TphTel 5 nm
Tcryo
,
Figure 4.8: Thermal relaxation dynamics results of the simulations
for (a) Tcryo = 297.5 K and (b) Tcryo = 77 K. Insets: (a) Locations
within the sample were the temperatures are calculated. (b) Difference
between Tph and its asymptotic value T0, in semi-log scale. Dashed red
lines are a guide to the eye, showing double exponential behavior.
can be rationalized as follows: the isothermal nanodisk “feels” a sub-
strate constant temperature on the sub-ps time scale and it thermalizes
with it with τ = 0.622 ns, as calculated on the basis of the isothermal
disk model adopted above. This interpretation is supported by the agree-
ment between the model-calculated τ and the value τ1 from numerical
simulations . On the longer time scale the disk and the Si substrate

sec. 4.5 Results and discussion 55
portion in close proximity to the disk-Si interface jointly thermalize with
the rest of the Si substrate.
The physics changes drastically for Tcryo in the range of liquid He
temperatures. Simulations results for Tcryo = 1.5 K are reported in
Fig. 4.9. Tel and Tph decouple at 13 K, 1 ns after the pump pulse arrival,
with a maximum relative temperature variation of 22%, for a time delay
of 2.2 ns. A similar result, with relative temperature variation of 6%,
is found for Tcryo = 4.2 K. From transport measurements in mesoscopic
structures the electron-phonon temperature decoupling occurs at sub-K
temperatures [78, 96], whereas for the present system our model foresees
the decoupling at temperatures about two orders of magnitude higher.
Interestingly here is to point out that the electron-phonon decoupling
predicted in the present work, cannot be observed by transport mea-
surements because of the lack of time resolution, thus rising a strong
demand for ultrafast time-resolved nanocalorimetry.
The physics entailed in the calculations is conveniently unfolded
as follows. The substrate temperature beneath the nanodisk reaches its
asymptotic value of 2.2 K for a time delay of 1 ns. The system thermal
dynamics is then well described in a Two Dimensional (2D) phase space
of coordinates (Tph, Tel) by the following set of equations,
∂tTel = −Γ(Tel, Tph)/Cel(Tel)
(4.19)
∂tTph = −Ω(Tph)/Cph(Tph) + Γ(Tel, Tph)/Cph(Tph)
where the thermal flux per unit volume to the Si slab is taken into account
by Ω(Tph)=(Tph − 2.2K)/hρth(Tph). The thermal conductivities within
the disk have been omitted, the simulation results showing that the tem-
perature distribution within the disk is spatially uniform over the ns time

56 Calorimetry at the nanoscale chap. 4
20
15
10
5
0
(Tel - T
ph ) / Tph (%
)
108642Time (ns)
16
14
12
10
8
6
4
2
Tem
pera
ture
(K
)
Tcryo = 1.5 K
(Tel - Tph) / Tph
Tel
Tph
Tph (K)
Tel
(K
)
Γ (W
m-3 x 10
14 )
2
13
2 13-3.2
3.2
0.8
Figure 4.9: Thermal relaxation dynamics results of the simulation for
Tcryo = 1.5 K. Left axis: Tph and Tel. Right axis: relative temperature
variation in percentage. Inset: nanodisk trajectory in phase space for
T < 13 K (arrows) and Tel=Tph reference line (dashed) superimposed
on the interaction landscape Γ.
scale, for both electrons and phonons temperatures. Eq. 4.19 represent
the velocity component in the 2D phase space, the initial conditions be-
ing the temperatures (Tph, Tel) reached for a 1 ns delay. The nanodisk
trajectory in phase space is tangent to the velocity field, (∂tTph, ∂tTel).
The trajectory is the line Tph = Tel for time delays spanning the ps to
1 ns range, the velocity vector pointing along this direction. At 13 K,
∂tTph > ∂tTel and the trajectory changes accordingly, hence Tph < Tel.
The velocity field is ruled by the interplay among Ω, the specific heats
and Γ. The Γ interaction term is large enough in the whereabouts of
Tph = Tel to keep Tph and Tel anchored down to 13 K, not so between
13 K and 2.2 K. The trajectory in phase space for T < 13 K is reported,

sec. 4.5 Results and discussion 57
superposed on the landscape Γ, in the inset of Fig. 4.9.
When compared with the results obtained for Cu nanodisks, the val-
ues for Ω, Γ and the specific heats for several metals in the temperature
range were the decoupling is here shown to take place, suggest the present
finding should occur in a wider range of materials other than Cu. To
this aim an approximate analytic approach is here proposed, also serving
as a valuable tool to further highlight the physical quantities ruling the
electron-phonon temperature decoupling. In the low temperature limit,
T ≪ ΘD, well satisfied in the temperature range were the decoupling
occurs, the interaction term approximates to I(T ) = (Σ0/V ) T 5, Σ0/V
being the sub-K electron-phonon coupling constant [78]. The Debye
model for Cph applies, and Eq. 4.19 reads
∂tTel = −C1
(Σ0
V
)1
NEF
(T 5
el − T 5ph
Tel
)(4.20)
∂tTph = −C2Θ3
D
nAbd(Tph − TSi) + C3
(Σ0
V
)Θ3
D
n
(T 5
el − T 5ph
T 3ph
)
(4.21)
with C1, C2 and C3 positive material-independent constants, and n the
number of ions per unit volume of the chosen metal. In the case of a
Cu nanodisk, ∂tTph < 0 at all times, thus ∂tTph is ruled by the power
density delivered from the nanodisk’s phonons to the substrate rather
than the power density input from the electron to the phonon gas, hence
the first term of the sum in Eq. 4.21 dominates over the second term.
Let’s now consider Al nanodisks instead and compare it to the Cu
nanodisks case. With reference to Eq. 4.21, the following ratios are

58 Calorimetry at the nanoscale chap. 4
calculated,
(∂tTel)Al / (∂tTel)Cu ∼ 0.05
(Θ3
D
nAbd
)
Al
/
(Θ3
D
nAbd
)
Cu
∼ 2.37 (4.22)
(Σ0
V
Θ3D
n
)
Al
/
(Σ0
V
Θ3D
n
)
Cu
∼ 0.2
The first ratio signifies that Tel remains rather constant in the Al nan-
odisk as compared to the Cu case, whereas the last two ratios imply that
the main contribution to ∂tTph, also for the Al case, is the power density
flow from the phonon gas to the Si substrate and that Tph relaxes to the
substrate temperature two times faster than in the case of Cu nanodisks.
The electron-phonon temperature decoupling is therefore expected to be
more drastic in Al nanodisks as compared to the Cu case, the main role
being played by ΘD and the material-dependent constants entering Σ0.
In this sense, also the case of Au nanodisks should be interesting,
since it has a weaker electron-phonon coupling, and for experiments it is
not subject to oxidation.
4.6 Summary
In conclusion, by modeling ab-initio the thermal dynamics induced by
ultrashort laser pulses in nanoscale systems we show that the break-down
of thermodynamical equilibrium between electrons and phonons on the

sec. 4.6 Summary 59
ns time scale takes place at ∼ 10 K. This temperature is two order of mag-
nitudes higher than that observed in standard transport measurements.
These findings set the limits of applicability of ultrafast nanocalorimetry
well above liquid He temperature, the electron-phonon temperature de-
coupling preventing a proper definition of the temperature concept of the
nanosample as a whole. Finally, the present work, while making available
a proper tool for interpreting all-optical time-resolved nanocalorimetry
experiments, suggests a new route for investigating the physics of the
electron-phonon decoupling where the sub-Kelvin temperature require-
ment is substituted by the ns time resolution. If confirmed by the ex-
periments, this discovery will bridge the fields of ultrafast optics and
cryogenic transport in mesoscopic systems, while setting the investiga-
tion of the thermodynamics at the nanoscale into a new perspective.


Chapter 5
Thermomechanics of
hypersonic surface
phononic crystals
We present a theoretical framework allowing to properly investigate the
ultrafast optical generation of pseudosurface acoustic waves in a hyper-
sonic surface phononic crystal. Exploiting finite-elements analysis and
putting at work the models developed in the previous Chapters, we fol-
low step by step in the time domain the initial impulsive heat-driven
displacement launching pseudo-SAWs and evaluate their lifetime. Our
calculations are tested against time-resolved optical diffraction measure-
ments performed on the same composite systems [1].
61

62 Thermomechanics of hypersonic surface . . . chap. 5
5.1 Introduction
The use of ultrafast laser pulses (pulse duration ≤ 1 ps) to generate
and detect thermomechanical transients in matter opened the field of
picoseconds ultrasonics [2]. In recent years, following the technologi-
cal progress of transducers and sources of coherent acoustic excitations
in the gigahertz range, time-resolved reflectivity experiments performed
on gratings of metallic nanometric stripes (2D confined) on transparent
(SiO2) or semitransparent (Si) substrates, evidenced oscillations in the
hypersonic range [23, 40, 63, 74], triggering extensive studies on the ther-
momechanical properties of solid state mesoscale systems.
As described in Chapter 3, the full mechanical problem has been
addressed beyond the simple perturbative approach, and pseudo-SAW
solutions have been identified and calculated. In a realistic physical sce-
nario, there is no distinction between the eigenmodes of nanostructures
and SAWs, the solution of the elastic equation being a pseudo-SAW
partially localized on the nanostructures and radiating energy into the
bulk [45].
To gain further understanding of the detailed mechanisms behind the
optical generation of pseudosurface acoustic waves in hypersonic surface
phononic crystals, in this Chapter we combine the mechanical model ad-
dressed in Chapter 3 with the thermal expansion model introduced in
Chapter 4 to follow step by step in the time domain the initial impul-
sive heat-driven displacement launching pseudo-SAWs and to evaluate
their lifetime. For simplicity, the simulations are first performed in a
two-dimensional (2D) geometry, reproducing a surface phononic crystals
made of periodic stripes. The thermomechanical time-dependent model
is then extended to the three-dimensional (3D) case, with the aim of re-

sec. 5.2 Time-dependent model for . . . 63
producing the physics of a metallic nanodisks on silicon phononic crystal
geometry excited by a laser pulse, and to benchmark our results against
those from time-resolved infrared diffraction experiments performed by
Giannetti et al. on similar composite systems [1]. The results give cre-
dence to our theoretical framework as a unique tool to understand the
detailed thermomechanics of hypersonic surface phononic crystals.
This Chapter is organized as follows: in Section 5.2 we introduce the
time-dependent numerical model for time-resolved diffraction measure-
ments. Section 5.3 focuses on the first two steps of the thermomechanical
evolution problem, dealing with the impulsive heat-driven displacement.
In Section 5.4 we aim at quantitative evaluation of the pseudo-SAW cou-
pling to bulk modes and the lifetime of surface oscillations on the same
phononic crystal addressed in Chapter 3. The thermomechanical time-
dependent model is extended to the three-dimensional (3D) phononic
crystal in Section 5.5.
5.2 Time-dependent model for time-
resolved diffraction measurements
In this framework, the surface phononic crystal under investigation has
the same characteristics of that in Section 3.2. It is an elastic continuum
composed of a periodic metallic grating deposited on a silicon substrate,
as reported in Fig. 3.1. We consider the general 2D geometry configura-
tion where elastic isotropic nickel stripes of chosen width d = 320 nm and
height h = 50 nm are deposited on a crystalline silicon substrate. The
grating has period λ = 1 µm, ensuring pseudo-SAWs in the hypersonic

64 Thermomechanics of hypersonic surface . . . chap. 5
range. The time-dependent acoustic equation of motion governing the
displacement u(r, t) of the composite system is
∂j [cijmn (r) ∂num] = ρ (r) ui , (5.1)
where ρ (r) and cijmn (r) are the position-dependent mass density and
elastic stiffness tensor, respectively, the summation convention over re-
peated indices being assumed.
Carrying on the investigation in the time domain, we solve the time-
dependent problem via a transient finite-elements method [69]. The sim-
ulation unit cell is the one reported in Fig. 3.2(a), the model consisting
of a 2D silicon rectangular cell with a nickel stripe on top, and with the
same periodic boundary conditions described in Section 3.2. The mate-
rial properties for the silicon substrate and the nickel stripes, entering
the expression of the elastic stiffness tensor, are listed in Table 3.1. A
fine quadratic-ordered mesh is chosen for accurate displacements calcu-
lations, to account for the size discrepancy between the nanostructure
and the silicon cell.
For a clear understanding of the time-dependent acoustic dynamics,
a description of the experimental diffraction technique adopted to opti-
cally excite and detect pseudosurface acoustic waves in the GHz range is
here reported. The basic idea is to use sub-ps laser pulses in a “percus-
sion” approach (Ti:sapphire oscillator with 120 fs pulse duration, 1 nJ
per pulse, 800 nm central wavelength, 55 µm spatial extension at FWHM
and 1 MHz repetition rate), in which an intense pump pulse focused on
an area A of a solid surface impulsively delivers an energy Q within the
light penetration depth Λ, inducing a non-equilibrium local heating of
both electrons and lattice on the ps timescale. The local temperature in-
crease ∆T is coupled to a sudden lattice expansion through the thermal

sec. 5.2 Time-dependent model for . . . 65
Figure 5.1: Schematic diagram of the experimental diffraction tech-
nique implemented to generate and detect thermomechanical transients
in hypersonic surface phononic crystals (in this case, a metallic nan-
odisks on silicon phononic crystal geometry) [80].
expansion coefficient α. The photoinduced thermoelastic stress is able
to launch strain pulses η(y, t) propagating away from the excited surface
along the direction y at the longitudinal sound velocity v. The propa-
gation of strain pulses is followed by means of a second delayed probe
pulse, whose time-dependent diffraction is driven by the metallic nan-
odisks’ radius variation, as described by Eq. 4.4. A schematic diagram

66 Thermomechanics of hypersonic surface . . . chap. 5
Figure 5.2: Schematic diagram of the three timescales spanned by the
thermomechanical evolution problem.
of the technique is reported in Fig. 5.1, and described in Refs. [1, 80].
The impulsive expansion of the periodic nanostructures mechani-
cally coupled to the substrate, triggers a spatially modulated stress on
the silicon surface and launches a pseudo-SAW of wavelength λ matching
the nanostripes periodicity. As described in Section 4.3 and presented
schematically in Fig. 5.2, after excitation by a single pump pulse, the
thermomechanical evolution problem spans three timescales. In the first
step, the laser short pulse heats the electron gas of the metallic stripes
(subpicosecond timescale). In the second step, the hot electron gas ther-
malizes with the lattice (picosecond timescale). In the third step, two
occurrences take place: (a) a pseudo-SAW is launched in the system,
finally transferring mechanical energy to the Si bulk, and (b) the stripes
thermalize with the silicon substrate (sub-nanosecond and nanosecond
timescale). This three-steps sequence repeats itself upon arrival of a new
laser pulse.

sec. 5.3 Impulsive heat-driven displacement 67
1 µm
320 nm
Tel = Tph
TSi
u(r,0)
(b)313
Tem
perature (K)
305
(a) 7
0
Total displacem
ent (x10-12 m
)
Figure 5.3: (a) Calculated temperature profile at t0 = 10 ps. (b) Total
displacement profile at t0 = 10 ps.
5.3 Impulsive heat-driven displacement
Focusing on the first two steps of the thermomechanical evolution prob-
lem, we consider the laser energy density absorbed by the nanostructures
and by the substrate, and the specific heat of both Ni and Si. From the
simulation of the laser impulsive heating, we are able to follow in time
the electron Tel and phonon Tph temperatures of the metallic nanos-
tructure, and estimate that within 10 ps the electron gas has effectively
thermalized with the lattice and the temperature of the nanostripes is
increased by ∼ 8 K, with respect to the silicon substrate’s temperature
within few microns beneath the stripe-substrate interface, as observed in
Section 4.3.
The calculated temperature profile at t0 = 10 ps is reported in
Fig. 5.3(a). The impulsive temperature mismatch ∆T = Tph−TSi = 8 K
triggers the non-equilibrium expansion of the nanostripes width d, ruled
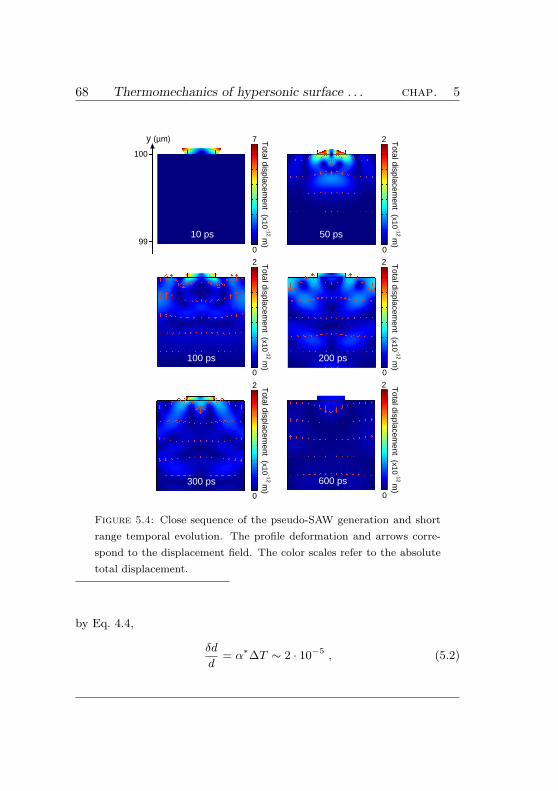
68 Thermomechanics of hypersonic surface . . . chap. 5
2
0
Total displacem
ent (x10-12 m
)
y (µm)
100
99
7
0
Total displacem
ent (x10-12 m
)
2
0
Total displacem
ent (x10-12 m
)
2
0
Total displacem
ent (x10-12 m
)
2
0
Total displacem
ent (x10-12 m
)
2
0
Total displacem
ent (x10-12 m
)
10 ps 50 ps
100 ps 200 ps
300 ps 600 ps
Figure 5.4: Close sequence of the pseudo-SAW generation and short
range temporal evolution. The profile deformation and arrows corre-
spond to the displacement field. The color scales refer to the absolute
total displacement.
by Eq. 4.4,
δd
d= α∗∆T ∼ 2 · 10−5 , (5.2)

sec. 5.3 Impulsive heat-driven displacement 69
70
0
Total displacem
ent (x10-13 m
)
y (µm)
100
99
95
7
0
Total displacem
ent (x10-13 m
)
7
0
Total displacem
ent (x10-13 m
)
7
0
Total displacem
ent (x10-13 m
)
7
0
Total displacem
ent (x10-13 m
)
7
0
Total displacem
ent (x10-13 m
)
7
0
Total displacem
ent (x10-13 m
)
7
0
Total displacem
ent (x10-13 m
)
10 ps 50 ps 100 ps 200 ps
800 ps600 ps400 ps300 ps
Figure 5.5: Landscape view of the pseudo-SAW generation and long
range temporal evolution. The profile deformation and arrows corre-
spond to the displacement field. The color scales refer to the absolute
total displacement.
α∗ being the effective thermal expansion coefficient of the Ni-Si system,
with a periodicity given by the stripes’ repeat distance. The total dis-
placement profile of the expanded nanostripe at t0 = 10 ps is presented

70 Thermomechanics of hypersonic surface . . . chap. 5
in Fig. 5.3(b).
The analysis of the initial displacement profile, and of the subsequent
mechanical time evolution, points out that the initial thermal expansion
launches pseudosurface acoustic waves. Reporting on the temporal evo-
lution of the photoinduced initial impulsive displacement, we are able to
follow step by step the pseudo-SAW dynamics and observe the propa-
gation of the displacement away from the excited surface, as shown in
Fig. 5.4. The oscillation is mainly localized on the substrate’s top sur-
face, and it has a displacement component evolving into the bulk of the
system, features suggestive of a pseudo-SAW as defined in Chapter 3 and
in Ref. [45]. Following the dynamics in the pictured sequence, in the first
two frames we observe the birth process of the pseudosurface oscillation.
In the subsequent frames and more accurately in Fig. 5.5 with a wider
landscape observation, we are able to visualize the wavefront of the elas-
tic energy radiation component propagating to the bottom of the silicon
cell.
5.4 Coupling to bulk modes and lifetime
We now aim at the quantitative evaluation of the pseudo-SAW coupling
to bulk modes and the lifetime of surface oscillations. In Chapter 3, we
have solved the acoustic eigenvalue problem [Eq. 3.2]
∇ · (c∇ui) = −ρω2ui , (5.3)
and shown the results of the calculations performed considering the real
dimensions of the samples. The analysis of the large number of calcu-
lated eigenmodes was performed in terms of the procedure introduced in

sec. 5.4 Coupling to bulk modes and lifetime 71
Section 3.3, that is exploiting the ratio between the elastic energy con-
tent within the 1 µm top portion of the unit cell and within the entire
cell, reported as a function of frequency. This quantity, named SAW-
likeness coefficient, accounts for the different surface energy content of
the calculated eigenmodes [45]. Two Lorentzian curves emerge as the
main contribution to pseudo-SAW solutions [see Fig. 3.3]. In particular,
the low-energy one is related to sin-like symmetry solutions, whereas the
high-energy one has cos-like symmetry, the energy difference between
the two modes being the phononic gap opening due to the periodicity
of the system. We have shown that the bulk mechanical energy content
of the cos-like pseudo-SAW eigenmode properly accounts for the energy
radiated into the bulk [see Fig. 3.7].
In this frame, among all the solutions of the acoustic eigenvalue
problem, the thermally triggered initial displacement u (r, t = 0), signifi-
cantly overlaps to the superposition of cos-like pseudo-SAW eigenmodes,
u (r, 0) =∑
i
Aiui (r) , (5.4)
with Ai significantly different from zero only for cos-like eigenmodes.
As qualitatively observed in Fig. 5.6, the superposition of the displace-
ment of the first two symmetric pseudo-SAWs u1H (r) (fundamental) and
u2H (r) (second harmonic), solutions of the acoustic eigenvalue problem,
well reproduces the initial system expansion u (r, 0).
With the aim of evaluating quantitatively the lifetime of the pseudo-
SAW coupled to bulk modes, we take inspiration from quantum mechan-
ics writing the general expression of the projection of the time-dependent
displacement on the set of acoustic eigenvectors ui, solutions of the

72 Thermomechanics of hypersonic surface . . . chap. 5
u(r,0)
u1H(r,0) u2H(r,0)
+
(a)
(b)
Norm
alized total displacement
0
1
7
0
Total displacem
ent (x10-12 m
)
Figure 5.6: (a) Total displacement profile of the expanded nanostripe
calculated at t0 = 10 ps. (b) Normalized total displacement of the
fundamental (Left - ν1H = 4.61 GHz) and second harmonic (Right -
ν2H = 8.56 GHz) cos-like pseudo-SAW solutions of the acoustic eigen-
value problem.
acoustic eigenvalue problem [Eq. 5.3],
|u (r, t)〉 =∑
i
〈ui|u (r, t)〉 |ui〉 . (5.5)
The time-dependent projection coefficient Wi = 〈ui|u (r, t)〉 = cieiωit
tells us to what extent the solution ui contributes to the displacement
at time t, and it is the quantity we employ to spot out which, among the
eigenmodes of the composite system, are mainly excited by the impulsive

sec. 5.4 Coupling to bulk modes and lifetime 73
thermal expansion of the nanostructures at t0 = 10 ps.
The evaluation of the projection coefficients requires a normalization
of the eigenvalues’ displacement in terms of the total energy dU ab-
sorbed by the nanostructure in the impulsive thermal expansion process.
An approximate evaluation follows from the formula dU = CV V ∆T ,
that with ∆T = 8 K accounts for the impulsive temperature mismatch
triggering the non-equilibrium expansion of the nanostripe, and where
CV = 2.2 · 106 J/(m3K) is the specific heat per unit volume. Taking
the length of the nanostripe (entering the volume V expression) equal
to the laser spot diameter, we obtain dU = 15.5 pJ/pulse. Writing the
expression for dU in terms of the density ρ, the eigenfrequency ω and
the displacement u(ω), as for an harmonic oscillator, we obtain
dU = ω2
∫
V
ρ (Au (ω))2 dV , (5.6)
and we determine the normalized eigenvalue displacement in terms of
the normalization coefficient Ai,
ui = Aiui =
√dU
ω2i
∫V
ρu2 (ωi) dVui , (5.7)
where the set of eigenvectors ui is normalized to 1. Setting our initial
condition of impulsive thermal expansion, we thus rewrite for t0 = 10 ps
the projection expression of Eq. 5.5,
|u (r, t0)〉 =∑
i
〈ui|u (r, t0)〉 |ui〉 , (5.8)
and plot in Fig. 5.7 the projection coefficients ci = |〈ui|u (r, t0)〉| versus
the eigenmodes frequency νi. Reported in Table 5.1 are the frequencies
of the modes with higher weight in the projection of the initial dis-
placement on the calculated eigenmodes of the composite system. The

74 Thermomechanics of hypersonic surface . . . chap. 5
5
4
3
2
1
0Pro
ject
ion
coef
ficie
nts
c i (a
rb. u
n.)
14121086420Frequency (GHz)
Stripe d=320 nm cos-like displacement sin-like displacement
1H
2H
3H
8.56
4.61
12.3
6
Figure 5.7: Projection (2D) of the initial thermal expansion displace-
ment on the eigenmodes of the composite system, with cos-like (red
circles) and sin-like (black circles) displacement symmetry. The calcu-
lated curves with cos-like displacement symmetry are fitted with the
Fano function reported in Eq. 5.9 (blue line).
evaluation of the SAW-likeness coefficient for the identified eigemodes
and the analysis of their displacement profiles allow to address them as
cos-like pseudo-SAWs, respectively as the fundamental (1H) solution at
ν1H = 4.61 GHz and the second harmonic (2H) at ν2H = 8.56 GHz.
A third weak contribution at ν3H = 12.36 GHz is ascribed to the third
harmonic (3H) pseudosurface wave, the displayed larger broadening be-
ing a signature of its stronger coupling to bulk modes [see Section 3.5].
We remark that the numerical simulation’s accuracy and reliability, in-
fluencing the quality of the 2H projection and of projections on higher
harmonics, are severely limited by the mesh refinement and consequently
by the calculation power of the workstation running the finite-elements

sec. 5.4 Coupling to bulk modes and lifetime 75
Table 5.1: Calculated frequencies and lifetimes of the main features in
the projection of the initial impulsive displacement on the eigenmodes
of the composite system [as reported in Fig. 5.7], addressed as cos-
like pseudo-SAW frequencies in terms of the calculated SAW-likeness
coefficient and of the displacement profile of the solutions.
Stripes d = 320 nm ν1H ν2H ν3H
ν (GHz) 4.61 8.56 12.36
τ (ns) 2.53 2.35 ∼ 0.65
analysis software.
A Fano lineshape is ascribed to both the 1H and 2H distributions
standing out in the projection plot. The Fano profile is the general fin-
gerprint of an absorption lineshape occurring when one or more discrete
levels interact with a continuum of states, both connected to a ground
state [97]. The remarkable feature is the occurrence of peculiar asym-
metric lineshapes, generated by the configuration interaction (mixing)
between the discrete and continuum states. Picturing this concept on
the interpretation of our results, as signature of the interaction between
the discrete silicon surface wave eigenmode and the continuum of bulk
modes, induced in the composite system by the surface stress at the
nanostripe/substrate interface, we adopt the Fano function to fit our
data sets,
F (ν) = F0 + A
(q Γ
2+ (ν − ν0)
2)
(ν − ν0)2 +
(Γ2
)2 , (5.9)

76 Thermomechanics of hypersonic surface . . . chap. 5
where the profile index q carries information on the configuration inter-
action and Γ is the line broadening parameter; ν0 and F0 are the fit x
and y offsets, respectively, and A is a constant. In order to clarify the
meaning of Eq. 5.9, we recall that in the limit case of q → ∞, that is
when only the discrete state is connected to the ground state, the above
equation describes a symmetric Lorentzian curve with broadening pa-
rameter Γ [98].
Thus, a direct evaluation of the linewidth γ of the pseudosurface os-
cillations is drawn from the curve fit broadening parameter Γ and it is
reported in Fig. 5.7. The oscillation lifetimes are reported in Table 5.1.
The value for τ1H is validated in terms of its consistency, to a certain ex-
tent, with results for comparable composite systems reported in Ref. [23].
An evaluation of the lifetime of the 3H pseudo-SAW in terms of the same
Fano curve fitting procedure returns τ3H ∼ 650 ps, giving a hint of its
highly damped dynamics, as expected because of its higher surface spa-
tial confinement.
These results confirm the validity of our interpretation, demonstrat-
ing that the impulsive heating of the periodic metallic nanostructures
launches collective modes mainly localized on the surface of the silicon
substrate, which are identified as pseudosurface acoustic waves.
5.5 Extension to the 3D case
The thermomechanical time-dependent model is here extended to the
3D case, with the aim of reproducing the physics of a surface phononic
crystal geometry, consisting of metallic nanodisks on silicon, excited by

sec. 5.5 Extension to the 3D case 77
a laser pulse, and to benchmark our results against those from time-
resolved diffraction measurements performed by Giannetti et al. on sim-
ilar composite systems [1]. In this sense, the measurements give evidence
of surface oscillations launched in a surface-based phononic crystal by
means of ultrashort laser pulses, and the theoretical frame here devel-
oped aims to explain such physical evidence in terms of a process of
excitation of pseudo-SAWs by means of an impulsive thermal expansion
of the periodic nanostructures.
We assume the system to be an elastic continuum composed of an
array of periodic metallic nanodisks deposited on a silicon substrate.
In Fig. 5.8(a), we consider the general configuration where an elastic
isotropic nickel nanodisk of diameter d and height h = 50 nm is deposited
on a crystalline silicon substrate cell, with Bloch periodic boundary con-
ditions set on the sides to reproduce the entire phononic crystal. In this
case the height of the silicon cell is reduced to 20 µm, a value exclu-
sively tailored to deal with the higher numerical complexity of a finite
elements analysis in three dimensions, still maintaining a sufficient den-
sity of eigenstates for the composite system [see Section 3.2]. The array
has periodicity λ = 1 µm, thus ensuring pseudo-SAWs in the hypersonic
range. Calculations are performed for d = 320 nm [as in Fig. 5.8(a)] and
d = 785 nm, thus matching the dimensions of the samples experimen-
tally investigated in Ref. [1].
As for the 2D case, by evaluating the laser energy density ab-
sorbed respectively by the nanostructures and the substrate, and the
specific heat of both Ni and Si, we can estimate that within 10 ps, the
temperature of the metallic nanodisks is homogeneously increased by
∆T ∼ 8 K, with respect to the portion of Si slab few microns beneath
the nanostructure-substrate interface. The impulsive temperature mis-

78 Thermomechanics of hypersonic surface . . . chap. 5
(b)(a)
1 µm 1 µm
λ
20 µ
m
u(r,0)
d
xz
y
7
0
Total displacem
ent (x10-12 m
)
Figure 5.8: (a) Simulation cell geometry: general configuration of an
elastic isotropic nickel nanodisk of diameter d and height h = 50 nm
deposited on a crystalline anisotropic silicon substrate cell of height
20 µm (Only the top 2 µm portion is shown in figure). (b) Total
displacement profile of the expanded nanodisk calculated at t0 = 10 ps.
match ∆T triggers a non-equilibrium expansion of the nanostructures
governed by Eq. 5.2. The symmetric total displacement profile of the
expanded nanodisk at t0 = 10 ps is presented in Fig. 5.8(b).
The developed theoretical frame involving the projection of the ini-
tial impulsive displacement on the calculated eigenmodes of the system
is well suited in this 3D case to describe the pseudosurface acoustic waves
generation process and to evaluate the lifetime of these oscillations. On
this basis, we solve the elastic eigenvalue problem addressed in Eq. 5.3
via finite element calculations and individuate the launched pseudo-SAW
solutions among the relevant eigenmodes in the projection of the initial
impulsive displacement at t0 = 10 ps on the calculated eigenmodes of
the composite system, by evaluating their SAW-likeness coefficient and

sec. 5.5 Extension to the 3D case 79
0.14
0.12
0.10
0.08
0.06
0.04
0.02
0Pro
ject
ion
coef
ficie
nts
c i (a
rb. u
n.)
121086420Frequency (GHz)
6.52
4.8
10.6
58.68
1H
3H
Disk d=320 nm cos-like displacement sin-like displacement
(a)
5
4
3
2
1
0Pro
ject
ion
coef
ficie
nts
c i (a
rb. u
n.)
121086420Frequency (GHz)
Disk d=785 nm cos-like displacement sin-like displacement1H
2H
4.55
6.36
7.68
6.97
(b)
Figure 5.9: Projections (3D) of the initial thermal expansion displace-
ment on the eigenmodes of the composite system, with cos-like (red
circles) and sin-like (black circles) displacement symmetry. We report
the results of simulations performed for phononic crystals with nan-
odisk diameter, respectively, (a) d = 320 nm and (b) d = 785 nm. The
calculated curves with cos-like displacement symmetry are fitted with
the Fano function reported in Eq. 5.9 (blue line).
analyzing their displacement profiles. At the same time, considering the
nanodisks’ symmetric initial displacement, we discriminate between sin-

80 Thermomechanics of hypersonic surface . . . chap. 5
xz
y
ν1H = 4.8 GHz
Norm
alized total displacement
0
1
ν = 6.52 GHz
(a) (b)
Figure 5.10: Normalized total displacement of (a) the fundamental
ν1H = 4.8 GHz cos-like pseudo-SAW and (b) the ν = 6.52 GHz cos-
like bulk mode, solutions of the 3D acoustic eigenvalue problem for the
d = 320 nm phononic crystal configuration.
like (black circles) and cos-like (red circles) solutions, practically show-
ing that only the cos-like pseudosurface oscillations (even symmetry) are
launched by the impulsive expansion. Following Eq. 5.8, these evidences
are clear in the plots of the projection coefficients ci = |〈ui|u (r, 0)〉| for
the 3D problem, reported versus the eigenfrequencies νi in Fig. 5.9.
In the analysis of the projection plot of Fig. 5.9(a) for the phononic
crystal configuration with nanodisks of diameter d = 320 nm, we gather
complete information on the mechanical response of the composite sys-
tem to the impulsive thermal excitation of the surface nanostructures.
We identify the fundamental excited pseudo-SAW at the frequency ν1H =
4.8 GHz as the more weighting contribution in the projection to the sys-

sec. 5.5 Extension to the 3D case 81
tem oscillation dynamics. The line profile of the fundamental pseudo-
SAW has a clear Fano appearance, highlighting the interaction between
the discrete silicon surface wave eigenmode and the continuum of bulk
modes, induced in the composite system by the surface stress at the
nanostructure/substrate interface. We make use of Eq. 5.9 to fit the
1H line profile and calculate its broadening parameter for an evaluation
of the curve’s linewidth γ1H = 0.406 ns−1. From the plot and as re-
ported in Table 5.2, we note that an additional surface component at
6.52 GHz enters this 3D projection as a contributing term to the ini-
tial nanodisks expansion. The analysis of the eigenmodes displacement
profiles, reported in Fig. 5.10, shows similarities between the fundamen-
tal pseudo-SAW and the symmetric surface oscillation of the 6.52 GHz
eigenmode, but on the other hand it evidences a non-negligible bulk-like
appearance. In spite of its strong surface component (underlined by a
SAW-likeness coefficient of the order of 0.4, as compared to SAW-likeness
coefficients of the order of 0.01 for standard bulk modes), the 6.52 GHz
eigenmode cannot be addressed as pseudo-SAW because, as the filling
fraction is reduced to zero, its profile does not evolve to a delta function
[see Section 3.3]. We thus classify it as bulk mode with a strong surface
contribution.
Surprisingly, in the study of higher frequency features, we are not
able to clearly individuate a second harmonic pseudosurface oscillation
signature in the projection plot. A profile centered at 10.65 GHz is
observed, with a lower but non-negligible contribution to the initial im-
pulsive thermal expansion, and due to its large broadening and surface
displacement profile it is addressed, similarly to the 2D case, as the third
harmonic (3H) highly damped pseudosurface feature. The 3H compo-
nent’s larger linewidth γ3H = 2.35 ns−1 (from the Fano curve fit) is in

82 Thermomechanics of hypersonic surface . . . chap. 5
Table 5.2: Calculated frequencies and lifetimes of the main features in
the projection of the initial impulsive displacement on the eigenmodes
of the composite system [as reported in Fig. 5.9]. Cos-like pseudo-SAW
frequencies are individuated in terms of the calculated SAW-likeness
coefficient and of the displacement profile of the solutions.
Disks d = 320 nm ν1H ν3H
ν (GHz) 4.8 6.52 10.65
τ (ns) 2.46 0.425
Disks d = 785 nm ν1H ν2H
ν (GHz) 4.55 6.36 6.97 7.68
τ (ns) 1.7 (∼ 6.0) 1.11
agreement with the stronger surface confinement for higher harmonics
and the greater mechanical damping in terms of elastic energy radiation
to bulk modes, as described in Chapter 3.
Accordingly to the discussion and results for the 2D case, we expect
that the nanodisks’ impulsive expansion would excite a 2H pseudo-SAW,
but the result of the simulations denies us. To find an answer to this issue
we take in consideration the (ux, uy, uz) components of the eigenvalue
displacement ui and separately project the initial displacement u (r, 0)
on the single component, as shown in Fig. 5.11. Pointing our attention
to the higher harmonics frequency range, in Fig. 5.11(b) we can confirm
that the projection on the uz transversal displacement component is ap-
proximately null, while on the other hand, in Fig. 5.11(a) the projections
on the ux and uy in-plane longitudinal components are totally similar to
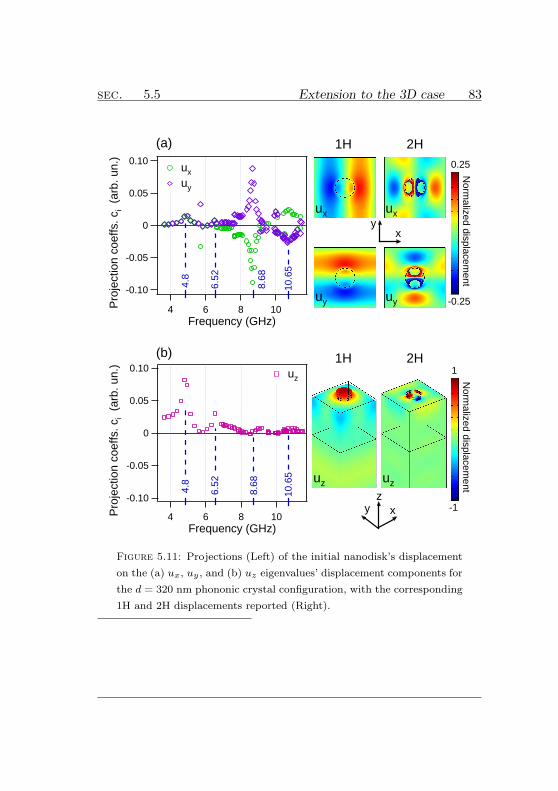
sec. 5.5 Extension to the 3D case 83
1H 2H
-0.10
-0.05
0
0.05
0.10
Pro
ject
ion
coef
fs. c
i (a
rb. u
n.)
10864Frequency (GHz)
-0.10
-0.05
0
0.05
0.10
Pro
ject
ion
coef
fs. c
i (a
rb. u
n.)
10864Frequency (GHz)
(a)
6.52
4.8
10.6
5
8.68
ux
uy
(b)
6.52
4.8
10.6
5
8.68
xyz
uz
ux ux
uy uy
xy
Norm
alized displacement
-0.25
0.25
Norm
alized displacement
-1
1
uz uz
1H 2H
Figure 5.11: Projections (Left) of the initial nanodisk’s displacement
on the (a) ux, uy , and (b) uz eigenvalues’ displacement components for
the d = 320 nm phononic crystal configuration, with the corresponding
1H and 2H displacements reported (Right).

84 Thermomechanics of hypersonic surface . . . chap. 5
the 2D projection reported in Fig. 5.7, with neath 2H contributions at
8.68 GHz. The fact that such contributions are not present in the general
projection [Eq. 5.8] is explained by their projection profiles, which are
equal in modulus but opposite in sign, leading to a zero in their sum-
mation. Physically, this translates in the 2H displacement profile not
matching the totally symmetric initial surface nanodisk expansion con-
dition [see Fig. 5.8(b)] and explaining why the impulsive displacement
at t0 = 10 ps does not excite a 2H pseudosurface acoustic wave.
Our calculations are benchmarked against time-resolved optical
diffraction measurements performed on the same composite systems [1].
The experimental results are here reported in Fig. 5.12, in a wavelet
analysis framework. By definition, the wavelet directly shows the fre-
quency content of the measured diffracted signal ∆R/R within time
windows, thus carrying information on both measured surface oscilla-
tions’ frequency components and lifetimes. The theoretical outcome re-
produces the main experimental features. In the case of d = 320 nm in
Fig. 5.12(a), the calculated pseudo-SAW frequencies match the diffracted
signal’s frequency components. This is achieved introducing a correc-
tion factor in the modulus of the elastic stiffness tensor cijmn, enter-
ing the acoustic equation of motion [Eq. 5.1]. This correction is due
to the increased strain originated by both the periodic nanostructures
mass loading on the silicon substrate and the lattice mismatch at the
nickel/silicon interface. This correction factor is taken into account in
terms of an increased effective elastic stiffness tensor, as formerly dis-
cussed in Ref. [99]. The need to adopt a greater correction factor for
the larger nanodisk configuration further confirms the validity of this as-
sumption. The numerically evaluated fundamental pseudosurface wave
lifetime τ1H = 1/γ1H = 2.46 ns agrees with the wavelet displayed damp-

sec. 5.5 Extension to the 3D case 85
0 1000 2000 3000
0
100
200
300
400
10
5
3.3
2.5
Per
iod
(ps)
Frequency (G
Hz)
0
100
200
300
400
Per
iod
(ps)
10
5
3.3
2.5
Frequency (G
Hz)
0 1000 2000 3000
Time delay (ps)
(a)
(b)
10.65
6.524.8
4.556.366.977.68
Figure 5.12: 3D Wavelet analysis of the time-resolved diffraction mea-
surements. Here reported (inverted color scale) are the experimental
results collected for phononic crystals with nanodisk diameter of, re-
spectively, (a) d = 320 nm and (b) d = 785 nm. The calculated fre-
quencies contributing to the displacement field are evidenced in blue.

86 Thermomechanics of hypersonic surface . . . chap. 5
Norm
alized total displacement
0
1
ν = 6.97 GHz ν1H = 4.55 GHz ν = 6.36 GHz
(a) (b) (c)
Figure 5.13: Normalized total displacement of (a) the fundamental
ν1H = 4.55 GHz cos-like pseudo-SAW, and the (b) ν = 6.36 GHz,
(c) ν = 6.97 GHz cos-like bulk modes, solutions of the 3D acoustic
eigenvalue problem for the d = 785 nm phononic crystal configuration.
ing of the signal’s 4.8 GHz frequency component. In the same way, the
expected shorter lifetime τ3H = 1/γ3H = 425± 160 ps of the 3H pseudo-
SAW matches, to a certain extent (considering the prominent numerical
error), the shorter time range of the corresponding 250 ps experimental
counterpart, observable as a small signature in the wavelet plot. More-
over, the additional bulk mode with a surface component observed in the
projection at ν = 6.52 GHz, even if not directly visible because covered
by the stronger 1H signal, still has a clear fingerprint in the wavelet plot
in terms of a frequency beating visible in the signal on longer delays,
suggesting that its contribution to the surface oscillation is effectively
translated in a variation of the diffracted signal, thus being optically de-
tected.
The additional weak surface term also appears when performing

sec. 5.5 Extension to the 3D case 87
the same analysis on the thermomechanical simulations results for the
d = 785 nm phononic crystal configuration. As summarized in Table 5.2,
in the projections plot of Fig. 5.9(b), the 1H and 2H excited pseudo-SAW
are found at ν1H = 4.55 GHz and ν2H = 7.68 GHz, respectively, and
the third contribution is distinguishable at 6.36 GHz. Comparing these
evidences with the experimental results reported in Fig. 5.12(b), the
wavelet displays the signature of the 1H and 2H (here observable) pseu-
dosurface oscillations at zero delay. The eigenfrequencies are correctly
downshifted, accounting for the increased mass loading of the system
due to the larger filling fraction, as discussed in Section 3.3. Also in
this case, the surface oscillation at 6.36 GHz, not directly visible in the
wavelet because covered by the stronger 1H signal, still sets up a clear
frequency beating, with the fundamental pseudo-SAW, visible in the sig-
nal on longer delays. Its contribution to the surface oscillation is thus
effectively optically detected. The analysis of the surface displacement
of this eigenmode, as reported in Figs. 5.13(a) and 5.13(b), evidences a
profile very similar to the fundamental’s, with a stronger oscillation con-
finement in the nanostructure and a weak energy radiation component in
the bulk. Concerning the pseudosurface oscillations’ lifetimes calculated
by means of the Fano profile curve fitting procedure, if the second har-
monic τ2H = 1/γ2H = 1.11 ns overestimates the reported experimental
result, the fundamental τ1H = 1/γ1H = 1.7 ns fits with some approxi-
mations to the measured damping displayed in the wavelet. We don’t
have yet an explanation for the small broadening of the 6.36 GHz surface
component, leading to a not physical 6.0±1.5 ns lifetime, even though we
are aware of the small number of calculated solutions in that frequency
range. Finally we point out that the isolated feature in the projection
at 6.97 GHz corresponds to a bulk modes with a non-negligible surface

88 Thermomechanics of hypersonic surface . . . chap. 5
oscillation component, identified in terms of a SAW-likeness coefficient
of the order of 0.27. This feature is clearly observable in terms of the
surface displacement analysis reported in Fig. 5.13(c), but hard to indi-
viduate in the measured signal.
5.6 Summary
In conclusion, presented in this Chapter is a theoretical framework al-
lowing to properly investigate the thermomechanics of hypersonic sur-
face phononic crystals excited by ultrafast laser pulses. Exploiting finite-
elements analysis, we followed step by step in the time domain the initial
impulsive heat-driven displacement. The 3D thermomechanical time-
dependent model demonstrates without doubts that hypersonic pseudo-
surface acoustic waves are optically excited. The lifetimes of the gen-
erated pseudo-SAWs are evaluated. The benchmark of the outcomes
of our calculations, against experimental results from time-resolved in-
frared diffraction measurements, verifies that the theoretical framework
well reproduces the main experimental features. These results give cre-
dence to the full thermomechanical model as a unique tool to understand
the physics of hypersonic surface phononic crystals.

Chapter 6
Conclusions
6.1 Summary
In this thesis, we presented a theoretical framework allowing to investi-
gate the thermomechanics of hypersonic phononic crystals triggered by
ultrafast laser pulses. Analyzing the detailed mechanisms behind the
optical generation of pseudosurface acoustic waves, we addressed the full
thermomechanical problem and identified pseudo-SAW solutions [45]. In
a realistic physical scenario, there is no distinction between the eigen-
modes of nanostructures and SAWs, the solution of the elastic equation
being a pseudo-SAW partially localized on the nanostructures and radi-
ating energy into the bulk. Pursuing a strategy that can be applied to
any surface phononic crystal, we investigated pseudo-SAW line shapes,
gap opening and mechanical energy scattering beyond a perturbative ap-
proach.
89

90 Conclusions chap. 6
We made use of the outlined theoretical framework in the case of a
hypersonic surface phononic crystal made of periodic nickel stripes on
a silicon substrate, investigating the pseudosurface acoustic wave fre-
quency gap over the entire filling fraction range, starting from the case
where the periodic nanostructures act as a perturbation, to finally reach
the substrate full coverage. A preliminary understanding of how the
construction parameters affect the frequency gap has been achieved. We
showed that the pseudo-SAW frequency gap results from a combination
of geometry p, h and mass loading m, ρ factors, the two affecting
the pseudo-SAW frequencies in opposite ways. A trade-off between p
and m is thus necessary for tailoring the pseudo-SAW frequencies or fre-
quency gap for the application at hand. The mechanical energy spatial
distribution of pseudo-SAW as a function of the filling fraction has been
studied, potentially allowing to tailor the device’s parameters in order
to minimize the energy content scattered out of the desired modes.
Exploiting finite-elements analysis, we modeled ab-initio the thermal
expansion dynamics induced by ultrashort laser pulses in order to study
the impulsive generation and lifetime of pseudo-SAWs in these nanostruc-
tured composite systems. In the ultrafast nanocalorimetry perspective,
we reported the break-down of thermodynamical equilibrium between
electrons and phonons on the ns time scale at ∼ 10 K, at a temperature
two order of magnitudes higher than that observed in standard transport
measurements. These findings set the limits of applicability of ultrafast
nanocalorimetry well above liquid He temperature, the electron-phonon
temperature decoupling preventing a proper definition of the tempera-
ture concept of the nanosample as a whole. In this sense, the present
work, while making available a proper tool for interpreting all-optical
time-resolved nanocalorimetry experiments, suggests a new route for in-

sec. 6.2 Perspectives 91
vestigating the physics of the electron-phonon decoupling where the sub-
Kelvin temperature requirement is substituted by the ns time resolution.
Combining the initial condition for the generation of surface acoustic
oscillations, given by the system’s thermal expansion dynamics, with the
developed full mechanical model, we were able to follow step by step in
the time domain the initial impulsive heat-driven displacement launching
pseudo-SAWs and to evaluate their lifetime. The results demonstrated
that hypersonic pseudosurface acoustic waves are optically excited in
surface phononic crystals by the nanostructures’ impulsive thermal ex-
pansion. As a benchmark, the simulations outcomes were compared, in
terms of a wavelet analysis framework, with time-resolved optical diffrac-
tion measurements performed on the same composite systems by Gian-
netti et al. [1]. The theory developed in this thesis spots out the modes
launched in the time-resolved experiment, providing correct information
on the displacement field, frequency, and qualitatively on the lifetimes
of the active modes themselves.
6.2 Perspectives
The present work constitutes a theoretical framework to access thermo-
mechanical aspects of hypersonic phononic crystals, while calling for new
questions and further investigations.
For instance, as far as nanocalorimetry is concerned, issues such as
the phonon gas thermalization at low temperatures and frequencies will
have to be addressed and eventual alternative formulations proposed. As
the device’s dimensions are scaled to smaller sizes, geometry dependent-

92 Conclusions chap. 6
modes should be included in calculating the Eliashberg function.
On the nanomechanical side, in order to fully relate the excited me-
chanical modes to the detected optical signal, a further step is needed.
Linking the displacement field to the diffracted signal will allow to pre-
cisely determine the effect of the excited surface modes on the variation
of the optical signal. This investigation, currently ongoing, might ac-
count for the discrepancy between certain ratios of the amplitudes of the
excited modes, as calculated from the projections, and the experimen-
tally detected ones. Such analysis will also prove useful to understand to
what extent the phononic crystal acts as a phase or amplitude grating
for the optical probe.
The mechanical and thermal energy are dissipated into the bulk on
the same time scale. Strategies to disentangle the two energy decay
channels, for instance quenching the pseudo-SAW on a faster time scale,
will allow an easier experimental access to the thermal dynamics alone.
To this aim, use of polymeric overlayers serving as a damping layer for
the pseudo-SAW, engineered piezoelectric doped substrates transferring
mechanical energy into Joule heating and aperiodic phononic crystals
conserving the optical periodicity (such as a periodic nanodisks over-
layer with etched random holes in the substrate) are routes worth to be
explored.
From an applicative standpoint, the use of ultrafast coherent extreme
ultraviolet beams allows launching and optically detecting pseudosurface
acoustic waves beyond the 100 GHz range [44]. Such phononic crystal
devices, if properly engineered within the frame here presented, will serve
as a very sensitive surface-based mass detector exploiting the strong SAW
confinement.
In addition, the gap in the phononic modes, as reported in Chap-

sec. 6.2 Perspectives 93
SA
W-lik
eness
5.25.04.84.64.44.24.03.8
Frequency (GHz)
cos symmetry sin symmetry localized mode
cos-symmetry pseudo-SAW
surface cavity
Figure 6.1: Calculated pseudo-SAWs of a long chain (19 elements)
of 200 nm wide, 50 nm thick metallic nanostructures with periodicity
of 1 µm, on top of a Si(100) surface. Upon removal of three metallic
elements, a new mode strongly localized within the cavity appears at
a frequency ∼ 4.45 GHz [80].
ter 3, is the starting point to design and engineer surface waveguides and
surface phononic cavities in the 10-100 GHz frequency range. In particu-
lar, the controlled removal of nanostructures adds localized modes within
the phononic gap range. In Fig. 6.1, we calculate the eigenmodes of a long
chain of 200 nm wide, 50 nm thick metallic nanostructures with period-
icity of 1 µm, on top of a Si(100) surface. Upon removal of three metallic
94 Conclusions chap. 6
elements, a new mode, strongly localized within the cavity, appears at
a frequency of ∼ 4.45 GHz. This mode is prevented from propagating
in the surrounding phononic crystal by the acoustic gap of the periodic
structure. This simple element is the base of the development of waveg-
uides and surface cavities, where the hypersonic acoustic pulses can be
injected by excitation with ultrafast laser pulses.
The accessibility of this kind of surface cavities is a due step towards
the manipulation of molecules and small nanostructures by means of
acoustic waves. Future applications will reside in the design and real-
ization of artificial materials with both photonic and phononic proper-
ties to transport and localize UV/visible light and hypersonic acoustic
waves in nanometric cavities used as templates for single biomolecules.
The localization of light and sound will be exploited to perform novel
optical-acoustic spectroscopies on single biomolecules with picosecond
time-resolution and to control and manipulate the optical and structural
properties of biomolecules and nano-objects.

Bibliography
[1] C. Giannetti et al., Phys. Rev. B 76, 125413 (2007).
[2] H. J. Maris, Scientific American 278, 86 (1998).
[3] C. Thomsen, H. T. Grahn, H. J. Maris, and J. Tauc, Phys. Rev. B
34, 4129 (1986).
[4] E. Morozov, Y. Laamiri, P. Ruello, D. Mounier, and V. Gusev, Eur.
Phys. J. Special Topics 153, 239 (2008).
[5] M. I. Kaganov, I. M. Lifshitz, and L. V. Tanatarov, Sov. Phys.
JEPT 4, 173 (1957).
[6] J. A. Rogers, A. A. Maznev, M. J. Banet, and K. A. Nelson, Annu.
Rev. Mater. Sci. 30, 117 (2000).
[7] T. Pezeril, F. Leon, D. Chateigner, S. Kooi, and K. A. Nelson, Appl.
Phys. Lett. 92, 061908 (2008).
[8] H.-Y. Hao and H. J. Maris, Phys. Rev. B 64, 064302 (2001).
[9] A. V. Scherbakov, P. J. S. van Capel, A. V. Akimov, J. I. Dijkhuis,
D. R. Yakovlev, T. Berstermann, and M. Bayer, Phys. Rev. Lett.
99, 057402 (2007).
95

96 Bibliography
[10] L. D. Landau and E. M. Lifshitz, Theory of Elasticity (Butterworth-
Heinemann, Oxford, 1986).
[11] M. Cecchini, V. Piazza, F. Beltram, D. G. Gevaux, M. B. Ward,
A. J. Shields, H. E. Beere, and D. A. Ritchie, Appl. Phys. Lett. 86,
241107 (2005).
[12] M. Cecchini, V. Piazza, G. D. Simoni, F. Beltram, H. E. Beere, and
D. A. Ritchie, Appl. Phys. Lett. 88, 212101 (2006).
[13] M. M. de Lima, R. Hey, P. V. Santos, and A. Cantarero, Phys. Rev.
Lett. 94, 126805 (2005).
[14] M. M. de Lima, M. van der Poel, P. V. Santos, and J. M. Hvam,
Phys. Rev. Lett. 97, 045501 (2006).
[15] J. Rudolph, R. Hey, and P. V. Santos, Phys. Rev. Lett. 99, 047602
(2007).
[16] Y. Sugawara, O. B. Wright, O. Matsuda, M. Takigahira, Y. Tanaka,
S. Tamura, and V. E. Gusev, Phys. Rev. Lett. 88, 185504 (2002).
[17] T. Tachizaki, T. Muroya, O. Matsuda, Y. Sugawara, D. H. Hurley,
and O. B. Wright, Rev. Sci. Instrum. 77, 043713 (2006).
[18] D. H. Hurley, O. B. Wright, O. Matsuda, T. Suzuki, S. Tamura, and
Y. Sugawara, Phys. Rev. B 73, 125403 (2006).
[19] D. M. Profunser, O. B. Wright, and O. Matsuda, Phys. Rev. Lett.
97, 055502 (2006).
[20] A. A. Maznev, Elsevier Ultrasonics 49, 1 (2009).
[21] A. Bartels, T. Dekorsy, and H. Kurz, Phys. Rev. Lett. 82, 1044
(1999).

Bibliography 97
[22] A. Huynh, N. D. Lanzillotti-Kimura, B. Jusserand, B. Perrin, A.
Fainstein, M. F. Pascual-Winter, E. Peronne, and A. Lemaıtre,
Phys. Rev. Lett. 97, 115502 (2006).
[23] H.-N. Lin, H. J. Maris, L. B. Freund, K. Y. Lee, H. Luhn, and D. P.
Kern, J. Appl. Phys. 73, 37 (1993).
[24] M. Nisoli, S. D. Silvestri, A. Cavalleri, A. M. Malvezzi, A. Stella,
G. Lanzani, P. Cheyssac, and R. Kofman, Phys. Rev. B 55, (1997).
[25] N. D. Fatti, C. Voisin, F. Chevy, F. Vallee, and C. Flytzanis, J.
Chem. Phys. 110, 11484 (1999).
[26] J. Burgin et al., Nano Lett. 8, 1296 (2008).
[27] W. Huang, W. Qian, and M. A. El-Sayed, Nano Lett. 4, 1741 (2004).
[28] W. Huang, W. Qian, and M. A. El-Sayed, J. Phys. Chem. B 109,
18881 (2005).
[29] R. Taubert, F. Hudert, A. Bartels, F. Merkt, A. Habenicht, P. Lei-
derer, and T. Dekorsy, New J. Phys. 9, 376 (2007).
[30] J. Burgin, P. Langot, N. D. Fatti, F. Vallee, W. Huang, and M. A.
El-Sayed, J. Phys. Chem. C 112, 11231 (2008).
[31] A. Arbouet, N. D. Fatti, and F. Vallee, J. Chem. Phys. 124, 144701
(2006).
[32] P. Billaud et al., J. Phys. Chem. C 112, 978 (2008).
[33] R. J. Stoner and H. J. Maris, Phys. Rev. B 48, 16373 (1993).
[34] B. C. Gundrum, D. G. Cahill, and R. S. Averback, Phys. Rev. B
72, 245426 (2005).
[35] H.-K. Lyeo and D. G. Cahill, Phys. Rev. B 73, 144301 (2006).

98 Bibliography
[36] M. Highland, B. C. Gundrum, Y. K. Koh, R. S. Averback, D. G.
Cahill, V. C. Elarde, J. J. Coleman, D. A. Walko, and E. C. Landahl,
Phys. Rev. B 76, 075337 (2007).
[37] R. J. von Gutfeld and A. H. Nethercot, Phys. Rev. Lett. 17, 868
(1966).
[38] B. Perrin, E. Peronne, and L. Belliard, Elsevier Ultrasonics 44,
(2006).
[39] C. Voisin, N. D. Fatti, D. Christofilos, and F. Vallee, Appl. Surface
Science 164, 131 (2000).
[40] D. H. Hurley and K. L. Telschow, Phys. Rev. B 66, 153301 (2002).
[41] J.-F. Robillard, A. Devos, and I. Roch-Jeune, Phys. Rev. B 76,
092301 (2007).
[42] D. H. Hurley, R. Lewis, O. B. Wright, and O. Matsuda, Appl. Phys.
Lett. 93, 113101 (2008).
[43] W. Chao, B. D. Harteneck, J. A. Liddle, E. H. Anderson, and D. T.
Attwood, Nature 435, 1210 (2005).
[44] M. E. Siemens, Q. Li, M. M. Murnane, H. C. Kapteyn, R. Yang,
E. H. Anderson, and K. A. Nelson, Appl. Phys. Lett. 94, 093103
(2009).
[45] D. Nardi, F. Banfi, C. Giannetti, B. Revaz, G. Ferrini, and F. Parmi-
giani, Phys. Rev. B 80, 104119 (2009).
[46] L. Esaki and R. Tsu, IBM J. Res. Dev. 14, 61 (1970).
[47] J. C. Knight, J. Broeng, T. A. Birks, and P. S. J. Russell, Science
282, 1476 (1998).
[48] P. S. J. Russell, Science 299, 358 (2003).

Bibliography 99
[49] E. Yablonovitch, Phys. Rev. Lett. 58, 2059 (1987).
[50] S. John, Phys. Rev. Lett. 58, 2486 (1987).
[51] T. F. Krauss, R. M. D. L. Rue, and S. Brand, Nature 383, 699
(1996).
[52] M. S. Kushwaha, P. Halevi, G. Martınez, L. Dobrzynski, and B.
Djafari-Rouhani, Phys. Rev. B 49, 2313 (1994).
[53] Y. Tanaka and S. I. Tamura, Phys. Rev. B 58, 7958 (1998).
[54] Y. Tanaka and S. I. Tamura, Phys. Rev. B 60, 13294 (1999).
[55] H. A. Haus, IEEE Trans. Sonics Ultrason. 259 (1977).
[56] D.-P. Chen and H. A. Haus, IEEE Trans. Sonics Ultrason. 395
(1985).
[57] S. Datta and B. J. Hunsinger, J. Appl. Phys. 50, 5661 (1979).
[58] H. Robinson, Y. Hahn, and J. N. Gau, J. Appl. Phys. 65, 4573
(1989).
[59] J. R. Dutcher, S. Lee, B. Hillebrands, G. J. McLaughlin, B. G.
Nickel, and G. I. Stegeman, Phys. Rev. Lett. 68, 2464 (1992).
[60] A. A. Maznev and O. B. Wright, J. Appl. Phys. 105, 123530 (2009).
[61] N. E. Glass and A. A. Maradudin, J. Appl. Phys. 54, 796 (1983).
[62] X. Zhang, T. Jackson, E. Lafond, P. Deymier, and J. Vasseur, Appl.
Phys. Lett. 88, 041911 (2006).
[63] B. Bonello, C. Charles, and F. Ganot, Appl. Phys. Lett. 90, 021909
(2007).
[64] R. Sainidou and N. Stefanou, Phys. Rev. B 73, 184301 (2006).

100 Bibliography
[65] F. Liu, F. Cai, Y. Ding, and Z. Liua, Appl. Phys. Lett. 92, 103504
(2008).
[66] B. Morvan, A. C. Hladky-Hennion, D. Leduc, and J. L. Izbicki, J.
Appl. Phys. 101, 114906 (2007).
[67] B. Auld, Acoustic Fields and Waves in Solids, Vol.II (Krieger Publ.,
Malabar, FL, 1990).
[68] W. Cheng, J. Wang, U. Jonas, G. Fytas, and N. Stefanou, Nature
Materials 5, 830 (2006).
[69] COMSOL Multiphysics finite element software, Version 3.5a
(3.5.0.608), COMSOL AB, Sweden.
[70] A. Okhotin, A. Pushkarskii, and V. Gorbachev, Thermophysical
Properties of Semiconductors (Atom Publ. House, Moscow, 1972).
[71] Davies and Associates, 14ASM Metal Handbook, 10th ed. (ASM In-
ternational, Metals Park, 1996).
[72] S. Hufner, Photoelectron Spectroscopy (Springer, Berlin-Heidelberg,
2003).
[73] D. Courjon, Near-field microscopy and near-field optics (Springer,
Berlin, 2004).
[74] G. A. Antonelli, H. J. Maris, S. G. Malhotra, and J. M. E. Harper,
J. Appl. Phys. 91, 3261 (2002).
[75] G. Cahill, W. K. Ford, K. E. Goodson, G. D. Mahan, A. Majumdar,
H. J. Maris, R. Merlin, and S. R. Phillpot, J. Appl. Phys. 93, 793
(2003).
[76] V. Juve, M. Scardamaglia, P. Maioli, A. Crut, S. Merabia, L. Joly,
N. D. Fatti, and F. Vallee, Phys. Rev. B 80, 195406 (2009).

Bibliography 101
[77] K. Schwab, E. A. Henriksen, J. M. Worlock, and M. L. Roukes,
Nature 404, 974 (2000).
[78] F. Giazotto, T. T. Heikki, A. Luukanen, A. M. Savin, and J. P.
Pekola, Rev. Mod. Phys. 78, 217 (2006).
[79] W. C. Fon, K. C. Schwab, J. M. Worlock, and M. L. Roukes, Nano
Lett. 5, 1968 (2005).
[80] C. Giannetti, F. Banfi, D. Nardi, G. Ferrini, and F. Parmigiani,
IEEE Photonics Journal 1, 21 (2009).
[81] C. Senatore, Specific heat measurement on industrial superconduc-
tors (Invited talk, Brescia, 28th April 2006).
[82] P. B. Johnson and R. W. Christy, Phys. Rev. B 9, 5056 (1974).
[83] S. D. Brorson, J. G. Fujimoto, and E. P. Ippen, Phys. Rev. Lett.
59, 1962 (1987).
[84] C. Suarez, W. E. Bron, and T. Juhasz, Phys. Rev. Lett. 75, 4536
(1995).
[85] M. N. Ozisik, Heat Conduction, II Ed. (Wiley-Interscience, Mal-
abar, FL, 1993).
[86] D. A. Young and H. J. Maris, Phys. Rev. B 40, 3685 (1989).
[87] E. D. Swartz and R. O. Pohl, Rev. Mod. Phys. 61, 605 (1989).
[88] When working at or below liquid He temperatures, repetition rate ∼
1 MHz or less needs to be used in order for the average temperatures
in proximity of the nanodisk interface to remain close to the one
imposed by the cryostate.
[89] Cel = γel ·Tel with γel = 1.065 ·103 Jm−3K3 taken from P. B. Allen,
Phys. Rev. B 36, 2920 (1987), Cph is calculated with PCWS, CSi

102 Bibliography
is derived from the Debye Model, kel and kph are taken from C. Y.
Ho et al., J. Phys. Chem. Ref. Data 7, 959 (1978), kSi is taken from
Glassbrenner et al., Phys. Rev. 134, A1058 (1964).
[90] P. B. Allen, Phys. Rev. Lett. 59, 1460 (1987).
[91] The function α2F and the DOS for Cu have been calculated imple-
menting the code PWscf part of the Quantum ESPRESSO program.
[92] P. B. Allen, Phys. Rev. B 36, 2920 (1987).
[93] S. D. Brorson, A. Kazeroonian, J. S. Moodera, D. W. Face, T. K.
Cheng, E. P. Ippen, M. S. Dresselhaus, and G. Dresselhaus, Phys.
Rev. Lett. 64, 2172 (1990).
[94] H. E. Elsayed-Ali, T. B. Norris, M. A. Pessot, and G. A. Mourou,
Phys. Rev. Lett. 58, 1212 (1987).
[95] E. T. Swartz and R. O. Pohl, Appl. Phys. Lett. 51, 2200 (1987).
[96] M. L. Roukes, M. R. Freeman, R. S. Germain, R. C. Richardson,
and M. B. Ketchen, Phys. Rev. Lett. 55, 422 (1985).
[97] U. Fano, Phys. Rev. 124, 1866 (1961).
[98] G. Grosso and G. P. Parravicini, Solid State Physics (Academic
Press, San Diego, CA, 2000).
[99] R. Zhu, E. Pan, P. W. Chung, X. Cai, K. M. Liew, and A. Buldum,
Semicond. Sci. Technol. 21, 906 (2006).

List of publications
Thermomechanical behavior of surface acoustic waves in or-
dered arrays of nanodisks studied by near-infrared pump-probe
diffraction experiments and finite element simulations (A)
C. Giannetti, F. Banfi, D. Nardi, B. Revaz, G. Ferrini, P. Vavassori, V.
Metlushko, and F. Parmigiani, J. Acoust. Soc. Am. 123, 3555 (2008).
Ultrafast laser pulses to detect and generate fast thermo-
mechanical transients in matter
C. Giannetti, F. Banfi, D. Nardi, G. Ferrini, and F. Parmigiani, IEEE
Photonics Journ. 1, 20 (2009).
Pseudosurface acoustic waves in hypersonic surface phononic
crystals
D. Nardi, F. Banfi, C. Giannetti, B. Revaz, G. Ferrini, and F. Parmi-
giani, Phys. Rev. B 80, 104119 (2009).
Disentangling thermal and nonthermal excited states in a
charge-transfer insulator by time- and frequency-resolved pump-
probe spectroscopy
C. Giannetti, G. Zgrablic, C. Consani, A. Crepaldi, D. Nardi, G. Ferrini,
G. Dhalenne, A. Revcolevschi, and F. Parmigiani, Phys. Rev. B 80,
235129 (2009).

Electron-phonon temperature decoupling in all-optical time-
resolved nanocalorimetry
F. Banfi, F. Pressacco, B. Revaz, C. Giannetti, D. Nardi, G. Ferrini, and
F. Parmigiani, submitted.
Birth of a surface acoustic wave
D. Nardi, F. Banfi, C. Giannetti, B. Revaz, G. Ferrini, and F. Parmi-
giani, in preparation.
Hypersonic pseudosurface acoustic wave-based mass sensor
D. Nardi, E. Zagato, F. Banfi, C. Giannetti, G. Ferrini, and F. Parmi-
giani, in preparation.

Acknowledgments
This thesis is the outcome of a wonderful three years experience, and
I wish to conclude with a few acknowledgments. I am grateful to Prof.
Fulvio Parmigiani and Gabriele Ferrini, who have been great supervisors
for this thesis work and who made this experience possible. I thank them
for their help and advices.
I want to acknowledge all the people who gave me scientific support, with
their experience and interests in the subject. I thank Prof. Fabrice Vallee
for his comments and for his help as referee in the review process. I wish
to thank Prof. Humphrey Maris for valuable discussions and sincere sug-
gestions during the preparation of the article on pseudosurface acoustic
waves. I also acknowledge Prof. Thomas Dekorsy for giving me the possi-
bility to perform preliminary optical measurements on phononic crystals
in Konstanz, Pasqualantonio Pingue for processing the samples at NEST
in Pisa, and all the people at COMSOL Italia for technical support.
A huge thanks goes to Francesco Banfi and Claudio Giannetti, great sci-
entific guides and true friends before all. Grazie per il supporto incon-
dizionato. Il vostro aiuto rimane indescrivibile. My gratitude also goes
to Federico Pressacco and Bernard Revaz for their work and support on
nanocalorimetry and nanomechanics. Finally, I thank all the people who
helped me in this work and made me grow up, both as a physicist and as a
man. Condividere con voi la vita di tutti i giorni in universita, in ufficio,
in laboratorio, in mensa, ha reso tutto straordinariamente divertente.

Alla mia famiglia devo piu di ogni altra cosa. Grazie per essermi stati
cosı vicino ed avermi aiutato con grossi sacrifici.
Alla mia Jenny devo molto di piu di un semplice grazie. Le parole non
sono sufficienti per descrivere il tuo amore, la tua pazienza ed i miei
giorni con te.


