DOT/FAA/AR-01/44 Office of Aviation Research Washington, D.C. 20591
Statistical Loads Data for Cessna 172 Aircraft Using the Aircraft Cumulative Fatigue System (ACFS) August 2001 Final Report This document is available to the U.S. public through the National Technical Information Service (NTIS), Springfield, Virginia 22161.
U.S. Department of Transportation Federal Aviation Administration

NOTICE
This document is disseminated under the sponsorship of the U.S. Department of Transportation in the interest of information exchange. The United States Government assumes no liability for the contents or use thereof. The United States Government does not endorse products or manufacturers. Trade or manufacturer's names appear herein solely because they are considered essential to the objective of this report. This document does not constitute FAA certification policy. Consult your local FAA aircraft certification office as to its use. This report is available at the Federal Aviation Administration William J. Hughes Technical Center's Full-Text Technical Reports page: actlibrary.tc.faa.gov in Adobe Acrobat portable document format (PDF).
Technical Report Documentation Page 1. Report No. DOT/FAA/AR-01/044
2. Government Accession No. 3. Recipient's Catalog No.
4. Title and Subtitle
STATISTICAL LOADS DATA FOR CESSNA 172 AIRCRAFT USING THE AIRCRAFT CUMULATIVE FATIGUE SYSTEM (ACFS)
5. Report Date
August 2001
6. Performing Organization Code
7. Author(s)
Dr. John A. Cicero, Frank L. Feiter, and Dr. Jamshid Mohammadi 8. Performing Organization Report No.
9. Performing Organization Name and Address
Systems & Electronics, Inc. 190 Gordon Street
10. Work Unit No. (TRAIS)
RPD-510
Elk Grove Village, IL 60007 11. Contract or Grant No.
DTRS-57-93-C-00172 12. Sponsoring Agency Name and Address
U.S. Department of Transportation Federal Aviation Administration
13. Type of Report and Period Covered
Final Report
Office of Aviation Research Washington, DC 20591
14. Sponsoring Agency Code ACE-110
15. Supplementary Notes
This research was conducted under SBIR Phase II research program. The FAA William J. Hughes Technical Center Technical Monitor was Mr. Thomas DeFiore. 16. Abstract
The purpose of this research and development program was to manufacture a small, lightweight, low-cost recorder for loads usage monitoring of general aviation and commuter type aircraft to support the Federal Aviation Administration (FAA) Operational Loads Monitoring Program. The scope of activities performed involved the following: (1) design, development, manufacturing and test of a low-cost Airframe Cumulative Fatigue System (ACFS), (2) installation of the ACFS into a fleet of seven Cessna 172 aircraft owned and operated by Embry-Riddle Aeronautical University, (3) conduct aircraft usage data acquisition on seven Cessna 172 aircraft, (4) define the effectiveness of ACFS in the data acquisition effort and any required design changes required for the ACFS, and (5) provide the resultant processed data from the data acquisition effort in formats useful to the FAA. Presented in this report are the description of the ACFS, the analysis and statistical summaries of the data collected from 1000 flights representing 1168 hours of Cessna 172 aircraft operational data. The end product from the data acquisition effort includes statistical information on acceleration, speeds, altitudes, and flight duration and distance. 17. Key Words
Loads, Normal acceleration, Airspeed, Altitude, Pitch, roll, and yaw rates, Cessna 172 airplane
18. Distribution Statement
This document is available to the public through the National Technical Information Service (NTIS) Springfield, Virginia 22161.
19. Security Classif. (of this report)
Unclassified
20. Security Classif. (of this page)
Unclassified
21. No. of Pages
96 22. Price
Form DOT F1700.7 (8-72) Reproduction of completed page authorized
PREFACE Systems & Electronics, Inc. (SEI) prepared this report under contract from the Federal Aviation Administration (FAA). SEI designed and developed an airframe cumulative fatigue system (ACFS) for general aviation and commuter aircraft. Nine of these systems were delivered to Embry-Riddle Aeronautical University (ERAU) to be installed on their fleet of Cessna 172 aircraft. To prove the effectiveness of this low-cost ACFS system, the ACFS equipped aircraft were flown for over 1000 hours. The results of the compiled flight loads and usage data are presented in this report. Mr. Thomas J. Sepka, principal investigator, designed the ACFS system hardware. Dr. John A. Cicero developed the ACFS software. Dr. Cicero, Dr. Jamshid Mohammadi, Mr. Douglas Shoemaker, and Mr. Frank L. Feiter conducted the data analysis, data evaluation, and processing. SEI would like to extend its appreciation to Mr. Thomas DeFiore of the FAA for the support to this program and to Dr. David Kim of ERAU who provided help in the acquisition of the recorded flight data.
iii/iv
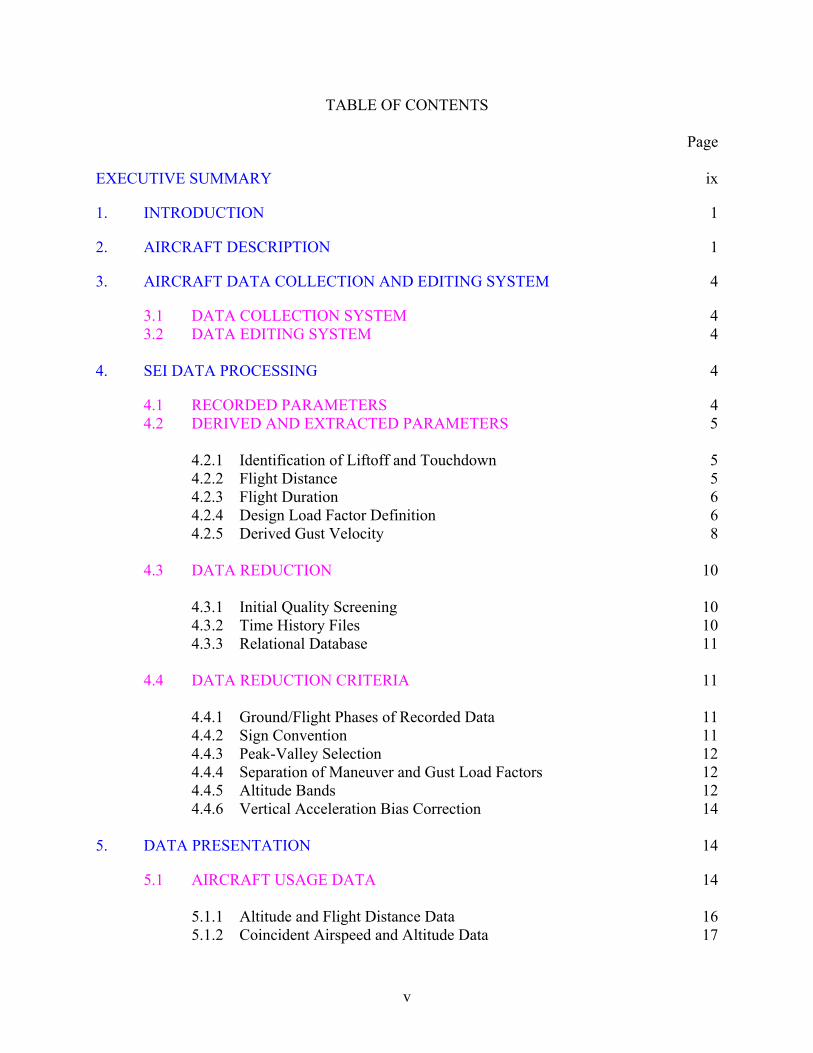
TABLE OF CONTENTS Page EXECUTIVE SUMMARY ix
1. INTRODUCTION 1
2. AIRCRAFT DESCRIPTION 1
3. AIRCRAFT DATA COLLECTION AND EDITING SYSTEM 4
3.1 DATA COLLECTION SYSTEM 4 3.2 DATA EDITING SYSTEM 4
4. SEI DATA PROCESSING 4
4.1 RECORDED PARAMETERS 4 4.2 DERIVED AND EXTRACTED PARAMETERS 5
4.2.1 Identification of Liftoff and Touchdown 5 4.2.2 Flight Distance 5 4.2.3 Flight Duration 6 4.2.4 Design Load Factor Definition 6 4.2.5 Derived Gust Velocity 8
4.3 DATA REDUCTION 10
4.3.1 Initial Quality Screening 10 4.3.2 Time History Files 10 4.3.3 Relational Database 11
4.4 DATA REDUCTION CRITERIA 11
4.4.1 Ground/Flight Phases of Recorded Data 11 4.4.2 Sign Convention 11 4.4.3 Peak-Valley Selection 12 4.4.4 Separation of Maneuver and Gust Load Factors 12 4.4.5 Altitude Bands 12 4.4.6 Vertical Acceleration Bias Correction 14
5. DATA PRESENTATION 14
5.1 AIRCRAFT USAGE DATA 14 5.1.1 Altitude and Flight Distance Data 16 5.1.2 Coincident Airspeed and Altitude Data 17
v
5.1.3 Maximum Operating Airspeed Data 17 5.1.4 Flight Duration 17
5.2 GROUND LOADS DATA 17
5.2.1 Airspeed at Liftoff and Touchdown 18 5.2.2 Pitch Rate at Liftoff 18 5.2.3 Load Factor Data During Ground Operations 18
5.3 FLIGHT LOADS DATA 18
5.3.1 Gust Loads Data 18 5.3.2 Maneuver Loads Data 19 5.3.3 Combined Maneuver and Gust Loads Data 19
6. CONCLUSIONS AND RECOMMENDATIONS 20
7. REFERENCES 21
APPENDICES A�Statistical Formats, Aircraft Usage Data, All Aircraft B�Statistical Formats, Aircraft Usage Data, Daytona Aircraft C�Statistical Formats, Aircraft Usage Data, Prescott Aircraft
LIST OF FIGURES Figure Page 1 Cessna 172 Three-View Drawing 3 2 Description of Flight Phases 11
LIST OF TABLES Table Page 1 Cessna 172�Characteristics 2 2 Aircraft Dimensions 3 3 Altitude Bands 13 4 Flight Distance Ranges 13 5 Statistical Formats 15 6 Flight Characteristics of Surveyed Aircraft 20 7 Operational Load Monitoring Cessna 172 21
vi
LIST OF SYMBOLS AND ABBREVIATIONS A aircraft PSD gust response factor AN incremental load factor at operating weight (nz-1) ANLLF incremental gust or maneuver design load factor at maximum gross weight (nz- 1) Ar aspect ratio b2/S a speed of sound (ft/sec) a0 speed of sound at sea level (ft/sec) ACFS Airframe Cumulative Fatigue System ADX Air Data Transducer b wing span (ft) c wing mean geometric chord (ft) C aircraft discrete gust response factor
αlC wing lift curve slope per radian
maxlC maximum lift coefficient c.g. center of gravity D distance ERAU Embry-Riddle Aeronautical University F(PSD) continuous gust alleviation factor FAA Federal Aviation Administration fpm feet per minute ft feet g gravity constant, 32.17 ft/sec 2 GPS Global Positioning System Hp pressure altitude (ft) hrs hours K gust alleviation factor Kg discrete gust alleviation factor, 0.88 µ/(5.3 + µ) KCAS knots, calibrated airspeed KIAS knots, indicated airspeed kts knots L turbulence scale length (ft) lbs pounds m lift curve slope per radian M Mach number n load factor (g) N number of occurrences for Uσ (PSD gust procedure) nm nautical mile nz normal load factor (g) N0 number of zero crossings per nautical mile (PSD gust procedure) q dynamic pressure (lbs/ft2) ρ air density, slugs/ft3 (at altitude) ρ0 standard sea level air density 0.0023769 slugs/ft3
S wing area (ft2) SEI Systems & Electronics, Inc.
vii

µ airplane mass ratio, ( )α
ρ lCcgS/W2
Ude derived gust velocity (ft/sec, equivalent airspeed) Uσ continuous turbulence gust intensity (ft/sec, true airspeed) VB design speed for maximum gust VC design cruise speed VCAS calibrated airspeed VD design dive speed Ve equivalent airspeed VI indicated airspeed VNE maximum allowable operating airspeed VT true airspeed W gross weight (lbs)
viii

EXECUTIVE SUMMARY Systems & Electronics, Inc. (SEI) under Contract DTRS-57-93-C-00172 to the Federal Aviation Administration (FAA), which was Phase II of a Small Business Innovation Development Phase I initiative, conducted research and development as presented herein. The purpose of this research and development program was to manufacture a small, lightweight, low-cost recorder for loads monitoring of general aviation and commuter type aircraft to support the FAA Operational Loads Monitoring Program. The scope of activities performed involved the following: 1. Design, development, manufacturing, and test of a low-cost Airframe Cumulative Fatigue
System (ACFS),
2. Installation of the ACFS into a fleet of seven Cessna 172 aircraft owned and operated by Embry-Riddle Aeronautical University (ERAU),
3. Conduct aircraft usage data acquisition on seven Cessna 172 aircraft,
4. Define the effectiveness of ACFS in the data acquisition effort and any required design changes required for the ACFS, and
5. Provide the resultant processed data from the data acquisition effort in formats useful to the FAA.
Presented in this report are the description of the ACFS, the analysis and statistical summaries of the data collected from 1000 flights representing 1168 hours of Cessna 172 aircraft operational data. The end product from the data acquisition effort includes statistical information on acceleration, speeds, altitudes, and flight duration and distance.
ix/x

1. INTRODUCTION.
Systems & Electronics, Inc. (SEI) completed Phase II of a Federal Aviation Administration (FAA) sponsored Small Business Innovative Research (SBIR) initiative. This report includes a summary of the design, development, manufacturing, and test of a low-cost Airframe Cumulative Fatigue System (ACFS). This report also includes the results of the operational flight and ground load data survey. This report presents acquired, processed, and evaluated statistical flight load data from the Cessna 172 aircraft. The main objectives of this program were:
To design, develop, manufacture, and test a low-cost ACFS. •
•
•
To use the ACFS to acquire, evaluate, and utilize typical operational in-service data, which can be used in structural fatigue damage reliability analysis of the aircraft. To provide a basis to assess the structural condition of the aircraft in an attempt to evaluate any future improvement that may be necessary for the aircraft design.
This phase of the program involved the acquisition and analysis of operational flight and ground load data using the ACFS. The ACFS was installed on a fleet of seven Cessna 172 aircraft. SEI performed all the relevant tasks associated with data compilation, analysis, editing, and preparation of statistical flight load data results. This report is prepared in accordance with the format provided by the FAA and includes the statistical loads derived from recorded data obtained from seven aircraft. There were a total of about 1000 flights and about 1168 hours of operation. This report contains a brief description of the Cessna 172 aircraft followed by the processes used for data collection, editing, and processing. The statistical formats and aircraft flight usage data in the form of graphs are presented in the appendices. 2. AIRCRAFT DESCRIPTION.
The Cessna 172 is a single engine aircraft with a maximum cruise speed at altitude of 122 knots and a maximum range of about 580-687 nautical miles (nm). Table 1 summarizes certain operational characteristics of the Cessna 172 aircraft equipped with SEI�s airframe cumulative fatigue system. An overall view drawing of the aircraft is shown in figure 1, and the aircraft overall dimensions are presented in table 2.
1
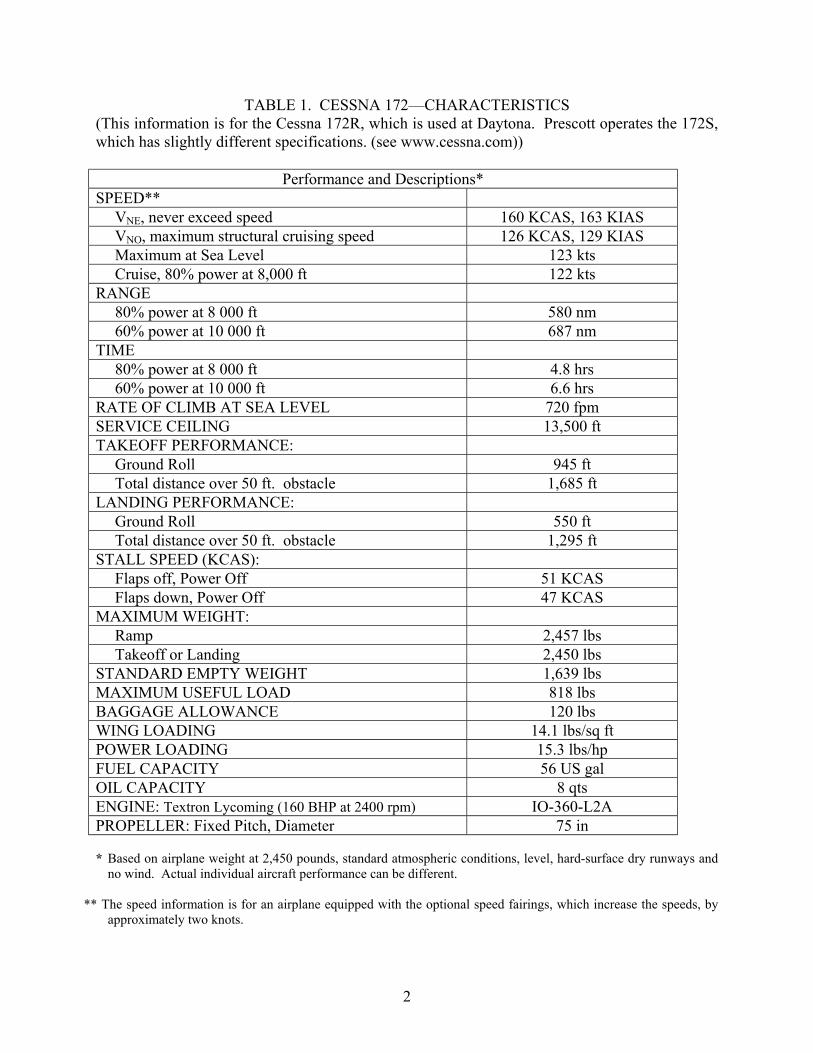
TABLE 1. CESSNA 172�CHARACTERISTICS (This information is for the Cessna 172R, which is used at Daytona. Prescott operates the 172S, which has slightly different specifications. (see www.cessna.com))
Performance and Descriptions* SPEED**
VNE, never exceed speed 160 KCAS, 163 KIAS VNO, maximum structural cruising speed 126 KCAS, 129 KIAS Maximum at Sea Level 123 kts Cruise, 80% power at 8,000 ft 122 kts
RANGE 80% power at 8 000 ft 580 nm 60% power at 10 000 ft 687 nm
TIME 80% power at 8 000 ft 4.8 hrs 60% power at 10 000 ft 6.6 hrs
RATE OF CLIMB AT SEA LEVEL 720 fpm SERVICE CEILING 13,500 ft TAKEOFF PERFORMANCE:
Ground Roll 945 ft Total distance over 50 ft. obstacle 1,685 ft
LANDING PERFORMANCE: Ground Roll 550 ft Total distance over 50 ft. obstacle 1,295 ft
STALL SPEED (KCAS): Flaps off, Power Off 51 KCAS Flaps down, Power Off 47 KCAS
MAXIMUM WEIGHT: Ramp 2,457 lbs Takeoff or Landing 2,450 lbs
STANDARD EMPTY WEIGHT 1,639 lbs MAXIMUM USEFUL LOAD 818 lbs BAGGAGE ALLOWANCE 120 lbs WING LOADING 14.1 lbs/sq ft POWER LOADING 15.3 lbs/hp FUEL CAPACITY 56 US gal OIL CAPACITY 8 qts ENGINE: Textron Lycoming (160 BHP at 2400 rpm) IO-360-L2A PROPELLER: Fixed Pitch, Diameter 75 in * Based on airplane weight at 2,450 pounds, standard atmospheric conditions, level, hard-surface dry runways and
no wind. Actual individual aircraft performance can be different.
** The speed information is for an airplane equipped with the optional speed fairings, which increase the speeds, by approximately two knots.
2

FIGURE 1. CESSNA 172 THREE-VIEW DRAWING [1]
TABLE 2. AIRCRAFT DIMENSIONS
INTERIOR DIMENSIONS (Cabin)
EXTERIOR DIMENSIONS (Overall)
Length: 142 inches Height: 48 inches Width: 39.5 inches
Length: 26 feet, 11 inches Height: 8 feet, 11 inches Wing Span: 36 feet, 1 inch
3
3. AIRCRAFT DATA COLLECTION AND EDITING SYSTEM.
3.1 DATA COLLECTION SYSTEM.
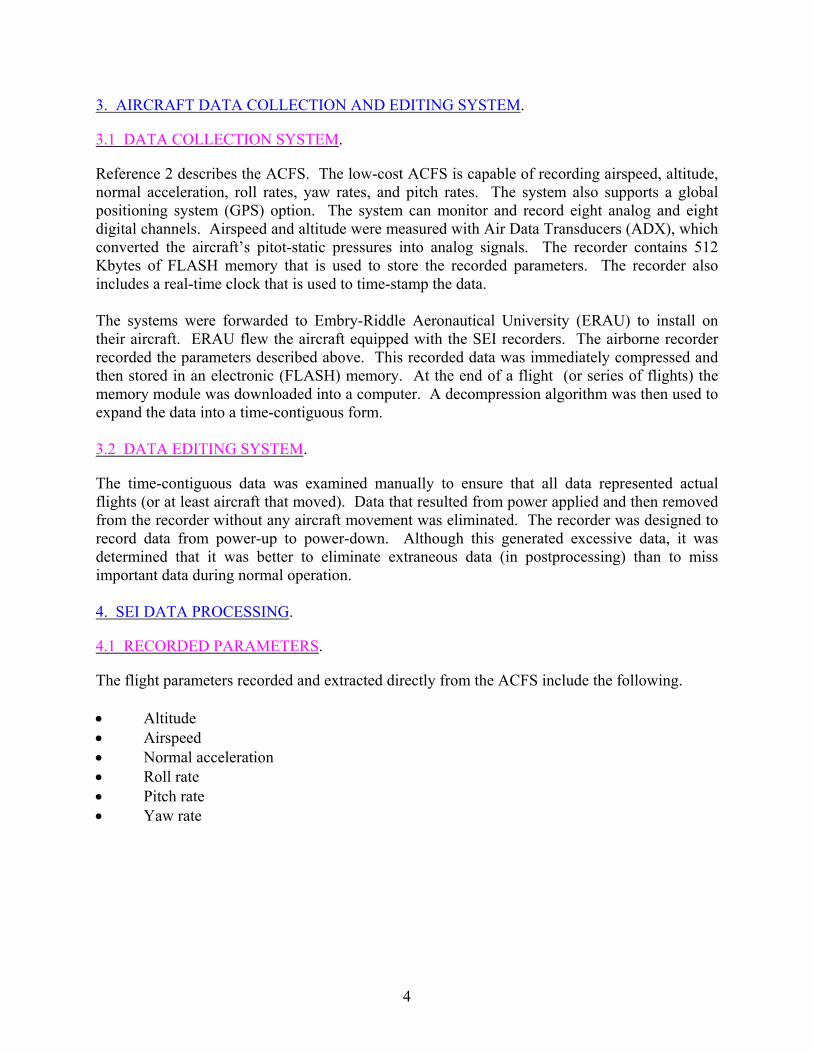
Reference 2 describes the ACFS. The low-cost ACFS is capable of recording airspeed, altitude, normal acceleration, roll rates, yaw rates, and pitch rates. The system also supports a global positioning system (GPS) option. The system can monitor and record eight analog and eight digital channels. Airspeed and altitude were measured with Air Data Transducers (ADX), which converted the aircraft�s pitot-static pressures into analog signals. The recorder contains 512 Kbytes of FLASH memory that is used to store the recorded parameters. The recorder also includes a real-time clock that is used to time-stamp the data. The systems were forwarded to Embry-Riddle Aeronautical University (ERAU) to install on their aircraft. ERAU flew the aircraft equipped with the SEI recorders. The airborne recorder recorded the parameters described above. This recorded data was immediately compressed and then stored in an electronic (FLASH) memory. At the end of a flight (or series of flights) the memory module was downloaded into a computer. A decompression algorithm was then used to expand the data into a time-contiguous form. 3.2 DATA EDITING SYSTEM.
The time-contiguous data was examined manually to ensure that all data represented actual flights (or at least aircraft that moved). Data that resulted from power applied and then removed from the recorder without any aircraft movement was eliminated. The recorder was designed to record data from power-up to power-down. Although this generated excessive data, it was determined that it was better to eliminate extraneous data (in postprocessing) than to miss important data during normal operation. 4. SEI DATA PROCESSING.
4.1 RECORDED PARAMETERS.
The flight parameters recorded and extracted directly from the ACFS include the following.
Altitude • • • • • •
Airspeed Normal acceleration Roll rate Pitch rate Yaw rate
4
4.2 DERIVED AND EXTRACTED PARAMETERS.
Several parameters were not directly recorded by the ACFS and had to be either derived or extracted from information on aircraft performance limits or from other flight parameters. These parameters are:
Flight time • • • • • • •
Flight distance Flight duration Flight phase Nz gust Nz maneuver Derived gust velocity
4.2.1 Identification of Liftoff and Touchdown.
The time of liftoff and touchdown was determined from the flight history. SEI examined the flight history of aircraft and used a rigorous quality assurance program to extract quality data. The ACFS recording system does not provide a weight-on-wheels signal. Changes recorded in normal acceleration (nZ), altitude, indicated airspeed and pitch rate were used as key incidences that can be used to identify the time of liftoff and touchdown. While light aircraft such as the Cessna 172 generally do not require a positive pitch rotation for takeoff, pitch rate was used because a significant change in pitch would likely only occur at or after the point at which the aircraft became airborne. The actual time at liftoff is determined from the pitch rate recorded in the �on-the-ground� data. A change in the pitch rate by more than two degrees per second is defined as liftoff. The time of this event is then recorded. The time of touchdown is measured by examining the changes in the airspeed, nZ, and altitude that indicate a contact with the runway. The pitch rate before and after this time is also used as an indicator of the touchdown occurrence. 4.2.2 Flight Distance.
The flight distance ( ) is obtained by numerically integrating true velocity (V ) from the time of liftoff ( ) to the time of touchdown ( ). V is the true average velocity during the time increment ( ∆ ).
D T
ot nt T
t
(1) ∑ ×∆=n
o
t
tTVtD
For a perfect speed indicator, the indicated airspeed equals the calibrated airspeed. In this report, the indicated airspeed is assumed to equal the calibrated airspeed. Assuming incompressible flow and neglecting the small effects at low Mach numbers, the true airspeed (V ) can be described as a function of calibrated airspeed (V ) and the square root of the ratio of air density at sea level ( ) to air density at altitude ( ).
T
CAS
0ρ ρ
5

Thus,
ρρ0
CAST VV = (2)
For altitudes below 36,089 feet, the density, , is expressed as a function of altitude based on the International Standard Atmosphere by
ρ
(3) ( ) 256.46
0 10876.61 pH××−= −ρρ where is air density at sea level (0.0023769 slugs/ft0ρ 3) and is pressure altitude (ft). Pressure altitude is a recorded parameter.
pH
4.2.3 Flight Duration.
The flight duration is defined as the time from aircraft liftoff to touchdown. 4.2.4 Design Load Factor Definition.
The gust and maneuver load spectra specified in Department of Transportation Report AFS-120-73-2 [3], are expressed in terms of a load factor ratio, ANLLF. AFS-120-73-2 defines this ratio as the incremental load factor at operating weight divided by the incremental design limit load factor at maximum gross weight. Therefore, in order to compare the Cessna 172 gust and maneuver flight load factor spectra with the AFS-120-73-2 flight load spectra, the aircraft design limit load factor for gust had to be estimated. For the gust spectra comparison, the incremental gust design limit load factor is specified in AFS120-73-2 as follows:
SW
KVmANLLF /49830
×= (4)
( )41
/21 SWK = for SW 16/ < (5) psf
( )
−=
43
/
67.233.1SW
K for W (6)
psfS 16/ >
V = Airplane design cruising speed Vc, knots m = Lift curve slope, per radian LC
SW / = Wing loading at maximum gross weight, psf
6
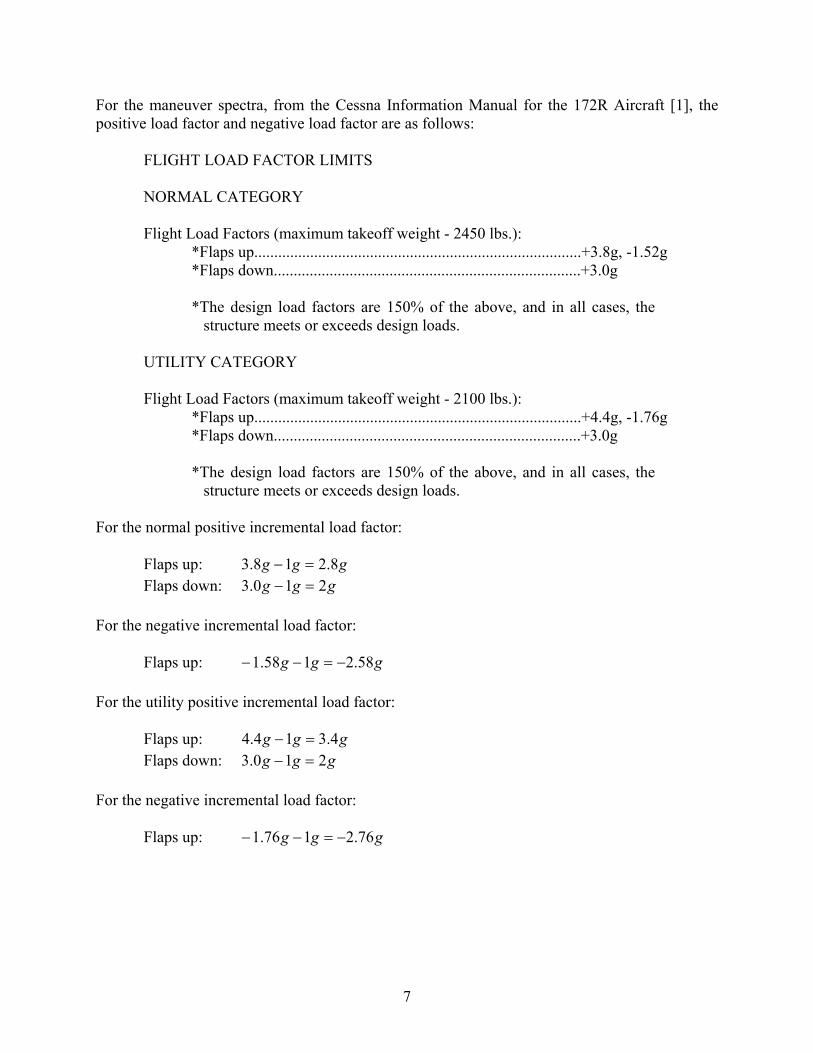
For the maneuver spectra, from the Cessna Information Manual for the 172R Aircraft [1], the positive load factor and negative load factor are as follows:
FLIGHT LOAD FACTOR LIMITS NORMAL CATEGORY Flight Load Factors (maximum takeoff weight - 2450 lbs.):
*Flaps up..................................................................................+3.8g, -1.52g *Flaps down.............................................................................+3.0g *The design load factors are 150% of the above, and in all cases, the
structure meets or exceeds design loads. UTILITY CATEGORY Flight Load Factors (maximum takeoff weight - 2100 lbs.):
*Flaps up..................................................................................+4.4g, -1.76g *Flaps down.............................................................................+3.0g *The design load factors are 150% of the above, and in all cases, the
structure meets or exceeds design loads.
For the normal positive incremental load factor: Flaps up: 3 ggg 8.218. =− Flaps down: 3 ggg 210. =− For the negative incremental load factor: Flaps up: − ggg 58.2158.1 −=− For the utility positive incremental load factor: Flaps up: 4 ggg 4.314. =− Flaps down: 3 ggg 210. =− For the negative incremental load factor: Flaps up: − ggg 76.2176.1 −=−
7
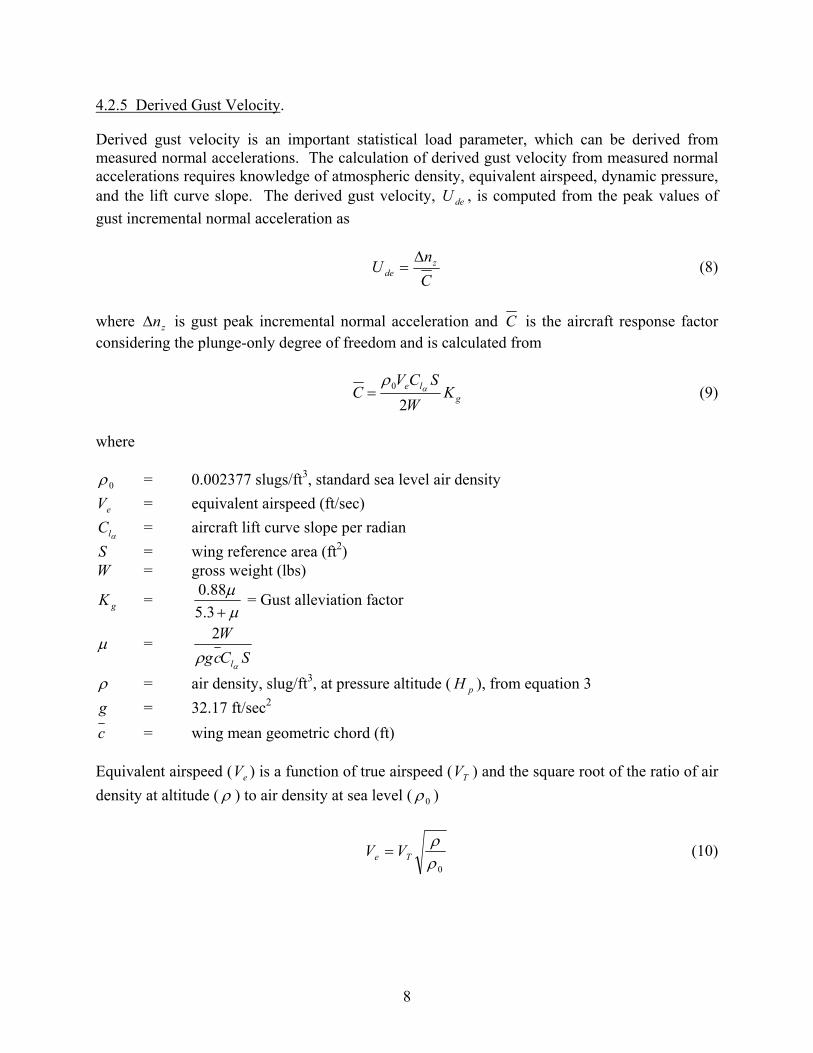
4.2.5 Derived Gust Velocity.
Derived gust velocity is an important statistical load parameter, which can be derived from measured normal accelerations. The calculation of derived gust velocity from measured normal accelerations requires knowledge of atmospheric density, equivalent airspeed, dynamic pressure, and the lift curve slope. The derived gust velocity, U , is computed from the peak values of gust incremental normal acceleration as
de
CnU z
de∆
= (8)
where is gust peak incremental normal acceleration and zn∆ C is the aircraft response factor considering the plunge-only degree of freedom and is calculated from
gle K
WSCV
C2
0 αρ
= (9)
where
0ρ
eV
αlCSW
= 0.002377 slugs/ft3, standard sea level air density = equivalent airspeed (ft/sec) = aircraft lift curve slope per radian
= wing reference area (ft2) = gross weight (lbs)
gK = µµ
+3.588.0 = Gust alleviation factor
= µSCcg
W
lαρ
2
ρ = air density, slug/ft3, at pressure altitude ( ), from equation 3 pHg = 32.17 ft/sec2
c = wing mean geometric chord (ft) Equivalent airspeed (V ) is a function of true airspeed (V ) and the square root of the ratio of air density at altitude ( ) to air density at sea level ( )
e T
ρ 0ρ
0ρ
ρTe VV = (10)
8
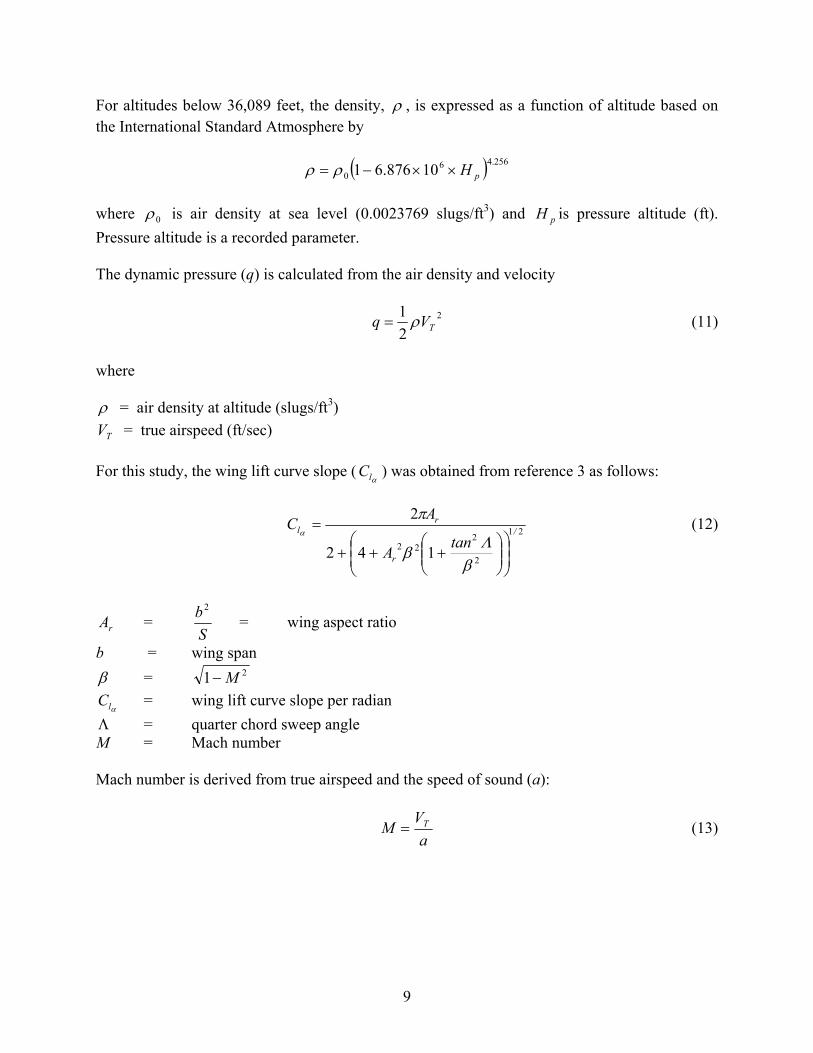
For altitudes below 36,089 feet, the density, , is expressed as a function of altitude based on the International Standard Atmosphere by
ρ
( 256.46
0 10876.61 pH××−= ρρ ) where is air density at sea level (0.0023769 slugs/ft0ρ 3) and is pressure altitude (ft). Pressure altitude is a recorded parameter.
pH
The dynamic pressure (q) is calculated from the air density and velocity
2
21
TVq ρ= (11)
where ρ = air density at altitude (slugs/ft3)
TV = true airspeed (ft/sec) For this study, the wing lift curve slope ( ) was obtained from reference 3 as follows:
αlC
21
2
222 142
2/
r
rl
tanA
AC
+++
=
βΛ
β
πα
(12)
rA = Sb2
= wing aspect ratio
b = wing span β = 21 M−
αlC = wing lift curve slope per radian Λ = quarter chord sweep angle M = Mach number Mach number is derived from true airspeed and the speed of sound (a):
a
VM T= (13)
9

The speed of sound (a) is a function of pressure altitude ( ) and the speed of sound at sea level and is
pH
( )pHaa ××−= −6
0 10876.61 (14) thus
( )p
T
Ha
VM××−
=6
0 10876.61
where the speed of sound at sea level is 1116.4 fps or 661.5 knots. 0a Equation 12 provides an estimate of the wing lift curve slope. Airplane gust response calculations are based on the use of the airplane lift curve slope. Reference 3 uses an average factor of 1.15 to represent the ratio between the BE-1900D airplane lift curve slope and the wing lift curve slope. However, a more appropriate value for the Cessna 172 is 1.07, and this value will be used for derived gust velocity computations. In this case, the wing lift curve slope, , is the untrimmed rigid lift curve slope for the entire aircraft.
αlC
4.3 DATA REDUCTION.
The following paragraphs describe the procedures SEI used to process the recorded parameters. 4.3.1 Initial Quality Screening.
All incoming data files are screened for missing or incomplete data before being accepted into the final database. Individual flights are edited to remove erroneous or meaningless data such as discontinuous elapsed time data, evidence of nonfunctional channels or sensors, multiple flights on one file, and incomplete flight phases. Flight files with missing or incomplete data are identified and rejected from the final database. The data generated by the ground processing software in section 4.1 was once again examined manually. Values that were obviously erroneous were removed. For example, occasionally there would be an airspeed value of 500 knots or an altitude of 20,000 feet. Values such as these could have been generated as a result of a noise spike and were subsequently eliminated.
4.3.2 Time History Files.
A Microsoft Corporation (MS) Visual Basic for Applications (VBA) program was written to run in MS Excel to read the data generated by the ground processing software in section 4.1 into spreadsheets and tabulate/reduce the data, which was then plotted using Synergy KaleidaGraph. This data is presented in appendices A through C.
10

4.3.3 Relational Database.
Important characteristics about each set of flights are recorded in a relational database. Aircraft location, aircraft tail number, and other data are in the database. Each flight was identified uniquely. 4.4 DATA REDUCTION CRITERIA.
To process the measured data into statistical flight loads format, specific data reduction criteria were established for each parameter. These criteria are discussed in this section. 4.4.1 Ground/Flight Phases of Recorded Data.
The in-flight duration is defined as the time from liftoff to touchdown. Within the recorded data, nine different operational phases are identified. These include: 1. Taxi out 2. Takeoff roll 3. Departure 4. Climb 5. Cruise 6. Descent 7. Approach 8. Landing roll 9. Taxi in Figure 2 illustrates a profile of these nine phases. The best combination of the airspeed, altitude, pitch rate, and the normal acceleration can identify the change from one phase to the other.
98 7
6
5
4
321
FIGURE 2. DESCRIPTION OF FLIGHT PHASES
4.4.2 Sign Convention.
Acceleration data are recorded in the normal (z) direction. The positive direction is up. The positive pitch rate direction is nose up. The positive roll rate direction is to the right (right wing down). The positive yaw rate direction is to the right (nose right).
11
4.4.3 Peak-Valley Selection.
Normal acceleration was recorded with a count range of 256 representing an acceleration range of ±5 g. To identify peaks and valleys in postprocessing, a deadband was established of ±1 count (10 g/256 or 0.039 g) around the 1-g value. A peak or valley is verified as the maximum excursion outside of the deadband prior to the acceleration data crossing into or through the deadband. 4.4.4 Separation of Maneuver and Gust Load Factors.
The incremental acceleration measured at the center of gravity (c.g.) of the aircraft may be the result of either maneuvers or gusts. In order to derive gust and maneuver statistics, the maneuver induced acceleration and gust response accelerations must be separated from the total acceleration history. Reference 3 cites a study to evaluate methods of separating maneuver and gust load factors from measured acceleration time histories. As a result of this study, it was recommended and accepted by the FAA that a cycle duration rule be used to separate gusts and maneuvers. A cycle duration of 1.0 seconds was recommended for use with Cessna 172 aircraft. In order to avoid the inclusion of peaks and valleys associated with very small load variations that are insignificant to the aircraft structure, a deadband zone of g was established. An algorithm was then developed to extract the acceleration peaks and valleys.
05.0±=∆ zn
For each flight, the maximum and minimum total accelerations were determined from just after liftoff to just before touchdown. For the in-flight phases, the ∆ cumulative occurrences were determined as cumulative counts per nautical mile and cumulative counts per 1000 hours using the peak-between-means counting method as done in reference 3. The measurements of ∆ ,
, and are maintained as three unique data streams. The , , and data are plotted as cumulative occurrences of a given acceleration increment per nautical mile and per 1000 flight hours. The incremental normal load factor is the airplane limit load factor minus 1.0 g. As a result of the threshold zone, only accelerations greater than ±0.05 g (measured from a 1.0-g base) are counted for data presentation.
zn
z
zn
gustzn∆manzn∆ zn∆
gustzn∆manzn∆
n∆
4.4.5 Altitude Bands.
In preparing the data summaries, the maximum altitude ranges as summarized in table 3 are used.
12

TABLE 3. ALTITUDE BANDS
Altitude Bands Band Number Altitude Range (ft)
1 0-500 2 500-1,000 3 1,000-1,500 4 1,500-2,000 5 2,000-2,500 6 2,500-3,000 7 3,000-3,500 8 3,500-4,000 9 4,000-4,500
10 4,500-5,000 11 5,000-5,500 12 5,500-6,000 13 6,000-6,500 14 6,500-7,000 15 7,000-7,500 16 7,500-8,000 17 8,000-8,500 18 8,500-9,000 19 9,000-9,500 20 9,500-10,000 21 10,000-10,500 22 10,500-11,000 23 11,000-11,500 24 11,500-12,000 25 12,000-12,500 26 12,500-13,000 27 13,000-13,500 28 13,500-14,000 29 14,000-14,500 30 14,500-15,000
The flight distances were grouped in six ranges as summarized in table 4.
TABLE 4. FLIGHT DISTANCE RANGES (nm)
Distance Bands Range Number Distance (nm)
1 0-50 2 50-100 3 100-150 4 150-200 5 200-250 6 >250
13
4.4.6 Vertical Acceleration Bias Correction.
For a flight, any bias occurring in the vertical (i.e., normal) acceleration measurement is removed by adjusting the difference between a known 1-g level and the actual acceleration recorded value. That is to say, bias was determined by noting the recorded vertical acceleration value while the aircraft was at rest. This difference is the correction/bias that will be added/subtracted from all measured load factor values for the flight. 5. DATA PRESENTATION.
This section presents statistical summaries of aircraft usage data, ground loads data, and flight loads data collected from the Cessna 172 aircraft during typical training usage. Statistical data are presented for parameters such as gust and maneuver acceleration, airspeed, altitude, flight duration and distance, derived gust velocity, V-n diagrams, and vertical acceleration during ground operations. These data were reduced and processed into statistical formats that are typically used in presenting this type of data. These data can then be used by the FAA and the aircraft manufacturer to assess existing certification criteria contained in the FAA�s Federal Aviation Regulation (FAR) or by the aircraft manufacturer to better understand and control those factors that influence the structural integrity of the aircraft. During data editing, it was found that the recorded data for certain flights/aircraft exhibited random errors and were unreliable. When this occurred, statistical data for any parameters associated, directly or indirectly, with the unreliable measurements from those flights and in some cases all data from that aircraft were eliminated from the database. Table 5 contains a list of the statistical data formats and identifies the corresponding figure where the processed data plot or table can be found in appendices A, B, and C. Appendix A includes all aircraft, appendix B includes aircraft based at Daytona, and appendix C includes aircraft based at Prescott. The figure numbers shown in the format �-n� are in each appendix as A-n, B-n, and C-n. The figures have been grouped into categories identified as aircraft usage, ground loads, flight loads, gust loads, maneuver loads, combined maneuver, and gust loads. Each figure is discussed in the following paragraphs. 5.1 AIRCRAFT USAGE DATA.
The aircraft usage data include flight profile statistics such as altitudes, speeds, and flight distance information. This information is useful for deriving typical flight profiles; for defining loading spectra for structural fatigue, durability, and damage tolerance analyses; and for developing future design criteria. Aircraft usage data are presented in figures A-, B-, and C-1 through A-, B-, and C-10.
14
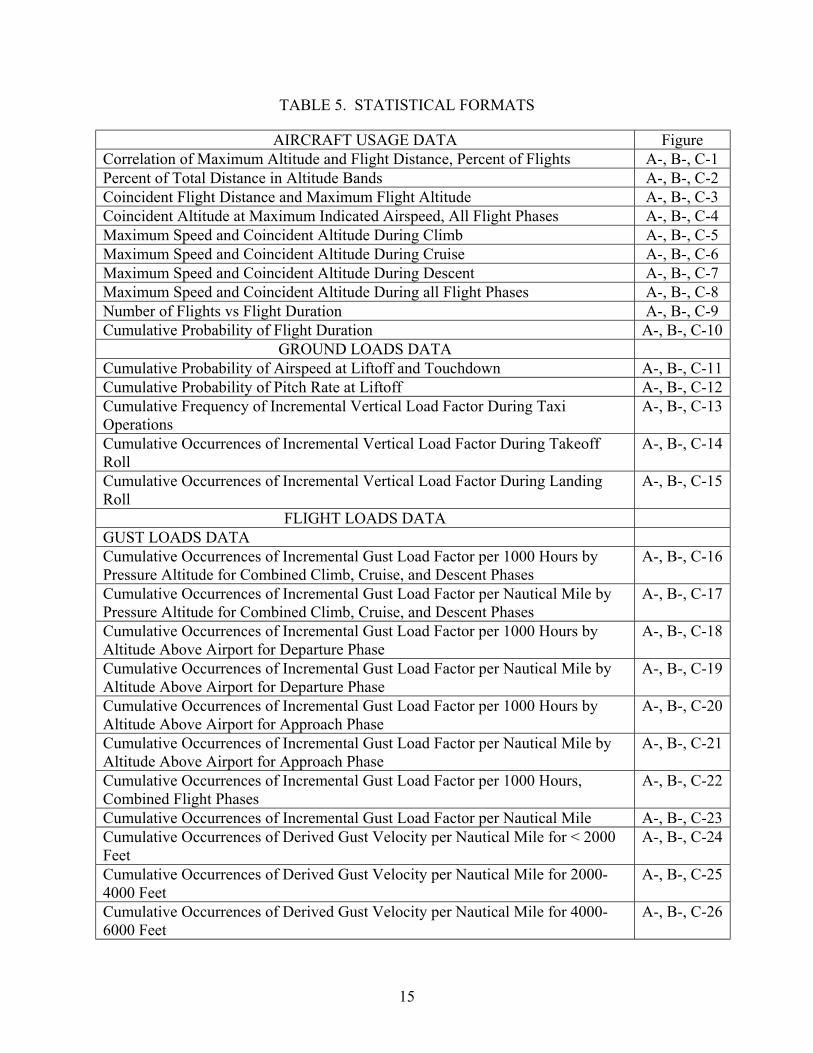
TABLE 5. STATISTICAL FORMATS
AIRCRAFT USAGE DATA Figure Correlation of Maximum Altitude and Flight Distance, Percent of Flights A-, B-, C-1 Percent of Total Distance in Altitude Bands A-, B-, C-2 Coincident Flight Distance and Maximum Flight Altitude A-, B-, C-3 Coincident Altitude at Maximum Indicated Airspeed, All Flight Phases A-, B-, C-4 Maximum Speed and Coincident Altitude During Climb A-, B-, C-5 Maximum Speed and Coincident Altitude During Cruise A-, B-, C-6 Maximum Speed and Coincident Altitude During Descent A-, B-, C-7 Maximum Speed and Coincident Altitude During all Flight Phases A-, B-, C-8 Number of Flights vs Flight Duration A-, B-, C-9 Cumulative Probability of Flight Duration A-, B-, C-10
GROUND LOADS DATA Cumulative Probability of Airspeed at Liftoff and Touchdown A-, B-, C-11 Cumulative Probability of Pitch Rate at Liftoff A-, B-, C-12 Cumulative Frequency of Incremental Vertical Load Factor During Taxi Operations
A-, B-, C-13
Cumulative Occurrences of Incremental Vertical Load Factor During Takeoff Roll
A-, B-, C-14
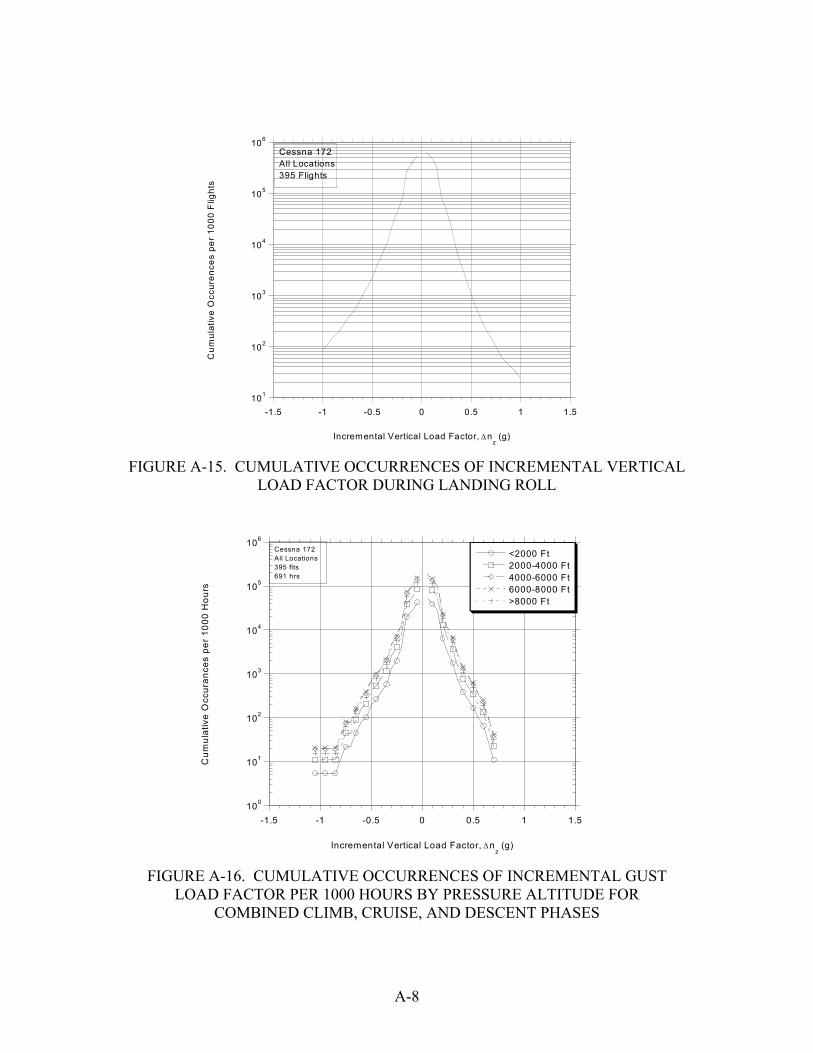
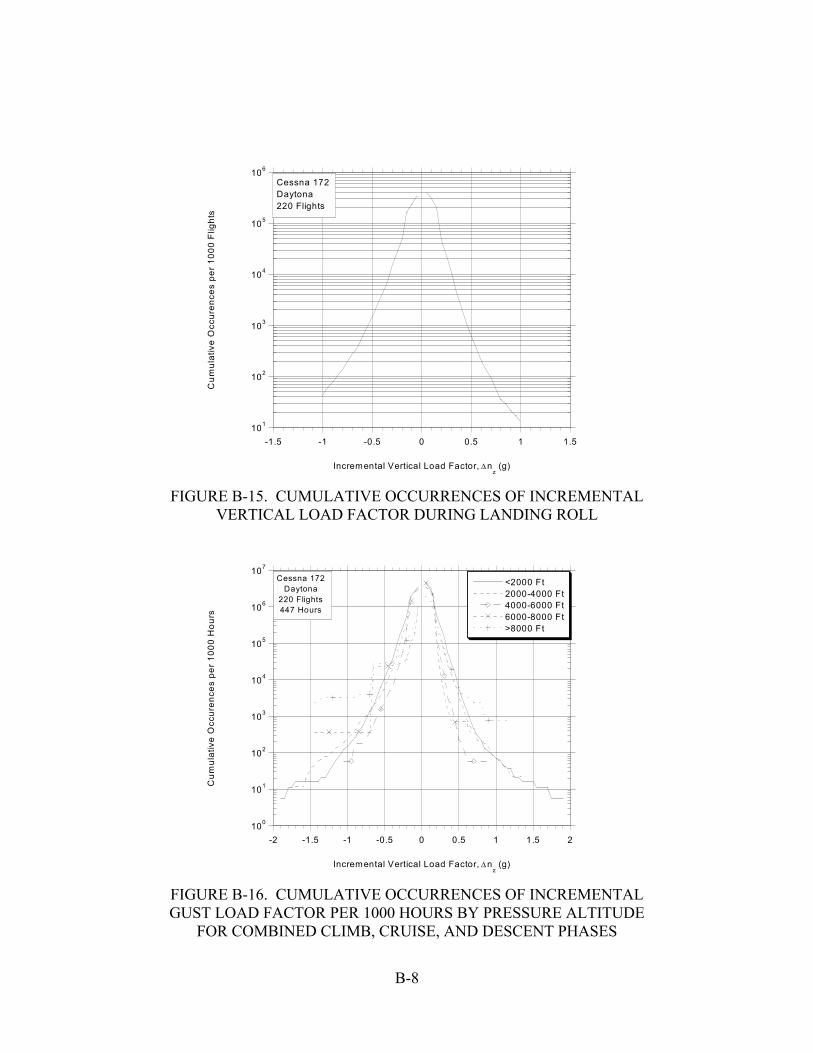
Cumulative Occurrences of Incremental Vertical Load Factor During Landing Roll
A-, B-, C-15
FLIGHT LOADS DATA GUST LOADS DATA Cumulative Occurrences of Incremental Gust Load Factor per 1000 Hours by Pressure Altitude for Combined Climb, Cruise, and Descent Phases
A-, B-, C-16
Cumulative Occurrences of Incremental Gust Load Factor per Nautical Mile by Pressure Altitude for Combined Climb, Cruise, and Descent Phases
A-, B-, C-17
Cumulative Occurrences of Incremental Gust Load Factor per 1000 Hours by Altitude Above Airport for Departure Phase
A-, B-, C-18
Cumulative Occurrences of Incremental Gust Load Factor per Nautical Mile by Altitude Above Airport for Departure Phase
A-, B-, C-19
Cumulative Occurrences of Incremental Gust Load Factor per 1000 Hours by Altitude Above Airport for Approach Phase
A-, B-, C-20
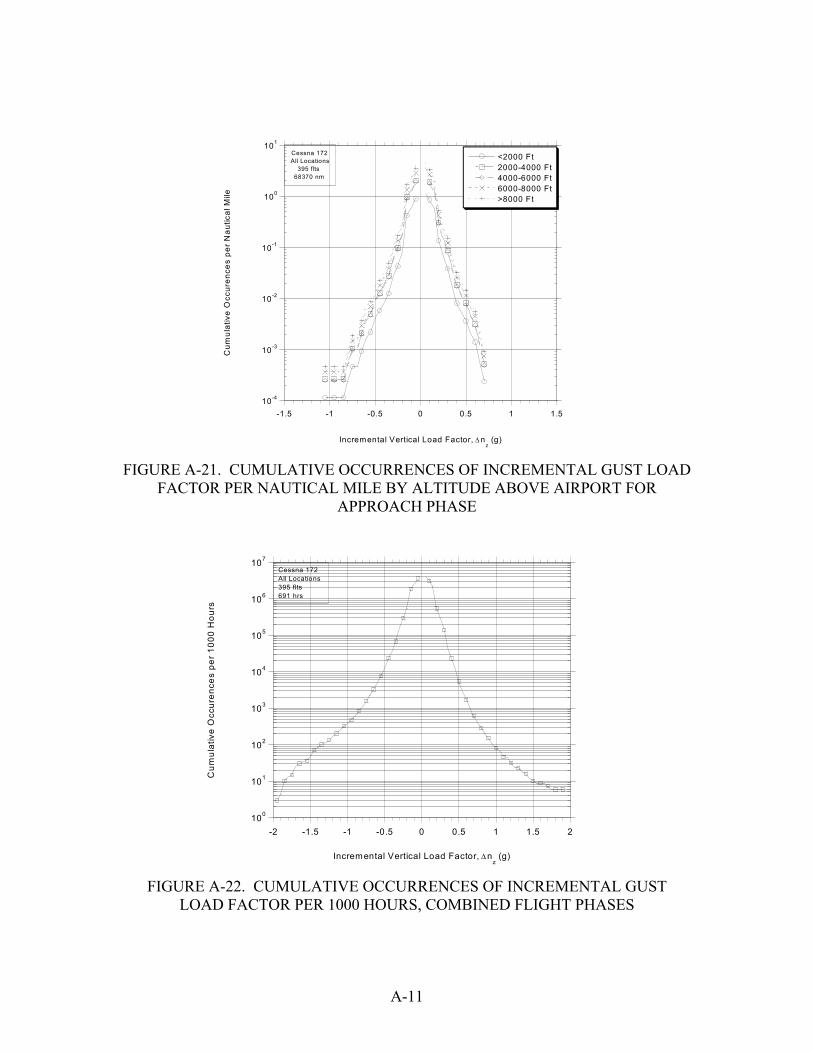
Cumulative Occurrences of Incremental Gust Load Factor per Nautical Mile by Altitude Above Airport for Approach Phase
A-, B-, C-21
Cumulative Occurrences of Incremental Gust Load Factor per 1000 Hours, Combined Flight Phases
A-, B-, C-22
Cumulative Occurrences of Incremental Gust Load Factor per Nautical Mile A-, B-, C-23 Cumulative Occurrences of Derived Gust Velocity per Nautical Mile for < 2000 Feet
A-, B-, C-24
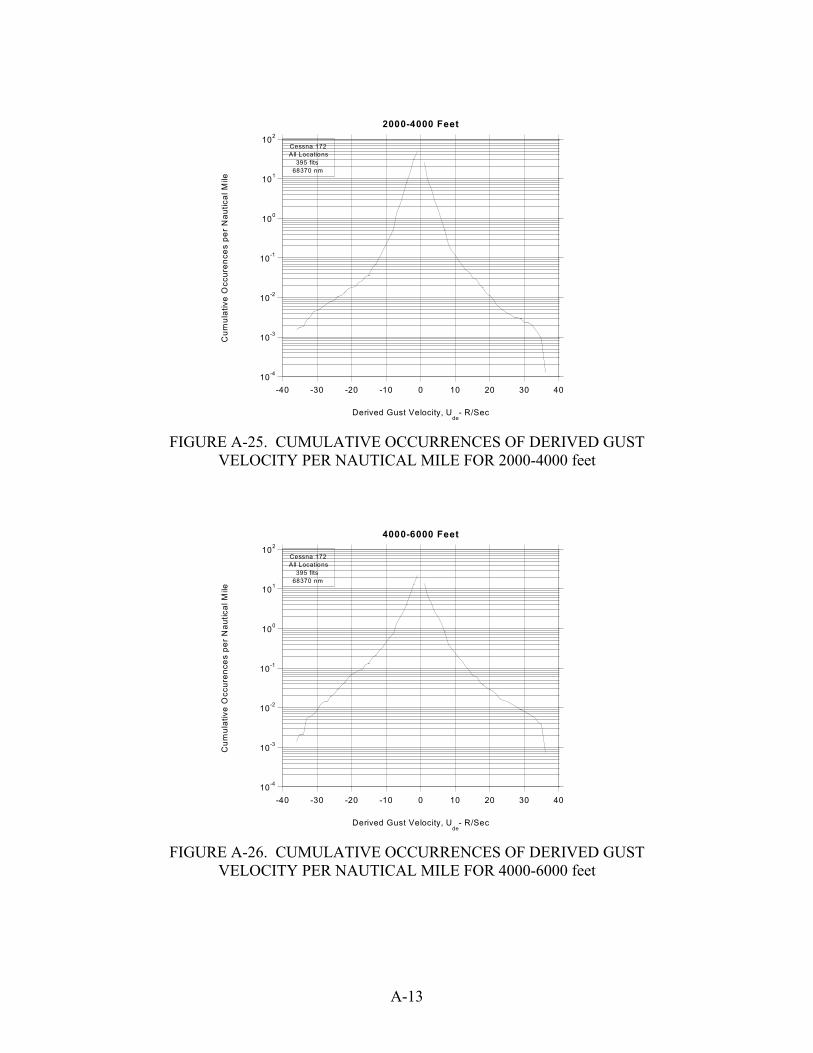
Cumulative Occurrences of Derived Gust Velocity per Nautical Mile for 2000-4000 Feet
A-, B-, C-25
Cumulative Occurrences of Derived Gust Velocity per Nautical Mile for 4000-6000 Feet
A-, B-, C-26
15

TABLE 5. STATISTICAL FORMATS (Continued)
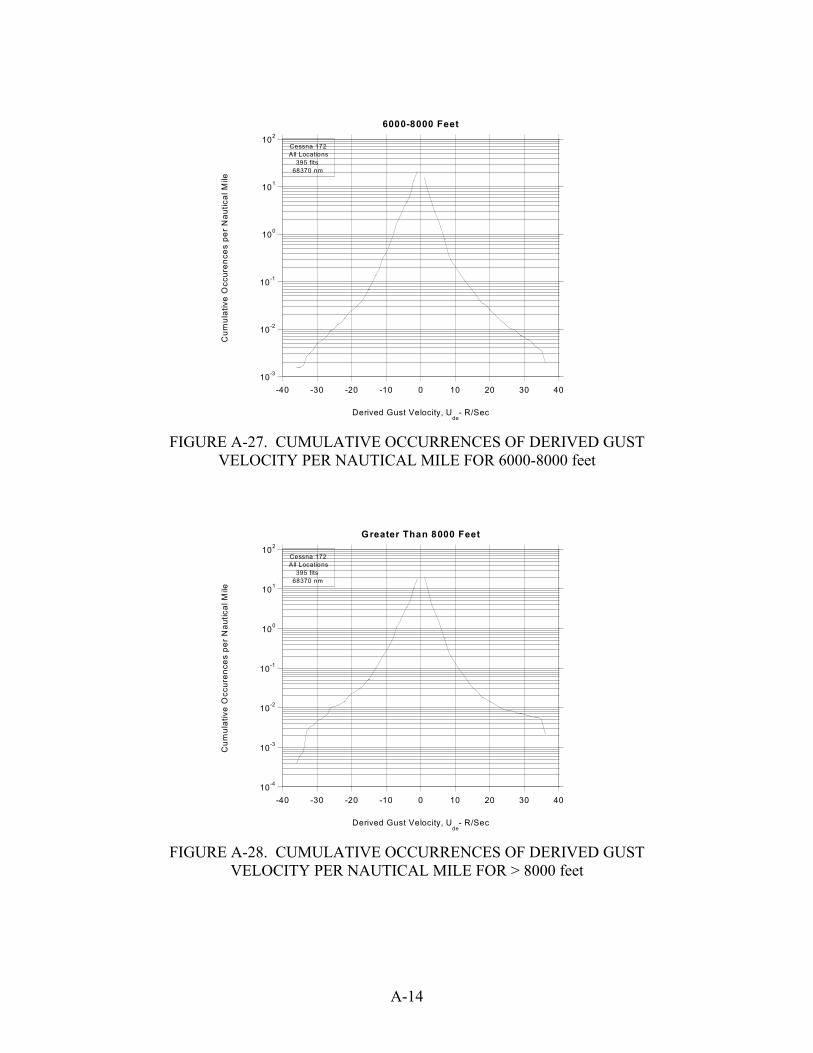
FLIGHT LOADS DATA (Continued) Figure GUST LOADS DATA (Continued) Cumulative Occurrences of Derived Gust Velocity per Nautical Mile for 6000-8000 Feet
A-, B-, C-27
Cumulative Occurrences of Derived Gust Velocity per Nautical Mile for >8000 Feet
A-, B-, C-28
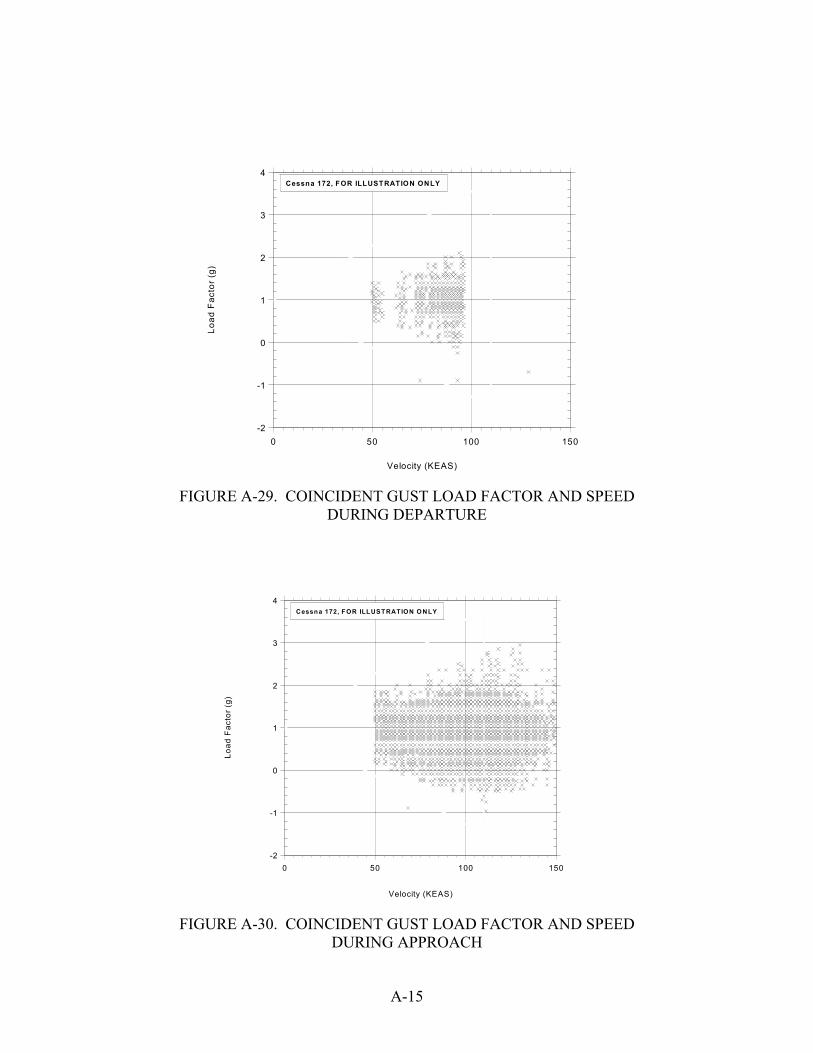
Coincident Gust Load Factor and Speed vs V-n Diagram During Departure A-, B-, C-29 Coincident Gust Load Factor and Speed vs V-n Diagram During Approach A-, B-, C-30
MANEUVER LOADS DATA Cumulative Occurrences of Incremental Maneuver Load Factor per 1000 Hours by Pressure Altitude for Combined Climb, Cruise, and Descent Phases
A-, B-, C-31
Cumulative Occurrences of Incremental Maneuver Load Factor per Nautical Mile by Pressure Altitude for Combined Climb, Cruise, and Descent Phases
A-, B-, C-32
Cumulative Occurrences of Incremental Maneuver Load Factor per 1000 Hours by Altitude Above Airport for Departure Phase
A-, B-, C-33
Cumulative Occurrences of Incremental Maneuver Load Factor per Nautical Mile by Altitude Above Airport for Departure Phase
A-, B-, C-34
Cumulative Occurrences of Incremental Maneuver Load Factor per 1000 Hours by Altitude Above Airport for Approach Phase
A-, B-, C-35
Cumulative Occurrences of Incremental Maneuver Load Factor per Nautical Mile by Altitude Above Airport for Approach Phase
A-, B-, C-36
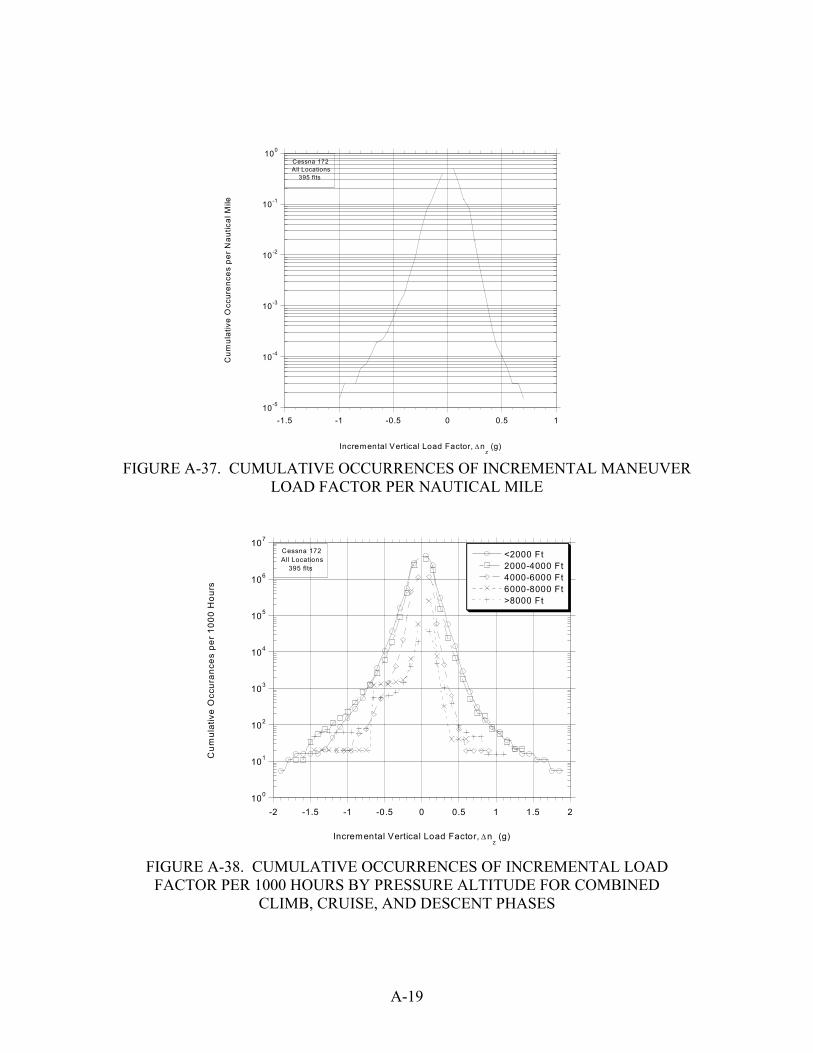
Comparison of Cumulative Occurrences of Incremental Maneuver Load Factor per Nautical Mile, Cessna 172 vs AFS-120-73-2
A-, B-, C-37
COMBINED MANEUVER AND GUST LOADS DATA Cumulative Occurrences of Incremental Load Factor per 1000 Hours by Pressure Altitude for Combined Climb, Cruise, and Descent Phases
A-, B-, C-38
Cumulative Occurrences of Incremental Load Factor per Nautical Mile by Pressure Altitude for Combined Climb, Cruise, and Descent Phases
A-, B-, C-39
Cumulative Occurrences of Incremental Load Factor per 1000 Hours by Altitude Above Airport for Departure Phase
A-, B-, C-40
Cumulative Occurrences of Incremental Load Factor per Nautical Mile by Altitude Above Airport for Departure Phase
A-, B-, C-41
Cumulative Occurrences of Incremental Load Factor per 1000 Hours by Altitude Above Airport for Approach Phase
A-, B-, C-42
Cumulative Occurrences of Incremental Load Factor per Nautical Mile by Altitude Above Airport for Approach Phase
A-, B-, C-43
Cumulative Occurrences of Incremental Load Factor per 1000 Hours for Combined Flight Phases
A-, B-, C-44
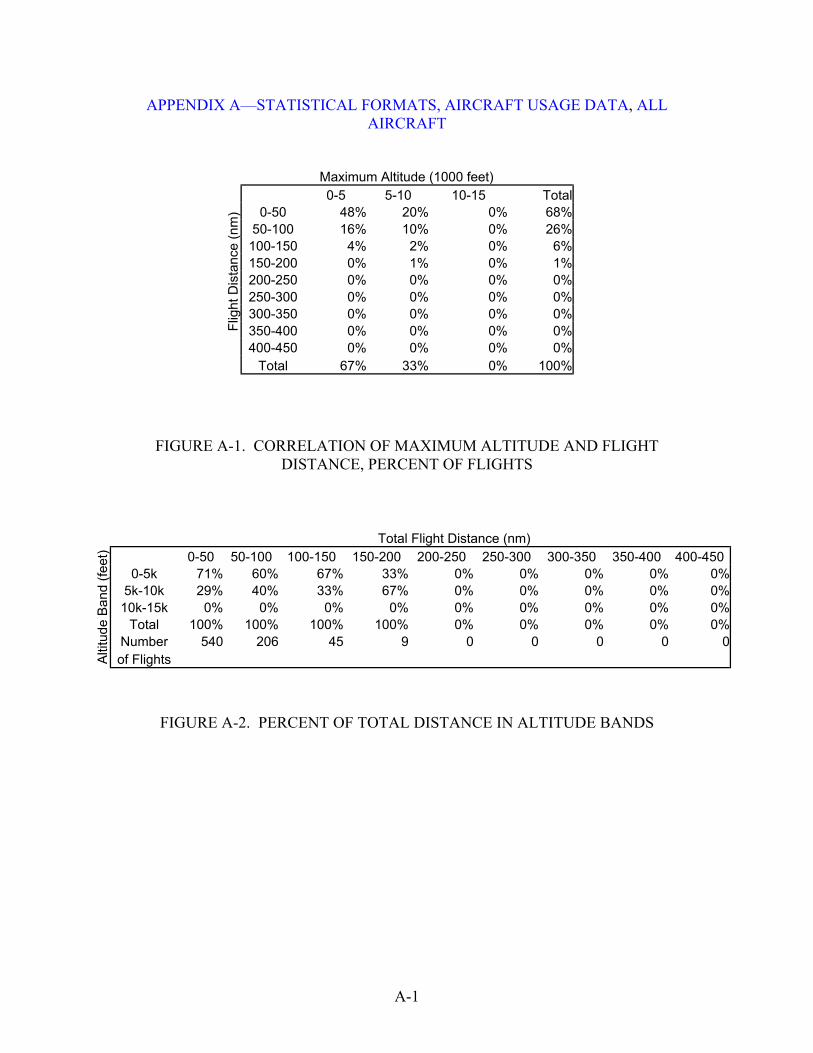
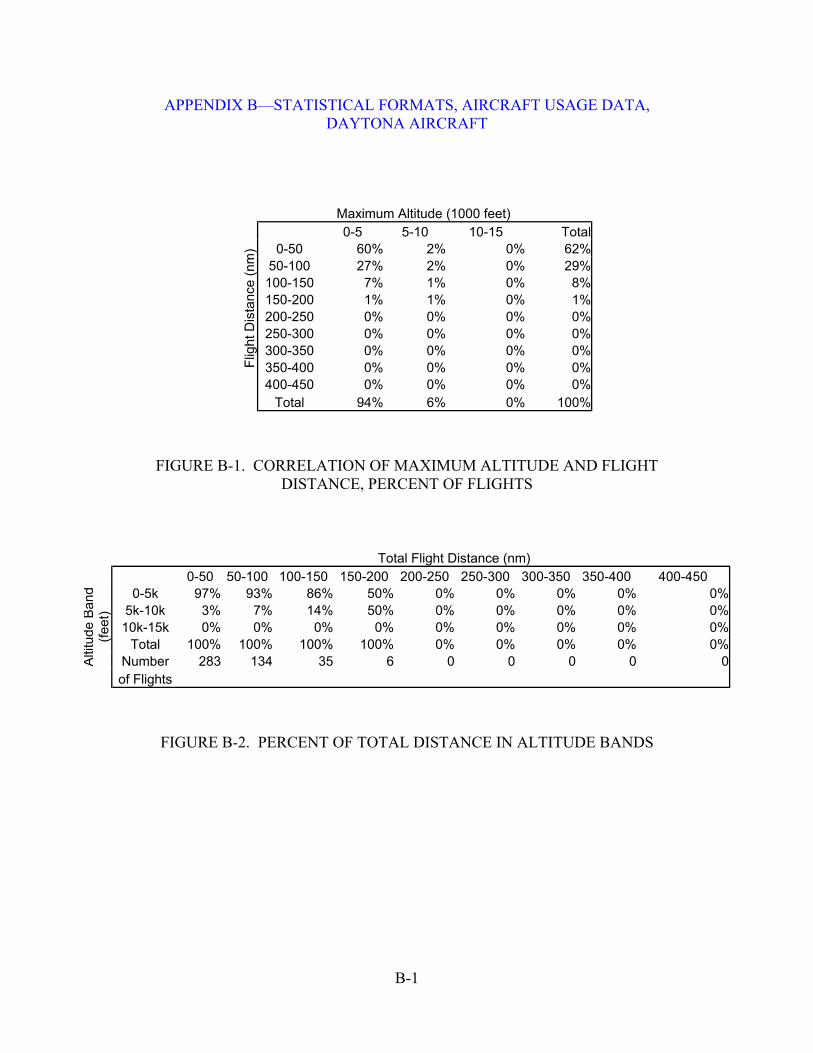
5.1.1 Altitude and Flight Distance Data.
Measured operational altitudes and their correlation to flight distance are presented. The table in figures A-, B-, and C-1 show the correlation between the maximum altitude attained in flight and the flight distance flown in percent of flights. Figures A-, B-, and C-2 present the percent of
16
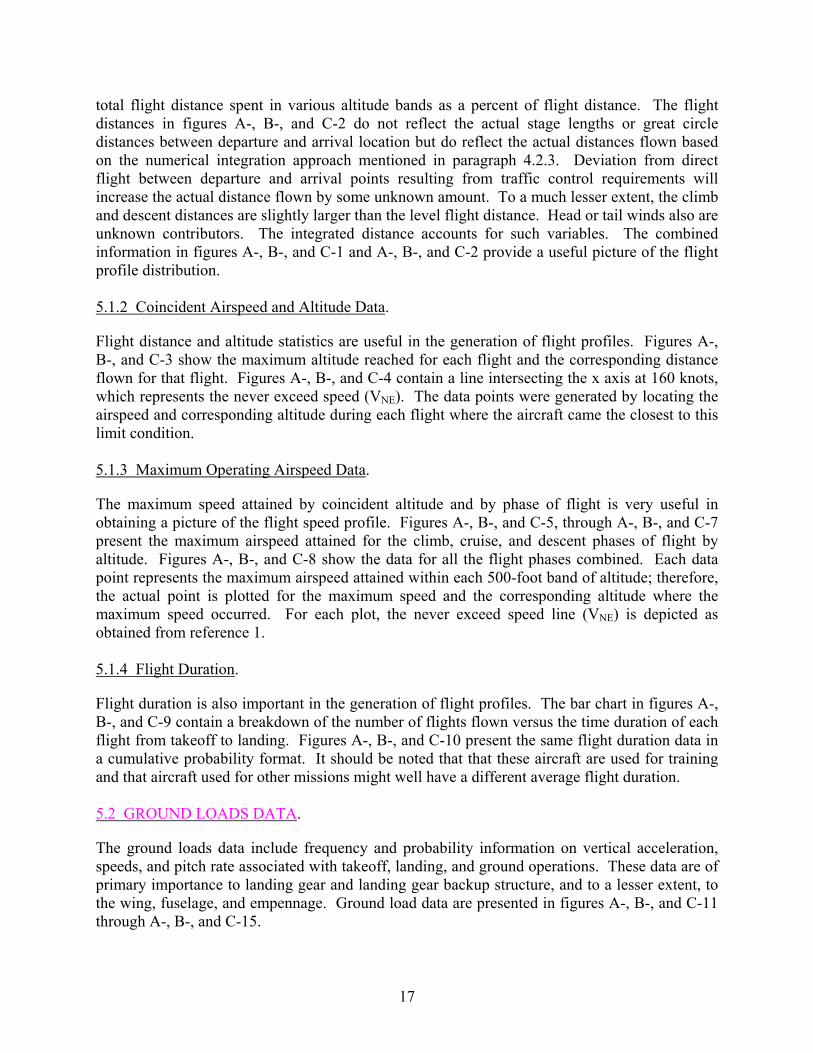
total flight distance spent in various altitude bands as a percent of flight distance. The flight distances in figures A-, B-, and C-2 do not reflect the actual stage lengths or great circle distances between departure and arrival location but do reflect the actual distances flown based on the numerical integration approach mentioned in paragraph 4.2.3. Deviation from direct flight between departure and arrival points resulting from traffic control requirements will increase the actual distance flown by some unknown amount. To a much lesser extent, the climb and descent distances are slightly larger than the level flight distance. Head or tail winds also are unknown contributors. The integrated distance accounts for such variables. The combined information in figures A-, B-, and C-1 and A-, B-, and C-2 provide a useful picture of the flight profile distribution. 5.1.2 Coincident Airspeed and Altitude Data.
Flight distance and altitude statistics are useful in the generation of flight profiles. Figures A-, B-, and C-3 show the maximum altitude reached for each flight and the corresponding distance flown for that flight. Figures A-, B-, and C-4 contain a line intersecting the x axis at 160 knots, which represents the never exceed speed (VNE). The data points were generated by locating the airspeed and corresponding altitude during each flight where the aircraft came the closest to this limit condition. 5.1.3 Maximum Operating Airspeed Data.
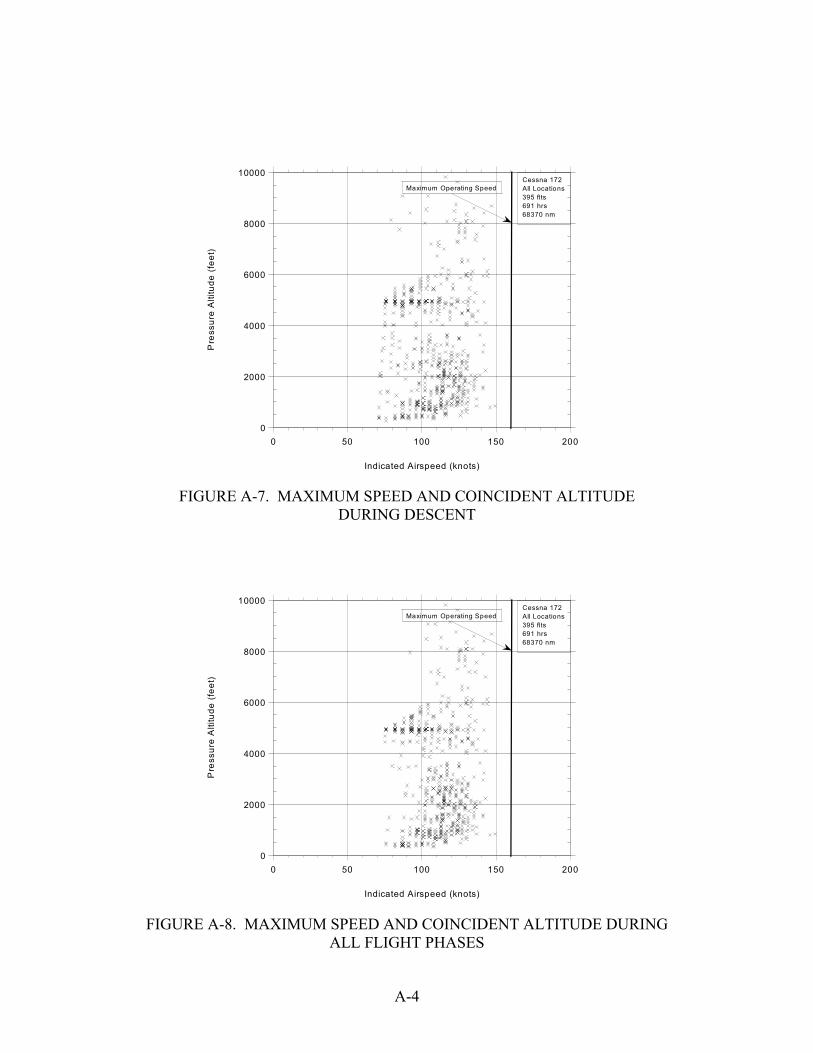
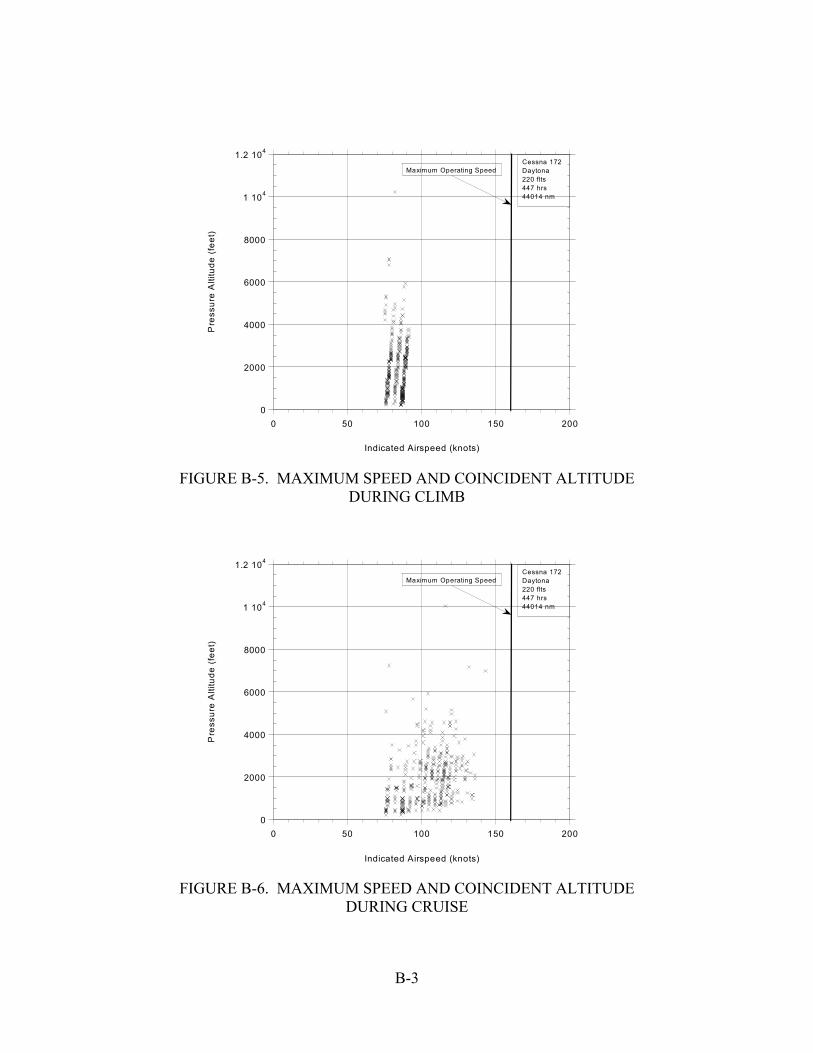
The maximum speed attained by coincident altitude and by phase of flight is very useful in obtaining a picture of the flight speed profile. Figures A-, B-, and C-5, through A-, B-, and C-7 present the maximum airspeed attained for the climb, cruise, and descent phases of flight by altitude. Figures A-, B-, and C-8 show the data for all the flight phases combined. Each data point represents the maximum airspeed attained within each 500-foot band of altitude; therefore, the actual point is plotted for the maximum speed and the corresponding altitude where the maximum speed occurred. For each plot, the never exceed speed line (VNE) is depicted as obtained from reference 1. 5.1.4 Flight Duration.
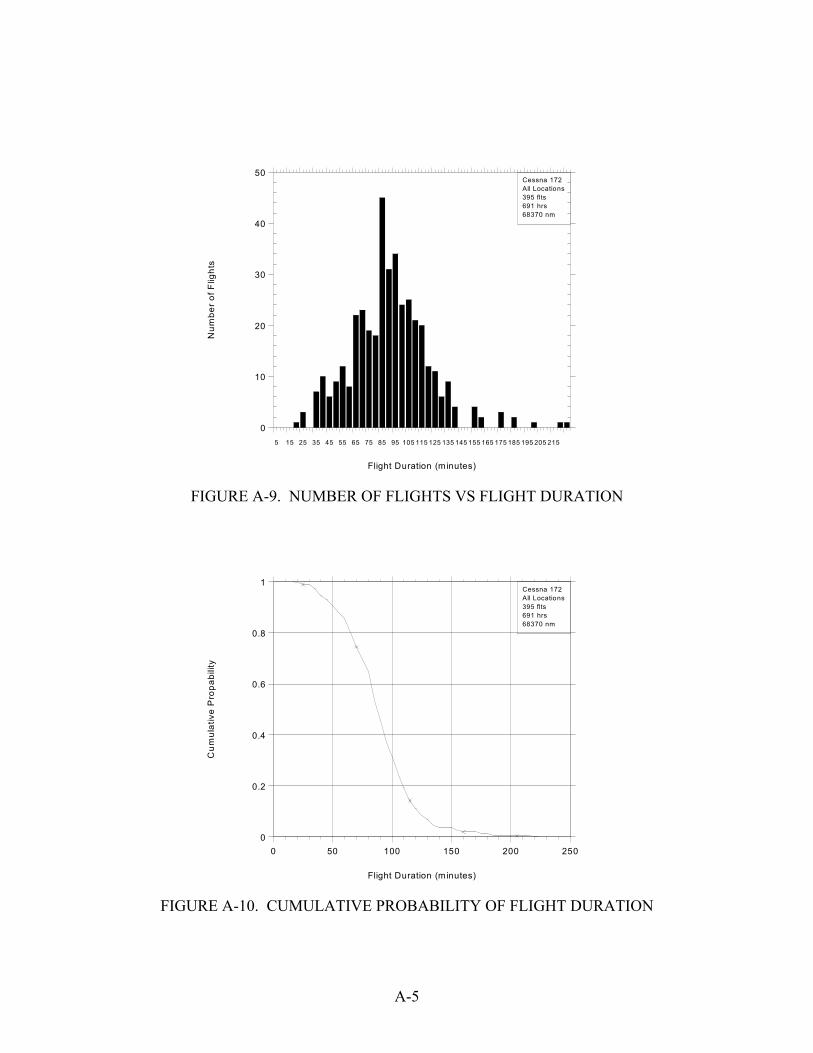
Flight duration is also important in the generation of flight profiles. The bar chart in figures A-, B-, and C-9 contain a breakdown of the number of flights flown versus the time duration of each flight from takeoff to landing. Figures A-, B-, and C-10 present the same flight duration data in a cumulative probability format. It should be noted that that these aircraft are used for training and that aircraft used for other missions might well have a different average flight duration. 5.2 GROUND LOADS DATA.
The ground loads data include frequency and probability information on vertical acceleration, speeds, and pitch rate associated with takeoff, landing, and ground operations. These data are of primary importance to landing gear and landing gear backup structure, and to a lesser extent, to the wing, fuselage, and empennage. Ground load data are presented in figures A-, B-, and C-11 through A-, B-, and C-15.
17
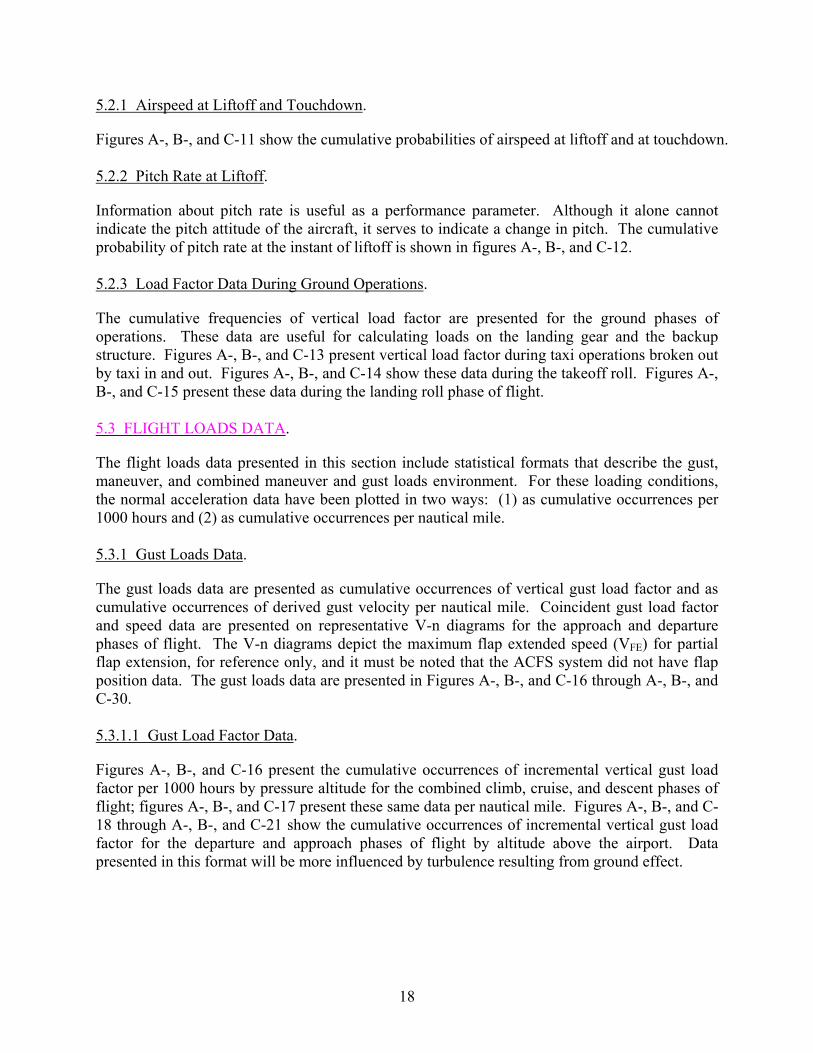
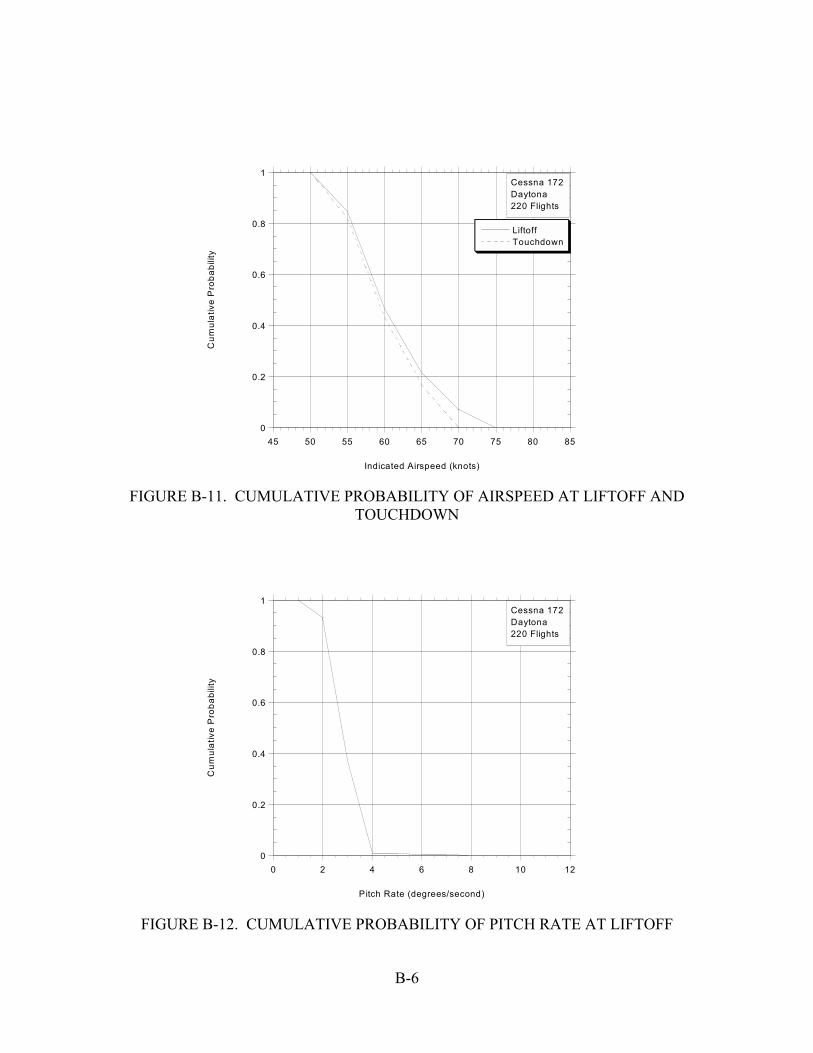
5.2.1 Airspeed at Liftoff and Touchdown.
Figures A-, B-, and C-11 show the cumulative probabilities of airspeed at liftoff and at touchdown. 5.2.2 Pitch Rate at Liftoff.
Information about pitch rate is useful as a performance parameter. Although it alone cannot indicate the pitch attitude of the aircraft, it serves to indicate a change in pitch. The cumulative probability of pitch rate at the instant of liftoff is shown in figures A-, B-, and C-12. 5.2.3 Load Factor Data During Ground Operations.
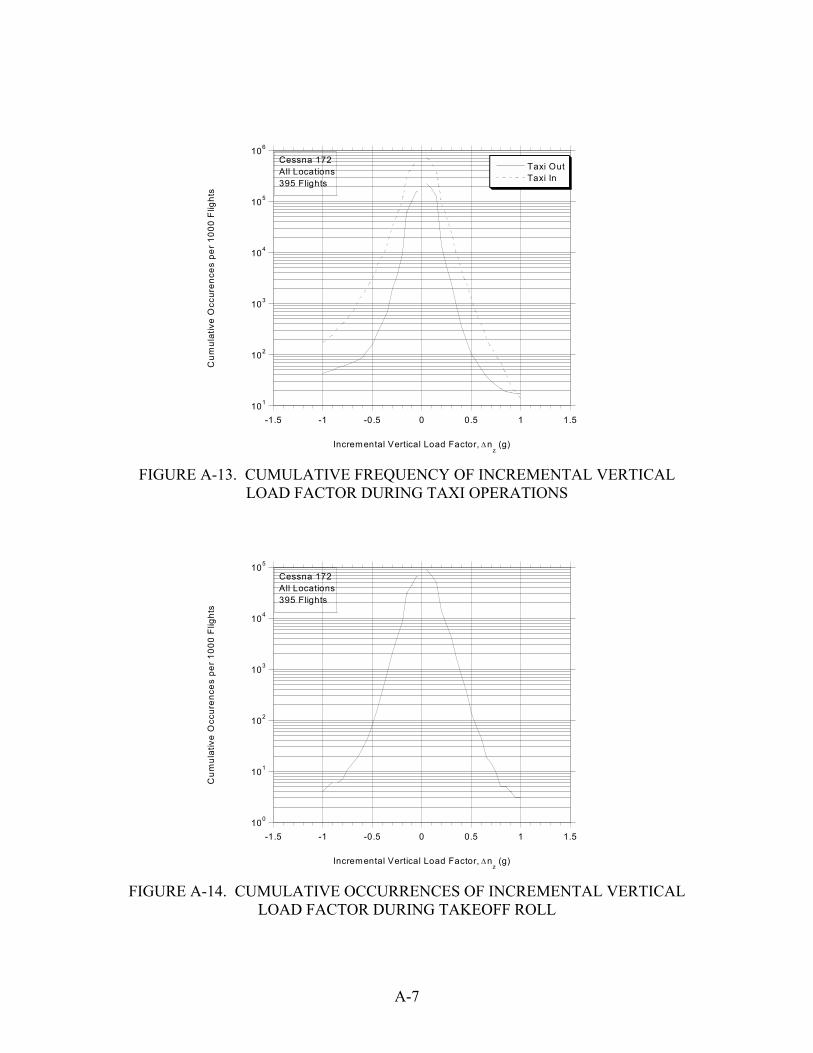
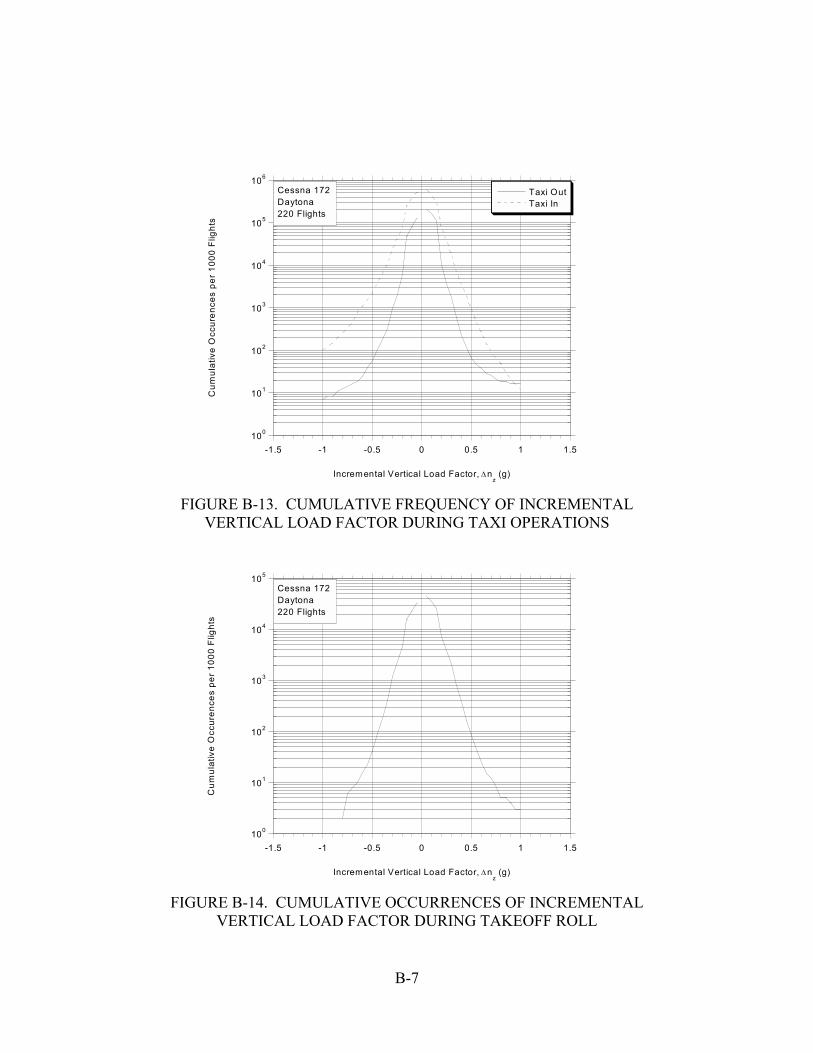
The cumulative frequencies of vertical load factor are presented for the ground phases of operations. These data are useful for calculating loads on the landing gear and the backup structure. Figures A-, B-, and C-13 present vertical load factor during taxi operations broken out by taxi in and out. Figures A-, B-, and C-14 show these data during the takeoff roll. Figures A-, B-, and C-15 present these data during the landing roll phase of flight. 5.3 FLIGHT LOADS DATA.
The flight loads data presented in this section include statistical formats that describe the gust, maneuver, and combined maneuver and gust loads environment. For these loading conditions, the normal acceleration data have been plotted in two ways: (1) as cumulative occurrences per 1000 hours and (2) as cumulative occurrences per nautical mile. 5.3.1 Gust Loads Data.
The gust loads data are presented as cumulative occurrences of vertical gust load factor and as cumulative occurrences of derived gust velocity per nautical mile. Coincident gust load factor and speed data are presented on representative V-n diagrams for the approach and departure phases of flight. The V-n diagrams depict the maximum flap extended speed (VFE) for partial flap extension, for reference only, and it must be noted that the ACFS system did not have flap position data. The gust loads data are presented in Figures A-, B-, and C-16 through A-, B-, and C-30. 5.3.1.1 Gust Load Factor Data.
Figures A-, B-, and C-16 present the cumulative occurrences of incremental vertical gust load factor per 1000 hours by pressure altitude for the combined climb, cruise, and descent phases of flight; figures A-, B-, and C-17 present these same data per nautical mile. Figures A-, B-, and C-18 through A-, B-, and C-21 show the cumulative occurrences of incremental vertical gust load factor for the departure and approach phases of flight by altitude above the airport. Data presented in this format will be more influenced by turbulence resulting from ground effect.
18
5.3.1.2 Gust Load Factor Data, Combined Flight Phases.
Figures A-, B-, and C-22 and A-, B-, and C-23 show the severity of vertical load factor for gust for the Cessna 172 during routine operations. 5.3.1.3 Gust Velocity Data.
The derived gust velocity, Ude, was computed from the measured gust acceleration data using the equations described in section 4.2.5. Figures A-, B-, and C-24 through A-, B-, and C-28 show the cumulative occurrences of derived gust velocity per nautical mile for selected altitude levels. 5.3.1.4 V-n Diagrams.
Figures A-, B-, and C-29 show the coincident gust load factor and airspeed plotted with respect to the illustrated gust V-n diagram for the departure phase. The V-n diagrams in figures A-, B-, and C-29 are shown for illustration only. Figures A-, B-, and C-30 present the coincident gust load factor and airspeed during approach. Since the flap position was unknown, a representative V-n diagram could not be presented. 5.3.2 Maneuver Loads Data.
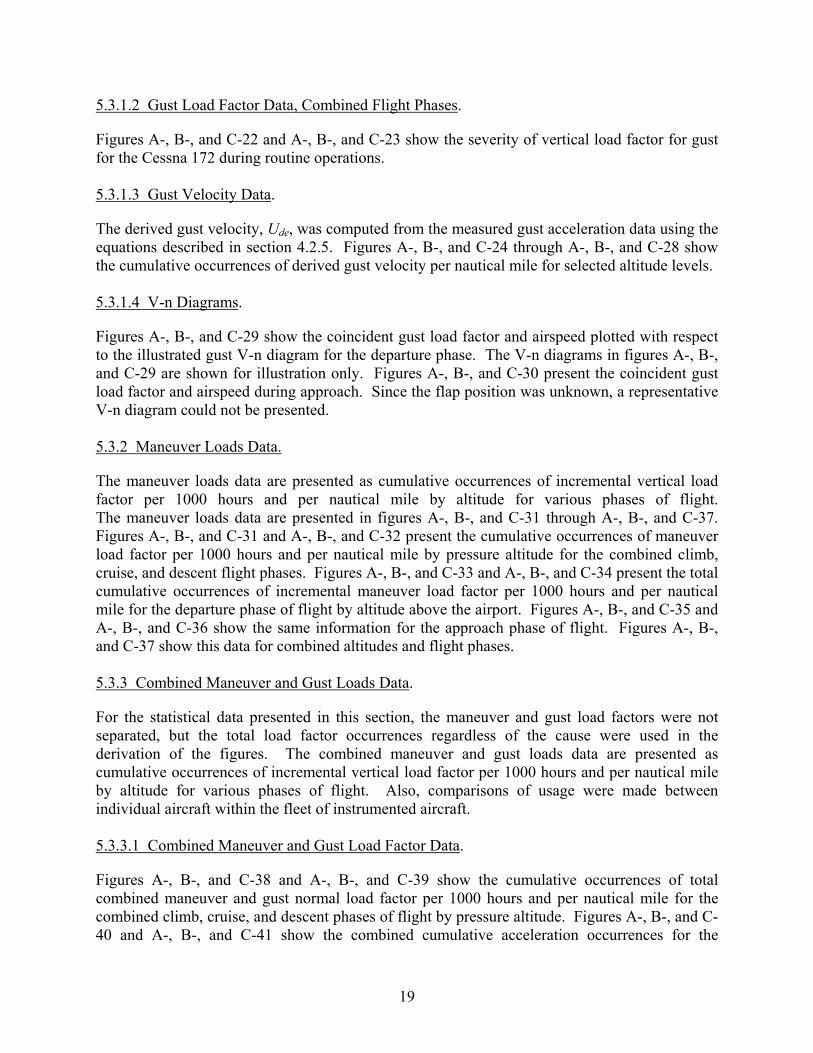
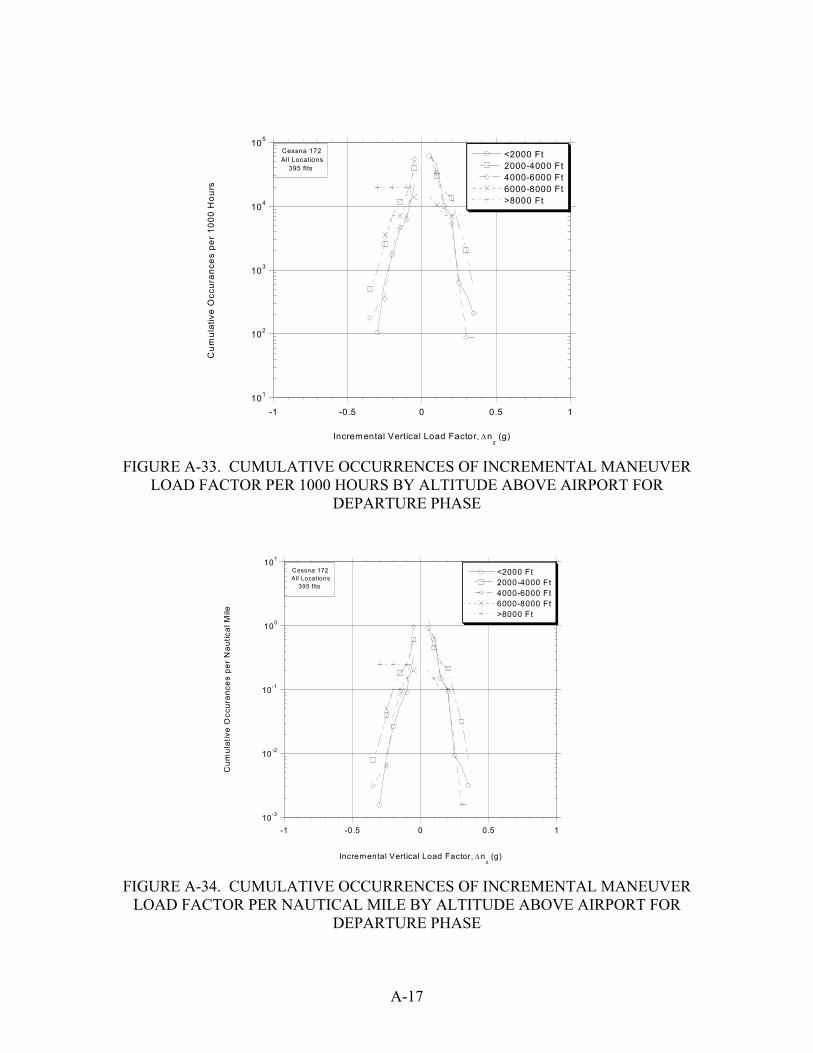
The maneuver loads data are presented as cumulative occurrences of incremental vertical load factor per 1000 hours and per nautical mile by altitude for various phases of flight. The maneuver loads data are presented in figures A-, B-, and C-31 through A-, B-, and C-37. Figures A-, B-, and C-31 and A-, B-, and C-32 present the cumulative occurrences of maneuver load factor per 1000 hours and per nautical mile by pressure altitude for the combined climb, cruise, and descent flight phases. Figures A-, B-, and C-33 and A-, B-, and C-34 present the total cumulative occurrences of incremental maneuver load factor per 1000 hours and per nautical mile for the departure phase of flight by altitude above the airport. Figures A-, B-, and C-35 and A-, B-, and C-36 show the same information for the approach phase of flight. Figures A-, B-, and C-37 show this data for combined altitudes and flight phases. 5.3.3 Combined Maneuver and Gust Loads Data.
For the statistical data presented in this section, the maneuver and gust load factors were not separated, but the total load factor occurrences regardless of the cause were used in the derivation of the figures. The combined maneuver and gust loads data are presented as cumulative occurrences of incremental vertical load factor per 1000 hours and per nautical mile by altitude for various phases of flight. Also, comparisons of usage were made between individual aircraft within the fleet of instrumented aircraft. 5.3.3.1 Combined Maneuver and Gust Load Factor Data.
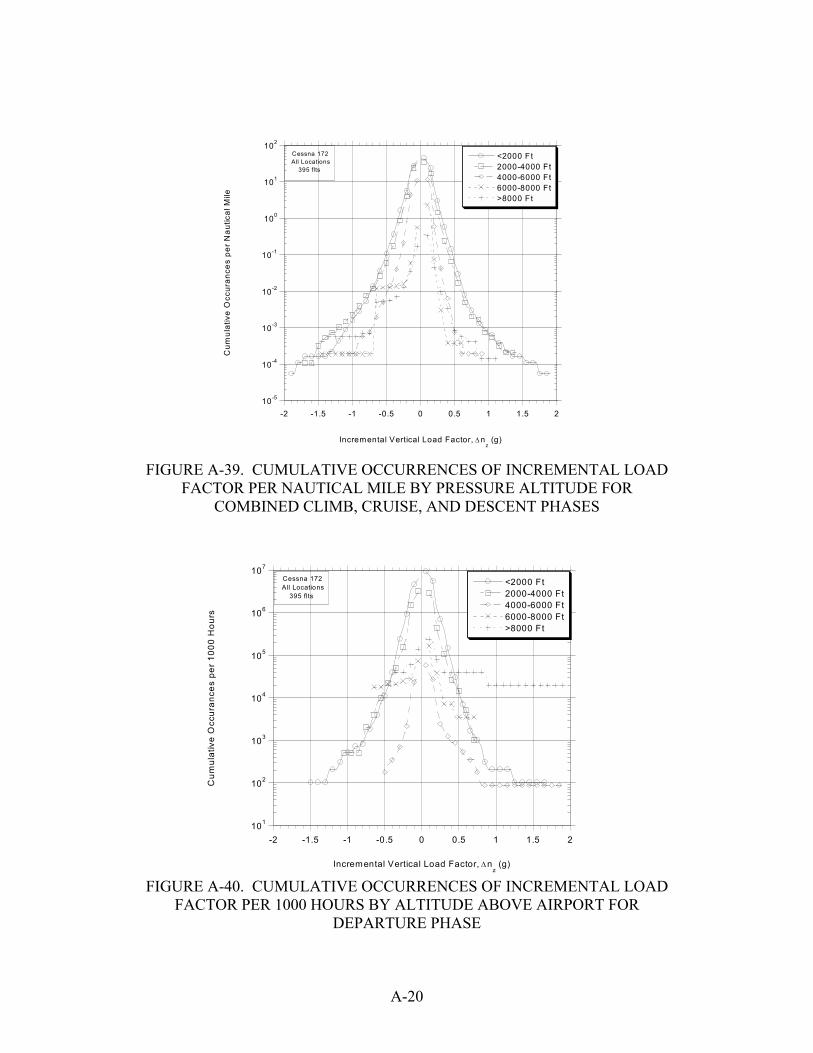
Figures A-, B-, and C-38 and A-, B-, and C-39 show the cumulative occurrences of total combined maneuver and gust normal load factor per 1000 hours and per nautical mile for the combined climb, cruise, and descent phases of flight by pressure altitude. Figures A-, B-, and C-40 and A-, B-, and C-41 show the combined cumulative acceleration occurrences for the
19
departure phase by altitude above airport, while figures A-, B-, and C-42 and A-, B-, and C-43 show similar data for the approach phase. The combined cumulative occurrences of incremental load factor for maneuver and gust are presented for all the flight phases combined in figures A-, B-, and C-44. 5.3.3.2 Comparison of Individual Aircraft Usage.
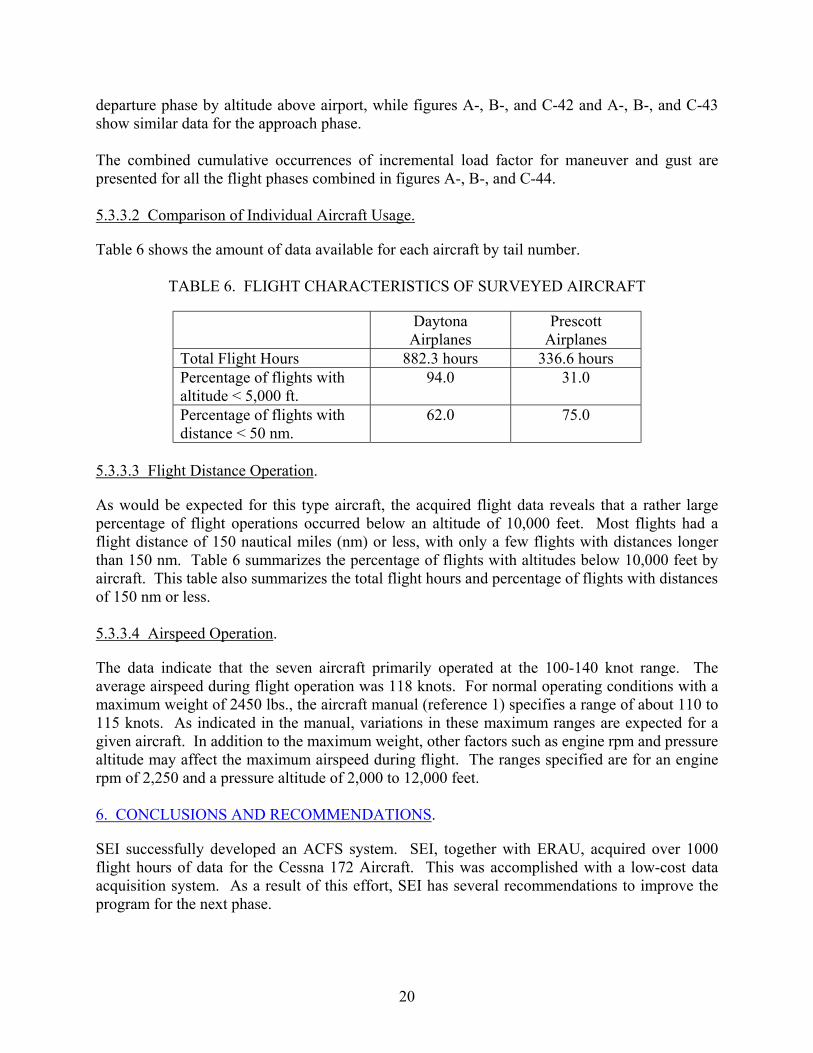
Table 6 shows the amount of data available for each aircraft by tail number.
TABLE 6. FLIGHT CHARACTERISTICS OF SURVEYED AIRCRAFT
Daytona Airplanes
Prescott Airplanes
Total Flight Hours 882.3 hours 336.6 hours Percentage of flights with altitude < 5,000 ft.
94.0 31.0
Percentage of flights with distance < 50 nm.
62.0 75.0
5.3.3.3 Flight Distance Operation.
As would be expected for this type aircraft, the acquired flight data reveals that a rather large percentage of flight operations occurred below an altitude of 10,000 feet. Most flights had a flight distance of 150 nautical miles (nm) or less, with only a few flights with distances longer than 150 nm. Table 6 summarizes the percentage of flights with altitudes below 10,000 feet by aircraft. This table also summarizes the total flight hours and percentage of flights with distances of 150 nm or less. 5.3.3.4 Airspeed Operation.
The data indicate that the seven aircraft primarily operated at the 100-140 knot range. The average airspeed during flight operation was 118 knots. For normal operating conditions with a maximum weight of 2450 lbs., the aircraft manual (reference 1) specifies a range of about 110 to 115 knots. As indicated in the manual, variations in these maximum ranges are expected for a given aircraft. In addition to the maximum weight, other factors such as engine rpm and pressure altitude may affect the maximum airspeed during flight. The ranges specified are for an engine rpm of 2,250 and a pressure altitude of 2,000 to 12,000 feet. 6. CONCLUSIONS AND RECOMMENDATIONS.
SEI successfully developed an ACFS system. SEI, together with ERAU, acquired over 1000 flight hours of data for the Cessna 172 Aircraft. This was accomplished with a low-cost data acquisition system. As a result of this effort, SEI has several recommendations to improve the program for the next phase.
20
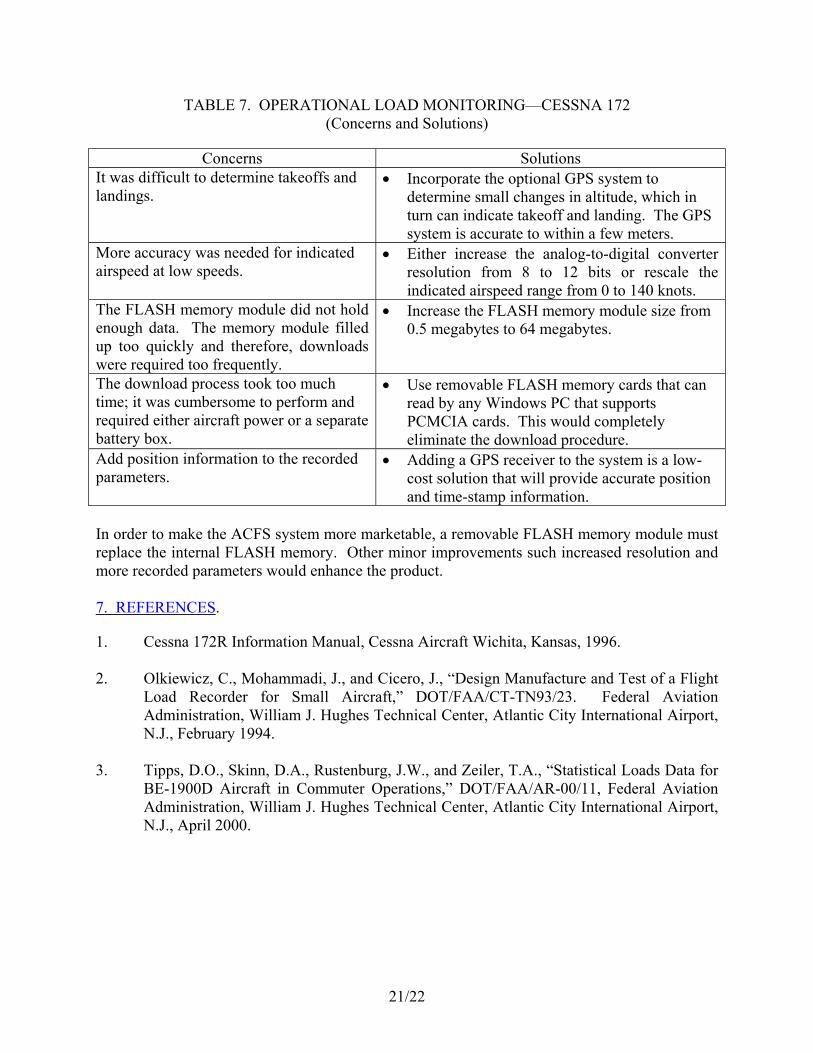
TABLE 7. OPERATIONAL LOAD MONITORING�CESSNA 172 (Concerns and Solutions)
Concerns Solutions It was difficult to determine takeoffs and landings.
• Incorporate the optional GPS system to determine small changes in altitude, which in turn can indicate takeoff and landing. The GPS system is accurate to within a few meters.
More accuracy was needed for indicated airspeed at low speeds.
• Either increase the analog-to-digital converter resolution from 8 to 12 bits or rescale the indicated airspeed range from 0 to 140 knots.
The FLASH memory module did not hold enough data. The memory module filled up too quickly and therefore, downloads were required too frequently.
• Increase the FLASH memory module size from 0.5 megabytes to 64 megabytes.
The download process took too much time; it was cumbersome to perform and required either aircraft power or a separate battery box.
• Use removable FLASH memory cards that can read by any Windows PC that supports PCMCIA cards. This would completely eliminate the download procedure.
Add position information to the recorded parameters.
• Adding a GPS receiver to the system is a low-cost solution that will provide accurate position and time-stamp information.
In order to make the ACFS system more marketable, a removable FLASH memory module must replace the internal FLASH memory. Other minor improvements such increased resolution and more recorded parameters would enhance the product. 7. REFERENCES.
1. Cessna 172R Information Manual, Cessna Aircraft Wichita, Kansas, 1996. 2. Olkiewicz, C., Mohammadi, J., and Cicero, J., �Design Manufacture and Test of a Flight
Load Recorder for Small Aircraft,� DOT/FAA/CT-TN93/23. Federal Aviation Administration, William J. Hughes Technical Center, Atlantic City International Airport, N.J., February 1994.
3. Tipps, D.O., Skinn, D.A., Rustenburg, J.W., and Zeiler, T.A., �Statistical Loads Data for
BE-1900D Aircraft in Commuter Operations,� DOT/FAA/AR-00/11, Federal Aviation Administration, William J. Hughes Technical Center, Atlantic City International Airport, N.J., April 2000.
21/22
APPENDIX A�STATISTICAL FORMATS, AIRCRAFT USAGE DATA, ALL AIRCRAFT
Maximum Altitude (1000 feet) 0-5 5-10 10-15 Total
0-50 48% 20% 0% 68% 50-100 16% 10% 0% 26% 100-150 4% 2% 0% 6% 150-200 0% 1% 0% 1% 200-250 0% 0% 0% 0% 250-300 0% 0% 0% 0% 300-350 0% 0% 0% 0% 350-400 0% 0% 0% 0%
F
light
Dis
tanc
e (n
m)
400-450 0% 0% 0% 0% Total 67% 33% 0% 100%
FIGURE A-1. CORRELATION OF MAXIMUM ALTITUDE AND FLIGHT DISTANCE, PERCENT OF FLIGHTS
Total Flight Distance (nm) 0-50 50-100 100-150 150-200 200-250 250-300 300-350 350-400 400-450
0-5k 71% 60% 67% 33% 0% 0% 0% 0% 0% 5k-10k 29% 40% 33% 67% 0% 0% 0% 0% 0% 10k-15k 0% 0% 0% 0% 0% 0% 0% 0% 0%
Total 100% 100% 100% 100% 0% 0% 0% 0% 0% Number 540 206 45 9 0 0 0 0 0
Altit
ude
Band
(fee
t)
of Flights
FIGURE A-2. PERCENT OF TOTAL DISTANCE IN ALTITUDE BANDS
A-1

0
2000
4000
6000
8000
10000
12000
14000
0 50 100 150 200 250 300
Max
imum
Alti
tude
F light Distance (nm)
Cessna 172All Locations395 flts 691 hrs68370 nm
FIGURE A-3. COINCIDENT FLIGHT DISTANCE AND MAXIMUM
FLIGHT ALTITUDE
0
2000
4000
6000
8000
10000
12000
0 50 100 150 200
Pre
ssur
e A
ltitu
de (
feet
)
Indicated Airspeed (knots)
Cessna 172All Locations395 flts 691 hrs68370 nm
Maximum Operating Speed
FIGURE A-4. COINCIDENT ALTITUDE AT MAXIMUM INDICATED AIRSPEED,
ALL FLIGHT PHASES
A-2

0
2000
4000
6000
8000
10000
12000
0 50 100 150 200
Pre
ssur
e A
ltitu
de (f
eet)
Indicated Airspeed (knots)
Cessna 172All Locations395 flts 691 hrs68370 nm
Maximum Operating Speed
FIGURE A-5. MAXIMUM SPEED AND COINCIDENT ALTITUDE
DURING CLIMB
0
2000
4000
6000
8000
10000
12000
0 50 100 150 200
Pre
ssur
e A
ltitu
de (f
eet)
Indicated Airspeed (knots)
Cessna 172All Locations395 flts 691 hrs68370 nm
Maximum Operating Speed
FIGURE A-6. MAXIMUM SPEED AND COINCIDENT ALTITUDE
DURING CRUISE
A-3
0
2000
4000
6000
8000
10000
0 50 100 150 200
Pre
ssur
e A
ltitu
de (f
eet)
Indicated Airspeed (knots)
Cessna 172All Locations395 flts 691 hrs68370 nm
Maximum Operating Speed
FIGURE A-7. MAXIMUM SPEED AND COINCIDENT ALTITUDE
DURING DESCENT
0
2000
4000
6000
8000
10000
0 50 100 150 200
Pre
ssur
e A
ltitu
de (f
eet)
Indicated Airspeed (knots)
Cessna 172All Locations395 flts 691 hrs68370 nm
Maximum Operating Speed
FIGURE A-8. MAXIMUM SPEED AND COINCIDENT ALTITUDE DURING
ALL FLIGHT PHASES
A-4
0
10
20
30
40
50
5 15 25 35 45 55 65 75 85 95 105 115 125 135 145 155 165 175 185 195 205 215
Num
ber o
f Flig
hts
Flight Duration (minutes)
Cessna 172All Locations395 flts 691 hrs68370 nm
FIGURE A-9. NUMBER OF FLIGHTS VS FLIGHT DURATION
0
0.2
0.4
0.6
0.8
1
0 50 100 150 200 250
Cum
ulat
ive
Pro
pabi
lity
Flight Duration (minutes)
Cessna 172All Locations395 flts 691 hrs68370 nm
FIGURE A-10. CUMULATIVE PROBABILITY OF FLIGHT DURATION
A-5

0
0.2
0.4
0.6
0.8
1
45 50 55 60 65 70 75 80 85
LiftoffTouchdown
Cum
ulat
ive
Pro
babi
lity
Indicated Airspeed (knots)
Cessna 172All Locations395 Flights
FIGURE A-11. CUMULATIVE PROBABILITY OF AIRSPEED AT LIFTOFF AND
TOUCHDOWN
0
0.2
0.4
0.6
0.8
1
1 2 3 4 5 6 7 8 9
Cum
ulat
ive
Pro
babi
lity
P itch Rate (degrees/second)
Cessna 172All Locations395 Flights
FIGURE A-12. CUMULATIVE PROBABILITY OF PITCH RATE AT LIFTOFF
A-6
101
102
103
104
105
106
-1.5 -1 -0.5 0 0.5 1 1.5
Taxi OutTaxi In
Cum
ulat
ive
Occ
uren
ces
per 1
000
Flig
hts
Incremental Vertical Load Factor, ∆nz (g)
Cessna 172All Locations395 Flights
FIGURE A-13. CUMULATIVE FREQUENCY OF INCREMENTAL VERTICAL
LOAD FACTOR DURING TAXI OPERATIONS
100
101
102
103
104
105
-1.5 -1 -0.5 0 0.5 1 1.5
Cum
ulat
ive
Occ
uren
ces
per 1
000
Flig
hts
Incremental Vertical Load Factor, ∆nz (g)
Cessna 172All Locations395 Flights
FIGURE A-14. CUMULATIVE OCCURRENCES OF INCREMENTAL VERTICAL
LOAD FACTOR DURING TAKEOFF ROLL
A-7
101
102
103
104
105
106
-1.5 -1 -0.5 0 0.5 1 1.5
Cum
ulat
ive
Occ
uren
ces
per 1
000
Flig
hts
Incremental Vertical Load Factor, ∆nz (g)
Cessna 172All Locations395 Flights
FIGURE A-15. CUMULATIVE OCCURRENCES OF INCREMENTAL VERTICAL
LOAD FACTOR DURING LANDING ROLL
100
101
102
103
104
105
106
-1.5 -1 -0.5 0 0.5 1 1.5
<2000 Ft2000-4000 Ft4000-6000 Ft6000-8000 Ft>8000 Ft
Cum
ulat
ive
Occ
uran
ces
per 1
000
Hou
rs
Incremental Vertical Load Factor, ∆nz (g)
Cessna 172All Locations395 flts 691 hrs
FIGURE A-16. CUMULATIVE OCCURRENCES OF INCREMENTAL GUST
LOAD FACTOR PER 1000 HOURS BY PRESSURE ALTITUDE FOR COMBINED CLIMB, CRUISE, AND DESCENT PHASES
A-8

10-5
10-4
10-3
10-2
10-1
100
101
-1.5 -1 -0.5 0 0.5 1 1.5
<2000 Ft2000-4000 Ft4000-6000 Ft6000-8000 Ft>8000 Ft
Cum
ulat
ive
Occ
uren
ces
per N
autic
al M
ile
Incremental Vertical Load Factor, ∆nz (g)
Cessna 172All Locations
395 flts 68370 nm
FIGURE A-17. CUMULATIVE OCCURRENCES OF INCREMENTAL GUST
LOAD FACTOR PER NAUTICAL MILE BY PRESSURE ALTITUDE FOR COMBINED CLIMB, CRUISE, AND DESCENT PHASES
101
102
103
104
105
106
107
108
109
-2 -1.5 -1 -0.5 0 0.5 1 1.5 2
<2000 Ft2000-4000 Ft4000-6000 Ft6000-8000 Ft>8000 Ft
Cum
ulat
ive
Occ
uran
ces
per 1
000
Hou
rs
Incremental Vertical Load Factor, ∆nz (g)
Cessna 172All Locations395 flts 691 hrs
FIGURE A-18. CUMULATIVE OCCURRENCES OF INCREMENTAL GUST LOAD FACTOR PER 1000 HOURS BY ALTITUDE ABOVE AIRPORT FOR
DEPARTURE PHASE
A-9

10-3
10-2
10-1
100
101
102
103
104
-2 -1.5 -1 -0.5 0 0.5 1 1.5 2
<2000 Ft2000-4000 Ft4000-6000 Ft6000-8000 Ft>8000 Ft
Cum
ulat
ive
Occ
uren
ces
per
Nau
tical
Mile
Incremental Vertical Load Factor, ∆nz (g)
Cessna 172All Locations
395 flts 68370 nm
FIGURE A-19. CUMULATIVE OCCURRENCES OF INCREMENTAL GUST LOAD
FACTOR PER NAUTICAL MILE BY ALTITUDE ABOVE AIRPORT FOR DEPARTURE PHASE
101
102
103
104
105
106
-1.5 -1 -0.5 0 0.5 1 1.5
<2000 Ft2000-4000 Ft4000-6000 Ft6000-8000 Ft>8000 Ft
Cum
ulat
ive
Occ
uran
ces
per 1
000
Hou
rs
Incremental Vertical Load Factor, ∆nz (g)
Cessna 172All Locations395 flts 691 hrs
FIGURE A-20. CUMULATIVE OCCURRENCES OF INCREMENTAL GUST LOAD
FACTOR PER 1000 HOURS BY ALTITUDE ABOVE AIRPORT FOR APPROACH PHASE
A-10
10-4
10-3
10-2
10-1
100
101
-1.5 -1 -0.5 0 0.5 1 1.5
<2000 Ft2000-4000 Ft4000-6000 Ft6000-8000 Ft>8000 Ft
Cum
ulat
ive
Occ
uren
ces
per
Nau
tical
Mile
Incremental Vertical Load Factor, ∆nz (g)
Cessna 172All Locations
395 flts 68370 nm
FIGURE A-21. CUMULATIVE OCCURRENCES OF INCREMENTAL GUST LOAD
FACTOR PER NAUTICAL MILE BY ALTITUDE ABOVE AIRPORT FOR APPROACH PHASE
100
101
102
103
104
105
106
107
-2 -1.5 -1 -0.5 0 0.5 1 1.5 2
Cum
ulat
ive
Occ
uren
ces
per 1
000
Hou
rs
Incremental Vertical Load Factor, ∆nz (g)
Cessna 172All Locations395 flts 691 hrs
FIGURE A-22. CUMULATIVE OCCURRENCES OF INCREMENTAL GUST
LOAD FACTOR PER 1000 HOURS, COMBINED FLIGHT PHASES
A-11

10-5
10-4
10-3
10-2
10-1
100
101
102
-2 -1.5 -1 -0.5 0 0.5 1 1.5 2
Cum
ulat
ive
Occ
uren
ces
per
Nau
tical
Mile
Incremental Vertical Load Factor, ∆nz (g)
Cessna 172All Locations
395 flts 68370 nm
FIGURE A-23. CUMULATIVE OCCURRENCES OF INCREMENTAL GUST
LOAD FACTOR PER NAUTICAL MILE
10-4
10-3
10-2
10-1
100
101
102
-40 -30 -20 -10 0 10 20 30 40
Less Than 2000 Feet
Cum
ulat
ive
Occ
uren
ces
per
Nau
tical
Mile
Derived Gust Velocity, Ude
- R/Sec
Cessna 172All Locations
395 flts 68370 nm
FIGURE A-24. CUMULATIVE OCCURRENCES OF DERIVED GUST
VELOCITY PER NAUTICAL MILE FOR < 2000 feet
A-12
10-4
10-3
10-2
10-1
100
101
102
-40 -30 -20 -10 0 10 20 30 40
2000-4000 Feet
Cum
ulat
ive
Occ
uren
ces
per N
autic
al M
ile
Derived Gust Velocity, Ude
- R/Sec
Cessna 172All Locations
395 flts 68370 nm
FIGURE A-25. CUMULATIVE OCCURRENCES OF DERIVED GUST
VELOCITY PER NAUTICAL MILE FOR 2000-4000 feet
10-4
10-3
10-2
10-1
100
101
102
-40 -30 -20 -10 0 10 20 30 40
4000-6000 Feet
Cum
ulat
ive
Occ
uren
ces
per N
autic
al M
ile
Derived Gust Velocity, Ude
- R/Sec
Cessna 172All Locations
395 flts 68370 nm
FIGURE A-26. CUMULATIVE OCCURRENCES OF DERIVED GUST
VELOCITY PER NAUTICAL MILE FOR 4000-6000 feet
A-13
10-3
10-2
10-1
100
101
102
-40 -30 -20 -10 0 10 20 30 40
6000-8000 Feet
Cum
ulat
ive
Occ
uren
ces
per N
autic
al M
ile
Derived Gust Velocity, Ude
- R/Sec
Cessna 172All Locations
395 flts 68370 nm
FIGURE A-27. CUMULATIVE OCCURRENCES OF DERIVED GUST
VELOCITY PER NAUTICAL MILE FOR 6000-8000 feet
10-4
10-3
10-2
10-1
100
101
102
-40 -30 -20 -10 0 10 20 30 40
Greater Than 8000 Feet
Cum
ulat
ive
Occ
uren
ces
per N
autic
al M
ile
Derived Gust Velocity, Ude
- R/Sec
Cessna 172All Locations
395 flts 68370 nm
FIGURE A-28. CUMULATIVE OCCURRENCES OF DERIVED GUST
VELOCITY PER NAUTICAL MILE FOR > 8000 feet
A-14
-2
-1
0
1
2
3
4
0 50 100 150
Load
Fac
tor (
g)
Velocity (KEAS)
Cessna 172, FOR ILLUSTRATION ONLY
FIGURE A-29. COINCIDENT GUST LOAD FACTOR AND SPEED
DURING DEPARTURE
-2
-1
0
1
2
3
4
0 50 100 150
Load
Fac
tor (
g)
Velocity (KEAS)
Cessna 172, F OR ILLUST RATION O N LY
FIGURE A-30. COINCIDENT GUST LOAD FACTOR AND SPEED
DURING APPROACH
A-15

100
101
102
103
104
105
-1.5 -1 -0.5 0 0.5 1 1.5
<2000 Ft2000-4000 Ft4000-6000 Ft6000-8000 Ft>8000 Ft
Cum
ulat
ive
Occ
uran
ces
per 1
000
Hou
rs
Incremental Vertical Load Factor, ∆nz (g)
Cessna 172All Locations
395 flts
FIGURE A-31. CUMULATIVE OCCURRENCES OF INCREMENTAL MANEUVER
LOAD FACTOR PER 1000 HOURS BY PRESSURE ALTITUDE FOR COMBINED CLIMB, CRUISE, AND DESCENT PHASES
10-5
10-4
10-3
10-2
10-1
100
-1.5 -1 -0.5 0 0.5 1 1.5
<2000 Ft2000-4000 Ft4000-6000 Ft6000-8000 Ft>8000 Ft
Cum
ulat
ive
Occ
uran
ces
per N
autic
al M
ile
Incremental Vertical Load Factor, ∆nz (g)
Cessna 172All Locations
395 flts
FIGURE A-32. CUMULATIVE OCCURRENCES OF INCREMENTAL MANEUVER
LOAD FACTOR PER NAUTICAL MILE BY PRESSURE ALTITUDE FOR COMBINED CLIMB, CRUISE, AND DESCENT PHASES
A-16
101
102
103
104
105
-1 -0.5 0 0.5 1
<2000 Ft2000-4000 Ft4000-6000 Ft6000-8000 Ft>8000 Ft
Cum
ulat
ive
Occ
uran
ces
per 1
000
Hou
rs
Incremental Vertical Load Factor, ∆nz (g)
Cessna 172All Locations
395 flts
FIGURE A-33. CUMULATIVE OCCURRENCES OF INCREMENTAL MANEUVER
LOAD FACTOR PER 1000 HOURS BY ALTITUDE ABOVE AIRPORT FOR DEPARTURE PHASE
10-3
10-2
10-1
100
101
-1 -0.5 0 0.5 1
<2000 Ft2000-4000 Ft4000-6000 Ft6000-8000 Ft>8000 Ft
Cum
ulat
ive
Occ
uran
ces
per
Nau
tical
Mile
Incremental Vertical Load Factor, ∆nz (g)
Cessna 172All Locations
395 flts
FIGURE A-34. CUMULATIVE OCCURRENCES OF INCREMENTAL MANEUVER
LOAD FACTOR PER NAUTICAL MILE BY ALTITUDE ABOVE AIRPORT FOR DEPARTURE PHASE
A-17

101
102
103
104
105
-1 -0.5 0 0.5 1
<2000 Ft2000-4000 Ft4000-6000 Ft6000-8000 Ft>8000 Ft
Cum
ulat
ive
Occ
uran
ces
per 1
000
Hou
rs
Incremental Vertical Load Factor, ∆nz (g)
Cessna 172All Locations
395 flts
FIGURE A-35. CUMULATIVE OCCURRENCES OF INCREMENTAL MANEUVER
LOAD FACTOR PER 1000 HOURS BY ALTITUDE ABOVE AIRPORT FOR APPROACH PHASE
10-4
10-3
10-2
10-1
100
-1 -0.5 0 0.5 1
<2000 Ft2000-4000 Ft4000-6000 Ft>8000 Ft6000-8000 Ft
Cum
ulat
ive
Occ
uran
ces
per
Nau
tical
Mile
Incremental Vertical Load Factor, ∆nz (g)
Cessna 172All Locations
395 flts
FIGURE A-36. CUMULATIVE OCCURRENCES OF INCREMENTAL MANEUVER
LOAD FACTOR PER NAUTICAL MILE BY ALTITUDE ABOVE AIRPORT FOR APPROACH PHASE
A-18
10-5
10-4
10-3
10-2
10-1
100
-1.5 -1 -0.5 0 0.5 1
Cum
ulat
ive
Occ
uren
ces
per
Nau
tical
Mile
Incremental Vertical Load Factor, ∆nz (g)
Cessna 172All Locations
395 flts
FIGURE A-37. CUMULATIVE OCCURRENCES OF INCREMENTAL MANEUVER
LOAD FACTOR PER NAUTICAL MILE
100
101
102
103
104
105
106
107
-2 -1.5 -1 -0.5 0 0.5 1 1.5 2
<2000 Ft2000-4000 Ft4000-6000 Ft6000-8000 Ft>8000 Ft
Cum
ulat
ive
Occ
uran
ces
per 1
000
Hou
rs
Incremental Vertical Load Factor, ∆nz (g)
Cessna 172All Locations
395 flts
FIGURE A-38. CUMULATIVE OCCURRENCES OF INCREMENTAL LOAD
FACTOR PER 1000 HOURS BY PRESSURE ALTITUDE FOR COMBINED CLIMB, CRUISE, AND DESCENT PHASES
A-19
10-5
10-4
10-3
10-2
10-1
100
101
102
-2 -1.5 -1 -0.5 0 0.5 1 1.5 2
<2000 Ft2000-4000 Ft4000-6000 Ft6000-8000 Ft>8000 Ft
Cum
ulat
ive
Occ
uran
ces
per
Nau
tical
Mile
Incremental Vertical Load Factor, ∆nz (g)
Cessna 172All Locations
395 flts
FIGURE A-39. CUMULATIVE OCCURRENCES OF INCREMENTAL LOAD
FACTOR PER NAUTICAL MILE BY PRESSURE ALTITUDE FOR COMBINED CLIMB, CRUISE, AND DESCENT PHASES
101
102
103
104
105
106
107
-2 -1.5 -1 -0.5 0 0.5 1 1.5 2
<2000 Ft2000-4000 Ft4000-6000 Ft6000-8000 Ft>8000 Ft
Cum
ulat
ive
Occ
uran
ces
per 1
000
Hou
rs
Incremental Vertical Load Factor, ∆nz (g)
Cessna 172All Locations
395 flts
FIGURE A-40. CUMULATIVE OCCURRENCES OF INCREMENTAL LOAD
FACTOR PER 1000 HOURS BY ALTITUDE ABOVE AIRPORT FOR DEPARTURE PHASE
A-20

10-3
10-2
10-1
100
101
102
103
-2 -1.5 -1 -0.5 0 0.5 1 1.5 2
<2000 Ft2000-4000 Ft4000-6000 Ft6000-8000 Ft>8000 Ft
Cum
ulat
ive
Occ
uran
ces
per
Nau
tical
Mile
Incremental Vertical Load Factor, ∆nz (g)
Cessna 172All Locations
395 flts
FIGURE A-41. CUMULATIVE OCCURRENCES OF INCREMENTAL LOAD
FACTOR PER NAUTICAL MILE BY ALTITUDE ABOVE AIRPORT FOR DEPARTURE PHASE
101
102
103
104
105
106
107
-2 -1.5 -1 -0.5 0 0.5 1 1.5 2
<2000 Ft2000-4000 Ft4000-6000 Ft6000-8000 Ft>8000 Ft
Cum
ulat
ive
Occ
uran
ces
per 1
000
Hou
rs
Incremental Vertical Load Factor, ∆nz (g)
Cessna 172All Locations
395 flts
FIGURE A-42. CUMULATIVE OCCURRENCES OF INCREMENTAL LOAD
FACTOR PER 1000 HOURS BY ALTITUDE ABOVE AIRPORT FOR APPROACH PHASE
A-21

10-4
10-3
10-2
10-1
100
101
102
-2 -1.5 -1 -0.5 0 0.5 1 1.5 2
<2000 Ft2000-4000 Ft4000-6000 Ft6000-8000 Ft>8000 Ft
Cum
ulat
ive
Occ
uran
ces
per N
autic
al M
ile
Incremental Vertical Load Factor, ∆nz (g)
Cessna 172All Locations
395 flts
FIGURE A-43. CUMULATIVE OCCURRENCES OF INCREMENTAL LOAD
FACTOR PER NAUTICAL MILE BY ALTITUDE ABOVE AIRPORT FOR APPROACH PHASE
100
101
102
103
104
105
106
107
-2 -1.5 -1 -0.5 0 0.5 1 1.5 2
Cum
ulat
ive
Occ
uran
ces
per 1
000
Hou
rs
Incremental Vertical Load Factor, ∆nz (g)
Cessna 172All Locations395 flts 691 hrs68370 nm
FIGURE A-44. CUMULATIVE OCCURRENCES OF INCREMENTAL LOAD
FACTOR PER 1000 HOURS FOR COMBINED FLIGHT PHASES
A-22
APPENDIX B�STATISTICAL FORMATS, AIRCRAFT USAGE DATA, DAYTONA AIRCRAFT
Maximum Altitude (1000 feet) 0-5 5-10 10-15 Total
0-50 60% 2% 0% 62%50-100 27% 2% 0% 29%100-150 7% 1% 0% 8%150-200 1% 1% 0% 1%200-250 0% 0% 0% 0%250-300 0% 0% 0% 0%300-350 0% 0% 0% 0%350-400 0% 0% 0% 0%
F
light
Dis
tanc
e (n
m)
400-450 0% 0% 0% 0% Total 94% 6% 0% 100%
FIGURE B-1. CORRELATION OF MAXIMUM ALTITUDE AND FLIGHT DISTANCE, PERCENT OF FLIGHTS
Total Flight Distance (nm) 0-50 50-100 100-150 150-200 200-250 250-300 300-350 350-400 400-450
0-5k 97% 93% 86% 50% 0% 0% 0% 0% 0% 5k-10k 3% 7% 14% 50% 0% 0% 0% 0% 0% 10k-15k 0% 0% 0% 0% 0% 0% 0% 0% 0%
Total 100% 100% 100% 100% 0% 0% 0% 0% 0% Number 283 134 35 6 0 0 0 0 0 Al
titud
e Ba
nd
(feet
)
of Flights
FIGURE B-2. PERCENT OF TOTAL DISTANCE IN ALTITUDE BANDS
B-1

0
2000
4000
6000
8000
10000
0 50 100 150 200
Max
imum
Alti
tude
(fee
t)
F light Distance (nm)
Cessna 172Daytona220 flts 447 hrs44014 nm
FIGURE B-3. COINCIDENT FLIGHT DISTANCE AND MAXIMUM
FLIGHT ALTITUDE
0
2000
4000
6000
8000
1 104
0 50 100 150 200
Pre
ssur
e A
ltitu
de (
feet
)
Indicated Airspeed (knots)
Cessna 172Daytona220 flts 447 hrs44014 nm
Maximum Operating Speed
FIGURE B-4. COINCIDENT ALTITUDE AT MAXIMUM INDICATED
AIRSPEED, ALL FLIGHT PHASES
B-2
0
2000
4000
6000
8000
1 104
1.2 104
0 50 100 150 200
Pre
ssur
e A
ltitu
de (f
eet)
Indicated Airspeed (knots)
Cessna 172Daytona220 flts 447 hrs44014 nm
Maximum Operating Speed
FIGURE B-5. MAXIMUM SPEED AND COINCIDENT ALTITUDE
DURING CLIMB
0
2000
4000
6000
8000
1 104
1.2 104
0 50 100 150 200
Pre
ssur
e A
ltitu
de (f
eet)
Indicated Airspeed (knots)
Cessna 172Daytona220 flts 447 hrs44014 nm
Maximum Operating Speed
FIGURE B-6. MAXIMUM SPEED AND COINCIDENT ALTITUDE
DURING CRUISE
B-3

0
2000
4000
6000
8000
1 104
0 50 100 150 200
Pre
ssur
e A
ltitu
de (f
eet)
Indicated Airspeed (knots)
Cessna 172Daytona220 flts 447 hrs44014 nm
Maximum Operating Speed
FIGURE B-7. MAXIMUM SPEED AND COINCIDENT ALTITUDE
DURING DESCENT
0
2000
4000
6000
8000
1 104
0 50 100 150 200
Pre
ssur
e A
ltitu
de (f
eet)
Indicated Airspeed (knots)
Cessna 172Daytona220 flts 447 hrs44014 nm
Maximum Operating Speed
FIGURE B-8. MAXIMUM SPEED AND COINCIDENT ALTITUDE DURING
ALL FLIGHT PHASES
B-4

0
5
10
15
20
25
5 15 25 35 45 55 65 75 85 95 105 115 125 135 145 155 165 175 185 195 205 215
Num
ber o
f Flig
hts
Flight Duration (minutes)
Cessna 172Daytona220 flts 447 hrs44014 nm
FIGURE B-9. NUMBER OF FLIGHTS VS FLIGHT DURATION
0
0.2
0.4
0.6
0.8
1
0 50 100 150 200 250
Cum
ulat
ive
Pro
babi
lity
Flight Duration (minutes)
Cessna 172Daytona220 flts 447 hrs44014 nm
FIGURE B-10. CUMULATIVE PROBABILITY OF FLIGHT DURATION
B-5
0
0.2
0.4
0.6
0.8
1
45 50 55 60 65 70 75 80 85
LiftoffTouchdown
Cum
ulat
ive
Pro
babi
lity
Indicated Airspeed (knots)
Cessna 172Daytona220 Flights
FIGURE B-11. CUMULATIVE PROBABILITY OF AIRSPEED AT LIFTOFF AND
TOUCHDOWN
0
0.2
0.4
0.6
0.8
1
0 2 4 6 8 10 12
Cum
ulat
ive
Pro
babi
lity
P itch Rate (degrees/second)
Cessna 172Daytona220 Flights
FIGURE B-12. CUMULATIVE PROBABILITY OF PITCH RATE AT LIFTOFF
B-6
100
101
102
103
104
105
106
-1.5 -1 -0.5 0 0.5 1 1.5
Taxi OutTaxi In
Cum
ulat
ive
Occ
uren
ces
per 1
000
Flig
hts
Incremental Vertical Load Factor, ∆nz (g)
Cessna 172Daytona220 Flights
FIGURE B-13. CUMULATIVE FREQUENCY OF INCREMENTAL
VERTICAL LOAD FACTOR DURING TAXI OPERATIONS
100
101
102
103
104
105
-1.5 -1 -0.5 0 0.5 1 1.5
Cum
ulat
ive
Occ
uren
ces
per 1
000
Flig
hts
Incremental Vertical Load Factor, ∆nz (g)
Cessna 172Daytona220 Flights
FIGURE B-14. CUMULATIVE OCCURRENCES OF INCREMENTAL
VERTICAL LOAD FACTOR DURING TAKEOFF ROLL
B-7
101
102
103
104
105
106
-1.5 -1 -0.5 0 0.5 1 1.5
Cum
ulat
ive
Occ
uren
ces
per 1
000
Flig
hts
Incremental Vertical Load Factor, ∆nz (g)
Cessna 172Daytona220 Flights
FIGURE B-15. CUMULATIVE OCCURRENCES OF INCREMENTAL
VERTICAL LOAD FACTOR DURING LANDING ROLL
100
101
102
103
104
105
106
107
-2 -1.5 -1 -0.5 0 0.5 1 1.5 2
<2000 Ft2000-4000 Ft4000-6000 Ft6000-8000 Ft>8000 Ft
Cum
ulat
ive
Occ
uren
ces
per 1
000
Hou
rs
Incremental Vertical Load Factor, ∆nz (g)
Cessna 172Daytona
220 Flights447 Hours
FIGURE B-16. CUMULATIVE OCCURRENCES OF INCREMENTAL GUST LOAD FACTOR PER 1000 HOURS BY PRESSURE ALTITUDE
FOR COMBINED CLIMB, CRUISE, AND DESCENT PHASES
B-8

10-5
10-4
10-3
10-2
10-1
100
101
102
-2 -1.5 -1 -0.5 0 0.5 1 1.5 2
<2000 Ft2000-4000 Ft4000-6000 Ft6000-8000 Ft>8000 Ft
Cum
ulat
ive
Occ
uren
ces
per
Nau
tical
Mile
Incremental Vertical Load Factor, ∆nz (g)
Cessna 172Daytona
220 Flights44014 nm
FIGURE B-17. CUMULATIVE OCCURRENCES OF INCREMENTAL
GUST LOAD FACTOR PER NAUTICAL MILE BY PRESSURE ALTITUDE FOR COMBINED CLIMB, CRUISE, AND DESCENT PHASES
102
103
104
105
106
107
-2 -1.5 -1 -0.5 0 0.5 1 1.5 2
<2000 Ft2000-4000 Ft4000-6000 Ft6000-8000 Ft>8000 Ft
Cum
ulat
ive
Occ
uren
ces
per 1
000
Hou
rs
Incremental Vertical Load Factor, ∆nz (g)
Cessna 172Daytona
220 Flights447 Hours
FIGURE B-18. CUMULATIVE OCCURRENCES OF INCREMENTAL
GUST LOAD FACTOR PER 1000 HOURS BY ALTITUDE ABOVE AIRPORT FOR DEPARTURE PHASE
B-9

10-3
10-2
10-1
100
101
102
103
-2 -1.5 -1 -0.5 0 0.5 1 1.5 2
<2000 Ft2000-4000 Ft4000-6000 Ft6000-8000 Ft>8000 Ft
Cum
ulat
ive
Occ
uren
ces
per
Nau
tical
Mile
Incremental Vertical Load Factor, ∆nz (g)
Cessna 172Daytona
220 Flights44014 nm
FIGURE B-19. CUMULATIVE OCCURRENCES OF INCREMENTAL
GUST LOAD FACTOR PER NAUTICAL MILE BY ALTITUDE ABOVE AIRPORT FOR DEPARTURE PHASE
101
102
103
104
105
106
107
-2 -1.5 -1 -0.5 0 0.5 1 1.5 2
<2000 Ft2000-4000 Ft4000-6000 Ft6000-8000 Ft>2000 Ft
Cum
ulat
ive
Occ
uren
ces
per 1
000
Hou
rs
Incremental Vertical Load Factor, ∆nz (g)
Cessna 172Daytona
220 Flights447 Hours
FIGURE B-20. CUMULATIVE OCCURRENCES OF INCREMENTAL
GUST LOAD FACTOR PER 1000 HOURS BY ALTITUDE ABOVE AIRPORT FOR APPROACH PHASE
B-10

10-4
10-3
10-2
10-1
100
101
102
-2 -1.5 -1 -0.5 0 0.5 1 1.5 2
<2000 Ft2000-4000 Ft4000-6000 Ft6000-8000 Ft>8000 Ft
Cum
ulat
ive
Occ
uren
ces
per
Nau
tical
Mile
Incremental Vertical Load Factor, ∆nz (g)
Cessna 172Daytona
220 Flights44014 nm
FIGURE B-21. CUMULATIVE OCCURRENCES OF INCREMENTAL
GUST LOAD FACTOR PER NAUTICAL MILE BY ALTITUDE ABOVE AIRPORT FOR APPROACH PHASE
100
101
102
103
104
105
106
107
-2 -1.5 -1 -0.5 0 0.5 1 1.5 2
Cum
ulat
ive
Occ
uren
ces
per 1
000
Hou
rs
Incremental Vertical Load Factor, ∆nz (g)
Cessna 172Daytona
220 Flights447 Hours
FIGURE B-22. CUMULATIVE OCCURRENCES OF INCREMENTAL GUST
LOAD FACTOR PER 1000 HOURS, COMBINED FLIGHT PHASES
B-11

10-5
10-4
10-3
10-2
10-1
100
101
102
-2 -1.5 -1 -0.5 0 0.5 1 1.5 2
Cum
ulat
ive
Occ
uren
ces
per
Nau
tical
Mile
Incremental Vertical Load Factor, ∆nz (g)
Cessna 172Daytona
220 Flights44014 nm
FIGURE B-23. CUMULATIVE OCCURRENCES OF INCREMENTAL
GUST LOAD FACTOR PER NAUTICAL MILE
10-4
10-3
10-2
10-1
100
101
102
-40 -30 -20 -10 0 10 20 30 40
Less Than 2000 Feet
Cum
ulat
ive
Occ
uren
ces
per N
autic
al M
ile
Derived Gust Velocity, Ude
- R/Sec
Cessna 172Daytona220 Flights44014 nm
FIGURE B-24. CUMULATIVE OCCURRENCES OF DERIVED GUST
VELOCITY PER NAUTICAL MILE FOR < 2000 feet
B-12

10-4
10-3
10-2
10-1
100
101
102
-40 -30 -20 -10 0 10 20 30 40
2000-4000 Feet
Cum
ulat
ive
Occ
uren
ces
per N
autic
al M
ile
Derived Gust Velocity, Ude
- R/Sec
Cessna 172Daytona220 Flights44014 nm
FIGURE B-25. CUMULATIVE OCCURRENCES OF DERIVED GUST
VELOCITY PER NAUTICAL MILE FOR 2000-4000 feet
10-4
10-3
10-2
10-1
100
101
102
-40 -30 -20 -10 0 10 20 30 40
4000-6000 Feet
Cum
ulat
ive
Occ
uren
ces
per N
autic
al M
ile
Derived Gust Velocity, Ude
- R/Sec
Cessna 172Daytona220 Flights44014 nm
FIGURE B-26. CUMULATIVE OCCURRENCES OF DERIVED GUST
VELOCITY PER NAUTICAL MILE FOR 4000-6000 feet
B-13
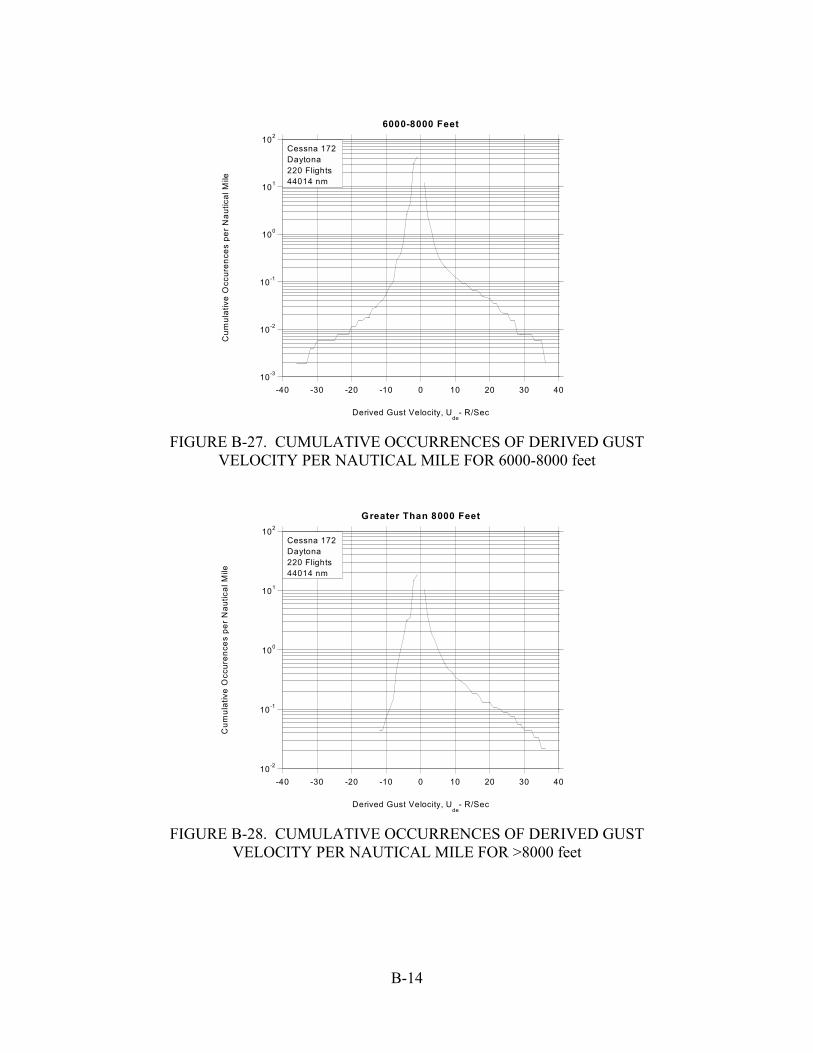
10-3
10-2
10-1
100
101
102
-40 -30 -20 -10 0 10 20 30 40
6000-8000 Feet
Cum
ulat
ive
Occ
uren
ces
per N
autic
al M
ile
Derived Gust Velocity, Ude
- R/Sec
Cessna 172Daytona220 Flights44014 nm
FIGURE B-27. CUMULATIVE OCCURRENCES OF DERIVED GUST
VELOCITY PER NAUTICAL MILE FOR 6000-8000 feet
10-2
10-1
100
101
102
-40 -30 -20 -10 0 10 20 30 40
Greater Than 8000 Feet
Cum
ulat
ive
Occ
uren
ces
per N
autic
al M
ile
Derived Gust Velocity, Ude
- R/Sec
Cessna 172Daytona220 Flights44014 nm
FIGURE B-28. CUMULATIVE OCCURRENCES OF DERIVED GUST
VELOCITY PER NAUTICAL MILE FOR >8000 feet
B-14

-2
-1
0
1
2
3
4
0 50 100 150
Load
Fac
tor (
g)
Velocity (KEAS)
Cessna 172, FOR ILLUSTRATION ONLY
FIGURE B-29. COINCIDENT GUST LOAD FACTOR AND
SPEED DURING DEPARTURE
-2
-1
0
1
2
3
4
0 50 100 150
Load
Fac
tor (
g)
Velocity (KEAS)
Cessna 172, F OR ILLUST RATION O N LY
FIGURE B-30. COINCIDENT GUST LOAD FACTOR AND
SPEED DURING APPROACH
B-15

100
101
102
103
104
105
106
-1.5 -1 -0.5 0 0.5 1 1.5
<2000 Ft2000-4000 Ft4000-6000 Ft6000-8000 Ft>8000 Ft
Cum
ulat
ive
Occ
uren
ces
per 1
000
Hou
rs
Incremental Vertical Load Factor, ∆nz (g)
Cessna 172Daytona
220 Flights
FIGURE B-31. CUMULATIVE OCCURRENCES OF INCREMENTAL
MANEUVER LOAD FACTOR PER 1000 HOURS BY PRESSURE ALTITUDE FOR COMBINED CLIMB, CRUISE, AND DESCENT PHASES
10-5
10-4
10-3
10-2
10-1
100
101
-1.5 -1 -0.5 0 0.5 1 1.5
<2000 Ft2000-4000 Ft4000-6000 Ft6000-8000 Ft>8000 FT
Cum
ulat
ive
Occ
uren
ces
per
Nau
tical
Mile
Incremental Vertical Load Factor, ∆nz (g)
Cessna 172Daytona
220 Flights
FIGURE B-32. CUMULATIVE OCCURRENCES OF INCREMENTAL MANEUVER LOAD FACTOR PER NAUTICAL MILE BY PRESSURE
ALTITUDE FOR COMBINED CLIMB, CRUISE, AND DESCENT PHASES
B-16

102
103
104
105
106
-1 -0.5 0 0.5 1
<2000 Ft2000-4000 Ft4000-6000 Ft6000-8000 Ft>8000 Ft
Cum
ulat
ive
Occ
uren
ces
per 1
000
Hou
rs
Incremental Vertical Load Factor, ∆nz (g)
Cessna 172Daytona
220 Flights
FIGURE B-33. CUMULATIVE OCCURRENCES OF INCREMENTAL
MANEUVER LOAD FACTOR PER 1000 HOURS BY ALTITUDE ABOVE AIRPORT FOR DEPARTURE PHASE
10-3
10-2
10-1
100
101
-1 -0.5 0 0.5 1
<2000 Ft2000-4000 Ft4000-6000 Ft6000-8000 Ft>8000 Ft
Cum
ulat
ive
Occ
uren
ces
per N
autic
al M
ile
Incremental Vertical Load Factor, ∆nz (g)
Cessna 172Daytona
220 Flights
FIGURE B-34. CUMULATIVE OCCURRENCES OF INCREMENTAL MANEUVER LOAD FACTOR PER NAUTICAL MILE BY ALTITUDE
ABOVE AIRPORT FOR DEPARTURE PHASE
B-17

101
102
103
104
105
106
-1 -0.5 0 0.5 1
<2000 Ft2000-4000 Ft4000-6000 Ft6000-8000 Ft>8000 Ft
Cum
ulat
ive
Occ
uren
ces
per 1
000
Hou
rs
Incremental Vertical Load Factor, ∆nz (g)
Cessna 172Daytona
220 Flights
FIGURE B-35. CUMULATIVE OCCURRENCES OF INCREMENTAL
MANEUVER LOAD FACTOR PER 1000 HOURS BY ALTITUDE ABOVE AIRPORT FOR APPROACH PHASE
10-4
10-3
10-2
10-1
100
101
-1 -0.5 0 0.5 1
<2000 Ft2000-4000 Ft4000-6000 Ft6000-8000 Ft>8000 Ft
Cum
ulat
ive
Occ
uren
ces
per
Nau
tical
Mile
Incremental Vertical Load Factor, ∆nz (g)
Cessna 172Daytona
220 Flights
FIGURE B-36. CUMULATIVE OCCURRENCES OF INCREMENTAL MANEUVER LOAD FACTOR PER NAUTICAL MILE BY ALTITUDE
ABOVE AIRPORT FOR APPROACH PHASE
B-18
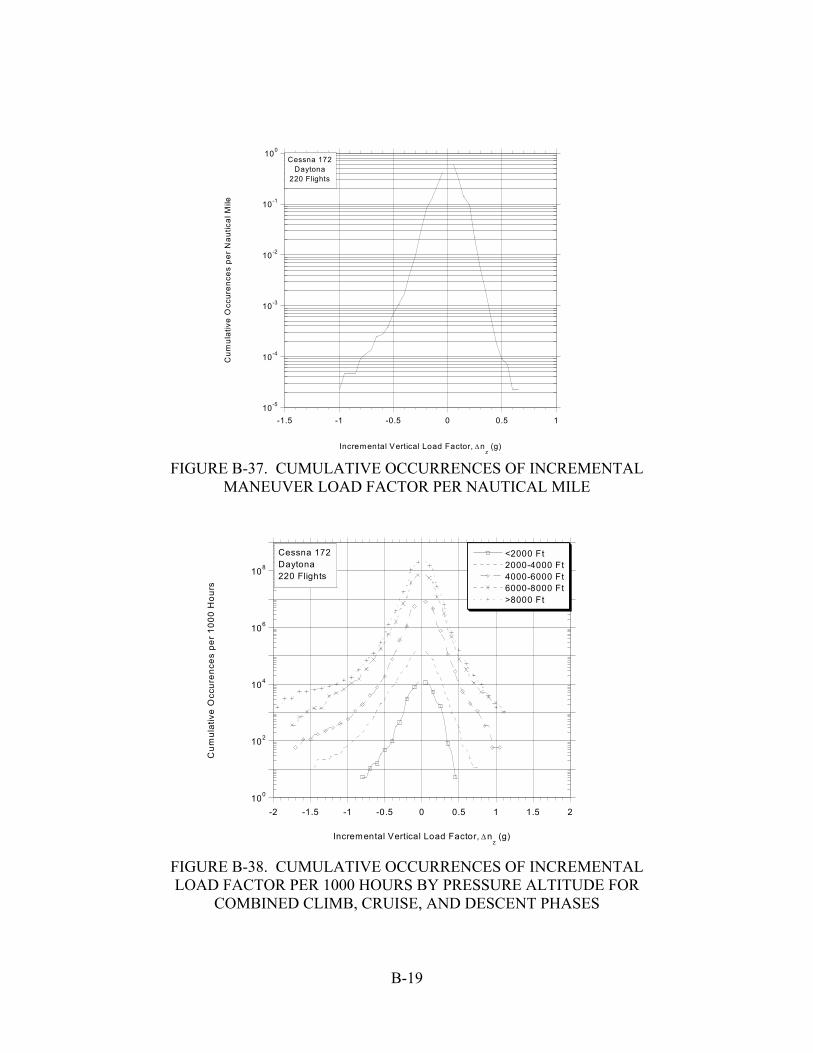
10-5
10-4
10-3
10-2
10-1
100
-1.5 -1 -0.5 0 0.5 1
Cum
ulat
ive
Occ
uren
ces
per
Nau
tical
Mile
Incremental Vertical Load Factor, ∆nz (g)
Cessna 172Daytona
220 Flights
FIGURE B-37. CUMULATIVE OCCURRENCES OF INCREMENTAL
MANEUVER LOAD FACTOR PER NAUTICAL MILE
100
102
104
106
108
-2 -1.5 -1 -0.5 0 0.5 1 1.5 2
<2000 Ft2000-4000 Ft4000-6000 Ft6000-8000 Ft>8000 Ft
Cum
ulat
ive
Occ
uren
ces
per 1
000
Hou
rs
Incremental Vertical Load Factor, ∆nz (g)
Cessna 172Daytona220 Flights
FIGURE B-38. CUMULATIVE OCCURRENCES OF INCREMENTAL LOAD FACTOR PER 1000 HOURS BY PRESSURE ALTITUDE FOR
COMBINED CLIMB, CRUISE, AND DESCENT PHASES
B-19

10-5
10-3
10-1
101
103
-2 -1.5 -1 -0.5 0 0.5 1 1.5 2
<2000 Ft2000-4000 Ft4000-6000 Ft6000-8000 Ft>8000 Ft
Cum
ulat
ive
Occ
uren
ces
per
Nau
tical
Mile
Incremental Vertical Load Factor, ∆nz (g)
Cessna 172Daytona220 Flights
FIGURE B-39. CUMULATIVE OCCURRENCES OF INCREMENTAL LOAD
FACTOR PER NAUTICAL MILE BY PRESSURE ALTITUDE FOR COMBINED CLIMB, CRUISE, AND DESCENT PHASES
102
103
104
105
106
107
108
109
-1.5 -1 -0.5 0 0.5 1 1.5
<2000 Ft2000-4000 Ft4000-6000 Ft6000-8000 Ft>8000 Ft
Cum
ulat
ive
Occ
uren
ces
per 1
000
Hou
rs
Incremental Vertical Load Factor, ∆nz (g)
Cessna 172Daytona220 Flights
FIGURE B-40. CUMULATIVE OCCURRENCES OF INCREMENTAL
LOAD FACTOR PER 1000 HOURS BY ALTITUDE ABOVE AIRPORT FOR DEPARTURE PHASE
B-20
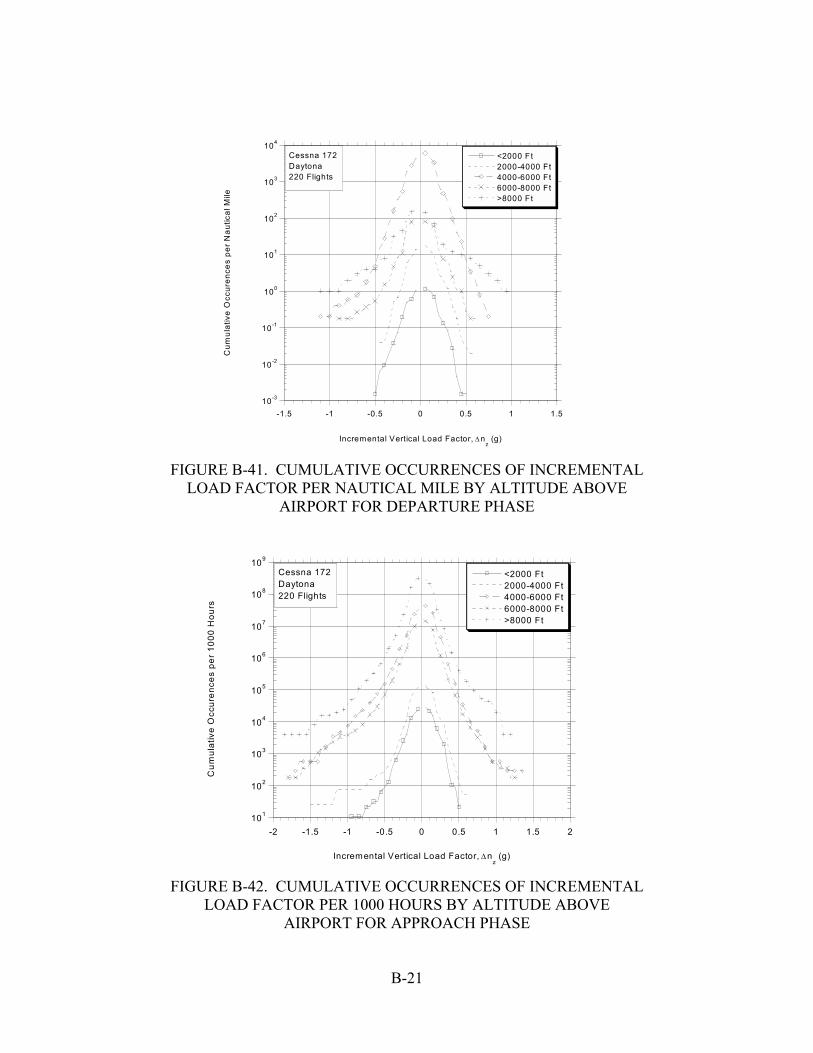
10-3
10-2
10-1
100
101
102
103
104
-1.5 -1 -0.5 0 0.5 1 1.5
<2000 Ft2000-4000 Ft4000-6000 Ft6000-8000 Ft>8000 Ft
Cum
ulat
ive
Occ
uren
ces
per
Nau
tical
Mile
Incremental Vertical Load Factor, ∆nz (g)
Cessna 172Daytona220 Flights
FIGURE B-41. CUMULATIVE OCCURRENCES OF INCREMENTAL
LOAD FACTOR PER NAUTICAL MILE BY ALTITUDE ABOVE AIRPORT FOR DEPARTURE PHASE
101
102
103
104
105
106
107
108
109
-2 -1.5 -1 -0.5 0 0.5 1 1.5 2
<2000 Ft2000-4000 Ft4000-6000 Ft6000-8000 Ft>8000 Ft
Cum
ulat
ive
Occ
uren
ces
per 1
000
Hou
rs
Incremental Vertical Load Factor, ∆nz (g)
Cessna 172Daytona220 Flights
FIGURE B-42. CUMULATIVE OCCURRENCES OF INCREMENTAL
LOAD FACTOR PER 1000 HOURS BY ALTITUDE ABOVE AIRPORT FOR APPROACH PHASE
B-21
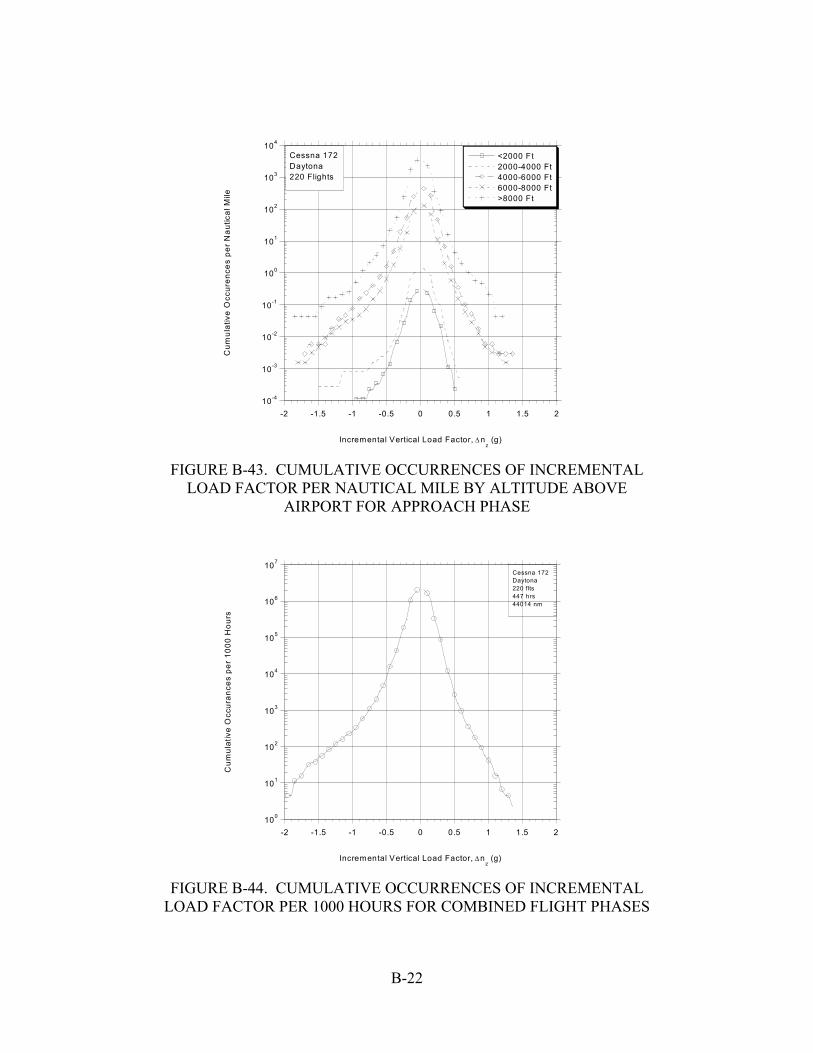
10-4
10-3
10-2
10-1
100
101
102
103
104
-2 -1.5 -1 -0.5 0 0.5 1 1.5 2
<2000 Ft2000-4000 Ft4000-6000 Ft6000-8000 Ft>8000 Ft
Cum
ulat
ive
Occ
uren
ces
per
Nau
tical
Mile
Incremental Vertical Load Factor, ∆nz (g)
Cessna 172Daytona220 Flights
FIGURE B-43. CUMULATIVE OCCURRENCES OF INCREMENTAL
LOAD FACTOR PER NAUTICAL MILE BY ALTITUDE ABOVE AIRPORT FOR APPROACH PHASE
100
101
102
103
104
105
106
107
-2 -1.5 -1 -0.5 0 0.5 1 1.5 2
Cum
ulat
ive
Occ
uran
ces
per 1
000
Hou
rs
Incremental Vertical Load Factor, ∆nz (g)
Cessna 172Daytona220 flts 447 hrs44014 nm
FIGURE B-44. CUMULATIVE OCCURRENCES OF INCREMENTAL
LOAD FACTOR PER 1000 HOURS FOR COMBINED FLIGHT PHASES
B-22
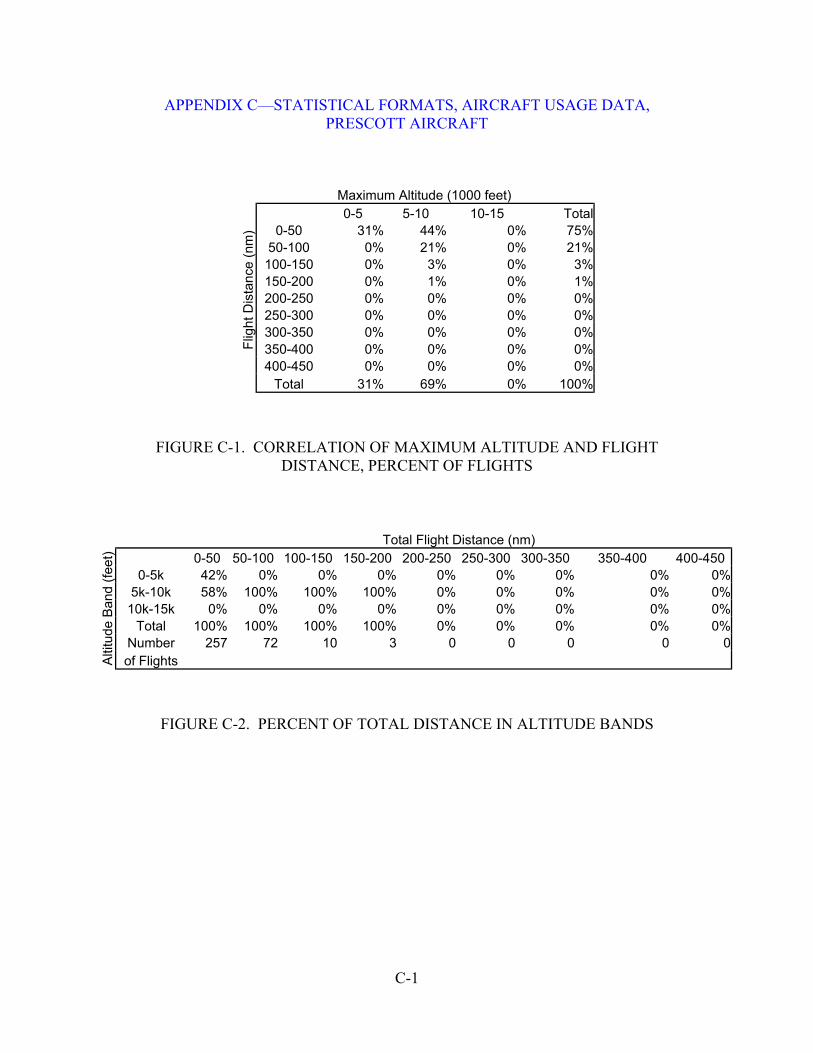
APPENDIX C�STATISTICAL FORMATS, AIRCRAFT USAGE DATA, PRESCOTT AIRCRAFT
Maximum Altitude (1000 feet) 0-5 5-10 10-15 Total
0-50 31% 44% 0% 75% 50-100 0% 21% 0% 21% 100-150 0% 3% 0% 3% 150-200 0% 1% 0% 1% 200-250 0% 0% 0% 0% 250-300 0% 0% 0% 0% 300-350 0% 0% 0% 0% 350-400 0% 0% 0% 0%
F
light
Dis
tanc
e (n
m)
400-450 0% 0% 0% 0% Total 31% 69% 0% 100%
FIGURE C-1. CORRELATION OF MAXIMUM ALTITUDE AND FLIGHT DISTANCE, PERCENT OF FLIGHTS
Total Flight Distance (nm) 0-50 50-100 100-150 150-200 200-250 250-300 300-350 350-400 400-450
0-5k 42% 0% 0% 0% 0% 0% 0% 0% 0% 5k-10k 58% 100% 100% 100% 0% 0% 0% 0% 0%
10k-15k 0% 0% 0% 0% 0% 0% 0% 0% 0% Total 100% 100% 100% 100% 0% 0% 0% 0% 0%
Number 257 72 10 3 0 0 0 0 0
Altit
ude
Band
(fee
t)
of Flights
FIGURE C-2. PERCENT OF TOTAL DISTANCE IN ALTITUDE BANDS
C-1

0
2000
4000
6000
8000
10000
12000
14000
0 50 100 150 200 250 300
Max
imum
Alti
tude
(fee
t)
F light Distance (nm)
Cessna 172Prescott175 flts 245 hrs
24400 nm
FIGURE C-3. COINCIDENT FLIGHT DISTANCE AND MAXIMUM
FLIGHT ALTITUDE
0
2000
4000
6000
8000
1 104
0 50 100 150 200
Pre
ssur
e A
ltitu
de (f
eet)
Indicated Airspace (knots)
Cessna 172Prescott175 flts 245 hrs
24400 nm
Maximum Operating Speed
FIGURE C-4. COINCIDENT ALTITUDE AT MAXIMUM INDICATED
AIRSPEED, ALL FLIGHT PHASES
C-2
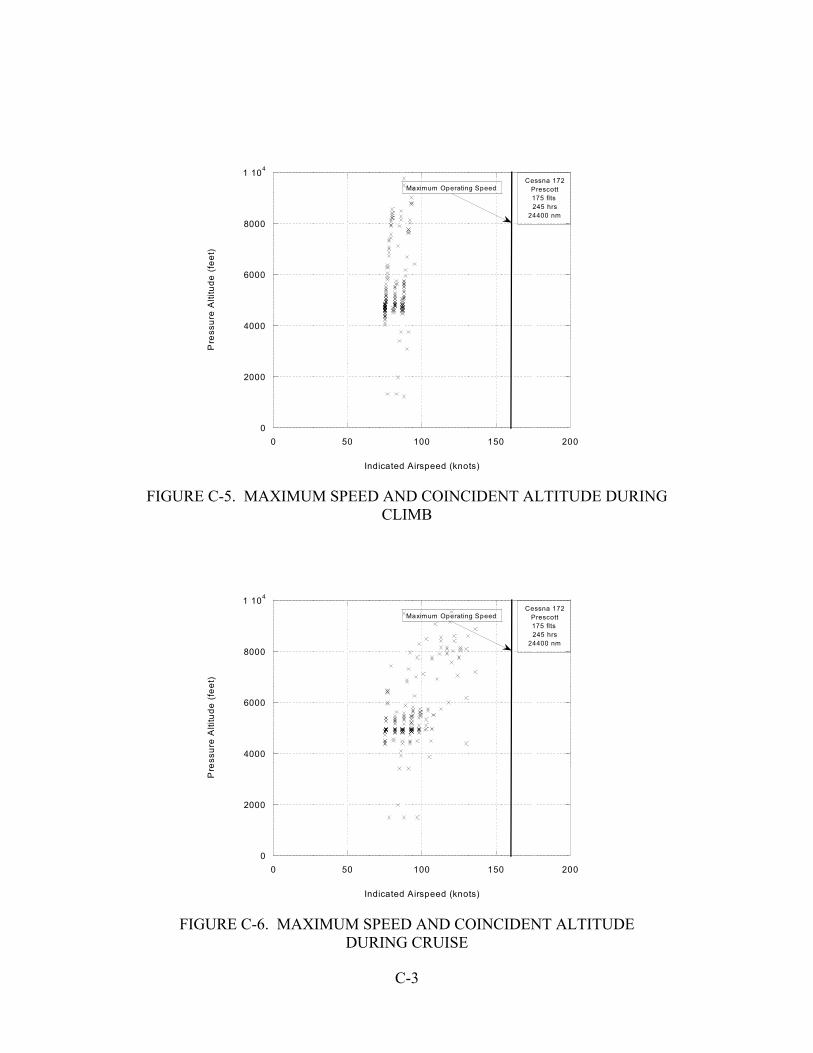
0
2000
4000
6000
8000
1 104
0 50 100 150 200
Pre
ssur
e A
ltitu
de (f
eet)
Indicated Airspeed (knots)
Cessna 172Prescott175 flts 245 hrs
24400 nm
Maximum Operating Speed
FIGURE C-5. MAXIMUM SPEED AND COINCIDENT ALTITUDE DURING
CLIMB
0
2000
4000
6000
8000
1 104
0 50 100 150 200
Pre
ssur
e A
ltitu
de (f
eet)
Indicated Airspeed (knots)
Cessna 172Prescott175 flts 245 hrs
24400 nm
Maximum Operating Speed
FIGURE C-6. MAXIMUM SPEED AND COINCIDENT ALTITUDE
DURING CRUISE
C-3

0
2000
4000
6000
8000
1 104
0 50 100 150 200
Pre
ssur
e A
ltitu
de (f
eet)
Indicated Airspeed (knots)
Cessna 172Prescott175 flts 245 hrs
24400 nm
Maximum Operating Speed
FIGURE C-7. MAXIMUM SPEED AND COINCIDENT ALTITUDE
DURING DESCENT
0
2000
4000
6000
8000
1 104
0 50 100 150 200
Pre
ssur
e A
ltitu
de (f
eet)
Indicated Airspeed (knots)
Cessna 172Prescott175 flts 245 hrs
24400 nm
Maximum Operating Speed
FIGURE C-8. MAXIMUM SPEED AND COINCIDENT ALTITUDE DURING
ALL FLIGHT PHASES
C-4

0
5
10
15
20
25
5 15 25 35 45 55 65 75 85 95 105 115 125135 145 155 165 175 185195 205215 225
Num
ber o
f Flig
hts
Flight Duration (minutes)
Cessna 172Prescott175 flts 245 hrs
24400 nm
FIGURE C-9. NUMBER OF FLIGHTS VS FLIGHT DURATION
0
0.2
0.4
0.6
0.8
1
0 50 100 150 200 250
Cum
ulat
ive
Pro
babi
lity
Flight Duration (minutes)
Cessna 172Prescott175 flts 245 hrs
24400 nm
FIGURE C-10. CUMULATIVE PROBABILITY OF FLIGHT DURATION
C-5
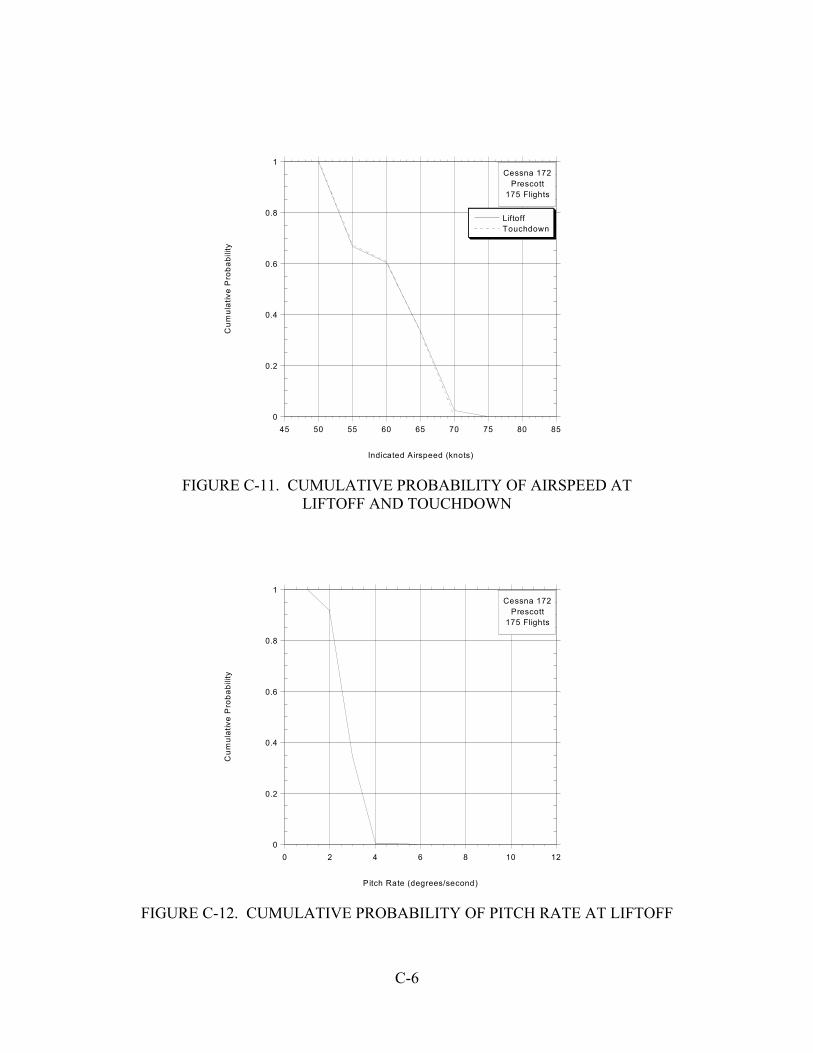
0
0.2
0.4
0.6
0.8
1
45 50 55 60 65 70 75 80 85
LiftoffTouchdown
Cum
ulat
ive
Pro
babi
lity
Indicated Airspeed (knots)
Cessna 172Prescott
175 Flights
FIGURE C-11. CUMULATIVE PROBABILITY OF AIRSPEED AT
LIFTOFF AND TOUCHDOWN
0
0.2
0.4
0.6
0.8
1
0 2 4 6 8 10 12
Cum
ulat
ive
Pro
babi
lity
P itch Rate (degrees/second)
Cessna 172Prescott
175 Flights
FIGURE C-12. CUMULATIVE PROBABILITY OF PITCH RATE AT LIFTOFF
C-6

100
101
102
103
104
105
106
-1.5 -1 -0.5 0 0.5 1 1.5
Taxi OutTaxi In
Cum
ulat
ive
Occ
uren
ces
per 1
000
Flig
hts
Incremental Vertical Load Factor, ∆nz (g)
Cessna 172Prescott
175 Flights
FIGURE C-13. CUMULATIVE FREQUENCY OF INCREMENTAL VERTICAL
LOAD FACTOR DURING TAXI OPERATIONS
100
101
102
103
104
105
-1.5 -1 -0.5 0 0.5 1 1.5
Cum
ulat
ive
Occ
uren
ces
per 1
000
Flig
hts
Incremental Vertical Load Factor, ∆nz (g)
Cessna 172Prescott
175 Flights
FIGURE C-14. CUMULATIVE OCCURRENCES OF INCREMENTAL
VERTICAL LOAD FACTOR DURING TAKEOFF ROLL
C-7
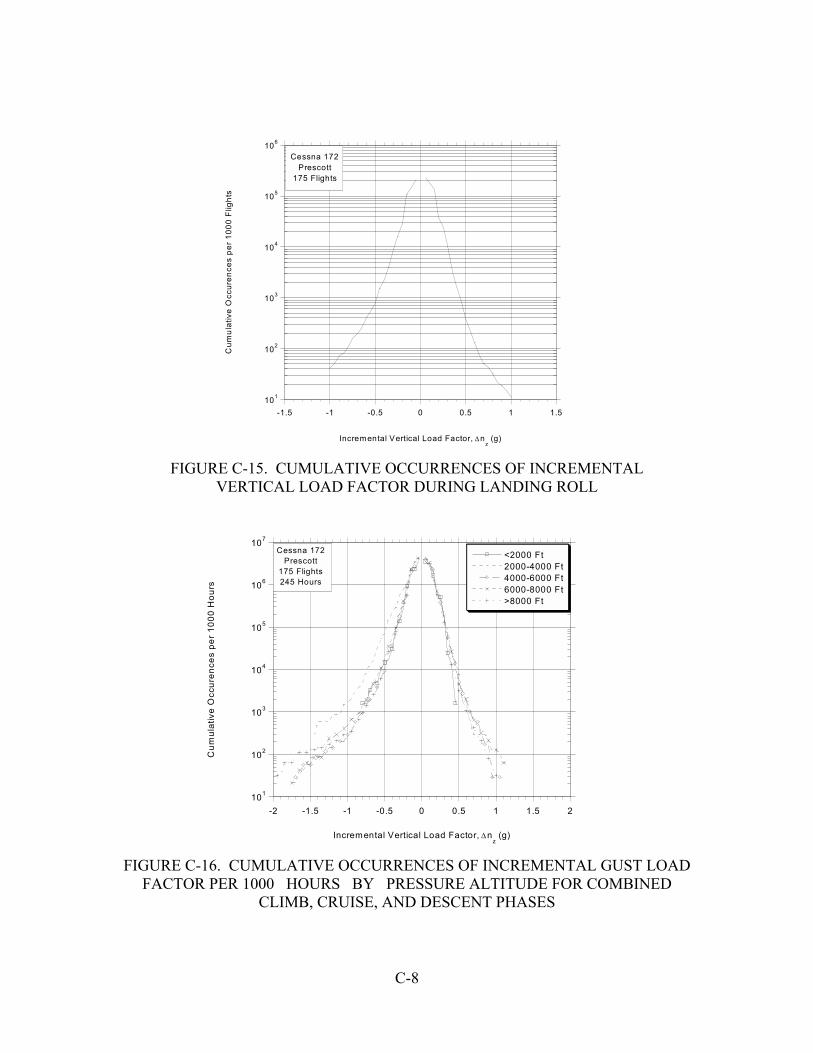
101
102
103
104
105
106
-1.5 -1 -0.5 0 0.5 1 1.5
Cum
ulat
ive
Occ
uren
ces
per 1
000
Flig
hts
Incremental Vertical Load Factor, ∆nz (g)
Cessna 172Prescott
175 Flights
FIGURE C-15. CUMULATIVE OCCURRENCES OF INCREMENTAL
VERTICAL LOAD FACTOR DURING LANDING ROLL
101
102
103
104
105
106
107
-2 -1.5 -1 -0.5 0 0.5 1 1.5 2
<2000 Ft2000-4000 Ft4000-6000 Ft6000-8000 Ft>8000 Ft
Cum
ulat
ive
Occ
uren
ces
per 1
000
Hou
rs
Incremental Vertical Load Factor, ∆nz (g)
Cessna 172Prescott
175 Flights245 Hours
FIGURE C-16. CUMULATIVE OCCURRENCES OF INCREMENTAL GUST LOAD
FACTOR PER 1000 HOURS BY PRESSURE ALTITUDE FOR COMBINED CLIMB, CRUISE, AND DESCENT PHASES
C-8
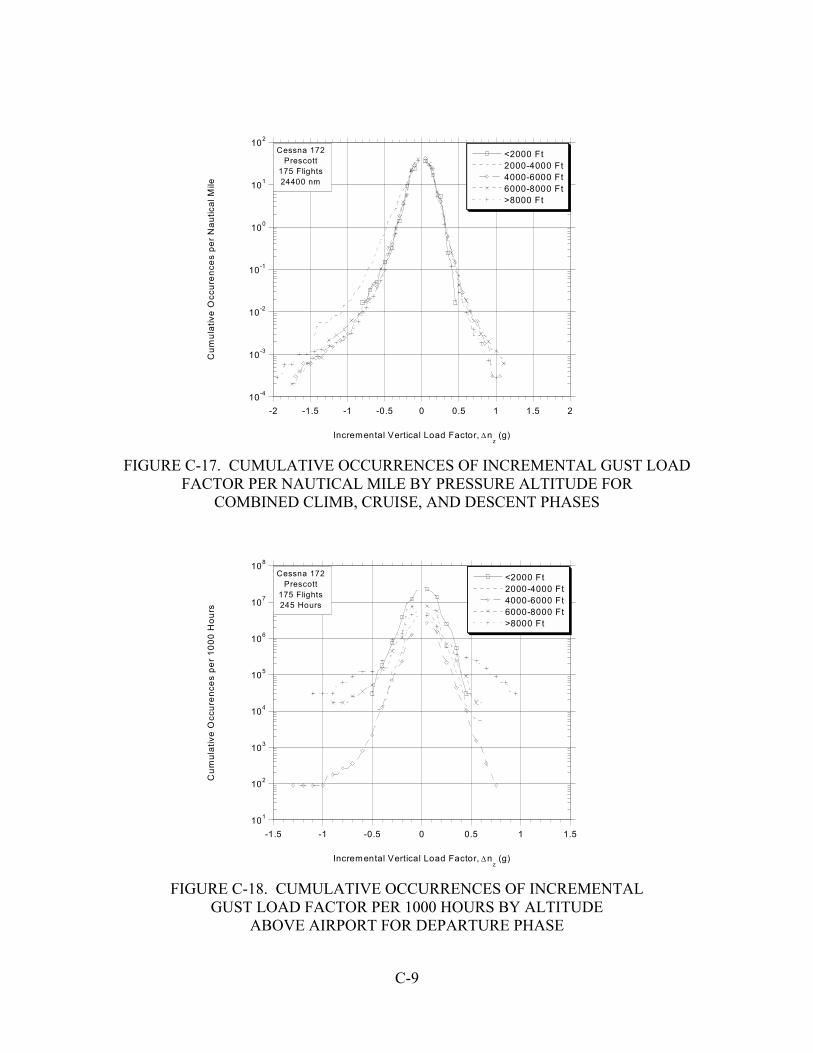
10-4
10-3
10-2
10-1
100
101
102
-2 -1.5 -1 -0.5 0 0.5 1 1.5 2
<2000 Ft2000-4000 Ft4000-6000 Ft6000-8000 Ft>8000 Ft
Cum
ulat
ive
Occ
uren
ces
per
Nau
tical
Mile
Incremental Vertical Load Factor, ∆nz (g)
Cessna 172Prescott
175 Flights24400 nm
FIGURE C-17. CUMULATIVE OCCURRENCES OF INCREMENTAL GUST LOAD
FACTOR PER NAUTICAL MILE BY PRESSURE ALTITUDE FOR COMBINED CLIMB, CRUISE, AND DESCENT PHASES
101
102
103
104
105
106
107
108
-1.5 -1 -0.5 0 0.5 1 1.5
<2000 Ft2000-4000 Ft4000-6000 Ft6000-8000 Ft>8000 Ft
Cum
ulat
ive
Occ
uren
ces
per 1
000
Hou
rs
Incremental Vertical Load Factor, ∆nz (g)
Cessna 172Prescott
175 Flights245 Hours
FIGURE C-18. CUMULATIVE OCCURRENCES OF INCREMENTAL
GUST LOAD FACTOR PER 1000 HOURS BY ALTITUDE ABOVE AIRPORT FOR DEPARTURE PHASE
C-9
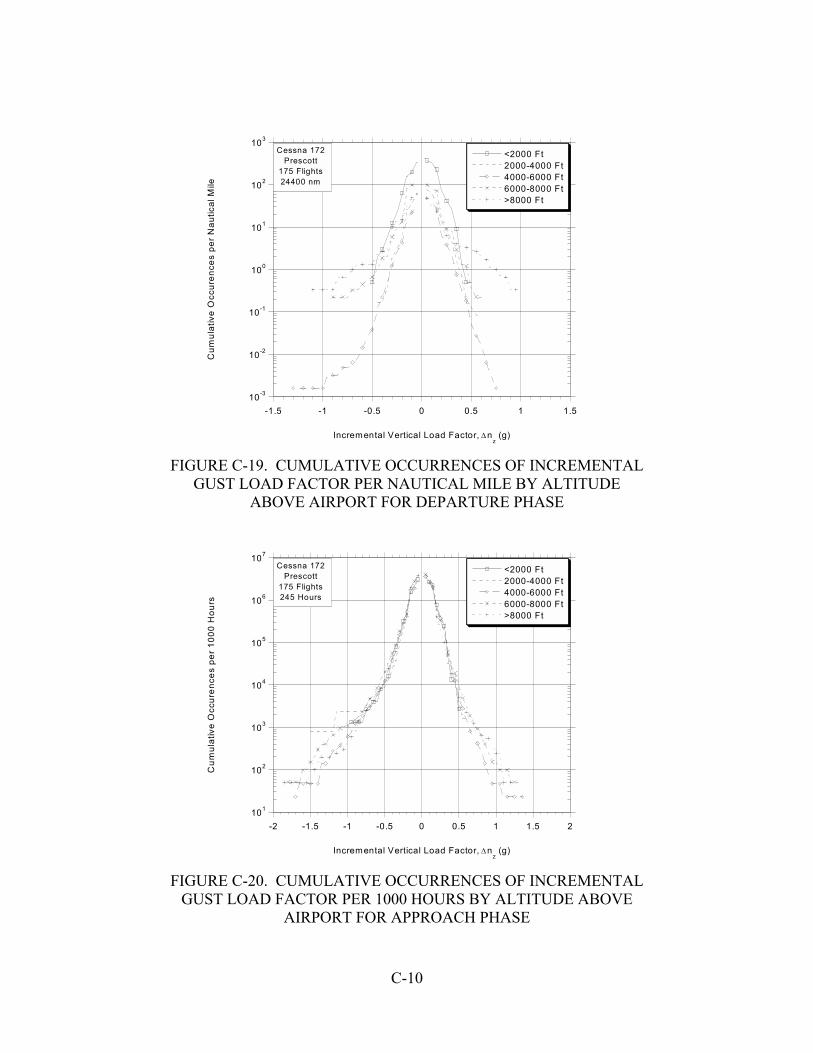
10-3
10-2
10-1
100
101
102
103
-1.5 -1 -0.5 0 0.5 1 1.5
<2000 Ft2000-4000 Ft4000-6000 Ft6000-8000 Ft>8000 Ft
Cum
ulat
ive
Occ
uren
ces
per
Nau
tical
Mile
Incremental Vertical Load Factor, ∆nz (g)
Cessna 172Prescott
175 Flights24400 nm
FIGURE C-19. CUMULATIVE OCCURRENCES OF INCREMENTAL
GUST LOAD FACTOR PER NAUTICAL MILE BY ALTITUDE ABOVE AIRPORT FOR DEPARTURE PHASE
101
102
103
104
105
106
107
-2 -1.5 -1 -0.5 0 0.5 1 1.5 2
<2000 Ft2000-4000 Ft4000-6000 Ft6000-8000 Ft>8000 Ft
Cum
ulat
ive
Occ
uren
ces
per 1
000
Hou
rs
Incremental Vertical Load Factor, ∆nz (g)
Cessna 172Prescott
175 Flights245 Hours
FIGURE C-20. CUMULATIVE OCCURRENCES OF INCREMENTAL
GUST LOAD FACTOR PER 1000 HOURS BY ALTITUDE ABOVE AIRPORT FOR APPROACH PHASE
C-10
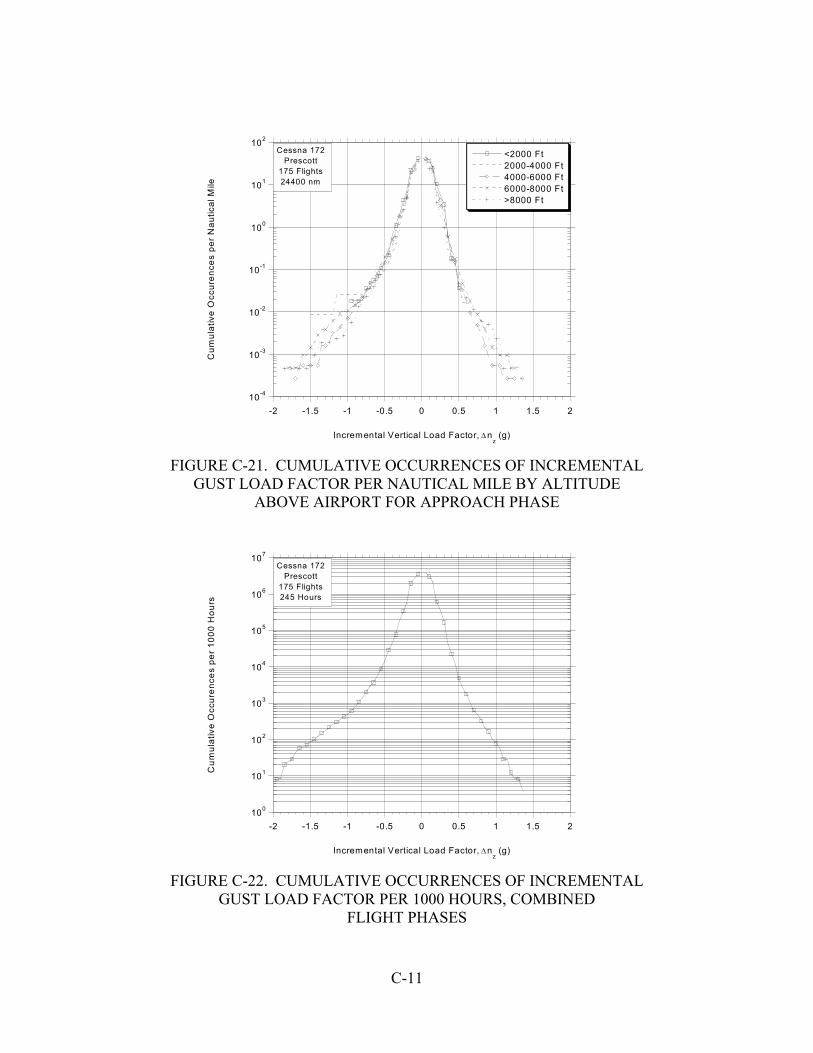
10-4
10-3
10-2
10-1
100
101
102
-2 -1.5 -1 -0.5 0 0.5 1 1.5 2
<2000 Ft2000-4000 Ft4000-6000 Ft6000-8000 Ft>8000 Ft
Cum
ulat
ive
Occ
uren
ces
per
Nau
tical
Mile
Incremental Vertical Load Factor, ∆nz (g)
Cessna 172Prescott
175 Flights24400 nm
FIGURE C-21. CUMULATIVE OCCURRENCES OF INCREMENTAL
GUST LOAD FACTOR PER NAUTICAL MILE BY ALTITUDE ABOVE AIRPORT FOR APPROACH PHASE
100
101
102
103
104
105
106
107
-2 -1.5 -1 -0.5 0 0.5 1 1.5 2
Cum
ulat
ive
Occ
uren
ces
per 1
000
Hou
rs
Incremental Vertical Load Factor, ∆nz (g)
Cessna 172Prescott
175 Flights245 Hours
FIGURE C-22. CUMULATIVE OCCURRENCES OF INCREMENTAL
GUST LOAD FACTOR PER 1000 HOURS, COMBINED FLIGHT PHASES
C-11
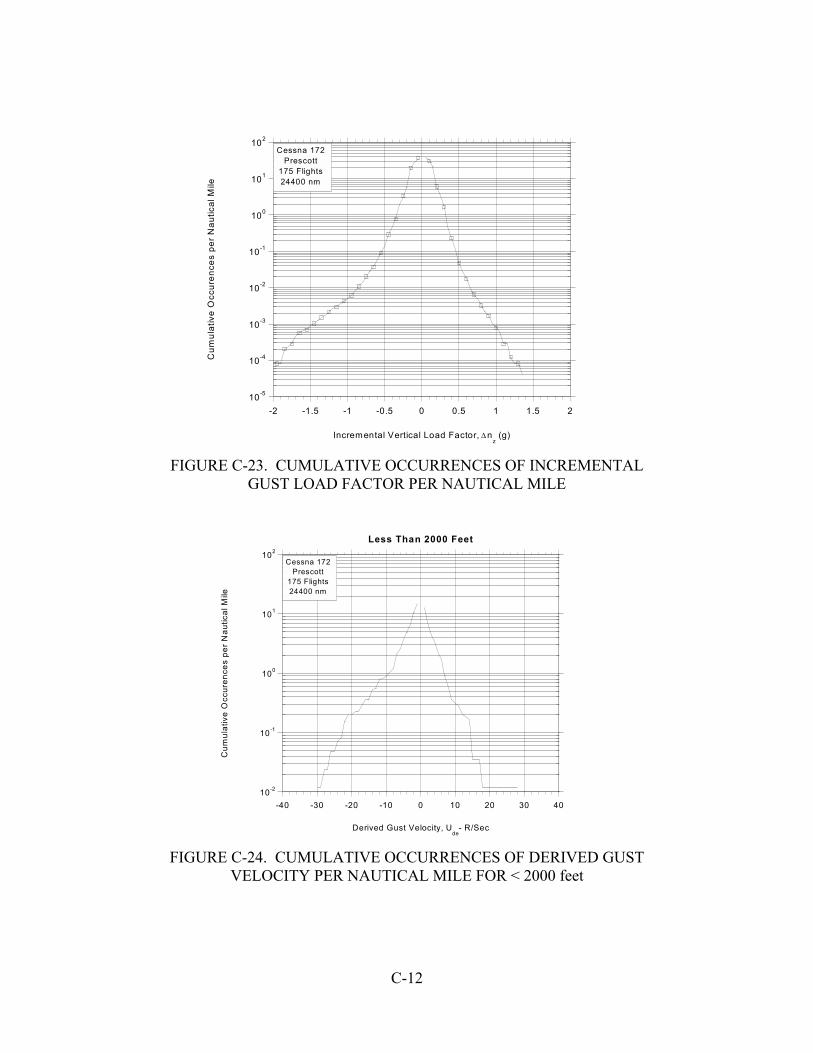
10-5
10-4
10-3
10-2
10-1
100
101
102
-2 -1.5 -1 -0.5 0 0.5 1 1.5 2
Cum
ulat
ive
Occ
uren
ces
per
Nau
tical
Mile
Incremental Vertical Load Factor, ∆nz (g)
Cessna 172Prescott
175 Flights24400 nm
FIGURE C-23. CUMULATIVE OCCURRENCES OF INCREMENTAL
GUST LOAD FACTOR PER NAUTICAL MILE
10-2
10-1
100
101
102
-40 -30 -20 -10 0 10 20 30 40
Less Than 2000 Feet
Cum
ulat
ive
Occ
uren
ces
per N
autic
al M
ile
Derived Gust Velocity, Ude
- R/Sec
Cessna 172Prescott
175 Flights24400 nm
FIGURE C-24. CUMULATIVE OCCURRENCES OF DERIVED GUST
VELOCITY PER NAUTICAL MILE FOR < 2000 feet
C-12

10-3
10-2
10-1
100
101
102
-40 -30 -20 -10 0 10 20 30 40
2000-4000 Feet
Cum
ulat
ive
Occ
uren
ces
per N
autic
al M
ile
Derived Gust Velocity, Ude
- R/Sec
Cessna 172Prescott
175 Flights24400 nm
FIGURE C-25. CUMULATIVE OCCURRENCES OF DERIVED GUST
VELOCITY PER NAUTICAL MILE FOR 2000-4000 feet
10-3
10-2
10-1
100
101
102
-40 -30 -20 -10 0 10 20 30 40
4000-6000 Feet
Cum
ulat
ive
Occ
uren
ces
per N
autic
al M
ile
Derived Gust Velocity, Ude
- R/Sec
Cessna 172Prescott
175 Flights24400 nm
FIGURE C-26. CUMULATIVE OCCURRENCES OF DERIVED GUST
VELOCITY PER NAUTICAL MILE FOR 4000-6000 feet
C-13
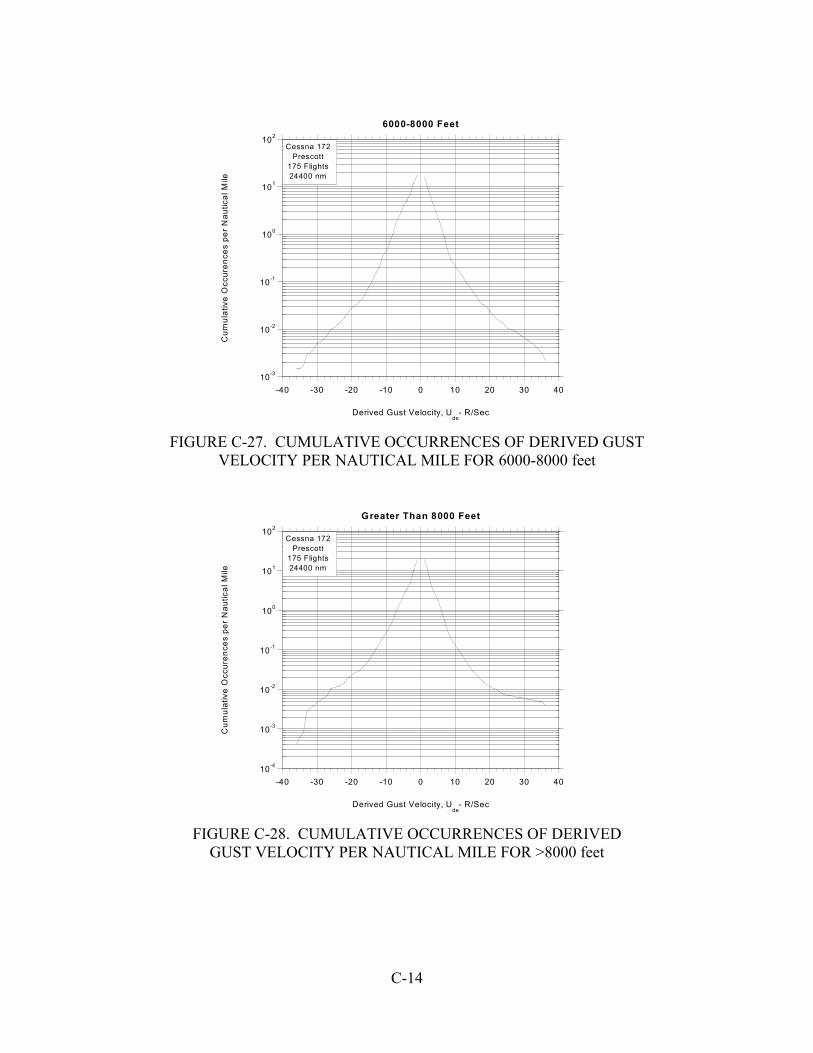
10-3
10-2
10-1
100
101
102
-40 -30 -20 -10 0 10 20 30 40
6000-8000 Feet
Cum
ulat
ive
Occ
uren
ces
per N
autic
al M
ile
Derived Gust Velocity, Ude
- R/Sec
Cessna 172Prescott
175 Flights24400 nm
FIGURE C-27. CUMULATIVE OCCURRENCES OF DERIVED GUST
VELOCITY PER NAUTICAL MILE FOR 6000-8000 feet
10-4
10-3
10-2
10-1
100
101
102
-40 -30 -20 -10 0 10 20 30 40
Greater Than 8000 Feet
Cum
ulat
ive
Occ
uren
ces
per N
autic
al M
ile
Derived Gust Velocity, Ude
- R/Sec
Cessna 172Prescott
175 Flights24400 nm
FIGURE C-28. CUMULATIVE OCCURRENCES OF DERIVED
GUST VELOCITY PER NAUTICAL MILE FOR >8000 feet
C-14

-2
-1
0
1
2
3
4
0 50 100 150
Load
Fac
tor (
g)
Velocity (KEAS)
Cessna 172, FOR ILLUSTRATION ONLY
FIGURE C-29. COINCIDENT GUST LOAD FACTOR AND
SPEED DURING DEPARTURE
-2
-1
0
1
2
3
4
0 50 100 150
Load
Fac
tor (
g)
Velocity (KEAS)
Cessna 172, FOR ILLUSTRATION ONLY
FIGURE C-30. COINCIDENT GUST LOAD FACTOR AND
SPEED DURING APPROACH
C-15
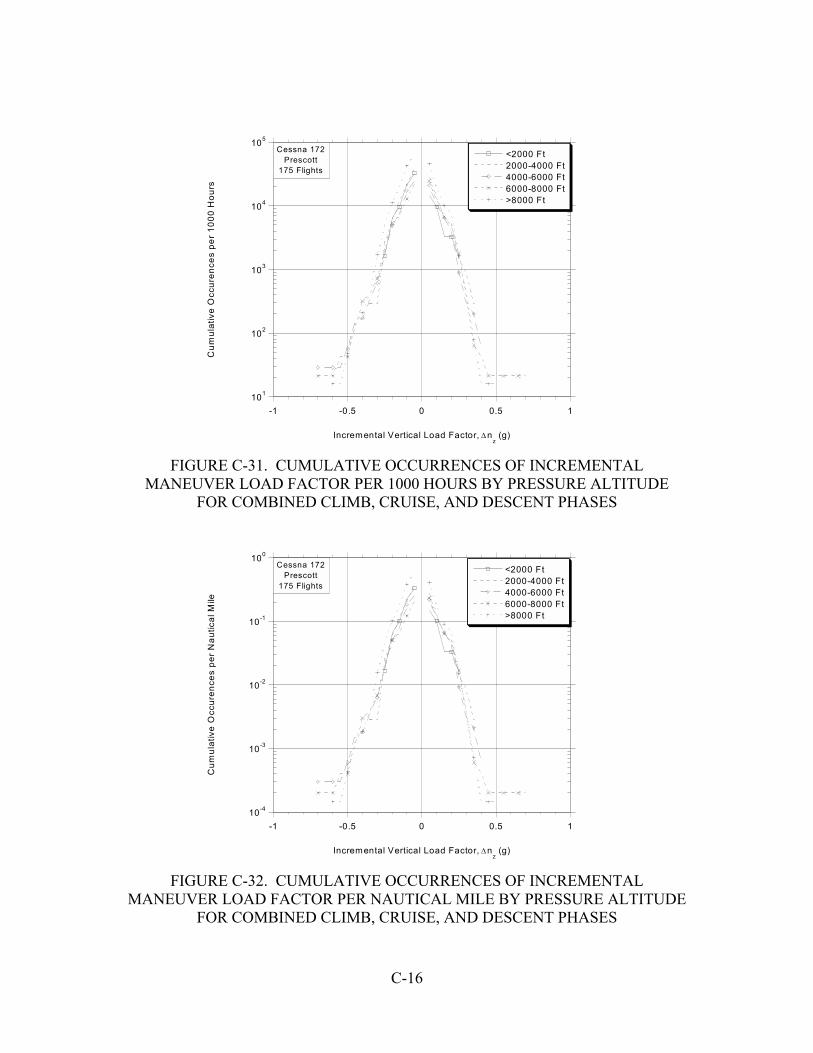
101
102
103
104
105
-1 -0.5 0 0.5 1
<2000 Ft2000-4000 Ft4000-6000 Ft6000-8000 Ft>8000 Ft
Cum
ulat
ive
Occ
uren
ces
per 1
000
Hou
rs
Incremental Vertical Load Factor, ∆nz (g)
Cessna 172Prescott
175 Flights
FIGURE C-31. CUMULATIVE OCCURRENCES OF INCREMENTAL
MANEUVER LOAD FACTOR PER 1000 HOURS BY PRESSURE ALTITUDE FOR COMBINED CLIMB, CRUISE, AND DESCENT PHASES
10-4
10-3
10-2
10-1
100
-1 -0.5 0 0.5 1
<2000 Ft2000-4000 Ft4000-6000 Ft6000-8000 Ft>8000 Ft
Cum
ulat
ive
Occ
uren
ces
per
Nau
tical
Mile
Incremental Vertical Load Factor, ∆nz (g)
Cessna 172Prescott
175 Flights
FIGURE C-32. CUMULATIVE OCCURRENCES OF INCREMENTAL
MANEUVER LOAD FACTOR PER NAUTICAL MILE BY PRESSURE ALTITUDE FOR COMBINED CLIMB, CRUISE, AND DESCENT PHASES
C-16

101
102
103
104
105
106
-0.6 -0.4 -0.2 0 0.2 0.4 0.6
<2000 Ft2000-4000 Ft4000-6000 Ft6000-8000 Ft>8000 Ft
Cum
ulat
ive
Occ
uren
ces
per 1
000
Hou
rs
Incremental Vertical Load Factor, ∆nz (g)
Cessna 172Prescott
175 Flights
FIGURE C-33. CUMULATIVE OCCURRENCES OF INCREMENTAL
MANEUVER LOAD FACTOR PER 1000 HOURS BY ALTITUDE ABOVE AIRPORT FOR DEPARTURE PHASE
10-3
10-2
10-1
100
101
-0.4 -0.3 -0.2 -0.1 0 0.1 0.2 0.3 0.4
<2000 Ft2000-4000 Ft4000-6000 Ft6000-8000 Ft>8000 Ft
Cum
ulat
ive
Occ
uren
ces
per
Nau
tical
Mile
Incremental Vertical Load Factor, ∆nz (g)
Cessna 172Prescott
175 Flights
FIGURE C-34. CUMULATIVE OCCURRENCES OF INCREMENTAL MANEUVER LOAD FACTOR PER NAUTICAL MILE BY ALTITUDE
ABOVE AIRPORT FOR DEPARTURE PHASE
C-17
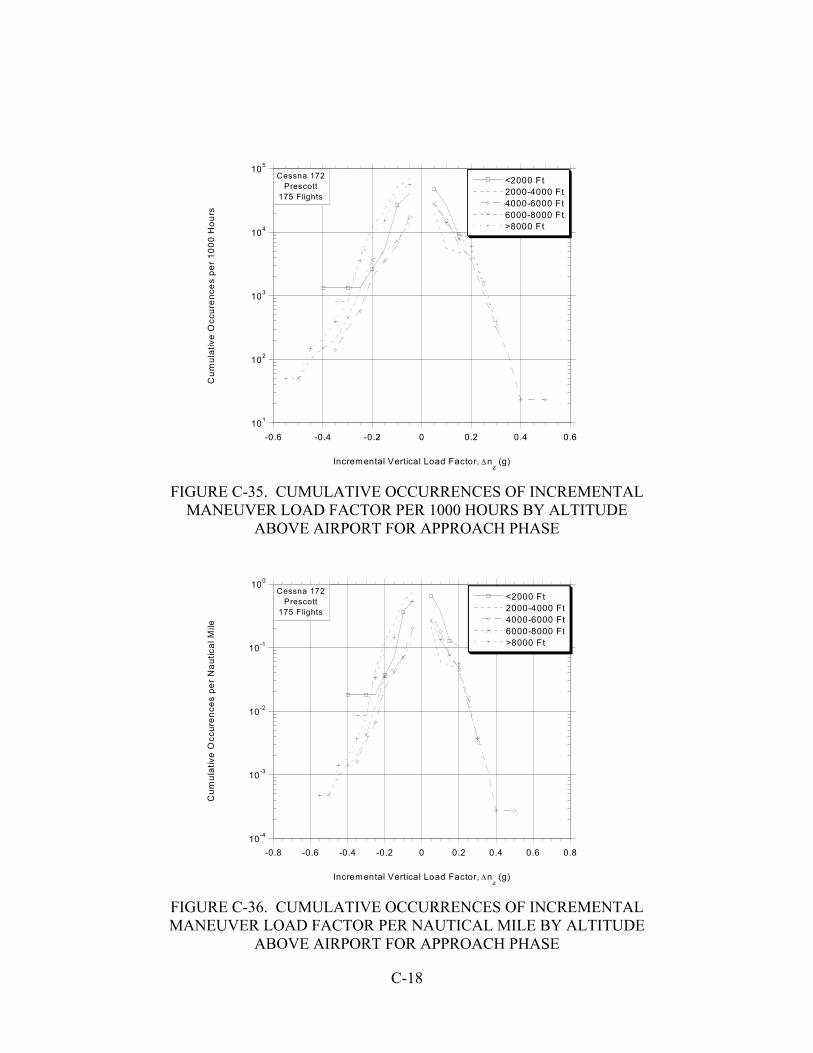
101
102
103
104
105
-0.6 -0.4 -0.2 0 0.2 0.4 0.6
<2000 Ft2000-4000 Ft4000-6000 Ft6000-8000 Ft>8000 Ft
Cum
ulat
ive
Occ
uren
ces
per 1
000
Hou
rs
Incremental Vertical Load Factor, ∆nz (g)
Cessna 172Prescott
175 Flights
FIGURE C-35. CUMULATIVE OCCURRENCES OF INCREMENTAL
MANEUVER LOAD FACTOR PER 1000 HOURS BY ALTITUDE ABOVE AIRPORT FOR APPROACH PHASE
10-4
10-3
10-2
10-1
100
-0.8 -0.6 -0.4 -0.2 0 0.2 0.4 0.6 0.8
<2000 Ft2000-4000 Ft4000-6000 Ft6000-8000 Ft>8000 Ft
Cum
ulat
ive
Occ
uren
ces
per
Nau
tical
Mile
Incremental Vertical Load Factor, ∆nz (g)
Cessna 172Prescott
175 Flights
FIGURE C-36. CUMULATIVE OCCURRENCES OF INCREMENTAL MANEUVER LOAD FACTOR PER NAUTICAL MILE BY ALTITUDE
ABOVE AIRPORT FOR APPROACH PHASE
C-18

10-5
10-4
10-3
10-2
10-1
100
-0.8 -0.6 -0.4 -0.2 0 0.2 0.4 0.6 0.8
Cum
ulat
ive
Occ
uren
ces
per
Nau
tical
Mile
Incremental Vertical Load Factor, ∆nz (g)
Cessna 172Prescott
175 Flights
FIGURE C-37. CUMULATIVE OCCURRENCES OF INCREMENTAL
MANEUVER LOAD FACTOR PER NAUTICAL MILE
101
102
103
104
105
106
107
-1.5 -1 -0.5 0 0.5 1 1.5
<2000 Ft2000-4000 Ft4000-6000 Ft6000-8000 Ft>8000 Ft
Cum
ulat
ive
Occ
uren
ces
per 1
000
Hou
rs
Incremental Vertical Load Factor, ∆nz (g)
Cessna 172Prescott
175 Flights
FIGURE C-38. CUMULATIVE OCCURRENCES OF INCREMENTAL LOAD FACTOR PER 1000 HOURS BY PRESSURE ALTITUDE FOR
COMBINED CLIMB, CRUISE, AND DESCENT PHASES
C-19

10-4
10-3
10-2
10-1
100
101
102
-1.5 -1 -0.5 0 0.5 1 1.5
<2000 Ft2000-4000 Ft4000-6000 Ft6000-8000 Ft>8000 Ft
Cum
ulat
ive
Occ
uren
ces
per
Nau
tical
Mile
Incremental Vertical Load Factor, ∆nz (g)
Cessna 172Prescott
175 Flights
FIGURE C-39. CUMULATIVE OCCURRENCES OF INCREMENTAL LOAD FACTOR PER NAUTICAL MILE BY PRESSURE ALTITUDE
FOR COMBINED CLIMB, CRUISE, AND DESCENT PHASES
101
103
105
107
109
-3 -2 -1 0 1 2 3
<2000 Ft2000-4000 Ft4000-6000 Ft6000-8000 Ft>8000 Ft
Cum
ulat
ive
Occ
uren
ces
per 1
000
Hou
rs
Incremental Vertical Load Factor, ∆nz (g)
Cessna 172Prescott
175 Flights
FIGURE C-40. CUMULATIVE OCCURRENCES OF INCREMENTAL
LOAD FACTOR PER 1000 HOURS BY ALTITUDE ABOVE AIRPORT FOR DEPARTURE PHASE
C-20
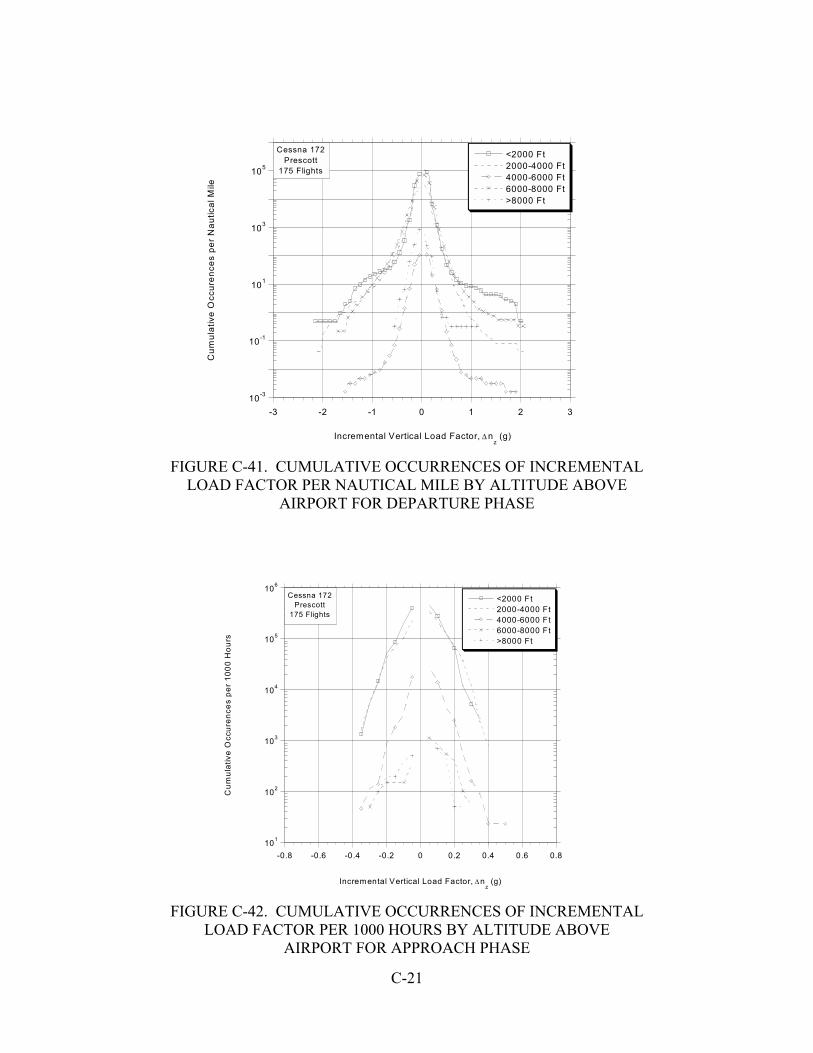
10-3
10-1
101
103
105
-3 -2 -1 0 1 2 3
<2000 Ft2000-4000 Ft4000-6000 Ft6000-8000 Ft>8000 Ft
Cum
ulat
ive
Occ
uren
ces
per
Nau
tical
Mile
Incremental Vertical Load Factor, ∆nz (g)
Cessna 172Prescott
175 Flights
FIGURE C-41. CUMULATIVE OCCURRENCES OF INCREMENTAL
LOAD FACTOR PER NAUTICAL MILE BY ALTITUDE ABOVE AIRPORT FOR DEPARTURE PHASE
101
102
103
104
105
106
-0.8 -0.6 -0.4 -0.2 0 0.2 0.4 0.6 0.8
<2000 Ft2000-4000 Ft4000-6000 Ft6000-8000 Ft>8000 Ft
Cum
ulat
ive
Occ
uren
ces
per 1
000
Hou
rs
Incremental Vertical Load Factor, ∆nz (g)
Cessna 172Prescott
175 Flights
FIGURE C-42. CUMULATIVE OCCURRENCES OF INCREMENTAL
LOAD FACTOR PER 1000 HOURS BY ALTITUDE ABOVE AIRPORT FOR APPROACH PHASE
C-21

10-4
10-3
10-2
10-1
100
101
-0.8 -0.6 -0.4 -0.2 0 0.2 0.4 0.6 0.8
<2000 Ft2000-4000 Ft4000-6000 Ft6000-8000 Ft>8000 Ft
Cum
ulat
ive
Occ
uren
ces
per
Nau
tical
Mile
Incremental Vertical Load Factor, ∆nz (g)
Cessna 172Prescott
175 Flights
FIGURE C-43. CUMULATIVE OCCURRENCES OF INCREMENTAL
LOAD FACTOR PER NAUTICAL MILE BY ALTITUDE ABOVE AIRPORT FOR APPROACH PHASE
100
101
102
103
104
105
106
107
-3 -2 -1 0 1 2 3
Cum
ulat
ive
Occ
uran
ces
per 1
000
Hou
rs
Incremental Vertical Load Factor, ∆nz (g)
Cessna 172Prescott
175 Flights245 Hrs
24400 nm
FIGURE C-44. CUMULATIVE OCCURRENCES OF INCREMENTAL
LOAD FACTOR PER 1000 HOURS FOR COMBINED FLIGHT PHASES
C-22


