
Cerebral Cortex
doi:10.1093/cercor/bhp063
Functional Heterogeneity of InferiorParietal Cortex during MathematicalCognition Assessed withCytoarchitectonic Probability Maps
S. S. Wu1, T. T. Chang1,2, A. Majid1, S. Caspers3, S. B. Eickhoff3
and V. Menon1,4,5
1Department of Psychiatry and Behavioral Sciences, Stanford
University School of Medicine, Stanford, CA 94305, 2Institute of
Neuroscience, National Yang-Ming University, Taipei 112,
Taiwan, 3Research Centre Julich, Institute of Neurosciences
and Biophysics-Medicine, 52425 Julich, Germany, 4Program in
Neuroscience and 5Symbolic Systems Program, Stanford
University School of Medicine, Stanford, CA 94305
S. S. Wu and T. T. Chang contributed equally to the study.
Although the inferior parietal cortex (IPC) has been consistentlyimplicated in mathematical cognition, the functional roles of itssubdivisions are poorly understood. We address this problem usingprobabilistic cytoarchitectonic maps of IPC subdivisions intraparietalsulcus (IPS), angular gyrus (AG), and supramarginal gyrus. Wequantified IPC responses relative to task difficulty and individualdifferences in task proficiency during mental arithmetic (MA) tasksperformed with Arabic (MA-A) and Roman (MA-R) numerals. The 2tasks showed similar levels of activation in 3 distinct IPS areas, hIP1,hIP2, and hIP3, suggesting their obligatory role inMA. Both AG areas,PGa and PGp, were strongly deactivated in both tasks, with strongerdeactivations in posterior area PGp. Comparedwith themore difficultMA-R task, the MA-A task showed greater responses in both AGareas, but this effect was driven by less deactivation in the MA-Atask. AG deactivations showed prominent overlap with lateralparietal nodes of the default mode network, suggesting a nonspecificrole in MA. In both tasks, greater bilateral AG deactivation wasassociated with poorer performance. Our findings suggest a closelink between IPC structure and function and they provide newevidence for behaviorally salient functional heterogeneity within theIPC during mathematical cognition.
Keywords: angular gyrus, automaticity, intraparietal sulcus, mentalarithmetic, supramarginal gyrus
Introduction
The neural basis of mathematical cognition has been intensely
studied in recent years given its importance as a skill weuse nearly
every day. Brain imaging studies have consistently identified
a distributed set of brain regions that includes, most prominently,
the ventral visual areas, including the lingual and fusiform gyri,
inferior parietal cortex (IPC), and the ventrolateral prefrontal
cortex (PFC; Burbaudet al. 1995;Dehaeneet al. 1999;Delazer et al.
2006; Menon, Rivera, White, Eliez, et al. 2000; Menon, Rivera,
White, Glover, et al. 2000; Menon et al. 2002; Rickard et al. 2000;
Zago et al. 2001). Within this distributed network, the IPC is
thought to play a critical role in representing and manipulating
quantitative information, whereas other brain regions, such as the
ventrolateral and dorsolateral PFC, are engaged in supportive
functions such as working memory, sequencing, controlled
retrieval, and decision making (Rueckert et al. 1996; Dehaene
et al. 1999; Kazui et al. 2000; Menon, Rivera, White, Glover, et al.
2000; Gruber et al. 2001; Delazer et al. 2003; Zago et al. 2008). The
IPC comprises multiple heteromodal regions that play an
important role in semantic, phonological, and visuospatial
representation of numerical information (Caspers et al. 2008).
IPC regions along the banks of the intraparietal sulcus (IPS) aswell
as the adjoining angular gyrus (AG) and supramarginal gyrus
(SMG) have all been implicated in tasks involving mathematical
problem solving. Little is known, however, about the differential
contributions of these regions, an issue that has been particularly
confounded by lack of knowledge about the precise anatomical
boundaries of the IPC.
Current efforts in understanding the role of the IPC in
mathematical cognition have focused on the IPS because of its
role in basic number identification and number comparison tasks
(Cohen et al. 2000; Duffau et al. 2002; Delazer et al. 2003; Cohen
Kadoshetal. 2007; Piazzaetal. 2007).Toa lesser extent, the leftAG
has drawn interest, based on its purported role in rapid, verbally
mediated fact retrieval. In a meta-analysis of their data, Dehaene
et al. (2003) suggested that the number manipulation in the IPS is
supplemented by the left AG when verbal manipulation of
numbers is needed and that attention to visuospatial representa-
tions on the mental number line is supported by the bilateral
posterior superior parietal lobule. Less attention has been paid to
the SMG, a brain region important for phonological rehearsal and
working memory functions that are evoked during mathematical
problem-solving tasks.
Several brain imaging studies have investigated the role of the
left and right IPC in mental arithmetic (MA) operations such as
single- and double-digit addition, subtraction, and multiplication
(Roland and Friberg 1985; Burbaud et al. 1995; Dehaene and
Cohen 1997; Menon, Rivera, White, Eliez, et al. 2000; Gruber
et al. 2001; Simon et al. 2002). IPC responses during the solution
of more abstract and complex mathematical problems, such as
calculus integrals, have also been investigated (Krueger et al.
2008). In both cases, the specific contribution of various
subdivisions of the IPC in mathematical problem solving is still
unclear. Findings to date have been contradictory with respect
to task-related dissociations in the IPC during computationally
demanding tasks compared with more automated tasks.
Whereas some brain imaging studies have reported greater
bilateral activation in the IPS during more computationally
demanding MA tasks, others have reported greater responses in
the left AG during more automated MA tasks (Grabner et al.
2007; Ischebeck et al. 2007). Importantly, at least one study has
reported relative decreases, or deactivation, in the left and right
AG and the SMG during a simple well-automated multiplication
task, compared with a magnitude judgment task (Rickard et al.
2000). To our knowledge, the study by Rickard and colleagues
was the first and only study that reported deactivation in both
the left and right AG and SMG during MA. Interestingly, this
study noted deactivation in every one of their participants, but
the precise localization of this deactivation was ambiguously
stated to be in a bilateral area centered between the SMG and
the AG. Besides the lack of precise localization of IPC responses,
� The Author 2009. Published by Oxford University Press. All rights reserved.
For permissions, please e-mail: [email protected]
Cerebral Cortex Advance Access published April 30, 2009

another central issue here is that task-related differences can arise
from greater activation in the more automated task or greater
deactivation during the more computationally demanding task.
We address both these issues here at length. Recent studies have
highlightedprominent andconsistentdeactivationsof IPC regions
in and around the AG across a broad range of cognitive tasks
(Greicius et al. 2003; Mechelli et al. 2003; Humphries et al. 2007;
Schulman et al. 2003; Harrison et al. 2008; Sweet et al. 2008).
Moreover, there is growing evidence to suggest that the level of
deactivation decreases with increasing task difficulty (Greicius
et al. 2003; Schulman et al. 2003). These deactivations have
received less attention in the domain of MA problem solving,
and several researchers have, on the contrary, highlighted the
engagement, rather than disengagement of the AG in more
automated fact retrieval. To address this issue, we systematically
investigated both activation and deactivation in specific subdivi-
sions of the IPC as a function of task difficulty.
A major reason for the contradictory findings in the literature
has been the poor demarcation of the boundaries of regions that
constitute the IPC. There are 2 fundamental problems here; first,
the boundaries between the IPS and rest of the IPC are unknown.
Second, demarcation of the AG from the SMG is ambiguous as far
as macroanatomical features are concerned. Brodmann (1909)
differentiated the IPC into 2 areas: the SMG (BA 40) on the rostral
aspects of the IPC and AG (BA 39) on the caudal aspects of the
IPC. According to Brodmann, the SMG and the AG are demarcated
by the Jensen sulcus, but using this sulcus as a border between BA
40 and BA 39 is problematic because of its highly irregular and
variable form. Even more problematic is the issue of demarcating
the AG and the SMG from the IPS. Othermore recently developed
parcellation schemes (Tzourio-Mazoyer et al. 2002; Desikan et al.
2006) commonly used in brain imaging studies also suffer from
similar deficiencies. Importantly, no existing methods offer
a scheme to parcellate the IPS. The dorsal and ventral aspects
of the IPS are often arbitrarily ascribed to the IPC or the superior
parietal lobule. For example, some studies have treated the ventral
bank of the IPS as a part of the AG,whereas others have referred to
it as the IPS (Menon, Rivera, White, Glover, et al. 2000; Ischebeck
et al. 2006). Thus, the boundaries segregating the IPS from the
AG and the SMG are ill specified, leading to misrepresentation
of observed functional brain responses in these regions.
The recent availability of probabilistic cytoarchitectonic
maps has the potential to inform and significantly enhance
our understanding of the functional architecture of the IPC in
mathematical cognition. Cytoarchitectonic maps obtained from
postmortem brains suggest that the human IPC has a more
finely grained parcellation than previously suggested by the
classical Brodmann map. These maps provide objective a priori
regions of interest (ROI) that can be used to test anatomically
specific hypotheses about the localization of functional
activations (Caspers et al. 2008). Recent studies have suggested
that the borders of the IPS, SMG, and the AG cannot be reliably
detected using macroanatomic or gross anatomical features on
magnetic resonance images (MRIs) (Caspers et al. 2008).
Detailed analysis of cell types suggests that the IPS can be
subdivided into at least 3 regions, as shown in Figure 1. The
human intraparietal area 2 (hIP2) occupies the anterior, lateral
bank of the human IPS, and area hIP1 is located immediately
posterior and medial to hIP2 (Choi et al. 2006). These regions
correspond roughly to the monkey anterior intraparietal area,
whereas area hIP3 that occupies the posterior human IPS
corresponds approximately to monkey ventral intraparietal area
(Scheperjans, Eickhoff, et al. 2008; Scheperjans, Hermann, et al.
2008). Ventral to these IPS regions are 2 areas that cover the AG
and 5 that cover the SMG (Caspers et al. 2006). The AG consists
of the anterior and posterior areas PGa and PGp, respectively,
encompassing the caudal aspects of the IPC. In contrast,
3 larger, more dorsal regions— PFm, PF, PFt— and 2 smaller
ventral regions— PFcm and PFop— encompass the rostral
segments of the IPC along the rostral to caudal axis. Posteriorly,
region PFm of the SMG borders the AG region PGa (Caspers
et al. 2006, 2008). To account for variability in size and extent
of these areas across individuals, cytoarchitectonic probabilistic
maps have been calculated for each area in stereotaxic space
(Caspers et al. 2008; Scheperjans, Eickhoff, et al. 2008). These
probabilistic maps provide a robust anatomical reference for
more accurately characterizing structure--function relations in
the human IPC during mathematical problem solving.
Figure 1. Cytoarchitectonic maps of the IPC. Cytoarchitectonic maps of 3 IPS—hIP3, hIP1, and hIP2, 2 AG—PGp and PGa, and 5 SMG—PFm, PF, PFt, PFcm, and PFop areas ofthe IPC used in the study, ordered along a posterior to anterior gradient (Caspers et al. 2006; Choi et al. 2006; Scheperjans, Hermann, et al. 2008). Surface renderings and coronalsections are shown with the numbers at the bottom of each panel indicating the location of the slices (y-axis in MNI coordinates).
Page 2 of 16 Parietal Heterogeneity during Mathematical Cognition d Wu et al.

In the present study, we compared brain responses to simple
MA tasks involving familiar and well-rehearsed Arabic numerals
to similar MA tasks performed with less familiar Roman
numerals. Previous brain imaging studies of mathematical
cognition have focused primarily on MA operations that are well
rehearsed and automated in adults. An important question
regarding the function of specific IPC regions relates to how they
respond to different levels of task automaticity and individual
differences in task proficiency. To address this question, we
examined IPC responses during both automated and nonauto-
mated MA tasks. We use the notion of automaticity here in the
same sense as Logan (1988). In this view, automated processes are
more dependent on memory-based solutions and retrieval,
whereas nonautomated processes rely on algorithmic computa-
tions. It is currently not known exactly how IPS, AG, and SMG
responses changewith task automaticity, an issueweaddresshere
using cytoarchitectonically distinct maps of the IPC.
Behavioral studies have provided compelling evidence that
changing the surface format of numerals is an effective way to
alter the automaticity of mathematical information processing
(Perry 1952; McCarthy and Dillon 1973; Gonzalez and Kolers
1982; Campbell and Fugelsang 2001; Hiscock et al. 2001;
Venkatraman et al. 2006; Ansari 2007). For example, Campbell
and Fugelsang (2001) found that participants were slower and
less accurate at assessing 1-digit math problems that were
presented in written English format (e.g. three + four = eight)
than in a number format (e.g. 3 + 4 = 8). They proposed that the
decrease in performance arose from the more complex written
format using less efficient strategies and that participants relied
more on explicit calculation than direct retrieval-based strategies
(Schunn et al. 1997). Several studies have also compared
processing of familiar Arabic numerals with the less familiar
Roman numerals (Perry 1952; McCarthy and Dillon 1973;
Gonzalez and Kolers 1982). These studies have consistently
found that mental addition with Roman numerals takes signif-
icantly longer thanwithArabicnumerals. In a paced serial addition
task, participants had significantly higher accuracy and shorter
reaction times (RTs) when the stimuli were presented in Arabic,
compared with Roman, format (Hiscock et al. 2001). Taken
together, these studies suggest that automaticity of mathematical
information processing can be manipulated in a controlled
manner by merely altering the surface format of the numerals.
We used arithmetic verification tasks similar to those used in
previous studies (Menon, Rivera, White, Eliez, et al. 2000;
Menon, Rivera, White, Glover, et al. 2000), except that the
participants performed 2 versions of the task—MA with Arabic
(MA-A task) and MA with Roman numerals (MA-R task).
Although the format of the Arabic and Roman equations (e.g.
2 + 3 – 1 = 4 and II + III – I = IV) was similar, the Roman
numeral condition relied less on efficient and automatic
memory retrieval than the Arabic numeral equations (Campbell
and Fugelsang 2001; Hiscock et al. 2001). We used 3-operand,
rather than 2-operand, equations in order to keep the tasks
relatively simple while simultaneously providing sufficient
variability in performance to facilitate examination of the
relation between accuracy and brain response in the IPC
(Menon, Rivera, White, Glover, et al. 2000). Lassaline and Logan
(1993) have argued that transfer of memory-based automaticity
is narrow because learning tends to be item specific. This
suggests that participants typically cannot directly retrieve
facts from memory when presented with MA problems in the
Roman format. A key difference between the 2 tasks is that the
MA-R requires more controlled and effortful retrieval, whereas
the MA-A task involves more direct and effortless retrieval.
In summary, the main aims of our study were to 1) investigate
the differential involvement of the IPS, AG, and SMG during MA
using cytoarchitectonically defined subdivisions of the IPC, 2)
examine activation and deactivation of the IPS, AG, and SMG as
a function of task automaticity, 3) compare differential responses
of the IPC and the PFC in relation to task automaticity, and 4)
investigate the neural basis of individual differences in MA
performance as a function of task automaticity. We predicted
that participants would perform the MA-A task more accurately
and faster than the MA-R task, reflecting the higher task
automaticity with familiar mathematical symbols. In conjunction
with these behavioral differences,wehypothesized that 1) the IPS
would show activation in both tasks, with lesser activation during
the more automated MA-A task, 2) the AG would show de-
activation inboth tasks,withgreater deactivation in theMA-R task,
3) deactivations in the AGwould overlap strongly with the default
mode network (DMN), a set of brain regions that typically show
domain general reductions in brain responses during difficult
cognitive tasks (Greicius et al. 2003), 4) a dissociationbetween IPS
and PFC responses would be observed, with the PFC showing
greater between-task differences than the IPS, and 5) individual
differences inMAtaskperformancewouldbedifferentially related
to activation in the IPS and deactivation in the AG.
Materials and Methods
ParticipantsEighteen healthy adult participants (7 males and 11 females; ages 18--31.5,
mean 22.28 years ± 3.95) participated in the study after giving written
informed consent. All protocols were approved by the human participants
Institutional Review Board at the Stanford University School of Medicine.
All participants were volunteers and were treated in accordance with the
APA ‘‘Ethical Principles of Psychologists and Code of Conduct.’’
fMRI ExperimentsThis study consisted of 2 identical MA experiments, one using Arabic
numerals and the other using Roman numerals. Arabic and Roman
problems were presented in separate blocks in order to prevent
subjects from switching across stimulus types and changing task
strategy between conditions. The order of experiments was random-
ized across participants.
MA with Arabic numerals (MA-A)
Participants were presented with 16 alternating experimental and
control epochs, each lasting 32 s. Each experimental (Calculation)
epoch consisted of eight 3-operand equations of the form a + b – c = d
(e.g. 5 + 4 – 2 = 7); only single-digit numerals from 1 to 9 were used.
Each equation was presented for 3.5 s followed by a blank screen for
0.5 s. Participants were instructed to respond by pressing one of
2 keys, based on whether they thought the equation was correct (e.g.
4 + 5 – 2 = 7) or incorrect (e.g. 4 + 5 – 2 = 8). Half of the equations
presented were correct, and the other half incorrect; the order of
correct and incorrect equations was randomized. Each control
(Identification) epoch consisted of eight 7-symbol strings (e.g. 4 @ 3
& 2 # 5). Each string was presented for 3.5 s followed by a blank screen
for 0.5 s. Participants were instructed to respond by pressing one of 2
keys, based on whether they thought the string contained the numeral
5. Half of the strings presented contained the numeral 5, the other half
did not; the order of presentation of these strings was randomized.
MA with Roman Numerals (MA-R)
This experiment was identical to the MA-A task, except that the
equations consisted of Roman numerals (e.g. VI + II – I = VII). During
the control epochs, participants were asked to determine whether the
string contained the Roman numeral V (e.g. IX @ VI & I % V).
Cerebral Cortex Page 3 of 16

Stimulus presentationThe task was programmed using PsyScope (Cohen et al. 1993) on a
Macintosh (Cupertino, CA) computer. Scan and task onsets were syn-
chronized using a TTL pulse delivered to the scanner timing micropro-
cessor board from a ‘‘CMU Button Box’’ microprocessor (http://
poppy.psy.cmu.edu/psyscope) connected to the Macintosh. Stimuli were
presented visually at the center of a screen using a custom-built magnet-
compatible projection system (Resonance Technology, CA). An external
timer maintained an accuracy of stimulus presentation to 1 ms.
Behavioral Data AnalysisRT and the number of correct responses for experimental and control
epochs were computed. RT was analyzed using analysis of variance
(ANOVA) with 2 repeated measures: numeral type (Roman vs. Arabic)
and task condition (Calculation vs. Identification).
fMRI Data AcquisitionImages were acquired on a 3T GE Signa scanner using a standard GE
whole head coil (software Lx 8.3). Head movement was minimized
during scanning by a comfortable custom-built restraint. A total of 28
axial slices (4.5 mm thickness, 0.5 mm skip) parallel to the AC-PC line
and covering the whole brain were imaged with a temporal resolution
of 2 s using a T2*-weighted gradient echo spiral pulse sequence (Glover
and Lai 1998) with the following parameters: TR = 2000 ms, TE = 30
ms, flip angle = 70�, 1 interleave. The field of view was 20 cm, and the
matrix size was 64 3 64, providing an in-plane spatial resolution of
3.125 mm. To reduce blurring and signal loss arising from field
inhomogeneities, an automated high-order shimming method based on
spiral acquisitions was used before acquiring functional MRI scans (Kim
et al. 2002). A high-resolution T1-weighted spoiled grass gradient
recalled inversion recovery 3D MRI sequence was acquired to facilitate
anatomical localization of functional activity. The following parameters
were used: TI = 300 ms, TR = 8 ms; TE = 3.6 ms; flip angle = 15�; 22 cm
field of view; 124 slices in coronal plane; 256 3 192 matrix; 2 NEX,
acquired resolution = 1.5 3 0.9 3 1.1 mm. Structural and functional
images were acquired in the same scan session.
fMRI Data AnalysisThe first 5 volumes were not analyzed to allow for signal equilibration
effects. Images were reconstructed, by inverse Fourier transform, for
each of the time points into 64 3 64 3 28 image matrices (voxel size
3.125 3 3.125 3 4.5 mm). A linear shim correction was applied
separately for each slice during reconstruction using a magnetic field
map acquired automatically by the pulse sequence at the beginning of
the scan (Glover and Lai 1998). Functional MRI data were preprocessed
using SPM5 (http://www.fil.ion.ucl.ac.uk/spm). Images were realigned
to correct for motion, corrected for errors in slice timing, spatially
transformed to standard stereotaxic space (based on the Montreal
Neurologic Institute coordinate system), resampled every 2 mm using
sinc interpolation and smoothed with a 4-mm full-width half-maximum
Gaussian kernel to decrease spatial noise prior to statistical analysis.
Statistical analysis was performed on individual and group data using
the general linear model and the theory of Gaussian random fields as
implemented in SPM5 (http://www.fil.ion.ucl.ac.uk/spm/software/
spm5/). Individual subject analyses were first performed by modeling
task-related and task-unrelated confounds. Low-frequency noise was
removed with a high-pass filter (0.5 cycles/min) applied to the fMRI
time series at each voxel. A temporal smoothing function (Gaussian
kernel corresponding to half-width of 4 s) was applied to the fMRI time
series to enhance the temporal signal-to-noise ratio. Regressors were
modeled with a boxcar function corresponding to the epochs during
which each condition was presented and convolved with a hemody-
namic response function. We then defined the effects of interest for
each participant with the relevant contrasts of the parameter estimates.
Group analysis was performed using a random effects model that
incorporated a 2-stage hierarchical procedure (Holmes and Friston
1998). For the first-level analysis, contrast images for each participant
and each effect of interest were generated as described above. For the
second-level analysis, these contrast images were analyzed using
a general linear model to determine voxel-wise group t-statistics. One
contrast image was generated per participant, for each effect of
interest. Two-tailed t-tests were used to determine group-level
activation for each effect. Finally, the t-statistics were normalized
transformed to Z scores, and significant clusters of activation were
determined using the joint expected probability distribution of height
and extent of Z scores (Poline et al. 1997), with height (Z > 2.33;
P < 0.01) and extent thresholds (P < 0.01).
The following between-task comparisons were then performed at
the group level using paired t-tests: 1) MA-A: Arabic Calculation – Arabic
Identification; (2) MA-R: Roman Calculation – Roman Identification; and
the following between-numeral comparisons: (3) MA-A – MA-R: (Arabic
Calculation – Arabic Identification) – (Roman Calculation – Roman
Identification); (4) MA-R – MA-A: (Roman Calculation – Roman
Identification) – (Arabic Calculation – Arabic Identification). In the
latter 2 comparisons, which involve double subtractions, additional
analyses were conducted to distinguish between differences arising
from calculation task-related increases in activation, as opposed to
identification task-related decreases in activation (or ‘‘deactivation’’).
For each significant cluster that was detected in these comparisons (i.e.
comparisons 3 and 4), mean t-scores were first computed for the MA-A
(comparison 1) and MA-R (comparison 2) tasks. Clusters in compar-
isons 3 and 4 were then categorized as arising from deactivation if 1)
the mean t-score (averaged across all participants) was significantly
negative in comparisons 2 and 1, respectively; and 2) the mean t-score
was not significantly different from 0 in comparisons 1 and 2,
respectively. A parallel analysis was conducted using percent signal
change between the Calculation and Identification conditions. The
results in each case were similar to those obtained using t-scores, so
only the latter is reported here.
Regression analysis was used to examine the relation between MA
experimental task accuracy and activation in the MA-A and MA-R tasks.
Voxel-wise t-statistics maps were generated and significant clusters of
activation were determined using a voxel-wise statistical height
threshold of (Z > 2.33; P < 0.01), with corrections for multiple spatial
comparisons at the cluster level (P < 0.05). Both the magnitude and the
sign of the activations were examined in order to ascertain whether the
observed brain--behavior relations were related to task-related activa-
tion or deactivation. Activation foci were superimposed on high-
resolution T1-weighted images and their locations were interpreted
using known neuroanatomical landmarks (Mai et al. 2007).
IPC ROIROI were based on the cytoarchitectonically distinct maps of 3 IPS
(hIP3, hIP1, andhIP2), 2 AG(PGpandPGa), and 5 SMG(PFm,PF, PFt, PFcm,
and PFop) regions, as described above (Fig. 1). In the order listed, these
ROI run successively along the caudal to rostral axis of the IPC. Detailed
information about the anatomical boundaries of these maps has been
published elsewhere (Caspers et al. 2006; Choi et al. 2006; Scheperjans,
Hermann, et al. 2008). Probability maps of each of these ROIs were
evaluated using the SPM Anatomy Toolbox (Eickhoff et al. 2005).
The Anatomy Toolbox allowed us to characterize and label functional
activations in relation to the probabilistic ROI. The spatial distribution
of regional activations was characterized by 3 metrics— the percentage
of an activation cluster that was in a specific ROI, the percentage of
a specific ROI that belonged to an activated cluster, and probability that
a peak in the cluster was assigned to an ROI (Eickhoff et al. 2005, 2007).
Because of the spatial overlap in the 7 probabilistic IPC ROI, we used
maximum probability maps, which yield nonoverlapping ROIs, to
uniquely characterize the magnitude of regional responses. This
approach yields regions that 1) reflect most adequately the underlying
anatomy and 2) show a high degree of sensitivity in statistical analysis of
functional activations (Eickhoff et al. 2007).
Results
Behavior
Accuracy and RTs for the MA-R and MA-A calculation and
identification trials are summarized in Figure 2. For RT, ANOVAs
revealed a significant 2-way interaction between condition
Page 4 of 16 Parietal Heterogeneity during Mathematical Cognition d Wu et al.
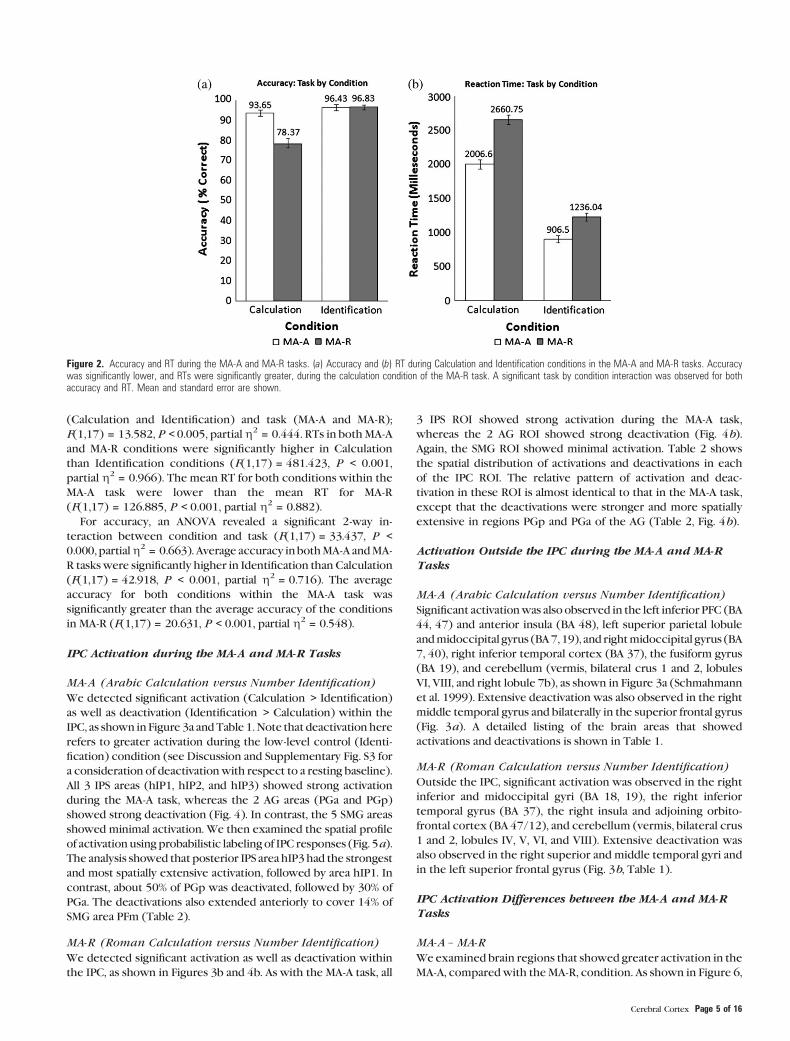
(Calculation and Identification) and task (MA-A and MA-R);
F(1,17) = 13.582, P < 0.005, partialg2 = 0.444. RTs in bothMA-A
and MA-R conditions were significantly higher in Calculation
than Identification conditions (F(1,17) = 481.423, P < 0.001,
partial g2 = 0.966). The mean RT for both conditions within the
MA-A task were lower than the mean RT for MA-R
(F(1,17) = 126.885, P < 0.001, partial g2 = 0.882).
For accuracy, an ANOVA revealed a significant 2-way in-
teraction between condition and task (F(1,17) = 33.437, P <
0.000, partialg2 = 0.663). Average accuracy in bothMA-A andMA-
R tasks were significantly higher in Identification than Calculation
(F(1,17) = 42.918, P < 0.001, partial g2 = 0.716). The average
accuracy for both conditions within the MA-A task was
significantly greater than the average accuracy of the conditions
in MA-R (F(1,17) = 20.631, P < 0.001, partial g2 = 0.548).
IPC Activation during the MA-A and MA-R Tasks
MA-A (Arabic Calculation versus Number Identification)
We detected significant activation (Calculation > Identification)
as well as deactivation (Identification > Calculation) within the
IPC, as shown in Figure 3a andTable 1.Note that deactivation here
refers to greater activation during the low-level control (Identi-
fication) condition (see Discussion and Supplementary Fig. S3 for
a consideration of deactivationwith respect to a resting baseline).
All 3 IPS areas (hIP1, hIP2, and hIP3) showed strong activation
during the MA-A task, whereas the 2 AG areas (PGa and PGp)
showed strong deactivation (Fig. 4). In contrast, the 5 SMG areas
showed minimal activation. We then examined the spatial profile
of activation using probabilistic labeling of IPC responses (Fig. 5a).
The analysis showed that posterior IPS area hIP3 had the strongest
and most spatially extensive activation, followed by area hIP1. In
contrast, about 50% of PGp was deactivated, followed by 30% of
PGa. The deactivations also extended anteriorly to cover 14% of
SMG area PFm (Table 2).
MA-R (Roman Calculation versus Number Identification)
We detected significant activation as well as deactivation within
the IPC, as shown in Figures 3b and 4b. As with the MA-A task, all
3 IPS ROI showed strong activation during the MA-A task,
whereas the 2 AG ROI showed strong deactivation (Fig. 4b).
Again, the SMG ROI showed minimal activation. Table 2 shows
the spatial distribution of activations and deactivations in each
of the IPC ROI. The relative pattern of activation and deac-
tivation in these ROI is almost identical to that in the MA-A task,
except that the deactivations were stronger and more spatially
extensive in regions PGp and PGa of the AG (Table 2, Fig. 4b).
Activation Outside the IPC during the MA-A and MA-RTasks
MA-A (Arabic Calculation versus Number Identification)
Significant activationwas also observed in the left inferior PFC (BA
44, 47) and anterior insula (BA 48), left superior parietal lobule
andmidoccipital gyrus (BA7, 19), and rightmidoccipital gyrus (BA
7, 40), right inferior temporal cortex (BA 37), the fusiform gyrus
(BA 19), and cerebellum (vermis, bilateral crus 1 and 2, lobules
VI, VIII, and right lobule 7b), as shown in Figure 3a (Schmahmann
et al. 1999). Extensive deactivation was also observed in the right
middle temporal gyrus and bilaterally in the superior frontal gyrus
(Fig. 3a). A detailed listing of the brain areas that showed
activations and deactivations is shown in Table 1.
MA-R (Roman Calculation versus Number Identification)
Outside the IPC, significant activation was observed in the right
inferior and midoccipital gyri (BA 18, 19), the right inferior
temporal gyrus (BA 37), the right insula and adjoining orbito-
frontal cortex (BA 47/12), and cerebellum (vermis, bilateral crus
1 and 2, lobules IV, V, VI, and VIII). Extensive deactivation was
also observed in the right superior and middle temporal gyri and
in the left superior frontal gyrus (Fig. 3b, Table 1).
IPC Activation Differences between the MA-A and MA-RTasks
MA-A – MA-R
Weexamined brain regions that showed greater activation in the
MA-A, compared with theMA-R, condition. As shown in Figure 6,
Figure 2. Accuracy and RT during the MA-A and MA-R tasks. (a) Accuracy and (b) RT during Calculation and Identification conditions in the MA-A and MA-R tasks. Accuracywas significantly lower, and RTs were significantly greater, during the calculation condition of the MA-R task. A significant task by condition interaction was observed for bothaccuracy and RT. Mean and standard error are shown.
Cerebral Cortex Page 5 of 16
Table 1Brain regions that showed significantly greater activation and deactivation during the MA-A and MA-R calculation, compared with number identification, tasks
Comparison Brain region BA Corrected P value No. of voxels Peak Z score Peak MNI coordinates (mm)
x y z
MA-ACalculation � Identification
L inferior frontal gyrus, L insula 44, 47, 48 \0.001 12 210 5.12 �52 14 30L superior parietal lobule L middle occipital gyrus 7, 19 \0.001 10 206 6.03 �22 �70 42R inferior parietal lobule R middle occipital gyrus 40, 7 \0.001 2458 5.32 34 �52 44
Identification � CalculationL/R medial superior frontal gyrus 10, 30 \0.001 15 247 6.19 �2 54 8R middle temporal gyrus, R/L precuneus 37, 21, 23 \0.001 20 467 5.90 56 �58 12L angular gyrus 39 \0.001 1244 4.61 �46 �72 42
MA-RCalculation � Identification
R inferior parietal lobule, R middle occipital gyrus 40, 7 \0.001 2734 4.99 36 �50 42R inferior temporal gyrus 37 \0.01 361 5.18 54 �54 �18R cerebellum (vermis 8, crus 2) 47 \0.001 28 755 6.03 2 �64 �30R inferior/middle occipital gyrus 18, 19 \0.01 321 3.71 36 �88 4
Identification � CalculationL superior frontal gyrus, R middle cingulate, R precuneus 9, 23 \0.001 28 183 5.68 �14 52 34L angular gyrus 39 \0.001 1223 5.07 �54 �66 28R middle occipital gyrus, R superior/middle temporal gyrus 39, 22 \0.001 1813 5.38 48 �70 28
Note: For each significant cluster, region of activation, significance level, number of activated voxels, maximum Z score, and location of peak in MNI coordinates are shown. Each cluster was significant
after correction for height (p\ 0.01) and spatial extent (p\ 0.01). BA, Brodmann area.
Figure 3. Brain activation and deactivation during the MA-A and MA-R calculation tasks. (a) Surface rendering and coronal sections of brain regions that showed significantactivation (Calculation[ Identification) and deactivation (Identification[ Calculation) in the MA-A calculation task. Activations are shown in red and deactivations are shown inblue. (b) Activations and deactivations in the MA-R calculation task. Each cluster was significant after correction for height (p\ 0.01) and spatial extent (p\ 0.01).
Page 6 of 16 Parietal Heterogeneity during Mathematical Cognition d Wu et al.

a direct comparison between the 2 tasks revealed statistically
significant differences in the left IPC and the adjoining
temporoparietal cortex. More detailed analysis of the spatial
distribution of the responses revealed that the differences were
primarily localized to the AG – PGa and PGp together accounted
for 73%of the activation and only 1.8%of the activation extended
into SMG region PFm (Table 4). ROI analyses were conducted to
further examine both the direction and magnitude of responses
within the IPC cluster, in order to examine whether between-
taskdifferences above arose from increasesduringMA-A, or from
decreases during the MA-R task (deactivation). This analysis
revealed that activation in the AG cluster arose from greater
deactivation during the MA-R condition (Fig. 6).
MA-R – MA-A
We then examined whether any brain regions showed greater
activation in the MA-R, compared with the MA-A, tasks. No
differences were observed in any of the IPC regions, even at
a liberal threshold of P < 0.05, uncorrected.
Activation Differences Outside the IPC between the MA-Aand MA-R Tasks
MA-A – MA-R
Compared with the MA-R task, the MA-A task showed greater
responses bilaterally in the medial aspects of the superior
frontal gyrus (BA 10). Further analysis revealed that in this
cluster, between-task differences arose from greater deactiva-
tion during the MA-R task (Table 3).
MA-R – MA-A
Compared with the MA-A task, the MA-R showed greater
responses in 6 clusters within the PFC and the cerebellum
(Fig. 7 and Table 3). PFC regions that showed differences
included the left inferior frontal gyrus with adjoining anterior
insula (BA 44, 48), left inferior and middle frontal gyrus (BA 47,
11), left middle and superior frontal gyri (BA 9, 8), and right
inferior frontal gyrus and adjoining anterior insular (BA 47, 48)
and the bilateral presupplementary motor area (pre-SMA; BA 6).
Cerebellar regions that showed differences included the left
cerebellum lobule VIII and vermis 8.
We then examined whether the activation clusters noted in
the MA-R – MA-A comparison above arose from task-related
decreases during MA-A, or from task-related increases during
MA-R (deactivation). This analysis showed that activation in all
the 6 clusters arose from greater activation in the MA-R task
(Fig. 7).
Relation of AG Deactivation to the DMN
The DMN (Greicius et al. 2003) consists of 2 bilateral nodes in the
IPC as well as the medial PFC and posteromedial cortex (Greicius
et al. 2003). These regions are typically deactivated during
cognitive tasks in a domain general manner, and furthermore,
themagnitude of deactivation normally increases in proportion to
Figure 4. Relative strength of activation and deactivation in each cytoarchitectonically defined IPC region during the MA-A and MA-R calculation tasks. (a) Activation anddeactivation in each cytoarchitectonically defined IPC ROI during the MA-A task. All 3 IPS areas (hIP3, hIP1, and hIP2) were activated, whereas AG regions (PGp and PGa) weredeactivated. SMG regions (PFm, PF, PFt, PFcm, and PFop) showed minimal activation. Hemispheric differences were observed in AG region PGa, and SMG regions PF and PFcm.(b) A similar pattern of activation and deactivation was observed during the MA-R task. In this case, hemispheric differences were observed only in the SMG region PFcm.*indicates regions that showed significant hemispheric differences, p\ 0.05 after FDR correction for multiple comparisons. Mean and standard error are shown.
Cerebral Cortex Page 7 of 16

cognitive load.Wefirst examinedwhether deactivations observed
in the IPC during the 2 tasks overlapped with the DMN. We
observedstrongdeactivation in the rightAGareaPGp inboth tasks
and more extensive bilateral overlap in the MA-R task (Supple-
mentary Fig. S1). We then examined whether the left AG region
that showed greater deactivation in theMA-R, comparedwith the
Table 2Probabilistic labeling of IPC regions that showed significant activation and deactivation during the MA-A and MA-R calculation, compared with number identification, tasks
Comparison Assigned region % of region activated % of cluster in region Probability of peak inassigned region (%)
Peak MNI coordinates (mm)
x y z
MA-ACalculation � Identification R IPS (hIP3) 91.6 11.1 60 34 �52 44
R IPS (hIP1) 62.1 5.8 20 44 �48 44Identification � Calculation L AG (PGp) 49.2 42.9 60 �46 �72 42
L AG (PGa) 30.4 20.1L SMG (PFm) 13.6 5.5L SMG (PF) 1.6 1.2
MA-RCalculation � Identification R IPS (hIP3) 89.1 9.7 50 36 �50 42
R IPS (hIP1) 80.3 6.7
Identification � Calculation L AG (PGp) 54.1 48.0 70 �48 �70 36L AG (PGa) 33.6 22.6L SMG (PFm) 9.8 4.0L SMG (PF) 0.8 0.7
Note: IPC regions that showed significantly greater activation (Calculation[ Identification) during the MA-A, compared with the MA-R, task (Identification[ Calculation). For each significant cluster, the
probabilistic region, percentage of activation in the region, percentage of cluster that was in the region, peak MNI coordinate, and the probability of the peak being in the region are shown. Each cluster
was significant after correction for height (p\ 0.01) and extent (p\ 0.01). Cytoarchitectonically defined probability maps were used to interpret the locations of the cluster and peaks within
subdivisions of the IPS, AG, and SMG.
Figure 5. Activation and deactivation in cytoarchitectonically defined IPC regions during the MA-A and MA-R calculation tasks. (a) Activations (Calculation[ Identification) anddeactivations (Calculation\ Identification) during the MA-A task, overlaid on cytoarchitectonic probability maps of the IPC. Task-related activations had the highest probability ofbeing localized to the posterior-most IPS region hIP3, whereas deactivations had the highest probability of being localized to posterior-most AG region PGp. (b) A similar profilewas observed in the MA-R task, except that deactivations were more extensive and stronger within AG regions PGp and PGa. Each cluster was significant after correction forheight (p\ 0.01) and spatial extent (p\ 0.01). Table 2 provides additional details of localization of activation and deactivation foci.
Page 8 of 16 Parietal Heterogeneity during Mathematical Cognition d Wu et al.

MA-A, task overlapped anatomically with DMN. As shown in
Supplementary Figure S2, there was significant overlap between
AG regions deactivated during these tasks and the DMN.
Relation between Performance and Brain Activationduring the MA-A Task
We next examined the relationship between brain response
and accuracy during the MA-A task. We found that accuracy
during the MA-A task was associated with responses in the left
(r = 0.69, P < 0.01) and right (r = 0.74, P < 0.01) IPC. Proba-
bilistic labeling showed that both left and right IPC clusters
overlapped most strongly with the posterior AG area PGp
(Table 5 and Fig. 8). Furthermore, poorer accuracy was
predominantly associated with deactivation in the AG region
PGp (Fig. 8). No such relations were observed between brain
activation and RT.
Relation between Performance and Brain Activationduring the MA-R Task
Accuracy during the MA-R task was associated with reduced
deactivation in the left (r = 0.578, P < 0.05) and right IPC
(r = 0.718, P < 0.01). As shown in Figure 8 and Table 5, the
clusters were localized to AG area PGa in the left hemisphere,
extending anteriorly to SMG area PFm and dorsally to IPS
region hIP1. The profile was somewhat different in the right
hemisphere, with the cluster being localized more posteriorly
to AG area PGp and the superior parietal lobule. No such
relations were observed between brain activation and RT.
Discussion
Our findings provide new insights into the functional organi-
zation of the IPC during mathematical cognition. The newly
developed cytoarchitectonically distinct maps of the IPC
allowed us to localize brain responses to each task condition
with an anatomical precision that was not possible heretofore.
In particular, the demarcation of the IPS from the AG and the
SMG allowed us to examine the extent, level, and distribution
of brain responses in a reliable manner. This in turn allowed us
to examine the effects of task automaticity in relation to
individual subject differences in performance with a high level
Table 3Brain regions that showed significant differences between the MA-A and MA-R calculation tasks
Comparison Brain region BA Corrected P value No. of voxels Peak Z Score Peak MNI coordinates (mm)
x y z
MA-A � MA-RL angular gyrus L temporoparietal cortex 39, 19 \0.001 373 3.87 �46 �72 20L/R superior frontal gyrus 10 \0.01 238 3.32 �4 56 24
MA-R -- MA-AL inferior frontal gyrus, L anterior Insula 44, 48 \0.001 544 4.28 �54 10 8L inferior/middle frontal gyrus 47, 11 \0.01 331 3.59 �26 32 �4L middle/superior frontal gyrus 9, 8 \0.01 278 4.56 �22 8 58L/R presupplementary motor area 6 \0.01 286 3.44 �2 6 60R inferior frontal gyrus R anterior insula 47, 48 \0.01 227 4.19 38 20 �6L cerebellum (lobule VIII/vermis 8) \0.001 947 4.54 �24 �58 �42
Note: Brain regions that showed significantly greater activations in the MA-A, compared with the MA-R task and the MA-R, compared with the MA-A task. For each cluster, region of activation,
significance level, number of activated voxels, maximum Z score, and location of peak in MNI coordinates are shown. Each cluster was significant after correction for height (p\ 0.01) and spatial extent
(p\ 0.01).
Figure 6. Probabilistic labeling of IPC regions that showed significant differences in activation between the MA-A and MA-R calculation tasks. (Left) Task-related differencesarose from activation, rather than deactivation, with the MA-R showing greater negative activations than the MA-A task. These differences were localized to the left AG and theposterior temporo-parietal cortex (TPC). **indicates that differences between the MA-A and MA-R task were significant at P \ 0.01. (Right) Probabilistic labeling of IPCresponses showing that deactivations had the highest probability of being localized to posterior-most angular gyrus region PGp. Each cluster was significant after correction forheight (p\ 0.01) and spatial extent (p\ 0.01). Table 4 provides additional details of localization of task-related differences.
Table 4Probabilistic labeling of IPC regions that showed greater responses during the MA-A, compared
with the MA-R, calculation task
Comparison Assignedregion
% of regionactivated
% of clusterin region
Probability ofpeak in assignedregion (%)
Peak MNIcoordinates (mm)
x y z
MA-A � MA-RL AG (PGp) 17.5 50.8 60 �46 �72 20L AG (PGa) 10.0 22.0 30 �60 �60 22L SMG (PFm) 1.3 1.8
Note: IPC regions that showed significantly greater activations during the MA-A compared with
MA-R task. Each cluster was significant after correction for height (p\ 0.01) and spatial extent
(p\ 0.01). Other details as in Table 2. The MA-R task did not show significantly greater
activations in any IPC region.
Cerebral Cortex Page 9 of 16

of precision and consistency. Our results point to important
functional heterogeneities in the IPC, and they suggest that
task automaticity modulates neural responses in the IPS, AG,
and SMG differently. Our findings emphasize that the contri-
butions of the IPC to mathematical cognition are not unitary.
We discuss the implications of our findings for understanding
the neural basis of mathematical cognition below.
Behavioral Differences
As predicted, we found that participants are less accurate
and slower at processing the less familiar Roman numerals
(Gonzalez and Kolers 1982; Hiscock et al. 2001). Accuracy
and RTs were significantly different during the Calculation and
Identification conditions in the MA-A and MA-R tasks. These
results suggest that participants were equally adept at
recognizing the 2 types of numerals, but were significantly
slower in performing MA with Roman numerals. These results
indicate that the MA-A task is performed in a significantly
more automated manner than the MA-R task, consistent with
the view that automatized processes are often marked by
significant ‘‘speed-up’’ in response times due to more efficient
memory retrieval (Logan 1988). Because the decision-making
aspects of the MA-A and MA-R tasks did not differ, differences
in RT likely reflect the effortful, directed, retrieval required
during the MA-R task. RT differences in the identification
condition suggest that Arabic numerals were recognized more
efficiently than Roman numerals. Taken together with brain
imaging results, the behavioral findings support the observation
that cognitive operations are not independent of the symbols
that initiate them (Gonzalez and Kolers 1982).
Differential IPC and PFC Responses in Relation to TaskAutomaticity
Before discussing regional differences within the IPC, we first
focus on overall global differences in brain response in relation
to task automaticity. Although there was extensive overlap in
the IPC and PFC regions activated during the MA-A and MA-R
tasks, activations in these regions could be dissociated: there
was significantly greater activation of the PFC during the MA-R,
compared with the MA-A, task, whereas there was greater
‘‘activation’’ of the IPC during the MA-A, compared with the
MA-R, task. These results suggest that the IPC and PFC
contribute differently to automated versus nonautomated MA
tasks. Notably, activations of the right anterior insula in the PFC
and the lobule VIII and vermis 8 regions of the cerebellum
were observed only in the MA-R task.
During the MA-R task, greater activation was observed
bilaterally in the ventrolateral PFC as well as the pre-SMA and
the cerebellum. However, left hemisphere responses were
stronger and more extensive and overlapped with language and
syntactic processing regions in BA 44 and 47. These differences
may arise from the need to transform numerals in the Roman
Figure 7. Brain regions that showed significant differences in activation between the MA-R and MA-A calculation tasks. Six brain regions, all outside the IPC, showedsignificantly greater activation in the MA-R, compared with the MA-A, task: 1) left inferior frontal cortex and adjoining anterior insula (IFC; BA 44, 48), 2) left inferior frontal gyrus(BA 47), 3) middle and superior frontal gyri (BA 9, 8), 4) right inferior frontal cortex and adjoining insular cortex (BA 47, 48), 5) bilateral presupplementary motor area (pre-SMA;BA 6), and 6) left cerebellum (lobule VIII). In each of these regions, both the MA-R and the MA-A tasks showed positive activations (Calculation[ Identification), and task-relateddifferences arose from greater positive activations in the MA-R task. Each cluster was significant after correction for height (p\ 0.01) and spatial extent (p\ 0.01). Table 3provides additional details of localization of activation foci.
Page 10 of 16 Parietal Heterogeneity during Mathematical Cognition d Wu et al.

format into phonological representations that facilitate fact
retrieval and calculation. Lexical processing, translation of
symbols, and the articulatory rehearsal needed prior to fact
retrieval are also known to engage a frontocerebellar loop
(Desmond et al. 1997; Fiez and Raichle 1997; Chen and
Desmond 2005; Hayter et al. 2007), consistent with our finding
of coactivation of the ventrolateral PFC and cerebellar lobule
VIII. Interestingly, there were no differences in the mid-
dorsolateral PFC, a finding that may reflect greater demands on
retrieval and maintenance rather than active manipulation of
numerical quantity in working memory (D’Esposito et al. 2000;
Curtis and D’Esposito 2003; Derrfuss et al. 2004; Blumenfeld
and Ranganath 2006). Importantly, our ventrolateral PFC foci
overlap with prefrontal regions that have been implicated in
effortful retrieval during a complex series of mental calcu-
lations (Anderson and Qin 2008).
Additionally, the MA-R task elicited greater responses in
pre-SMA, a region that has been implicated in sequential
planning of information in working memory. This may reflect
preparation for motor output that accompanies multistage
numerical computations during the more complex 3-operand
condition. This region also showed greater responses in
a previous study where we examined differences between
processing of 3- and 2-operand MA trials (Menon, Rivera, White,
Glover, et al. 2000). In that study, the increase in pre-SMA
activation reflected the longer duration (about 850 ms) of the
motor preparatory activity in a 3-operand, compared with a
2-operand, condition. Electrophysiological recordings have
consistently implicated the SMA and pre-SMA during motor
preparation (Tanji and Mushiake 1996) and delay-related fMRI
responses have been reported during working memory tasks
(Petit et al. 1998).
Dissociating IPS, AG and SMG Contributions to MA
During both the MA-A and MA-R tasks, the IPS showed increased
activation during the Calculation compared with the Identifica-
tion conditions (Figs 4 and 5). Increases were observed in the
hIP3, hIP1, and hIP2, encompassing the posterior, middle, and
anterior IPS segments shown in Figure 1. Activations were
highest in the posterior-most area hIP3. In contrast, both the
posterior AG area PGp and the anterior AG area PGa showed
deactivation in both tasks, with stronger and more extensive
deactivation in area PGp. Deactivation here refers to greater
responses in the control number identification task compared
with the calculation task. The MA-A task did not show activation
above the control condition in either AG region, contrary to its
predicted role in automated fact retrieval. Signal changes in the
SMG were modest and nonsignificant in both tasks.
We then examined differences in activation of the IPS, AG,
and the SMG between the automated and nonautomated tasks.
We observed differences in the AG but not in the IPS or the SMG.
It is particularly noteworthy that between-task differences arose
from differences in deactivation rather than differences in
activation (Figs 4 and 5). In the left AG, the MA-R task showed
greater deactivation than the MA-A task, whereas the right AG
showed equal levels of deactivation. Other regions of the IPC,
including the left and right IPS areas hIP3, hIP1, and hIP2,
showed similar levels of activation in both tasks; these IPC
regions were not modulated by task automaticity.
One potential issue in interpreting these findings is that it
leaves unclear whether the deactivations observed in our study
may have arisen from greater activation of the AG during the
number identification condition. In order to address this issue, we
analyzed a different fMRI dataset, acquired in a separate group of
21 adult participants, with both number identification and passive
fixation ‘‘rest’’ baseline conditions. We found no deactivations in
the AG when we compared number identification to rest; in
contrast, as expected,weobserved significant activation in the left
IPS, in the left and right striate, extrastriate, lingual, and fusiform
gyri, and the left sensorimotor cortex (Supplementary Fig. S3).
This analysis strongly suggest that the within-task deactivations
and between-task differences in deactivation reported here arise
fromdifferences in deactivation during theMACalculation task as
opposed to activations during the Identification task.
Our findings help to clarify the functional distinction between
key IPC regions that have been implicated in mathematical
cognition. Delazer et al. (2003) suggested that with MA training,
there is a shift from the bilateral IPS to the left AG, especially as
individuals begin to rely less on computation andmoreheavily on
retrieval. It is, however, not clear whether these changes are
related to differences in activation or deactivation. Between-task
comparisons indicated a positive difference in AG activation
during the more automated task, compared with the less
automated task, reflecting greater deactivation in the MA-R than
in the MA-A task. In view of these findings, it is possible that the
‘‘shift’’ to the AG observed in the Delazer et al. study may have
been due to decreased deactivation when the task becamemore
automated after training. This notion was confirmed by the
results of a subsequent study (Ischebeck et al. 2006), in which
the AG showed less negative responses after training on
multiplication problems. Similarly, Grabner et al. (2007) ob-
served AG deactivation during mental calculation in individuals
with poor mathematical abilities. However, to date, no study of
mathematical cognition to our knowledge has examined
whether task-related differences in specific IPS and AG regions
arise primarily from activation or from deactivation, thus leaving
unclear the precise functions subserved by the IPC. Importantly,
many existing studies leave open the possibility that some of the
IPC responses may reflect suppression from increased task
difficulty rather than processing specificity for MA, an issue we
address more directly in our study. Taken together, these
findings highlight the need for careful analysis of the magnitude
and sign of changes in activation in each specific MA task,
particularlywith respect to theAGbut also to a lesser extentwith
the SMGwhose various subdivisions showed a complex profile of
Table 5Probabilistic labeling of IPC regions where activation or deactivation was significantly correlated
with accuracy during the MA-A and MA-R calculation tasks
Comparison Assignedregion
% of regionactivated
% of clusterin region
Probability of peakin assigned region (%)
Peak MNIcoordinates (mm)
x y z
MA-AL AG (PGp) 6.2 28.4 60 �40 �80 28R AG (PGp) 20.1 56.5 80 42 �72 38
MA-RL AG (PGa) 22.5 48.2 20 �40 �62 38L SMG (PFm) 4.7 6.1 20 �44 �60 30L IPS (hIP1) 3.4 4.1L AG (PGp) 1.3 3.7 60 �46 �66 42R AG (PGp) 18.3 44.0 60% 40 �78 28
Note: IPC regions that showed significant correlations between activation and performance
accuracy during the MA-A and MA-R tasks. Each cluster was significant after correction for
height (p\ 0.01) and spatial extent (p\ 0.05). Other details as in Table 2.
Cerebral Cortex Page 11 of 16

low-level activation and deactivation. Most importantly, these
findings point to functionally heterogeneous responses in
cytoarchitectonically distinct areas of the IPC.
Obligatory Involvement of IPS in Automated andNonautomated MA
All 3 segments of the IPS showed positive task-related
activations during both the MA-R and MA-A tasks, but these
activations did not differ between the 2 tasks. This suggests
that the IPS is fully recruited in each condition, in contrast to
the AG and the IFC. The invariant and obligatory nature of
activation in the IPS further confirms its critical role in
mathematical problem solving. The middle IPS area hIP1
overlaps with the horizontal IPS (hIPS), a region thought to
be important for representing and manipulating quantity
(Ansari 2008). This IPS region was activated strongly in both
Figure 8. Probabilistic labeling of IPC regions where brain responses were significantly correlated with accuracy on the MA-A and MA-R calculation tasks. (a) During the MA-Atask, accuracy was significantly correlated with brain responses in the left and right posterior AG area PGp. The dashed line demarcates activation from deactivation and helpsillustrate that performance was primarily related to deactivation, rather than activation. Furthermore, greater deactivation in focal clusters within the PGp was associated withpoorer performance. As noted in the text, the outlier did not affect the statistical significance of these findings. The bottom panels show probabilistic labeling of responsesoverlaid on cytoarchitectonic maps of the IPC. (b) A similar pattern was observed in the MA-R task, except that responses were stronger in area PGp and accuracy was correlatedwith responses in the anterior AG region PGa (see Table 5). Each cluster was significant after correction for height (p\ 0.01) and spatial extent (p\ 0.01).
Page 12 of 16 Parietal Heterogeneity during Mathematical Cognition d Wu et al.
the MA-A and the MA-R tasks, even though the stimuli were
visually well balanced in the MA and number identification
tasks. However, no differences were observed between the
MA-A and MA-R tasks. This suggests that although the hIPS
region is sensitive to MA operations, it is not differentially
modulated by task automaticity when basic number processing
is controlled for. The same basic pattern was observed in each
IPS region, even though the posterior-most area hIP3 had the
strongest activation among the 3 subdivisions. All 3 IPS areas,
hIP3, hIP1, and hIP2, therefore, appear to play an obligatory
role in MA tasks, irrespective of the level of automaticity.
Task-Dependent AG Deactivation and Its Relation to theDMN
Our findings are inconsistent with simplistic notions of the left
AG as being primarily involved in verbally mediated fact
retrieval (Dehaene et al. 2003; Delazer et al. 2003). Although
retrieval was more automated in the MA-A, very little positive
activation was observed in this region in either task. Both the
Rickard et al.’s (2000) study that involved simple 2-operand
multiplication and our study, which involves 3-operand
calculation, showed deactivation in the AG. Part of the reason
for the divergence of these findings from studies such as
those reviewed by Dehaene et al. (2003) is that sufficient
attention has not been paid to deactivation when multiple task
conditions were compared. For instance, the left AG was
reported to show increased activation for multiplication
relative to subtraction (Chochon et al. 1999; Lee 2000), for
multiplication and division relative to a letter substitution
control (Gruber et al. 2001), and for exact calculation than
approximation (Dehaene et al. 1999). It is likely that these
activations may have arisen from greater deactivation in the
more difficult task. Our findings suggest that it is crucial to
assess the precise, quantitative, profile of responses if we are to
understand the nature of cognitive and brain mechanisms
responsible for memory retrieval and algorithmic computation.
It should also be noted that it was not just the left AG that
showed significant deactivation in our study. The right AG also
showed significant deactivation, but deactivation related differ-
ences between the MA-A and the MA-R tasks were more
significant on the left than the right.
The AG regions that showed task-related deactivation differ-
ences in our study overlapped with IPC regions that have
previously identified as being part of the DMN (Supplementary
Fig. S1). More detailed analyses conducted to examine extent of
the overlap showed that the parts of the AG that overlapped
with the DMN were significantly more deactivated during the
MA-R task than during the MA-A task. Other parts of the AG,
which did not overlap with the DMN, showed positive
activations in both the MA-A and MA-R tasks, but these
activations did not differ between tasks (Supplementary Fig. S2).
AG areas outside of the DMN, most notably in the lateral
temporal lobes, were also deactivated, but these deactivations did
not differ between the MA-A and MA-R tasks. The DMN, and
therefore the AG regions that overlap with it, are typically
suppressed when the executive control network is recruited
during demanding cognitive tasks (Seeley et al. 2007; Sridharan
et al. 2008). In agreement with this observation, greater de-
activation in theAG regionwas accompanied bygreater activation
in the bilateral PFC regions during theMA-R task. Our findings are
also consistentwith previous observations that suppression of the
DMN increaseswith task difficulty (Schulman et al. 2003; Greicius
and Menon 2004). The lateral IPC has been shown to be
deactivated across a broad range of cognitive tasks, but its precise
anatomical localizationhasnotbeenadequately clarified.Whether
these deactivations are primarily in the AG proper, rather than in
more dorsal or rostral regions bordering the IPS and the SMG, has
been unclear. Our analysis using the cytoarchitectonic maps
described above strongly suggests that these deactivations are
localized to the AG. One view of the deactivations observed in the
IPC is that it helps to divert attentional resources to the PFC and
more dorsal IPC regions for processing task-relevant visual
information (Schulman et al. 2003; Greicius and Menon 2004;
Todd et al. 2005). For example, Schulman et al. (2003) asked
participants to search and detect stimulus targets embedded
amongst nontarget stimuli and found that, whereas the IPS was
activated both during search and target detection, the right AG
was deactivated during search (Schulman et al. 2003). In addition,
Toddet al. (2005) found that suppressionof theAG increasedwith
visual short-term memory load. These findings suggest that
suppression of the right AG is necessary during demanding tasks,
especially during tasks in which attention is voluntarily directed.
Importantly, the 2 other major nodes of the DMN— the
posterior cingulate cortex and the ventromedial PFC—showed
no differences between the tasks. These regions are also
sensitive to task difficulty and typically are deactivated together
during more difficult cognitive tasks (Schulman et al. 2003;
Greicius and Menon 2004). Our findings therefore suggest that
deactivation in the AG can be decoupled from most of the
midline structures of the DMN. The reason for this functional
dissociation is not entirely clear at this time, but our findings
are consistent with the view that these nodes serve different
cognitive and mental functions even though they are generally
considered as operating within a ‘‘network’’. Based on tasks that
upregulate the DMN, it appears that posterior cingulate cortex
and the ventromedial PFC are more related to self-related and
autobiographical information processing (Greicius et al. 2003),
whereas the AG is sensitive to integration of long-range
semantic information (Humphries et al. 2007).
Task-Dependent Left AG Deactivation and Its Relation toVerbal Processing
How then are we to understand the role of the left AG in
mathematical cognition? Although a role for the left AG in
verbally mediated retrieval of MA facts has been suggested by
several investigators, the nature of this involvement is un-
known. In this context, recent findings in the literature on left
AG involvement in verbal processing are quite revealing. The
left AG shows deactivation to nonwords compared with
a resting state baseline, with no difference observed between
words and the resting state baseline (Mechelli et al. 2003;
Rissman et al. 2003; Binder et al. 2005; Xiao et al. 2005). In an
important study of the topic, Humphries et al. (2007) found
that whereas the middle temporal gyrus and the inferior frontal
gyrus showed greater activation during congruent, random, and
pseudorandom sentences and word lists, the left AG showed
activation only when semantic information had to be integrated
over a 6--15 s time course. In all other conditions, the AG was
either at baseline or significantly deactivated. Only very
complex semantic processing elevates the AG above resting
baseline, words, pseudowords, and even simple sentences
suppress it. These findings led Humphries et al. (2007) to
suggest that one important function of the AG is integration of
Cerebral Cortex Page 13 of 16
semantic information into an ongoing context. The incoming
stimulus interrupts processing of the internal narrative, but the
level of semantic input to the AG is impoverished during low-
level semantic processing, resulting in a reduction in AG
activity compared with a low-level task or even the resting state
baseline. In other words, during low-level tasks, the AG is
engaged in internally generated cognitive processes that are
suspended during more complex cognitive tasks (Greicius et al.
2003; Greicius and Menon 2004). Whether similar effects might
be at play during demanding multistep problem solving, for
example, in tasks involving word problems (Thevenot and
Oakhill 2005) and elaborate verbal processes in calculation
(Ansari 2008), remains to be investigated with more appropri-
ate experimental designs.
An alternate view of the AG function centers on its role at
the interface of memory and attention. Studies of memory
retrieval in patients with lesions to the IPC suggest weakened
retrieval effects in the absence of cues and paucity in the
semantic contents of the retrieval (Cabeza et al. 2008). Clearly,
further studies are needed to test these hypotheses and examine
the precise conditions in which semantic content of individual
stimulimodulate responses in the left and the right AG. Critically,
for us here, these notions of AG function point to a domain-
general, rather than a domain-specific, role in mathematical
cognition.
AG and IPS Relation to Individual Differences inPerformance
Analysis of brain--behavior relations provides further insights into
the role of the IPS and AG in mathematical cognition. In the AG,
deactivation was associated with reduced accuracy during both
tasks. This effect was most strongly observed in the posterior AG
area PGp in both hemispheres, although the effects were
stronger in the right hemisphere. A similar pattern was observed
in the MA-R task, except that responses were stronger in area
PGp and accuracy was also correlated with responses in the
anterior AG region PGa. These results converge on our findings
of between-task differences in deactivation and further suggest
that disengagement of the AG is necessary for accurate task
performance. Our results are also consistent with the observa-
tion above that the AG is deactivated, or relatively suppressed, to
a greater extent during performance of the less automated MA-R
task. More importantly, these findings suggest that AG de-
activation is related to individual differences in performance and
the subjective difficulty of performing the MA tasks. These AG
regions overlap with the DMN and provide new evidence that
suppression of the lateral parietal lobe nodes, but not the
midline structures of the DMN, such as the posterior cingulate
cortex or the ventromedial PFC, is crucial for accurate MA task
performance. In this regard, the observed brain--behavior rela-
tions differ in interesting ways from those in cognitive studies of
other domains such as attention (Polli et al. 2005; Weissman
et al. 2006).
Our findings are partly consistent with those of Grabner
et al. (2007), who found that left AG responses during
multiplication were correlated with measures of math compe-
tence acquired outside the scanner (Grabner et al. 2007). The
AG cluster observed by Grabner and colleagues is in close
proximity to the left PGa peak detected during the more
demanding MA-R task. However, our findings of brain--behavior
correlations were associated more with focal task-related
deactivation, rather than activation. Furthermore, deactivations
were observed in both hemispheres in our studies. There are 2
potential reasons for this discrepancy. One, our study used
task-specific measures of performance, rather than general
measures of math intelligence. Two, the use of just 2 fixation
blocks, placed at the beginning and end of the task, may also
have contributed to errors in estimating the profile of
activation and deactivation during the multiplication task in
the Grabner and colleagues’ study. Taken together, however,
these findings suggest that performance, task automaticity as
well as general domain competence—factors related to sub-
jective difficulty—all contribute to modulation of AG responses
during mathematical information processing tasks.
Beyond theAG, activations in the leftmid-IPS area hIP1 and the
adjoining SMG area PFmwere also correlated with accuracy, but
only in the more difficult MA-R task. These results suggest that
modulation of responses in specific IPC regions depends on task
automaticity and performance and that IPC contributions to
increased performance and efficiency are heterogeneous not
only between the 2 lateral IPC regions but also within each
hemisphere.
Conclusions
Our study provides a unique understanding of the architecture
of the IPC in mathematical cognition. More importantly, our
findings also pinpoint the link between cytoarchitectonically
defined regions of the IPC and the functionally heterogeneous
contributions of the IPS and AG to mathematical cognition. The
findings reported here point to close links between structure
and function within the IPC and they provide new insights into
the differential contributions of specific regions of the IPC in
relation to automated and successful MA task performance. The
functional heterogeneities we found are important for un-
derstanding the role of the IPS, AG, and the SMG of the IPC in
mathematical cognition. Our study also suggest that failure to
take into account the complex profile of activation and
deactivation above baseline can lead to misleading conclusions
about the role of the IPC in this domain. The systems neu-
roscience view advanced here suggests that the AG regions
must be disengaged as part of a general cognitive mechanism
involved during complex information processing tasks
(Greicius and Menon 2004). In this context, we highlight
further studies needed to investigate the precise cognitive
operations subserved by both the activated and deactivated
regions of the IPC and how they influence calculation, fact
retrieval, learning, and development of domain proficiency.
Supplementary Material
Supplementary material can be found at: http://www.cercor.
oxfordjournals.org/.
Funding
National Institutes of Health (HD047520 and HD059205) and
the National Science Foundation (BCS/DRL-0750340).
Notes
We thank Sonia Crottaz-Herbette for assistance with data acquisition
and Valorie Salimpoor for assistance with data analysis. Conflict of
Interest: None declared.
Address correspondence to: V. Menon, PhD, Symbolic Systems
Program, Program in Neuroscience and Department of Psychiatry and
Page 14 of 16 Parietal Heterogeneity during Mathematical Cognition d Wu et al.

Behavioral Sciences, 780 Welch Rd, Room 201, Stanford University
School of Medicine, Stanford, CA 94305, USA. Email: menon@stanford.
edu.
References
Anderson JR, Qin Y. 2008. Using brain imaging to extract the structure
of complex events at the rational time band. J Cogn Neurosci. 20:
1624--1636.
Ansari D. 2007. Does the parietal cortex distinguish between ‘‘10,’’
‘‘ten,’’ and ten dots? Neuron. 53:165--167.
Ansari D. 2008. Effects of development and enculturation on number
representation in the brain. Nat Rev Neurosci. 9:278--291.
Binder JR, Medler DA, Desai R, Conant LL, Liebenthal E. 2005. Some
neurophysiological constraints on models of word naming.
Neuroimage. 27:677--693.
Blumenfeld RS, Ranganath C. 2006. Dorsolateral prefrontal cortex
promotes long-term memory formation through its role in working
memory organization. J Neurosci. 26:916--925.
BrodmannK. 1909. Vergleichende Lokalisationslehre derGroßhirnrinde.
Leipzig: Barth.
Burbaud P, Degreze P, Lafon P, Franconi JM, Bouligand B, Bioulac B,
Caille JM, Allard M. 1995. Lateralization of prefrontal activation
during internal mental calculation: a functional magnetic resonance
imaging study. J Neurophysiol. 74:2194--2200.
Cabeza R, Ciaramelli E, Olson IR, Moscovitch M. 2008. The parietal
cortex and episodic memory: an attentional account. Nat Rev
Neurosci. 9:613--625.
Campbell JI, Fugelsang J. 2001. Strategy choice for arithmetic verification:
effects of numerical surface form. Cognition. 80:B21--B30.
Caspers S, Eickhoff SB, Geyer S, Scheperjans F, Mohlberg H, Zilles K,
Amunts K. 2008. The human inferior parietal lobule in stereotaxic
space. Brain Struct Funct. 212:481--495.
Caspers S, Geyer S, Schleicher A, Mohlberg H, Amunts K, Zilles K. 2006.
The human inferior parietal cortex: cytoarchitectonic parcellation
and interindividual variability. Neuroimage. 33:430--448.
Chen SH, Desmond JE. 2005. Temporal dynamics of cerebro-cerebellar
network recruitment during a cognitive task. Neuropsychologia.
43:1227--1237.
Chochon F, Cohen L, van de Moortele PF, Dehaene S. 1999. Differential
contributions of the left and right inferior parietal lobules to
number processing. J Cogn Neurosci. 11:617--630.
Choi HJ, Zilles K, Mohlberg H, Schleicher A, Fink GR, Armstrong E,
Amunts K. 2006. Cytoarchitectonic identification and probabilistic
mapping of two distinct areas within the anterior ventral bank of
the human. J Comp Neurol. 495:53--69.
Cohen JD, MacWhinney B, Flatt M, Provost J. 1993. PsyScope: a new
graphic interactive environment for designing psychology experi-
ments. Behav Res Methods Instrum Comput. 25:257--271.
Cohen Kadosh R, Cohen Kadosh K, Kaas A, Henik A, Goebel R. 2007.
Notation-dependent and -independent representations of numbers
in the parietal lobes. Neuron. 53:307--314.
Cohen L, Dehaene S, Chochon F, Lehericy S, Naccache L. 2000.
Language and calculation within the parietal lobe: a combined
cognitive, anatomical and fMRI study. Neuropsychologia. 38:
1426--1440.
Curtis CE, D’Esposito M. 2003. Persistent activity in the prefrontal
cortex during working memory. Trends Cogn Sci. 7:415--423.
D’Esposito M, Postle BR, Rypma B. 2000. Prefrontal cortical contribu-
tions to working memory: evidence from event-related fMRI studies.
Exp Brain Res. 133:3--11.
Dehaene S, Cohen L. 1997. Cerebral pathways for calculation: double
dissociation between rote verbal and quantitative knowledge of
arithmetic. Cortex. 33:219--250.
Dehaene S, Piazza M, Pinel P, Cohen L. 2003. Three parietal circuits for
number processing. Cogn Neuropsychol. 20:487--506.
Dehaene S, Spelke E, Pinel P, Stanescu R, Tsivkin S. 1999. Sources of
mathematical thinking: behavioral and brain-imaging evidence.
Science. 284:970--974.
Delazer M, Domahs F, Bartha L, Brenneis C, Lochy A, Trieb T, Benke T.
2003. Learning complex arithmetic—an fMRI study. Brain Res Cogn
Brain Res. 18:76--88.
Delazer M, Karner E, Zamarian L, Donnemiller E, Benke T. 2006.
Number processing in posterior cortical atrophy—a neuropsycho-
logical case study. Neuropsychologia. 44:36--51.
Derrfuss J, Brass M, von Cramon DY. 2004. Cognitive control in the
posterior frontolateral cortex: evidence from common activations in
task coordination, interference control, and working memory.
Neuroimage. 23:604--612.
Desikan RS, Segonne F, Fischl B, Quinn BT, Dickerson BC, Blacker D,
Buckner RL, Dale AM, Maguire RP, Hyman BT, et al. 2006. An
automated labeling system for subdividing the human cerebral
cortex on MRI scans into gyral based regions of interest.
Neuroimage. 31:968--980.
Desmond JE, Gabrieli JD, Wagner AD, Ginier BL, Glover GH. 1997.
Lobular patterns of cerebellar activation in verbal working-memory
and finger-tapping tasks as revealed by functional MRI. J Neurosci.
17:9675--9685.
Duffau H, Denvil D, Lopes M, Gasparini F, Cohen L, Capelle L, Van
Effenterre R. 2002. Intraoperative mapping of the cortical areas
involved in multiplication and subtraction: an electrostimulation
study in a patient with a left parietal glioma. J Neurol Neurosurg
Psychiatry. 73:733--738.
Eickhoff SB, Paus T, Caspers S, Grosbras MH, Evans AC, Zilles K,
Amunts K. 2007. Assignment of functional activations to probabi-
listic cytoarchitectonic areas revisited. Neuroimage. 36:511--521.
Eickhoff SB, Stephan KE, Mohlberg H, Grefkes C, Fink GR, Amunts K,
Zilles K. 2005. A new SPM toolbox for combining probabilistic
cytoarchitectonic maps and functional imaging data. Neuroimage.
25:1325--1335.
Fiez JA, Raichle ME. 1997. Linguistic processing. Int Rev Neurobiol.
41:233--254.
Glover GH, Lai S. 1998. Self-navigated spiral fMRI: interleaved versus
single-shot. Magn Reson Med. 39:361--368.
Gonzalez EG, Kolers PA. 1982. Mental manipulation of arithmetic
symbols. J Exp Psychol Learn Mem Cogn. 8:308--319.
Grabner RH, Ansari D, Reishofer G, Stern E, Ebner F, Neuper C. 2007.
Individual differences in mathematical competence predict parietal
brain activation during mental calculation. Neuroimage. 38:346--356.
Greicius MD, Krasnow B, Reiss AL, Menon V. 2003. Functional
connectivity in the resting brain: a network analysis of the default
mode hypothesis. Proc Natl Acad Sci USA. 100:253--258.
Greicius MD, Menon V. 2004. Default-mode activity during a passive
sensory task: uncoupled from deactivation but impacting activation.
J Cogn Neurosci. 16:1484--1492.
Gruber O, Indefrey P, Steinmetz H, Kleinschmidt A. 2001. Dissociating
neural correlates of cognitive components in mental calculation.
Cereb Cortex. 11:350--359.
Harrison BJ, Pujol J, Lopez-Sola M, Hernandez-Ribas R, Deus J, Ortiz H,
Soriano-Mas C, Yucel M, Pantelis C, Cardoner N. 2008. Consistency
and functional specialization in the default mode brain network.
Proc Natl Acad Sci USA. 105:9781--9786.
Hayter AL, Langdon DW, Ramnani N. 2007. Cerebellar contributions to
working memory. Neuroimage. 36:943--954.
Hiscock M, Caroselli JS, Kimball LE, Panwar N. 2001. Performance on
paced serial addition tasks indicates an associative network for
calculation. J Clin Exp Neuropsychol. 23:306--316.
Holmes AP, Friston KJ. 1998. Generalisability, random effects &
population inference. Neuroimage. 7:S754.
Humphries C, Binder JR, Medler DA, Liebenthal E. 2007. Time course of
semantic processes during sentence comprehension: an fMRI study.
Neuroimage. 36:924--932.
Ischebeck A, Zamarian L, Egger K, Schocke M, Delazer M. 2007. Imaging
early practice effects in arithmetic. Neuroimage. 36:993--1003.
Ischebeck A, Zamarian L, Siedentopf C, Koppelstatter F, Benke T,
Felber S, Delazer M. 2006. How specifically do we learn? Imaging
the learning of multiplication and subtraction. Neuroimage. 30:
1365--1375.
Kazui H, Kitagaki H, Mori E. 2000. Cortical activation during retrieval of
arithmetical facts and actual calculation: a functional magnetic
resonance imaging study. Psychiatry Clin Neurosci. 54:479--485.
Kim DH, Adalsteinsson E, Glover GH, Spielman DM. 2002. Regularized
higher-order in vivo shimming. Magn Reson Med. 48:715--722.
Cerebral Cortex Page 15 of 16

Krueger F, Spampinato MV, Pardini M, Pajevic S, Wood JN, Weiss GH,
Landgraf S, Grafman J. 2008. Integral calculus problem solving: an
fMRI investigation. Neuroreport. 19:1095--1099.
Lassaline ME, Logan GD. 1993. Memory-based automaticity in the
discrimination of visual numerosity. J Exp Psychol Learn Mem Cogn.
19:561--581.
Lee KM. 2000. Cortical areas differentially involved in multiplication and
subtraction: a functional magnetic resonance imaging study and
correlation with a case of selective acalculia. Ann Neurol. 48:657--661.
Logan GD. 1988. Toward an instance theory of automatization. Psychol
Rev. 95:492--527.
Mai JK, Paxinoss G, Voss T. 2007. Atlas of the human brain. San Diego
(CA): Academic Press.
McCarthy SV, Dillon W. 1973. Visual serial search for arabic and roman
numbers. Percept Mot Skills. 37:128--130.
Mechelli A, Gorno-Tempini ML, Price CJ. 2003. Neuroimaging studies of
word and pseudoword reading: consistencies, inconsistencies, and
limitations. J Cogn Neurosci. 15:260--271.
Menon V, Mackenzie K, Rivera SM, Reiss AL. 2002. Prefrontal cortex
involvement in processing incorrect arithmetic equations: evidence
from event-related fMRI. Hum Brain Mapp. 16:119--130.
Menon V, Rivera SM, White CD, Eliez S, Glover GH, Reiss AL. 2000.
Functional optimization of arithmetic processing in perfect
performers. Brain Res Cogn Brain Res. 9:343--345.
Menon V, Rivera SM, White CD, Glover GH, Reiss AL. 2000. Dissociating
prefrontal and parietal cortex activation during arithmetic process-
ing. Neuroimage. 12:357--365.
Perry DK. 1952. Speed and accuracy of reading arabic and roman
numerals. J Appl Psychol. 36:346--347.
Petit L, Courtney SM, Ungerleider LG, Haxby JV. 1998. Sustained activity
in the medial wall during working memory delays. J Neurosci. 18:
9429--9437.
Piazza M, Pinel P, Le Bihan D, Dehaene S. 2007. A magnitude code
common to numerosities and number symbols in human intra-
parietal cortex. Neuron. 53:293--305.
Poline JB, Worsley KJ, Evans AC, Friston KJ. 1997. Combining spatial
extent and peak intensity to test for activations in functional
imaging. Neuroimage. 5:83--96.
Polli FE, Barton JJ, Cain MS, Thakkar KN, Rauch SL, Manoach DS. 2005.
Rostral and dorsal anterior cingulate cortex make dissociable
contributions during antisaccade error commission. Proc Natl Acad
Sci USA. 102:15700--15705.
Ramnani N. 2006. The primate cortico-cerebellar system: anatomy and
function. Nat Rev Neurosci. 7:511--522.
Rickard TC, Romero SG, Basso G, Wharton C, Flitman S, Grafman J. 2000.
The calculating brain: an fMRI study. Neuropsychologia. 38:325--335.
Rissman J, Eliassen JC, Blumstein SE. 2003. An event-related FMRI
investigation of implicit semantic priming. J Cogn Neurosci. 15:
1160--1175.
Roland PE, Friberg L. 1985. Localization of cortical areas activated by
thinking. J Neurophysiol. 53:1219--1243.
Rueckert L, Lange N, Partiot A, Appollonio I, Litvan I, Le Bihan D,
Grafman J. 1996. Visualizing cortical activation during mental
calculation with functional MRI. Neuroimage. 3:97--103.
Scheperjans F, Eickhoff SB, Homke L, Mohlberg H, Hermann K,
Amunts K, Zilles K. 2008. Probabilistic maps, morphometry, and
variability of cytoarchitectonic areas in the human superior parietal
cortex. Cereb Cortex. 18:2141--2157.
Scheperjans F, Hermann K, Eickhoff SB, Amunts K, Schleicher A,
Zilles K. 2008. Observer-independent cytoarchitectonic mapping of
the human superior parietal cortex. Cereb Cortex. 18:846--867.
Schmahmann JD, Doyon J, McDonald D, Holmes C, Lavoie K,
Hurwitz AS, Kabani N, Toga A, Evans A, Petrides M. 1999. Three-
dimensional MRI atlas of the human cerebellum in proportional
stereotaxic space. Neuroimage. 10:233--260.
Schulman GL, McAvoy MP, Cowan MC, Astafiev SV, Tansy AP,
d’Avossa G, Corbetta M. 2003. Quantitative analysis of attention
and detection signals during visual search. J Neurophysiol. 90:
3384--3397.
Schunn CD, Reder LM, Nhouyvanisvong A, Richards DR, Stroffolino PJ.
1997. To calculate or not to calculate: a source activation confusion
model of problem familiarity’s role in strategy selection. J Exp
Psychol Learn Mem Cogn. 23:3--29.
Seeley WW, Menon V, Schatzberg AF, Keller J, Glover GH, Kenna H,
Reiss AL, Greicius MD. 2007. Dissociable intrinsic connectivity
networks for salience processing and executive control. J Neurosci.
27:2349--2356.
Simon O, Mangin JF, Cohen L, Le Bihan D, Dehaene S. 2002.
Topographical layout of hand, eye, calculation, and language-related
areas in the human parietal lobe. Neuron. 33:475--487.
Sridharan D, Levitin DJ, Menon V. 2008. A critical role for the right
fronto-insular cortex in switching between central-executive and
default-mode networks. Proc Natl Acad Sci USA. 105:12569--12574.
Sweet LH, Paskavitz JF, Haley AP, Gunstad JJ, Mulligan RC, Nyalakanti PK,
Cohen RA. 2008. Imaging phonological similarity effects on verbal
working memory. Neuropsychologia. 46:1114--1123.
Tanji J, Mushiake H. 1996. Comparison of neuronal activity in the
supplementary motor area and primary motor cortex. Brain Res
Cogn Brain Res. 3:143--150.
Thevenot C, Oakhill J. 2005. The strategic use of alternative representa-
tions in arithmetic word problem solving. Q J Exp Psychol A.
58:1311--1323.
Todd JJ, Fougnie D, Marois R. 2005. Visual short-term memory load
suppresses temporo-parietal junction activity and induces inatten-
tional blindness. Psychol Sci. 16:965--972.
Tzourio-Mazoyer N, Landeau B, Papathanassiou D, Crivello F, Etard O,
Delcroix N, Mazoyer B, Joliot M. 2002. Automated anatomical
labeling of activations in SPM using a macroscopic anatomical
parcellation of the MNI MRI single-subject brain. Neuroimage. 15:
273--289.
Venkatraman V, Siong SC, Chee MW, Ansari D. 2006. Effect of language
switching on arithmetic: a bilingual FMRI study. J Cogn Neurosci.
18:64--74.
Weissman DH, Roberts KC, Visscher KM, Woldorff MG. 2006. The
neural bases of momentary lapses in attention. Nat Neurosci. 9:
971--978.
Xiao Z, Zhang JX, Wang X, Wu R, Hu X, Weng X, Tan LH. 2005.
Differential activity in left inferior frontal gyrus for pseudowords
and real words: an event-related fMRI study on auditory lexical
decision. Hum Brain Mapp. 25:212--221.
Zago L, Pesenti M, Mellet E, Crivello F, Mazoyer B, Tzourio-Mazoyer N.
2001. Neural correlates of simple and complex mental calculation.
Neuroimage. 13:314--327.
Zago L, Petit L, TurbelinMR, Andersson F, VigneauM, Tzourio-MazoyerN.
2008. How verbal and spatial manipulation networks contribute to
calculation: an fMRI study. Neuropsychologia. 46:2403--2414.
Page 16 of 16 Parietal Heterogeneity during Mathematical Cognition d Wu et al.


