
NBER WORKING PAPER SERIES
DOES GLOBALIZATION INCREASE CHILD LABOR? EVIDENCE FROM VIETNAM
Eric EdmondsNina Pavcnik
Working Paper 8760http://www.nber.org/papers/w8760
NATIONAL BUREAU OF ECONOMIC RESEARCH1050 Massachusetts Avenue
Cambridge, MA 02138February 2002
Comments are appreciated. We would like to thank Patty Anderson, Andrew Bernard, John Hoddinott, DougIrwin, Hanan Jacoby, Diane Kruger, Matt Slaughter, Dominique van de Walle, Susan Zhu, and seminarparticipants at Brandeis, Dalhousie, Dartmouth, EIIT, NEUDC, NBER ITI Meetings, Penn State, and theWorld Bank for their comments and suggestions. We are grateful for the research assistance of Steve Cantin,Andreea Gorbatai, and Oleg Prokhorenko. The views expressed herein are those of the authors and notnecessarily those of the National Bureau of Economic Research.
© 2002 by Eric Edmonds and Nina Pavcnik. All rights reserved. Short sections of text, not to exceed twoparagraphs, may be quoted without explicit permission provided that full credit, including © notice, is givento the source.
Does Globalization Increase Child Labor? Evidence from VietnamEric Edmonds and Nina PavcnikNBER Working Paper No. 8760February 2002JEL No. F15, F14
ABSTRACT
This paper considers the impact of liberalized trade policy on child labor in a developing country.
While trade liberalization entails an increase in the relative price of the exported product, trade theory
provides ambiguous predictions on how this price change affects the incidence of child labor. In this
paper, we exploit regional and intertemporal variation in the real price of rice to examine the relationship
between price movements of a primary export and the economic activities of children. Using a panel of
Vietnamese households, we find that reductions in child labor are increasing with rice prices. Declines
in child labor are largest for girls of secondary school age, and we find a corresponding increase in school
attendance for this group. Overall, rice price increases can account for almost half of the decline in child
labor that occurs in Vietnam in the 1990s. Greater market integration, at least in this case, appears to be
associated with less child labor. Our results suggest that the use of trade sanctions on exports from
developing countries to eradicate child labor is unlikely to yield the desired outcome.
Eric Edmonds Nina PavcnikDepartment of Economics Department of EconomicsDartmouth College Dartmouth College6106 Rockefeller Hall 6106 Rockefeller HallHanover, NH 03755 Hanover, NH [email protected] and NBER

1
1. Introduction
Much of the recent policy debate and controversy surrounding globalization and the WTO has
been focused on the issue of child labor in poor countries. On the one hand, opponents of market
integration argue that globalization may increase the wages paid to working children or increase the
earnings opportunities of children in poor economies, thereby increasing child labor. Some further
suggest that rich countries should restrict the sale of goods from developing countries that lack or do not
enforce child labor laws. Yet many doubt the ability of trade sanctions to eliminate child labor (Bhagwati
(1995), Maskus (1997)).1 Theoretical models by Maskus (1997), Melchior (1996), and Ranjan (2001)
show that trade sanctions or import tariffs against countries that use child labor do not necessarily reduce
the incidence of child labor. Alternatively, increases in household income and increased availability of
schooling opportunities in low-income countries could help reduce child labor (Basu 1999). Some argue
that liberalized trade and increased access to world markets could help eradicate child labor by raising the
standard of living in these poorer economies (Bhagwati (1995), Dixit (2000)).2
Given the theoretical ambiguity about the relationship between child labor and trade discussed in
detail in section 2, surprisingly little empirical research examines the link between product market
integration (or liberalized trade policy specifically) and child time allocation.3 This paper uses variation
in the domestic price of a country’s primary staple and export product to consider this relationship.
Specifically, we consider the link between changes in the price of rice in Vietnam and changes in child
labor. From 1993 to 1998, the average domestic price of rice increased 29% relative to the consumer
price index. Part of this rice price increase stems from the relaxation of a rice export quota. Out of
concern for domestic food security and a desire to suppress the domestic price of rice, the Vietnamese 1 Maskus (1997) provides an overview of the broader literature on international trade and labor standards. 2 Although the effect of trade on a country's standard of living is ambiguous in theory, Frankel and Romer (1999) provide evidence that more open economies enjoy higher real income. 3 Hanson and Harrison (1999) provide a survey of the impact of trade liberalization on labor markets in developing countries. A set of studies focuses on the determinants of child labor such as child age, gender, missing markets, parental income, and school availability (Rosenzweig and Evenson (1977), Levy (1985), Patrinos and Psacahropoulos (1997), Psacharopoulos (1997), Edmonds (2001a & b)). Rodrik (1996) examines the link between labor standards (including child labor laws), international prices, and trade flows. Krueger (1996) explores the determinants of the support for the Child Labor Deterrence Act of 1995 in the U.S. House of Representatives. Grootaert and Kanbur (1995), Maskus (1997), and Basu (1999) survey these studies.

2
government began administering a rice export quota in 1989. Since then, the government has gradually
liberalized its export regime, allowing rice exports to more than double (to about 3 million tons in 1996).
By 1997, Vietnam's export quota was no longer binding, and Vietnam was fully exposed to the
international price of rice (Goletti and Minot 1997).
During this period of liberalization, communities across Vietnam experienced large intertemporal
and regional variation in the relative price of rice. In this study, we relate regional and intertemporal
variation in the relative price of rice to variation in child labor using the Vietnam Living Standards
Survey (VLSS), a 4,000 household panel spanning the period of quota changes. We complement the
household survey with detailed price data from a community (psu) level price survey conducted at the
time of the household interviews. Our empirical approach compares changes in the economic activities of
children across communities that experience different changes in the relative price of rice over time. We
control for unobserved differences across communities and households that may be correlated with
changes in the relative price of rice and child time allocation by exploiting the panel structure of our data.
To the extent that trade liberalization affects the price of a commodity, our analysis illustrates the
potential impact of trade policy even though all of the price variation in our data does not stem directly
from changes in the rice export quota. 4 We are not aware of any other empirical research that relates
change in child labor to changes in product prices.
Vietnam provides an ideal environment to address the relationship between child labor and trade.
First, worldwide child labor is most prevalent in very poor countries such as Vietnam (with a GNP per
capita of $310 in 1997). Using cross-country data, Krueger (1996) shows that most child labor occurs in
countries with extremely low per capita GDPs and that per capita GDP (and its square) explains 80
percent of the worldwide cross-country variation in child labor. Yet, very little research focuses on the
impact of trade policy on well-being in these countries (Winters (2000), Dollar and Kraay (2001)).
Second, a significant portion of the population in developing countries derives its income from
4 Ichimura and Taber (2000) argue for using retrospective price changes to study proposed policies. Our approach is consistent with their suggestion as well as many previous trade studies that rely on within-country data to explore a trade-related phenomenon. See Hanson and Slaughter (2001) for an example.

3
agriculture. In Vietnam, for example, 70% of the population in 1993 works in the agricultural sector, and
rural (predominantly agricultural) households are generally much poorer than their urban counterparts.
Finally, although much of the public attention focuses on the exploitation of child labor in manufacturing
establishments, most child labor occurs in agricultural activities and household production (ILO/UNICEF
1997). In Vietnam in 1993, 26% of children ages 6 through 15 work in agriculture; only 4% work for
household run non-agricultural enterprises; and less than 3% work for wages outside of the household.
The VLSS enables us to track child participation in activities within households and in formal and
informal labor markets.
We find large reductions in child labor associated with the observed increases in the relative price
of rice. A 30 percent increase in price of a kg of rice leads to about a 9 percentage point decline in child
labor. The effect of rice price increases varies by household exposure to rice prices through production
and consumption. Children in households that own land experience especially large reductions in child
labor associated with rice increases. An increase in the relative price of rice (potentially stemming from
liberalized trade policy) enhances rural household income. Households appear to substitute the extra
income captured by household landholdings for income previously earned by children. This extra income
appears to particularly benefit older girls who experience the largest declines in child labor and the largest
increases in school enrollment. Hence, child labor declines even though globalization also raised the
potential earnings of children. In this way, our evidence suggests that greater integration of unskilled
labor abundant developing economies into world markets can be associated with less child labor. We
discuss the policy implications of our findings in the conclusion to the paper.
2. Theory Motivation
Several theoretical papers address the relationship between product prices, trade policy, and child
labor in developing economies that are relatively abundant in unskilled labor. Trade policy affects the
prices of a product produced by child labor (or adult labor), thus influencing the allocation of child time.
Using different theoretical settings, these studies show that the effect on child labor of a foreign tariff (i.e.
a decline in the price of the exported good) depends on the assumptions one makes in modeling. These

4
ambiguous theory predictions and the lack of empirical evidence provide the main motivation for our
empirical work.
Maskus (1997) models an economy producing an export and import-competing good in a
specific-factors framework. Adult labor is mobile across the two sectors. In addition, the export sector
subcontracts from the informal sector, which employs children. Maskus shows that the imposition of a
foreign tariff on the exported good ambiguously affects the incidence of child labor, depending on the
elasticity of substitution between child and adult labor in the production of the export good. Melchior
(1996) sets up a specific-factors model in which child labor is a factor specific to the export sector. The
foreign tariff on the exported good reduces the good's price, lowers the returns to child labor, and
decreases the labor market participation of children.
The above models abstract from the household decision to send children to work. Basu and Van
(1998) and Baland and Robinson (2000) explicitly model the household choice of child labor and suggest
that the household decision to send children to work (or to educate them) ultimately depends on the price
and returns to education, the price of the goods that household consumes and produce, adult wages, child
wages, and the household discount rate. Brown (2000) and Dixit (2000) discuss the implications of
punitive foreign tariffs on child labor using a simplified version of Basu and Van (1998). Basu and Van
(1998) assume that child labor is a bad in parental preferences. Thus, when household income from adult
wages surpasses some threshold, families withdraw the children from the labor market. This yields a
discontinuity in the labor supply at the threshold wage and multiple labor market equilibria. A ban on
child labor can then move an economy from an equilibrium with low wages and child labor to an
equilibrium with high wages and no child labor. Brown (2000) and Dixit (2000) argue that foreign tariffs
do not necessarily reduce child labor in this set up: the implication of the effect of trade policy on child
labor depends on the slope of the labor demand curve and the elasticity of substitution between child and
adult labor. For example, when the economy is fully integrated in the world market, wages are
completely determined by international product prices (i.e. the labor demand curve is perfectly elastic).

5
By lowering the price of a product exported by developing countries, protectionist measures by the
industrialized countries might then actually increase the incidence of child labor.
A household model by Ranjan (2001), where child labor stems from credit constraints, also yields
an ambiguous relationship between trade policy and child labor. He models an economy that produces a
high-skill and low-skill intensive good and is endowed with skilled and unskilled adult labor. Child labor
is an imperfect substitute for unskilled adult labor. Household welfare depends on current household
consumption and on the discounted future welfare of children. The model implicitly assumes that the
present discounted value of education exceeds the present discounted value of child labor. In each period,
a parent decides whether to send a child to school or to work. Ranjan shows that trade sanctions might
not reduce the incidence of child labor in a long run model of trade based on relative endowment
differences across countries (Hecksher-Ohlin). An increased foreign tariff lowers the wages of unskilled
workers and increases the returns to educated workers in an economy that is relatively abundant with
unskilled labor. While the returns to education increase (making it less likely for parents to send children
to work), households endowed with unskilled labor also become poorer and thus more credit constrained
(making it more likely for parents to send children to work). This second effect likely dominates the first
for a credit-constrained household with unskilled parents.
Although these models differ in the assumptions on the structure of the labor market, the structure
of the economy, and the household decision making process, they ultimately encompass similar channels
through which product price affects child labor. Let us review these channels for the case of the rice price
increase (potentially instigated by the relaxation in rice export quota) studied in this paper. Rice is
important in Vietnam in both consumption and production. Prior to liberalization (1993), rice constitutes
44% of all food expenditure and 29% of expenditure overall. 70% of all farmland in Vietnam is devoted
to rice and 98% of all communities report growing some rice (authors' calculations from the VLSS).
Thus, we expect large and dramatic effects of rice price changes. First, we consider how rice price
increases affect the opportunity cost of time in various activities. Agriculture is the most common arena
in which children work. Increases, in the price of rice, then, raise the value of a child's time spent in

6
agriculture. Hence, we expect to see children work more (this is a main argument of globalization
opponents). In addition, increases in the price of rice also raise the value of adult time in agriculture.
This might induce adults to shift their time towards rice production, increasing the demand for child labor
in other activities. Obviously, the comparative advantage for adults and children in different types of
work determines which of these two effects dominates. Moreover, by increasing (reducing) the rewards
to schooling or through households becoming more (less) forward looking (with lower discount rates),
liberalization might raise (decline) the present value of child time spent in activities such as schooling
rather than working.
Rice price increases also affect household income. First, child labor might be a bad in parental
preferences (as in Basu and Van (1998)). If higher rice prices lead to an increase in household income,
child labor should decline. Alternatively, if credit-constrained households were unable to finance child
schooling (as in Baland and Robinson (2000) or Ranjan (2001)), the additional income from liberalization
allows parents to overcome at least part of their credit constraint. However, most rural households in
Vietnam are not only rice producers but rice consumers. Rice is the primary staple of the Vietnamese
diet. While increases in rice prices may augment household income, the consumption based income
effect of the price change may leave households that are large net consumers of rice worse off. This
negative income effect may force households to increase the incidence of child labor.
In view of the ambiguity in the predictions in economic theory, we address the relationship
between child labor and liberalized trade empirically. Despite a large empirical literature that studies the
determinants of the child labor surveyed in Grootaert and Kanbur (1995), to our knowledge no empirical
study relates child labor to changes in product prices (potentially stemming from a trade policy change).
3. Data description
We examine the relationship between product prices in the rice sector and child labor using two
rounds of the VLSS that spans the period of quota changes. The first round of the VLSS was conducted
between September 1992 and October 1993. The second round of the VLSS revisited 151 communes
from the first round between December 1997 and December 1998. In our analysis, we focus on
7
households with children that appear in the 151 panel communes. 4305 households are revisited in the
second round of the survey, and at times, we restrict our source of identifying information to data from
these panel households. 5 The household survey includes questions on household composition, the labor
activities of adults and children, education, expenditure, land holdings, and agricultural activities. The
household survey is accompanied by a community questionnaire that includes a detailed price information
as well as information on local employment opportunities and wage rates.6,7 Table 1 reports basic
summary statistics from the data.
The approach of this paper is to relate changes in the price of rice to changes in the economic
activities of children. We thus begin with a description of the rice price changes. The first row in table 1
reports the consumer price of a kilogram of ordinary rice in 1993 and 1998 collected in the community
price survey.8 We deflate the price of rice with the monthly consumer price index so that all prices are in
000s of 1998 (January) Dong. One U.S. dollar corresponds to approximately 14,000 Dong in 1998.9
Throughout this paper, whenever we refer to rice price changes, we mean changes in the real (deflated)
prices of a kilogram of rice. The average domestic price of rice increased by 29% relative to the rise in
the consumer price index. Benjamin and Brandt (2001) document similar increases in consumer unit 5 Glewwe and Nguyen (2000) discuss attrition in the VLSS panel households and conclude that the panel households appear to be nationally representative. 89.6% of the households that appear in the first round of the VLSS reappear in the second round. In panel communes, missing households were replaced with randomly selected households. 6 We have also compared the prices reported in the commune questionnaire with the average commune price based on unit values of purchased rice from the household survey. They are highly correlated. 7 We face a choice of using the wage data reported by a commune official in the community survey or wages reported from the household survey. Wages at the household level depend on household labor supply, which is jointly determined with child labor. Aggregating over households in a commune could in principle solve this problem, but in many communes, we observe very few (at times zero) households reporting wage work, so we choose to use wages from the community survey. The wage rates are day wages for agricultural laborers. These are only available for rural communes. Hence, we only report results with wages for rural areas. For adult wages, we focus on the wages paid to male day laborers at harvest time. Child wages are reported irrespective of gender, and because of data availability, we focus on child wages averaged across all agricultural seasons. In Vietnam, wages are often paid in cash and in-kind, and the commune official was instructed to impute a value of in-kind wages in answering the question. In addition, in 36 out of 278 commune-year observations, we are missing wage rates from the community survey. We impute wages for these communes based on commune average expenditure per capita using the same procedure as for rice (below). We follow the same procedure for adult and child wages. 8 6 communes do not report the price in at least one of the survey rounds. We impute the rice price in these communes. Based on the unit value of rice purchased by households reported in the VLSS, we calculate the mean unit value of a kg of rice for a commune in a given survey year. We regress the price of rice reported in the price survey on the third order polynomial of the mean unit value of rice in a commune. We replace the missing price data with the predicted value of commune price based on this regression. 9 The price deflator does not vary by region, because we do not want the deflator to drive the variation in rice prices.

8
prices.10 Our analysis in this paper is based on differences across communes in changes in rice prices.
Figure 1 plots the data that underlies our analysis. The horizontal axis is the real price of rice in a
commune in 1993, and the vertical axis is the real price of rice in a commune in 1998. The 45 degree line
is also pictured. 144 out of 151 communes in the VLSS experienced a considerable increase in the real
price of rice. Moreover, the variation in rice price changes across communities is substantial. This across
community variation in the relative rice price change is the source of our identification below.
Vietnam experienced national and international market integration during the time of our sample.
Although it is impossible to disentangle the effects of rice quota on prices from other factors that could
affect prices, some evidence suggests that Vietnam's integration into international markets played an
important role. Absent international integration and unobserved demand and supply shocks, national
market integration would likely lead to convergence of prices across regions with prices in rice surplus
regions increasing and the prices in rice deficit regions declining. However, the prices increase
dramatically in all regions during these two periods. For example, while the rice prices increased by 23
percent in the North, they increased by 35 percent in the South. The South supplies most of the
Vietnamese rice exports. Moreover, figure 1 suggests that these increasing prices do not appear to be
converging to one price level. The standard deviation of rice prices across communes is the same in 1993
and 1998. These two factors (larger increases in the South and a lack of convergence) are suggestive of
the importance of increased exposure of Vietnamese rice sector to international markets.
A more detailed examination of regional patterns of changes in rice prices further indicates that
some of this price variation is plausibly associated with the rice export quota. Goletti and Minot (1997)
describe the rice sector and the sources of rice exports in Vietnam. While almost all of Vietnam produces
rice, the largest source of rice exports is the Mekong River Delta and the Southeast. In figure 2, we plot
real rice prices in 1993 and 1998 by the 8 main administrative regions in Vietnam. In 1993 rice prices are
highest in the most isolated regions of Vietnam (Central Highlands (CH) and the Northern Uplands (NW
10 The correlation between consumer prices and unit prices in levels is .68. The correlation between changes in consumer prices and unit prices (our source of identification below) is .81.

9
and part of NE).11 Goletti and Minot suggest that, in these regions, rice is grown primarily by small
farmers for their own use, and some additional rice is imported from surrounding areas. The five main
rice producing areas all have lower prices in 1993 than the three more remote regions; the largest rice
producing area, the Mekong River Delta, has the lowest prices in 1993. In 1998, the remotest regions
(CH and NW) still have among the highest rice prices. However, two of the highest priced regions are the
main exporting regions, the Mekong River Delta and the Southeast. In fact, the Mekong River Delta has
grown from the lowest priced region in 1993 to the fourth highest in 1998. The price changes that take
place in the Mekong and in the Southeast are similar to what we would expect with a liberalization of the
rice export quota. We obviously cannot claim that the price variation we observe across Vietnam is
attributable singularly to the change in the rice export quota. However, to the extent that trade
liberalization affects the price of a commodity, our analysis illustrates the potential re-distributive impact
of trade policy even if quota changes are not the sole cause of the price increase.
Children in Vietnam engage in a wide range of activities that might be influenced by rice price
changes. Table 2 describes the economic activities of children in Vietnam in 1993 and 1998. In this
study, we focus on the economic activities of children between the ages of 6 and 15 within the last seven
days. We restrict our attention to this age group, because the VLSS do not collect data on the allocation
of time for household members below the age of 6. 15 is the upper age limit in many international
conventions on child labor. The VLSS data describe child time allocation in a number of activities.12 In
11 Dollar and Glewwe (1998) describe regional differences in poverty and inequality in Vietnam. 12 The weaknesses inherent in using the VLSS to discuss child labor questions are discussed in Edmonds and Turk (2001), and three issues seem particularly important in our study. First, there may be a sizable, unregistered migrant population in Vietnam that would be missed entirely in the VLSS' sampling frame (Poverty Working Group 1999). Second, the VLSS are household surveys, so children who are not resident within households are missed in the survey. Thus, we miss street children and many of the worst forms of child labor such as prostitution and many forms of slavery. Edmonds and Turk investigate whether children disappear from VLSS panel households between 1993 and 1998. They found that a maximum of 26 out of 6003 children between ages 0 and 10 in VLSS panel households in 1993 could have left their household for work by 1998. This obviously misses children in households that collapsed or otherwise disappeared between rounds of the survey. Nevertheless, for recaptured households, sending (or selling) children away from a sampled household to work is unlikely to be an important source of bias. Third, the VLSS does not provide data on the working conditions of children, and there are problems with the way it records hours of work outside of household work. We think that the quantity of work and work conditions may be more income and price elastic than is participation. Hence, focusing on participation rates alone may miss many interesting dynamics associated with rice price changes.
10
addition to schooling, we know whether a child works outside of the household for pay or as a domestic
servant, works in agriculture for the household, works in a household business, or performs household
work and chores such as cleaning, cooking, washing, shopping, collecting water or wood, and building or
maintaining the house, its surroundings, or furniture.
While table 2 summarizes participation rates in each of these activities, in this study, we focus on
an aggregation of these categories as a definition of child labor. Namely, a child engages in child labor if
it works for seven or more hours per week in household work and chores or if the child works for one
hour or more per week in agriculture, wage employment, a family business, or as a domestic servant.13 A
number of characteristics stand out from table 2. First, most children are engaged in child labor in 1993
even though Vietnam officially banned child labor in 1988. By 1998, only 38% of children are working,
which corresponds to a 33% reduction in child labor between 1993 and 1998.14 Edmonds (2001b) shows
that most of the decline in child labor in rural households can be explained by improvement in living
standards. Our present study can be viewed as an examination of one possible explanation of
improvement in living standards. Second, most working children manage to simultaneously attend
school. While 57% of children in 1993 work, only 18% of children work without attending school. By
1998, only 7% of children work without attending school. However, Edmonds and Turk (2001)
document a strong negative correlation between work and schooling. Secondary school age children that
work in agriculture or businesses are 23% less likely to attend school than children who do not work.
13 This definition of child labor matches the definition employed by the International Labor Organization in many of its SIMPOC country studies (ILO n.d.). Moreover, it overcomes three main conceptual problems that would arise from failing to consider the activities performed by children in the production of nontradable goods (home production). First, when a child works outside of its household as a paid domestic servant or a slave that child is classified as a child laborer under the most stringent of definitions. It seems hard to defend reclassifying the child's production activities as something other than work if the child's employer changes (even if it changes to a parent). Second, treating the production of nontradables as something other than child labor makes it difficult to interpret the meaning of the state of "not working." For example, if home production is ignored in the definition of child labor, a child that stops limited work in a family business to take over extensive household responsibilities (say, because of the absence of a parent) would appear to stop working. Third, an assertion that child participation in the production of nontradables is not an economic phenomenon (or of economic interest) implies that including home production in a definition of child labor should attenuate our results. To the extent that participation in the production of nontradables varies with changes in the relative price of a market good, it clearly is of economic importance. 14 These participation rates imply that 7.86 million children work in Vietnam in 1993 and 5.64 million children work in 1998.

11
Third, children predominantly perform household work and chores and work within the household in
agriculture. Rice price changes affect both of these types of work. The relationship between rice prices
changes and agricultural work is obvious. Household work may be associated with rice price increases if
parents are more active in agriculture or formal labor market activities. We observe a 15% decline in
agricultural work and actually an increase in household work. However, this increase in household work
is not statistically significant and appears to be associated with less time in household work on average
(mean hours in household work decline from 6.0 to 4.4 hours, a statistically significant decrease). Fourth,
work outside of the household is extremely rare for children in Vietnam. Only 4.4% of children ages 6-15
in 1993 report any work outside of the household in the last week. In the 1998 data, the fraction of
children working outside of their household declines to 2.7%. Hence, the typical newspaper image of
overworked children spending long hours in factories is simply not typical of child laborers in Vietnam.
By far, most children either work in agriculture or participate in household work and chores.
4. Results
4.1 Rice Prices and Child Labor: Basic Results
Our analysis is based on comparing changes in the probability a child works across communities
that experience different price changes over time. We begin by considering this relationship
nonparametrically. For each commune, we compute the fraction of children working in 1993 and 1998
and subtract the 1998 mean from the 1993 mean to obtain the decline in the share of children working in
the commune. We plot the decline in child labor in a commune against the increase in the commune real
rice prices in figure 3. The regression line pictured in figure 3 is the result of a nonparametric regression
of the decline in child labor against the increase in rice prices where we have weighted observations by
the number of children in each commune in 1993.15 The vertical line in figure 3 is at the mean rice price
increase.
15 We use a local linear regression procedure with a Gaussian kernel and a bandwidth of .38 chosen by visual inspection. Regressions are weighted by the number of children in sampled households in the commune in order to be consistent with the linear regression work below. The 1993 sample is self-weighting so there is no additional correction for sample design necessary.
12
Two characteristics stand out in Figure 3. First, for most of the distribution of increases in the
relative price of rice, the larger the increase in rice prices, the larger the decline in child labor.16 Thus, an
extreme outlier is not driving our results. Moreover, when we turn to a parametric regression framework,
we expect that small increases in rice prices are associated with declines in child labor. Second, we do
not observe a decline in child labor with increases in the relative price of rice in the few communities that
experience declines in the relative price of rice and communities with extremely large (twice the mean)
increases in the price of rice. Thus, these communes attenuate the apparent positive relationship between
rice price increases and the decline in child labor.
In the remainder of this paper, we consider the relationship between child labor and rice prices
using a linear probability model.17 For a child j in commune i at time t, we estimate:
(1) 1 1 2 .ijt it jt t i ijty RP X Tβ α α λ ε= + + + +
y is the indicator for whether the child engages in child labor and RP is the natural logarithm of the real
price of a kilogram of ordinary rice.18 Several features of this framework should be highlighted. First, the
probability a child labors might differ across households because of differences in the gender and age
composition of children. We control for gender and age differences using a third order polynomial in
child's gender and age and all of their interactions. We also control for seasonal variation in rice prices by
including season indicators. X is the vector of age, gender, and season controls. Second, we control for
economy-wide time differences in the probability a child works with a year indicator T that is one if the
survey year is 1997/98 (1992/93 is the omitted year). Third, (1) also includes commune fixed effects λ .
Communes vary in the availability of schooling, labor market conditions, land and resource endowments,
and integration into the Vietnamese economy. These commune characteristics might also affect the
relative price of rice and bias any estimate of the relationship between child labor and rice prices. To the
16 The correlation between rice prices and the probability of child labor is also negative when we consider the 1993 and 1998 cross section separately. 17Alternatively, we could use a probit model. Neither the flavor of our results nor our elasticity estimates are heavily influenced by our choice of assumption about the regression error distribution. 18 The findings in this paper are not sensitive to the choice of including prices (or land area below) in logs or levels.

13
extent these commune characteristics are time-invariant, we can control for them using commune fixed
effects (we consider time-varying commune characteristics in the next section). Finally, in all regressions
in this paper, the standard errors are corrected for heteroskedasticity and clustering at the commune
(psu)/survey round level.
Table 3 provides the basic results. Column 1 presents estimates of 1β and 2α from (1). We find
a positive and significant association between increases in rice prices and declines in child labor. A 30
percent increase in price of rice is associated with a 10 percentage point decline in child labor. Of course,
households vary in their exposure to rice prices increases. Households that produce rice may capture
additional income from rice price increases, but rice consumers have to pay more for the rice they
consume. Households that do not produce rice directly from their own land but work in rice production
related activities or in communities that produce or process rice may also benefit from rice price
increases. Thus, we divide households into three groups: rural households (A), households in urban areas
that do not participate in agriculture (U), and households in smaller towns that have some agriculture or
related activities (M). We allow the relationship between rice prices and child labor to vary across these
areas by interacting an indicator for the area where a child lives with rice prices. Thus, for a child j in
commune i at time t, we modify (1) and estimate the following:
1 2 3 1 2* *ijt it it i it i jt t i ijty RP RP U RP M X Tβ β β α α λ ε= + + + + + + .
1β is the change in the probability a child works for a 1 percentage point change in rice prices in rural
areas, 2β is the extra increment in the probability a child works in non-agricultural urban areas ( 1β + 2β
is the total effect), and 3β is the extra increment for mixed areas ( 1β + 3β is the total effect). Column 2 of
table 3 presents estimates of 1β , 2β , 3β , and 2α for the entire sample. In rural areas, higher rice prices
are associated with declines in child labor. In mixed areas, we observe a slightly smaller (albeit not
statistically different) decline in child labor with rice price increases than in rural areas. However, rice
price increases are associated with more child labor in urban areas that cannot take advantage directly of
14
these rice price increases. A 30% increase in rice prices is associated with almost 5 point increase in child
labor for urban households.
Since the three areas differ in the impact of rice price changes on child labor, it makes sense to
stratify our subsequent analysis by the area type. However, the urban and mixed community sample sizes
are too small to be considered separately, and most of the community level data that we use subsequently
are not available in urban areas. Moreover, in the present context, the ambiguity in the relationship
between globalization and child labor discussed in section 2 is concentrated in rural households that must
weigh increased household income against increased earnings opportunities for children and adults and
the negative income effect (through consumption) of price increases. Hence, in the remainder of this
paper, we restrict our attention to children that reside in rural households. In column 3 of table 3, we re-
estimate (1) for the rural sample. A 30 percent increase in rice prices is associated with a 9 percentage
point decline in the probability that a child works. Given that rural areas experience a 20 point drop in the
probability that a child works between 1993 and 1998, rice price increases can account for 45% of the
decline in child labor in rural areas.
So far, we have focused on how rice price increases affect the probability that an individual child
works. At the same time, households might also transition between states of having child labor to a state
without child labor. We examine how these transitions are related to rice price increases in household
level regressions. Column 4 considers whether all children in the household work. Increases in rice price
reduce the probability that all children in a household work. A 30 percent increase in the price of rice
reduces the probability that all children in a household work by 11 percentage points. In column 5, we
consider whether no children in the household work. The results suggest that a 30 percent increase in the
price of rice is associated with an 12 point increase in probability that no children within a household
work. In sum, rice price increases are not only associated with declines in probability that a child works,
but also in declines in probability that all children in a household work, and increases in probability that
no children in a household work.
4.2 Rice Prices, Child Labor, and Other Time-Varying Factors

15
The results in section 4.1 suggest that increased rice prices are associated with less child labor.
The concern obviously arises whether we can interpret this positive correlation as a causal effect of rice
price changes on child labor. The positive relationship could simply reflect unobserved, time-varying,
commune-specific shocks that affect both rice prices and child labor but have nothing to do with the link
between the two. In this section, we consider several time-varying factors that may yield such a spurious
correlation.
Let us first clarify the nature of the time-varying factors that concern us. Differential changes in
the price of rice across communes might be driven by supply or demand shocks to local rice markets. If
there is a causal effect of rice prices on child labor, these supply and demand shocks will be associated
with a change in child labor. This is the type of variation that we wish to exploit. For example, some
communities improve their roads between 1993 and 1998. Setting aside the concern that these road
improvements may be financed by additional rice income, improved roads facilitate a community’s
integration into rice markets and thereby increase rice prices. We wish to capture the effect of these
increased prices on child labor. However, we do not want our measure of the effect of rice prices on child
labor to reflect the effect of improved roads on child labor that have nothing to do with the rice price
increases. The latter is the spurious correlation that we are concerned about.
We expect four general sources of a spurious correlation between rice prices and child labor.
First, within communities, there may be heterogeneity in households that is correlated with both rice price
increases and child labor. Since we identify the effect of rice prices on child labor with community*time
variation in rice prices, we do not believe that this household heterogeneity generates bias. Nonetheless,
we re-estimate (1) with household rather than commune fixed effects. The relationship between rice
prices and child labor is identified by averaging within household variation in child labor across
16
communes with variation in commune changes in real rice prices. The results are reported in column 1 of
table 4 and suggest that the inclusion of household fixed effects does not alter the results substantively.19
Second, section 3 shows that rice price increases vary across regions in Vietnam. Likewise,
regions differ in both the types and scope of the reforms experienced in Vietnam in the 1990s. Further,
regions may be segmented somewhat so that it is difficult for labor to move easily between them. Hence,
changes in the returns to schooling may vary across regions.20 These unobserved, region-specific, time-
varying shocks could potentially bias the link between child labor and rice prices. As a result, we allow
for region-specific time-varying unobserved factors in (1) by including the interactions of each region
indicator with a year indicator.21 The results are reported in columns 2 (commune fixed effects) and 3
(household fixed effects) of table 4. Controlling for regional variation in how child labor declines
through time, does not alter our estimates of the relationship between rice prices and child labor in
statistically significant way.
Third, rice price increases vary with a community’s accessibility. More accessible communities
might experience larger rice price changes, because they are more integrated into regional and
international markets. Likewise, children in more accessible communities might have better access to
schools or employment opportunities. In the VLSS, we can measure accessibility by an indicator for
whether regular transportation is available to a commune and an indicator for whether the road to a
commune is paved.22 We interact these accessibility measures with year indicators to allow for a different
change in child labor in accessible communities. Estimates of (1) with additional controls that allow
trends in child labor to vary with accessibility or regions conditional on rice price changes are reported in
columns 4 (commune fixed effects) and 5 (household fixed effect). Note that heterogeneity in rice price 19 The 9,545 child-year observations in the rural sample are drawn from 4,630 household-year observations. With household fixed effects we identify off of the 1,675 rural households that have children between the ages of 6 and 15 in both rounds of the panel. These households have on average 2.24 children between ages 6-15 in each round. 20 Foster and Rosenzweig (1996) find changes in the return to education to be a primary determinant of changes in educational enrollment in Green Revolution India. Glewwe and Jacoby (2001) rule out differential changes in the return to education as an explanation for increases in school enrollment in Vietnam. Instead, they find that increases in household income drive Vietnam's increases in secondary school enrollment. 21 There are between 4 to 35 sampled communes per region (the mean and median are both 25 communes per region). 22 Data on accessibility (and infrastructure in general) is only available in the 1998 survey.

17
changes within regions or across accessible communities still allows us to identify an effect of rice prices
on child labor. If there is spurious correlation between rice price changes and child labor associated with
accessibility or regional differences, we should observe a significant change in our estimates of the effect
of rice prices on child labor. However, our commune fixed effects estimates of the relationship between
child labor and rice prices are virtually identical to what we found without controlling for regional or
accessibility differences (compare column 4 of table 4 to column 3 of table 3).
A fourth likely source of omitted heterogeneity that may drive our relationship between child
labor and rice prices may be infrastructure improvements. Van de Walle (1998) finds that public
infrastructure (and in particular, irrigation) improvements could dramatically improve living standards in
Vietnam. The 1998 community survey asks whether the commune has experienced any infrastructure
improvements since the 1993 survey. An infrastructure improvement is defined as improvements in
roads, irrigation, health facilities, electricity, schools, and "other" public infrastructure.23 In table 5, we
allow communities to experience differences in child labor through time with infrastructure
improvements. We do this by including an interaction of whether the community experiences an
infrastructure improvement between 1993 and 1998 with the year effect. In column 1, our infrastructure
measure is an indicator that is 1 if the community experiences any type of infrastructure improvement. In
the remaining columns, we consider each of the infrastructure improvement separately. With every
infrastructure control, our estimates of the relationship between child labor and rice prices are well within
a 95% confidence interval of our estimate in column 3 of table 3.
Of course, a conceptual problem arises in interpreting these infrastructure changes, because
during the 1990s, the government of Vietnam had little revenue for large-scale infrastructure
improvements. Hence, these community improvements may stem from within community demand; in
that manner, additional rice income could cause improvements in infrastructure. This is particularly
likely with schooling. Vietnam entered the 1990s with high primary school enrolment rates (86%), and
23 The 1998 questionnaire asks whether there have been improvements in any of the listed types of infrastructure. It does not distinguish between new infrastructure and physical or quality improvements in existing infrastructure.
18
nearly universal access to primary schooling. The government made primary school free and compulsory
in 1991 by the introduction of the Law on the Universalization of Education, but subsequent to this, there
were no major government initiated school construction or improvement projects between 1993 and 1998
(Nga, forthcoming, surveys the education sector in Vietnam in the 1990s). However, increases in
community income (through rice price increases, for example) may lead to private demand for
educational improvements. Using the 1993 VLSS, Behrman and Knowles (1999) show that educational
expenditure in Vietnam is highly income elastic. Glewwe and Jacoby (2001) consider school attendance
in the VLSS panel. They observe large increases in (especially secondary) school enrollments, and they
find a strong association between increases in household income and school attendance. Hence, the
school infrastructure improvements that we observe in the data may stem in part from rice price driven
improvements in household income.
Overall, we do not find any evidence in table 4 to suggest that spurious correlation drives the
relationship between rice prices and child labor. Nevertheless, one could still argue that idiosyncratic
shocks to either rice prices or child labor and associated with both, that have nothing to do with
infrastructure, regional heterogeneity, or commune accessibility could drive the link between prices and
child labor. If rice price levels in 1993 are independent of declines in child labor other than through the
association between rice price levels in 1993 and the increase in rice prices between 1993 and 1998, we
can approach the idiosyncratic shocks problem in an instrumental variables setting. Consider the
following commune-level first-difference regression framework for commune i:
(2) * .i i icy p uα η∆ = + ∆ +
cy∆ denotes the decline in fraction of children working in a commune between 1998 and 1993 and
p∆ denotes the change in rice price in a commune between 1998 and 1993.24 u represents the
specification error that might include an omitted variable that drives changes in prices and changes in
child labor in a commune. If this source of bias is idiosyncratic in the sense that it is independent of the 24 This regression is equivalent to the commune fixed effects regressions in equation (1) without the child specific controls.
19
level of rice prices in 1993, we can instrument for changes in commune prices in (2) with the level of rice
prices in 1993 using two-stage least squares (2SLS).
For the price level in 1993 to be a valid instrument, it must be correlated with changes in rice
prices in rural communes. Figure 4 pictures the relationship between increases in rice prices between
1998 and 1993 and the 1993 price level. The depicted regression line is the result of a nonparametric
regression of the decline in rice prices against the rice price level in 1993.25 Figure 4 illustrates a strong
correlation between changes in prices and the 1993 level. As we would expect from our discussion of
rice prices in section 3, price increases are the largest in areas with the lowest prices in 1993. This is also
confirmed in the first stage of the 2SLS, where changes in rice prices are regressed on 1993 price levels
and a constant. The coefficient on 1993 rice price level is -.87 with a t-statistic of -8.3, and the rice price
levels in 1993 account for 45 percent of the variation in rice price changes across communes.
Table 6 contains the estimates of equation (2). The dependent variable is a decline in child labor,
so a positive coefficient on the change in rice price implies a decline in child labor. Column 1 is the
linear regression on the data pictured in figure 3. It reports the results without instrumenting for changes
in prices, and we find a positive relationship between rice price increases and declines in child labor.
Columns 2-7 report 2SLS results, and our estimates of the positive relationship between increases in rice
prices and declines in child labor increase rather disappear. The coefficient in column 2 suggests that the
average increase in the price of rice in rural areas (.765) would reduce child labor by 15 points. Given
that the coefficient is imprecisely estimated, this estimate is not very different from the estimates in
section 4.1. The relationship is also robust to inclusion (in first and second stages) of region indicators
(column 3), commune accessibility (column 4), and accounting for improvements in schooling (column
5), any infrastructure (column 6), or inclusion of indicators for all infrastructure improvements
individually (column 7). Hence, idiosyncratic shocks (unrelated to the local rice market characteristics
25We use local linear regression procedure with Gaussian kernel and the bandwidth of .45 chosen by visual inspection.

20
captured by the 1993 rice price) do not appear to be behind the relationship between child labor declines
and rice price increases.
In sum, our results suggest a negative relationship between product price increases and child
labor in rural areas. We find little evidence that our results are driven by likely sources of spurious
correlation between child labor declines and rice price increases or idiosyncratic shocks. The estimates
are economically significant: a 10 percent increase in the relative price of rice is associated with a 3
percentage point decline in the probability that a child works. Given that the price of rice increased on
average by almost 30 percent during our sample, our estimates suggest that this price hike leads to almost
9 percentage point decline in the probability that the child works. Thus, increases in rice prices explain
45 percent of the 20 percentage point decline in child labor that rural areas of Vietnam experienced
between 1993 and 1998. Greater integration into international markets, at least in this case, is associated
with less child labor.
5. Understanding the Link Between Rice Price Increases and Declines in Child Labor
5.1 Rice Prices, Land Holdings, and Child Labor
In this section we further explore the mechanism through which rice prices affect child labor. As
we discussed in section 2 and saw in section 4.1, because households differ in their consumption and
production of rice, the impact of increases in product prices will vary across households. For example,
while 70% of households produce rice, only 35% sell rice in 1993, and 7% of households never buy or
sell rice (authors' calculations from the VLSS). Accounting for household landholdings provides one way
to capture household heterogeneity in exposure to any costs or benefits of rice price increases.26 Land is
an important input into rice production, and households with greater production capacity should benefit
more from rice price increases. Most rural households own agricultural land, but 16% of the rural
children in our sample live in households that do not own any agricultural land. In our analysis, we treat
26 We have considered two other measures of a household's exposure to rice price changes: net rice production and the benefit – expenditure ratio (Deaton 1989, Benjamin and Deaton 1993, Minot and Goletti 1998). As with landholdings, we find that child labor reductions are largest in households that theoretically should benefit most from increases in rice prices. We choose to present the landholdings results, because we feel that the assumptions necessary for identification are weaker with landholdings.
21
land holdings in 1993 as an endowment, and this is obviously a strong assumption. However, land
markets in Vietnam had yet to develop by 1993, and in general, commune officials had allocated land to
households for long-term contracts (Ravallion and van de Walle 2001). In this section, we assume that
the reduction in child labor experienced by a household between 1993 and 1998 does not effect land
allocation in 1993, and we consider how the 1993 land holdings co-vary with the amount by which the
household reduces its child labor in reaction to rice price increases.
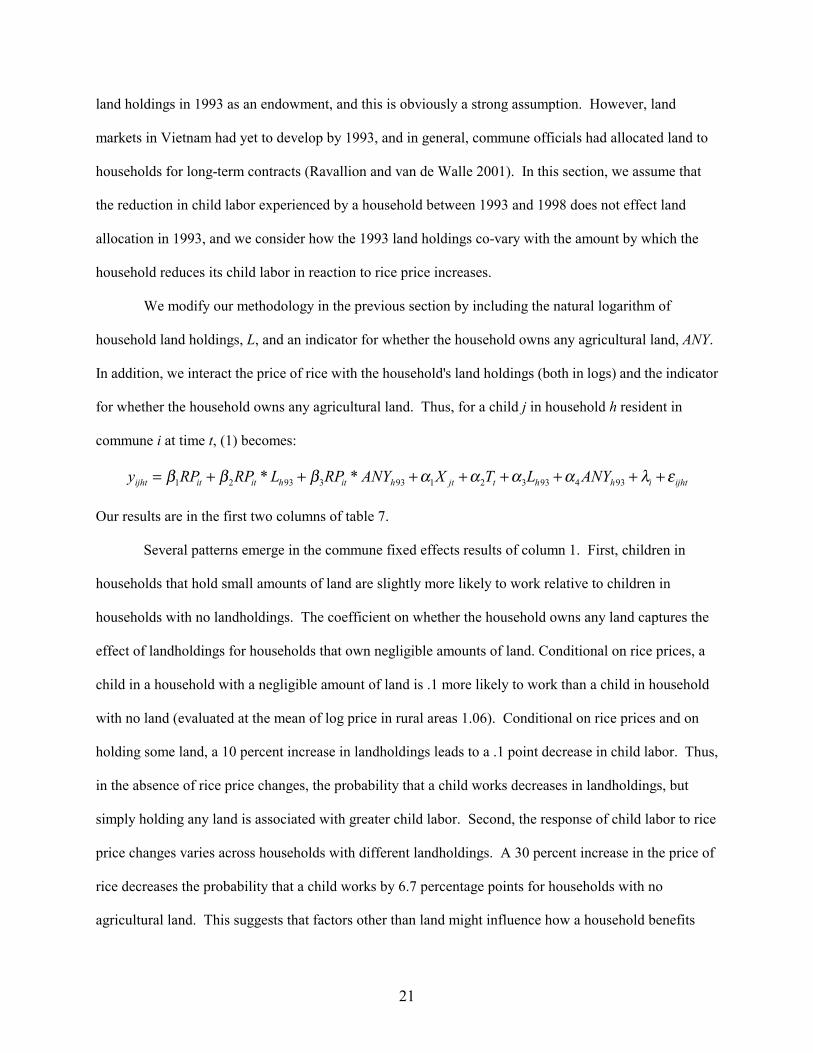
We modify our methodology in the previous section by including the natural logarithm of
household land holdings, L, and an indicator for whether the household owns any agricultural land, ANY.
In addition, we interact the price of rice with the household's land holdings (both in logs) and the indicator
for whether the household owns any agricultural land. Thus, for a child j in household h resident in
commune i at time t, (1) becomes:
1 2 93 3 93 1 2 3 93 4 93* *ijht it it h it h jt t h h i ijhty RP RP L RP ANY X T L ANYβ β β α α α α λ ε= + + + + + + + +
Our results are in the first two columns of table 7.
Several patterns emerge in the commune fixed effects results of column 1. First, children in
households that hold small amounts of land are slightly more likely to work relative to children in
households with no landholdings. The coefficient on whether the household owns any land captures the
effect of landholdings for households that own negligible amounts of land. Conditional on rice prices, a
child in a household with a negligible amount of land is .1 more likely to work than a child in household
with no land (evaluated at the mean of log price in rural areas 1.06). Conditional on rice prices and on
holding some land, a 10 percent increase in landholdings leads to a .1 point decrease in child labor. Thus,
in the absence of rice price changes, the probability that a child works decreases in landholdings, but
simply holding any land is associated with greater child labor. Second, the response of child labor to rice
price changes varies across households with different landholdings. A 30 percent increase in the price of
rice decreases the probability that a child works by 6.7 percentage points for households with no
agricultural land. This suggests that factors other than land might influence how a household benefits
22
from rice price increases. In the next section, we find that part of the effect of the rice prices on child
labor appears to be related to increases in local wages. Small agricultural landholders appear to benefit
the least from rice price increases. A 30 percent increase in rice prices is associated with a 19 percentage
point increase in child labor in households with negligible amount of agricultural land. Children in
households that hold larger quantities of land are the main beneficiaries of the rice prices increase.
Agricultural households above the 13th percentile in landholdings experience a larger reduction in child
labor than households with no landholdings.27 At the mean land holdings, a 30 percent increase in rice
prices is associated with a 9.5 percentage point decline in child labor for households that hold agricultural
land. Thus, higher rice prices seem particularly beneficial for large landholders, and conditioning on land
holdings produces results that are consistent with the rice price elasticity of child labor found in the
previous section.28
Inclusion of household fixed effects (column 2), does not alter our results for households with
greater landholdings.29 For households with the mean landholdings, the change in child labor associated
with respect to a change in rice prices is well within the range of estimates reported in the previous
section (table 3). Our estimate of the landholdings necessary for a landed household to observe a greater
decline in child labor with an increase in rice prices than a non-landholding household declines from the 27 The median and mean log landholding in 1993 for a rural household that holds land are both 8.24 (Ravallion and van de Walle 2001 document the relative equity in the distribution of land after 1988 in Vietnam). The 13th percentile is 7.44. The 3rd percentile (below) is 6.21 and the 2nd is 5.74. 28 In section 4.2, we have shown that community-specific time varying unobserved shocks are unlikely driving our results. The results on the landholdings in this section are based on within commune variation and they further confirm this claim. The omitted variables would need to be correlated with prices, and would need to vary by commune, time, and the level of landholdings within the commune. One possibility would be that communes experience commune-specific improvements in the returns to education (that are correlated with price changes) and that credit constraints are less severe for landholders, so that child labor declines by more in households with more landholdings because they now send kids to school. However, this is unlikely to be the case. First, the existing evidence on the returns to education in Vietnam does not find support for the existence of substantive commune-level variation in changes in the return to education (Glewwe and Jacoby 2001, Nga forthcoming). Second, we expect that variation in the returns to education (if they exist) should be more important at the regional level than the commune level, because regions are more segmented than are communes within regions. However, controlling for unobservable, time-varying regional factors did not alter our estimates of how rice prices relate to child labor in section 4.2. 29 Because we allow the effect of rice prices to depend on landholdings from 1993 (we do not want to identify off changes in landholdings as a result of rice price increases), we cannot include both the level of land holdings and the household fixed effect. Also, if we restrict our sample to only households that have landholdings, we obtain virtually identical results (as one would expect: with the inclusion of the 'own any land' dummy variable in the table 4 regressions, we identify the interaction of landholdings and rice prices only on households that have landholdings).

23
13th percentile in column 1 of table 4 to the 3rd percentile of landholdings in column 2. This slight
difference is not statistically significant, but may reflect the fact that smaller landholders are generally
poorer and perhaps less likely to move children in and out of work with rice price changes. This might
introduce an upward bias on the coefficient on the indicator for whether a household owns any land. The
household fixed effect controls for this type of variation and thereby makes it more likely to observe
declines in child labor associated with price increases in even smaller landholders. The most substantive
change related to household fixed effects, is that we cannot reject the hypothesis that rice price increases
only reduce child labor in landholding households with greater than the 3rd percentile of land. At first
glance, this result seems inconsistent with the results from within community variation in column 1.
However, rural households without land often work for wages. In the next section, we find that wage
increases, while associated with rice price increases, are strongly correlated with the year effect (e.g.
wages increases are less variable across communities than are rice price increases). Hence, conditioning
on the household fixed effect captures the difference between households with and without agricultural
land, the interaction of landholding with rice prices describes how child labor varies across landholders,
and the year effect absorbs the decline in child labor in wage households.30
In columns 1 and 2 of table 7, most of the heterogeneity in the relationship between rice price
increases and child labor appears to be associated with landholdings. One possible source of bias in our
findings is that between 1993 and 1998 some communities in the VLSS redistribute land. Ravallion and
van de Walle (2001) describe Vietnam's massive land reform in 1988. It was complete by 1993, but
several communes in the VLSS report additional redistribution between 1993 and 1998. If this land
reform affects the allocation of child time in a manner associated with household landholdings before
redistribution and is likewise associated with rice price increases, our results in columns 1 and 2 may
confound the impact of redistribution with that of rice prices. Hence, we bifurcate our sample into
children in communities that redistribute land between 1993 and 1998 and children in communities that
30 This implies that, without the year effect, we should observe a negative correlation between rice prices and child labor even for households that do not own agricultural land. In supplementary regressions, we have found this.

24
do not. In the remaining columns of table 7, we reproduce the main findings of this paper for children in
rural communities that did not redistribute land between 1993 and 1998. Our findings in columns 3-7 of
table 7 are generally consistent with our results for the full rural sample. Estimates of the magnitude of
the reduction in child labor associated with rice price increases are slightly larger (compare column 3 with
column 3 of table 3), but they are well within a statistical confidence band of the full sample results.
Likewise, the variation in the relationship between child labor and rice prices associated with
landholdings is of a similar magnitude in the full sample (columns 1 and 2) and the non-reforming sub-
sample (columns 5 and 6).
The previous section found a robust negative relationship between rice price increases after the
market integration and the incidence of child labor. The evidence in this section suggests that these
average effects vary across households principally based on household landholdings. Rice price increases
reduce child labor especially in households with larger landholdings. A 30 percent increase in the price of
rice reduces child labor for the mean (median) landholding household by approximately 9 percentage
points. This is the same average effect we obtain in the previous section when we do not condition on
landholdings. Thus, differences in landholdings seem to account for most of the variation in the effect of
rice prices on child labor across households. The results for households with negligible landholdings or
no landholdings are mixed. Some of these results suggest that rice prices might affect household time
allocations through channels other than land.
5.2 Rice Price, Local Labor Markets, and Child Labor
Because rice is the primary agricultural commodity in Vietnam, increases in the price of rice
should raise both adult and child wages by raising the value of labor's marginal product. Conditional on
endowments of labor, land, and technology, an increase in the price of rice raises the value of labor's
marginal product and, in competitive labor markets, increases wages in agriculture. As we discussed in
section 2, this raises the opportunity cost of not working and could increase child labor. Some
specifications in the previous section suggest that increases in rice prices are associated with declines in
25
child labor even in households that do not produce rice. In this section, we consider the relationship
between changes in wages, changes in rice prices, and child labor.
We expect the price of rice to drive wage changes so we explore how the inclusion of wage
variables as controls affects the sensitivity of child labor to rice prices. These results are in table 8. First,
conditional on commune fixed effects (column 1), child labor is positively correlated with child wages.
Thus, higher wages are associated with more child labor (as one would expect). Likewise, without
controlling for child wages (column 2), higher adult wages are associated with more child labor (albeit
not in a statistically significant way). This is consistent with the theoretical literature on child labor where
children are substitutes for adult labor (Basu 1999).
Second, the adult wage elasticity of child labor in column 2 is substantially lower than that of
child wages in column 1. Thus, while adult wages and child wages are positively correlated, adult wages
might have an additional impact on child labor that is associated with a reduction in child labor. This is
confirmed in column 3. Conditional on rice prices and child wages, higher adult wages are negatively
correlated (although not in a statistically significant way) with child labor. Higher child wages are
positively correlated with child labor conditional on adult wages and rice price increases. Hence, to the
extent that rice prices increase child wages, this increases child labor. However, the overall effect of rice
price increases is to decrease child labor. Household fixed effects regression (column 4) yields similar
results as within commune regression in column 3.
Part of the reason that the correlations between changes in wages and child labor are statistically
insignificant is that the year effect absorbs much of the year-to-year variation in wages. When we do not
condition on the year indicator, we observe a significant negative effect of adult wages on child labor
(column 5). A 10 percent increase in adult wages is associated with a 1.5 point decline in child labor.
Exclusion of the year indicator radically inflates the association between rice price changes and child
labor. Consequently, while adult wage increases seem to lead to less child labor, this is not the dominant
effect. The evidence of the previous section suggests that increased income to rice producers is the
dominant mechanism driving the effect of rice prices on child labor. In order to check the robustness of

26
this finding, we include the wage controls in the regressions with landholdings from the previous section
(column 6). The results are basically the same as in column 2 of table 7 in previous section.
Hence, conditional on adult and child wages, most of the variation in how rice prices relate to child labor
appears to be associated with differences in landholdings.
However, even conditional on wages, we still observe a negative association between child work
and rice prices, albeit a statistically insignificant one. In section 4.2, we found that controlling for
infrastructure improvements such as school improvements did not substantively affect our estimated rice
price elasticity of child labor. However, school improvements, to the extent that they are associated with
rice price increases and child labor, may be an important explanation for the relationship between rice
price increases and child labor declines in households that do not hold any land after controlling for
wages and allowing the effect of rice prices to vary across landholdings. In column 7, we include an
indicator for whether the community reports any improvements in schools (construction or other physical
improvements) between the two rounds of the VLSS interacted with the year effect. The most substantive
impact of conditioning on schooling improvements is to further attenuate the coefficient on rice prices for
households that do not own land once we condition on wage increases. The coefficient drops from -.04 to
.00.
In sum, we find some suggestive evidence that increases in child wages encourage child labor
(given rice price changes and adult wages) and higher adult wages (given child wages and rice prices)
lower child labor. Even conditional on wage changes, there is still a negative association between rice
price increases and child labor in household that do not hold land. These households appear to be
benefiting primarily through school improvements. Overall, the extra return captured by landholders
appears to be the primary mechanism through which rice price changes relate to child labor.
5.3 Age, Gender, Rice Prices, and Child Labor

27
The economic activities of children might vary with a child's age and gender.31 These gender and
age differences may be purely economic: a child age 6 is a less capable worker in most activities than is a
child age 15; a female may have comparative advantage in certain types of activities. In addition, gender-
typing of economic and household activities may contribute to different age/gender distributions of the
activities of children. If boys and girls perform different activities, they may be differentially affected
by changes in rice prices. In this section, we explore age and gender differences in the relationship
between rice prices and child labor and consider how rice prices are associated with changes in various
components of our definition of child labor.
Table 9 documents participation rates by gender and age group in various economic activities in
1993 and 1998. We split children into 3 age groups: 6-11, 12-13,14-15.32 Column 1 presents the fraction
of children reporting ever attending school. Column 2 indicates school attendance at the time of the
household survey for children who report having ever attended school (children who report that they are
on summer break from school are coded as currently attending). Column 3 is the measure of child labor
used throughout this study. Columns 4-8 are the components of child labor described in the context of
table 2. Column 9 documents the number of hours spent by a child in home production conditional on
engaging in home production.
Table 9 reveals four important gender and age differences in child labor. First, girls work more
than boys, and the gap between genders in child labor participation rates increases with age. In 1993, the
participation rates in child labor for primary school age girls are 6.3 points higher than they are for boys.
The difference is 8.6 points for ages 14-15. Second, most of the gender differences in work occur in time
spent in home production (especially in more than 7 hours of home production). Third, in tandem with
the increasing child labor participation rates, school attendance is declining in age, and the gap in
31 See Edmonds and Turk (2001) for a full account of gender and age differences in the economic activities of children in Vietnam. 32Children ages 6-11 in Vietnam normally attend primary school. Ages 12-13 are a natural transition period in Vietnam. Children who began schooling late are still in primary school. Students that have completed primary school either end their schooling or begin lower secondary education. By ages 14-15, students that attend school are enrolled in secondary school, while many others work.
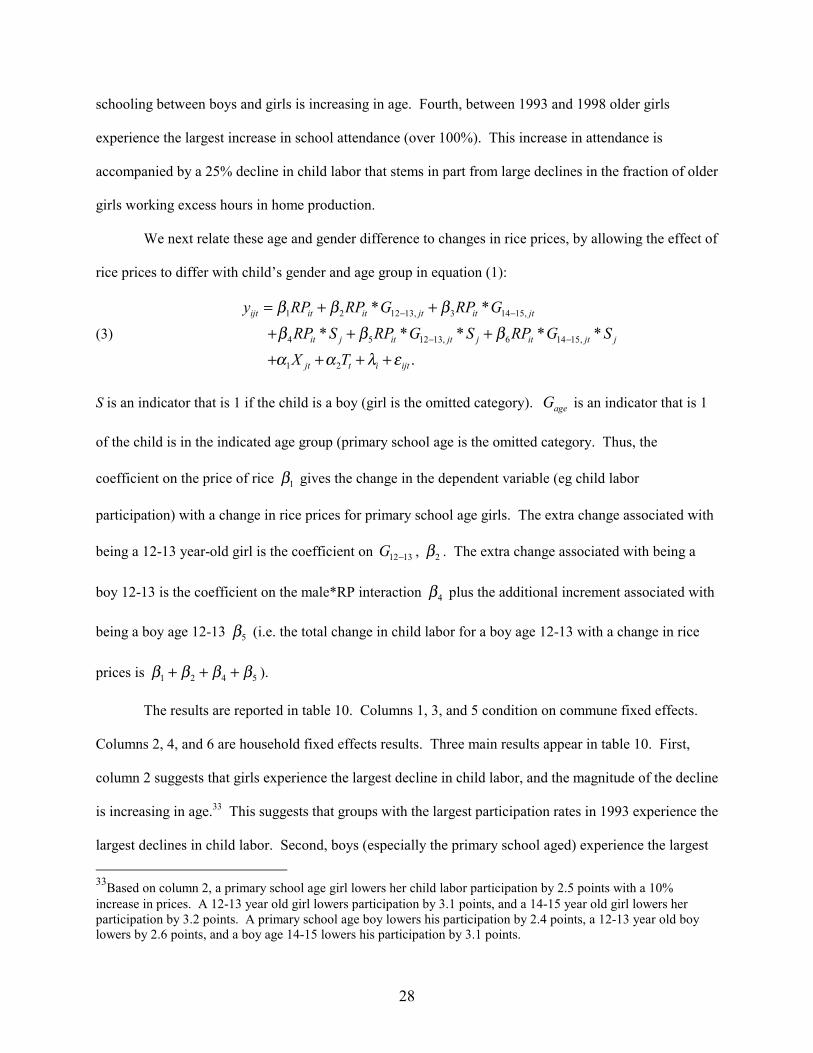
28
schooling between boys and girls is increasing in age. Fourth, between 1993 and 1998 older girls
experience the largest increase in school attendance (over 100%). This increase in attendance is
accompanied by a 25% decline in child labor that stems in part from large declines in the fraction of older
girls working excess hours in home production.
We next relate these age and gender difference to changes in rice prices, by allowing the effect of
rice prices to differ with child’s gender and age group in equation (1):
(3) 1 2 12 13, 3 14 15,
4 5 12 13, 6 14 15,
1 2
* ** * * * *
.
ijt it it jt it jt
it j it jt j it jt j
jt t i ijt
y RP RP G RP GRP S RP G S RP G SX T
β β ββ β βα α λ ε
− −
− −
= + +
+ + +
+ + + +
S is an indicator that is 1 if the child is a boy (girl is the omitted category). ageG is an indicator that is 1
of the child is in the indicated age group (primary school age is the omitted category. Thus, the
coefficient on the price of rice 1β gives the change in the dependent variable (eg child labor
participation) with a change in rice prices for primary school age girls. The extra change associated with
being a 12-13 year-old girl is the coefficient on 12 13G − , 2β . The extra change associated with being a
boy 12-13 is the coefficient on the male*RP interaction 4β plus the additional increment associated with
being a boy age 12-13 5β (i.e. the total change in child labor for a boy age 12-13 with a change in rice
prices is 1 2 4 5β β β β+ + + ).
The results are reported in table 10. Columns 1, 3, and 5 condition on commune fixed effects.
Columns 2, 4, and 6 are household fixed effects results. Three main results appear in table 10. First,
column 2 suggests that girls experience the largest decline in child labor, and the magnitude of the decline
is increasing in age.33 This suggests that groups with the largest participation rates in 1993 experience the
largest declines in child labor. Second, boys (especially the primary school aged) experience the largest 33Based on column 2, a primary school age girl lowers her child labor participation by 2.5 points with a 10% increase in prices. A 12-13 year old girl lowers participation by 3.1 points, and a 14-15 year old girl lowers her participation by 3.2 points. A primary school age boy lowers his participation by 2.4 points, a 12-13 year old boy lowers by 2.6 points, and a boy age 14-15 lowers his participation by 3.1 points.
29
increase in having ever attended school with rice price increases (columns 3 and 4). This is consistent
with a recent improvement in living standards. Of course, current school attendance provides a much
better measure of schooling. The third main result apparent in columns 5 and 6 of table 8 is that
conditional on having ever attended school, girls and the oldest boys experience the largest increases in
attendance with rice price increases (both groups had the lowest attendance rates in 1993). The increase
in school enrollment for girls associated with rice prices is increasing in age. Based on column 6, a 30
percent increase in rice prices raises the probability that a girl ages 12-13 attends school by 3.3 points and
by 7.5 points for girls ages 14-15. Boys experience smaller increases in schooling with rice prices and
actually declines in schooling for ages 6-13. Boys aged 14-15 appear to increase schooling by 3.5 points
with a 30 percent change in rice prices. Overall, rice price increases are associated with the largest
declines in child labor for the age and gender groups that have the highest participation rates. These
declines in child labor are accompanied with the largest increases in schooling for these same groups.
Our results have so far focused on the overall measure of child labor. The question also arises
how rice prices affect different components of this variable. We estimate equation (3) with participation
in the individual components of child labor as the dependent variable. Table 11 presents the results (we
report only household fixed effects results). Three main results appear. First, young boys and girls
experience an increase in agricultural work, while older girls and boys experience declines in agricultural
work. Second, rice price increases do not affect child participation in home production, but are associated
with declines in excessive time spent (more than 7 hours a week) in home production. This decline is
larger for girls than for boys, and the decline increases with age for girls. Third, the overall changes in
hours spent in home production are not small. A 30% increase in rice prices is associated with a 34%
decline in hours worked in home production for primary school age girls and a 38% decline for girls ages
14-15.
Declines in child time devoted to household production raises the question whether households
substitute away from home production or if adult household members spend more time in household
production with rice price increases. Increases in rice prices might lead to a decline in home production if

30
additional income allows households to buy market substitutes for goods or services previously produced
in the household. Parents increase their time spent in home production if the additional income associated
with rice prices encourages them to cut back their formal labor supply or if rice prices somehow increases
the return to home production (although the latter is hard to imagine). Thus, we consider whether rice
price increases are associated with an overall decline in household time spent in home production and
whether rice price increases are associated with changes in the total fraction of hours in home production
performed by children. These results are in table 12.
The first three columns consider the logarithm of total hours spent in household work as a
dependent variable.34 Column 1 includes commune fixed effects, column 2 includes household fixed
effects, and column three includes household fixed effects, landholding interactions, wages, and school
improvement information. Two main results appear in the first three columns of table 12. First, rice price
increases are associated with declines in total hours spent in household production by the household. This
decline exceeds the drop in hours spent in household work by children. This suggests that adults also
spend less time doing household work. Of course, differences in the time required to perform a given
household task across household members make it difficult to interpret these results. For example, the
decline in hours worked in home production may still exceed the decline in hours worked by children if
parents take over tasks previously performed by children (such as wood or water collection). Second, the
decline in home production associated with rice price increases is increasing in landholdings. Households
above the 2nd percentile in landholdings experience a net decline in home production with rice price
increases. At the mean landholdings, a 30% increase in rice prices is associated with an 18% decline in
total household time devoted to home production.
Despite the overall decline in home production, the fraction of household production time
performed by children also declines. This is evident in columns 4-6 of table 12. Focusing on column 6
with household fixed effects, landholdings, wages, and school improvements, we find that increases in
rice prices are not associated with any change in the mix between child time and adult time in home 34 All but three households report more than 1 hour a week in household production.

31
production for households with no landholdings. However, the fraction of home production time
attributable to children decreases in landholdings with rice price increases for households above the 13th
percentile in landholdings (i.e. households with small landholdings experience an increase in the fraction
of home production time performed by children). Thus, children in households with larger landholdings
appear to reduce their hours disproportionately more than adults. Hence, adults with relatively large
landholdings are bearing a larger share of the home production burden as rice prices increase. We cannot
identify whether adults take over tasks previously performed by children (perhaps as a result of a decline
in other types of work with the additional income captured by landholdings) or if adults use additional
income from land to buy market substitutes for the goods and services previously produced by their
children.
In sum, older girls that were bearing most of the work burden within households in 1993, appear
to benefit the most from rice price increases. Our results suggest a large reallocation of older girls out of
work, accompanied by large increases in their school attendance. Much of their decline in child labor
occurs through reductions in home production, where parents take over a large share of the home
production time as the agricultural land provides additional income from rice price increases.
6. Conclusions
This paper provides some empirical evidence on the relationship between market integration (or
globalization) and the incidence of child labor in poor, relatively unskilled-labor abundant economies
through exploiting regional and intertemporal variation in the relative price of an agricultural staple. We
find that in the present case, increases in the relative price of rice result in declines in child labor. A thirty
percent rise in the relative price of rice (as experienced in Vietnam) is associated on average with a 9
percentage point decrease in child labor. Thus, rice price increases can account for 45 percent of the
decline in child labor experienced in rural Vietnam between 1993 and 1998 and 47 percent of the overall
decline in Vietnam.35 However, child labor actually somewhat increases in urban areas where households
35 2.2 million less children are working in 1998 than in 1993. Thus, our regression estimates suggest that rice price increases have moved 1 million children out of work.

32
are exposed to rice prices as consumers, but cannot take advantage of rice price increases as producers or
agricultural day laborers.
In considering the mechanisms through which rice prices affect child labor, our results suggest the
households better endowed with land experience larger reductions in child labor when rice prices
increase. We provide some suggestive evidence that the incidence of child labor might also decline in
households who do not own agricultural land, because higher rice prices are associated with higher (adult)
agricultural wages, but additional income to land appears to be the dominant driving force behind the
reductions in child labor that we observe. This additional household income to land benefits secondary
school aged girls the most. Their child labor participation rates decline substantively and a dramatic
increase in school attendance accompanies the decline in child labor for these girls.
This study has several implications for the policy debate on globalization and child labor. First, the
increased earnings opportunities associated with globalization for children working in export-oriented
sectors do not necessarily lead to more child labor. In the present case, households appear to have taken
advantage of higher income after the rice price increase to reduce child labor despite increased earnings
opportunities for children. Second, many globalization opponents and trade policy-makers advocate that
higher income countries employ trade sanctions to force domestic policies in poor countries to eradicate
child labor. These trade measures likely lower the price of the exported good, so our results suggest that
sanctions could instigate more rather than less child labor.36 These results are in line with a model by
Ranjan (2001), where trade measures not only lower the returns to child labor, but also adversely affect
adult income (or how credit constrained households are), and hence increase the incidence of child labor.
Third, the impact on child labor of punitive trade sanctions against a country's exports depends on the
distribution of the resources used in production of the exported good. In the present case, rice production
is so widespread in Vietnam (most household produce rice directly or as hired labor) that the lower prices
36 It is possible, of course, that punitive sanctions may induce countries to adopt reforms that benefit children in the long run. Opponents of globalization often advocate sanctions to induce official bans on child labor. Whether or not these benefit children is an open question. Vietnam was one of the first countries (in the late 1980s) to officially ban all forms of child labor.
33
of the exported good associated with trade sanctions would affect most households. It is possible to
imagine a world where production was so concentrated that the "costs" of any such sanctions were
restricted to a relative minority. Finally, the sign of the effect of international market integration on local
prices is obviously of great importance. Integration lowers prices of import-competing goods and might
have different implications for child labor in households associated with the production of an import-
competing product. However, as in the present case, most child (and adult) labor in poor, relatively
unskilled labor abundant economies occurs in either nontraded sectors or export-oriented sectors.
Integration leads to higher prices in the export sectors. The additional income from these price increases
for Vietnamese households appears to be associated with a substantial reduction in child labor.
References
Baland, J. M. and J. Robinson (2000). “Is Child Labor Inefficient,” Journal of Political Economy 108, 663-79.
Basu, K. (1999). "Child labor: causes, consequences, and cure, with remarks on international labor
standards," Journal of Economic Literature 37, 108-1119. Basu, K. and P. H. Van (1998). “The Economics of Child Labor,” American Economic Review, 88, 412-
427. Behrman, J. R. and J. C. Knowles (1999). "Household Income and Child Schooling in Vietnam." World
Bank Economic Review 13(2), 211-256. Benjamin, D. and L. Brandt (2001). "Agriculture and Income Distribution in Vietnam During the Reform
Period," University of Toronto Mimeo. Benjamin, D. and A. Deaton (1993). "Household Welfare and the Pricing of Cocoa and Coffee in Cote
d'Ivoire: Lessons from the Living Standards Surveys." World Bank Economic Review 7(3), 293-318.
Brown, D. K. (2000). "A Transactions Cost Politics Analysis of International Child Labor Standards," in
Alan V. Deardorff, and Robert M. Stern, eds., Social Dimensions of U.S. Trade Policies. Ann Arbor: U Michigan Press.
Deaton, A. (1989). “Rice Prices and Income Distribution in Thailand: A Non-Parametric Analysis,” The
Economic Journal 99, 1-37. Dixit, A. (2000). Comment on "A Transactions Cost Politics Analysis of International Child Labor
Standards," in Alan V. Deardorff, and Robert M. Stern, eds., Social Dimensions of U.S. Trade Policies. Ann Arbor: U Michigan Press.

34
Dollar, D. (2001). "Reform, Growth, and Poverty in Vietnam." World Bank Mimeo. Dollar, D. and P. Glewwe (1998). "Poverty and Inequality in the Early Reform Period." in Dollar, D., P.
Glewwe, and J. Litvak, eds. Household Welfare and Vietnam's Transition. Washington, D.C.: World Bank.
Dollar, D., and A. Kraay (2001). "Trade, Growth, and Poverty." World Bank Mimeo. Edmonds, E. (2001a). "The Relationship between Child Labor and Household Production: Evidence from
Variation in Sibling Composition." Dartmouth College Mimeo. Edmonds, E. (2001b). "Will Child Labor Decline with Improvements in Living Standards?" Dartmouth
College Mimeo. Edmonds, E. and C. Turk (2001). "Child Labor in Transition in Vietnam." Mimeo. Foster, A. and M. Rosenzweig (1996). "Technical Change and Human-Capital Returns and Investments:
Evidence from the Green Revolution," American Economic Review 86(4), 931-53. Frankel, J. A. and D. Romer (1999). "Does Trade Cause Growth?", American Economic Review 89, 279-
399. Glewwe, P. and H. Jacoby (2001). "Economic Growth and the Demand for Education: Is there a Wealth
Effect?" University of Minnesota Mimeo. Glewwe, P., M. Gragnolati, and H. Zaman (2001). "Who Gained from Vietnam's Boom in the 1990s? An
Analysis of Poverty and Inequality Trends." Policy Research Working Paper 2275, World Bank. Glewwe, P. and P. Nguyen (2000). "Economic Mobility in Vietnam in the 1990s." Mimeo. Goletti, F. and N. Minot (1997). From Famine to Surplus: The transformation of the rice sector in Viet
Nam. Washington, DC: IFPRI. Grootaert, C. and R. Kanbur (1995). "Child Labour: An Economic Perspective," International Labour
Review, 134, 187-203. Hanson, G. and A. Harrison (1999). "Who gains from trade reform? Some ramaining puzzles", Journal
of Development Economics, 59, 53-73. Hanson, G. and M. Slaughter (2001). "Labor market adjustment in open economies: Evidence from U.S.
States", Journal of International Economics, forthcoming. Krueger, A. (1996). "Observations on International Labor Standards and Trade," NBER Working Paper
5632. Ichimura, H. and C. Taber (2000). "Direct Estimation of Policy Effects," NBER Working Paper T0254. ILO/UNICEF Joint Paper (1997). "Strategies for Eliminating Child Labour: Prevention, Removal, and
Rehabilitation." Synthesis Document from the International Conference on Child Labour, Oslo, Norway.
35
ILO (n.d.). Statistical Information and Monitoring Programme on Child Labour (SIMPOC). International Program on the Elimination of Child Labour: Geneva.
Levy, V. (1985). "Cropping Pattern, Mechanization, Child Labor and Fertility Behavior in a Farming
Economy: Rural Egypt," Economic Development and Cultural Change 33, 777-791. Melchior, A. (1996). "Child Labor and Trade Policy," in Bjorne Grimsrud and Arne Melchior, eds.,
Child Labor and International Trade Policy, Paris. Maskus, K. (1997). "Core Labor Standards: Trade Impacts and Implications for International Trade
Policy, " World Bank International Trade Division Mimeo. Martin, W. and K. Maskus (2001). "Core Labor Standards and Competitiveness: Implications for Global
Trade Policy," Review of International Economics 9, 317-328. Minot, N. and F. Goletti (1998). "Export Liberalization and Household Welfare: The Case of Rice in
Vietnam." American Journal of Agricultural Economics 80 (November), 738-149. Nga, Nguyen Nguyet (forthcoming). Vietnam: Trends in the Education Sector. Hanoi: World Bank. Patrinos, H. and G. Psacharopoulos (1997). "Family Size, Schooling, and Child Labor in Peru - An
Empirical Analysis," Journal of Population Economics 10, 387-405. Psacharopoulos, G. (1997). "Child Labor Versus Educational Attainment: Some Evidence from Latin
America," Journal of Population Economics 10, 377-86. Poverty and Human Resources Division of the World Bank (2000). "Vietnam Living Standards Survey,
1997-98: Basic Information." Mimeo. Poverty Working Group (Joint Report of the Government-Donor-NGO Working Group). 1999. Vietnam
Development Report 2000: Attacking Poverty. Ranjan, P. (2001). "Credit constraints and the phenomenon of child labor," Journal of Development
Economics 64, 81-102. Ravallion, M. and D. van de Walle (2001). "Breaking up the Collective Farm: Welfare Outcomes of Viet
Nam's Massive Land Privatization." World Bank, mimeo. Rodrik, D. (1996). "Labor Standards and International Trade: Do They Matter and What do We Do
About Them?" Overseas Development Council, mimeo. Rosenzweig M. and R. Evenson (1977). "Fertility, schooling, and the economic contribution of children
in rural India: An econometric analysis," Econometrica 45, 1065-1079. van de Walle, D. (1998). "Infrastructure and Poverty in Vietnam." in Dollar, D., P. Glewwe, and J.
Litvak, eds. Household Welfare and Vietnam's Transition. Washington, D.C.: World Bank. Wiens, T. B. (1998). "Agriculture and Rural Poverty in Vietnam." in Dollar, D., P. Glewwe, and J.
Litvak, eds. Household Welfare and Vietnam's Transition. Washington, D.C.: World Bank. Winters, A. (2000). "Trade and Poverty: Is There a Connection?" WTO Special Study #5.

36
Figure 1—Commune Rice Prices R
eal R
ice
Pric
e 19
98
Real Rice Price 19932 2.5 3 3.5 4 4.5 5 5.5
2
2.5
3
3.5
4
4.5
5
5.5
Figure 2—Average Commune Rice Prices by Regions
Real R
ice P
rice
1998
Real Rice Price 19932.4 2.8 3.2 3.6 4
2.4
2.8
3.2
3.6
4
RedRiverNE
NW
NCCSCC
CH
SE
Mekong

37
Figure 3 –Price Changes and the Decline in Child Labor D
ecl
ine
in C
hild
La
bo
r
Rice Price Increase-.6 -.3 0 .3 .6 .9 1.2 1.5 1.8 2
-.4
-.2
0
.2
.4
.6
.7
Figure 4 – Changes in Rice Prices and Rice Prices in 1993 for Rural Communities
Incr
ea
se in
Ric
e P
rice
Real Rice Price 19931.6 1.8 2 2.2 2.4 2.6 2.8 3 3.2 3.4 3.6
-.6
-.3
0
.3
.6
.9
1.2
1.5
1.8
2
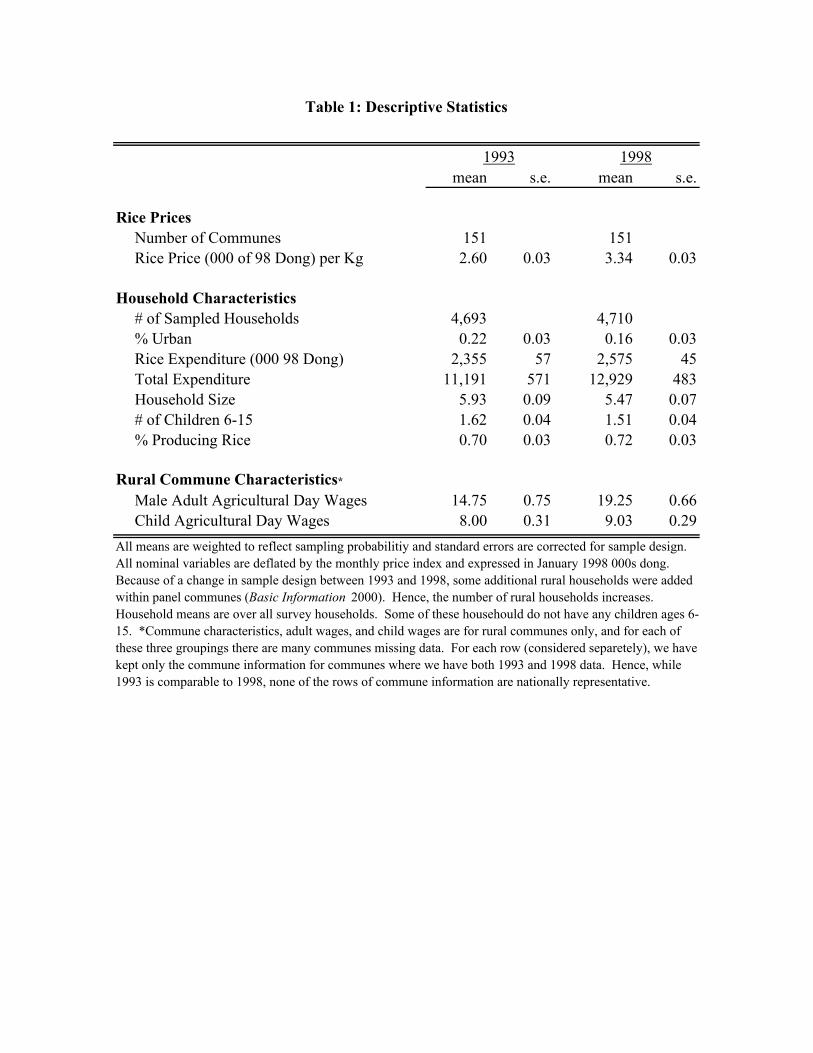
Table 1: Descriptive Statistics
1993 1998mean s.e. mean s.e.
Rice PricesNumber of Communes 151 151Rice Price (000 of 98 Dong) per Kg 2.60 0.03 3.34 0.03
Household Characteristics# of Sampled Households 4,693 4,710% Urban 0.22 0.03 0.16 0.03Rice Expenditure (000 98 Dong) 2,355 57 2,575 45Total Expenditure 11,191 571 12,929 483Household Size 5.93 0.09 5.47 0.07# of Children 6-15 1.62 0.04 1.51 0.04% Producing Rice 0.70 0.03 0.72 0.03
Rural Commune Characteristics*
Male Adult Agricultural Day Wages 14.75 0.75 19.25 0.66Child Agricultural Day Wages 8.00 0.31 9.03 0.29
All means are weighted to reflect sampling probabilitiy and standard errors are corrected for sample design. All nominal variables are deflated by the monthly price index and expressed in January 1998 000s dong. Because of a change in sample design between 1993 and 1998, some additional rural households were added within panel communes (Basic Information 2000). Hence, the number of rural households increases. Household means are over all survey households. Some of these househould do not have any children ages 6-15. *Commune characteristics, adult wages, and child wages are for rural communes only, and for each of these three groupings there are many communes missing data. For each row (considered separetely), we have kept only the commune information for communes where we have both 1993 and 1998 data. Hence, while 1993 is comparable to 1998, none of the rows of commune information are nationally representative.

Tab
le 2
: Chi
ld L
abor
Cha
ract
eris
tics
1993
1998
mea
ns.e
.m
ean
s.e.
Bas
ic C
hild
Cha
ract
eris
tics
Sam
ple
Size
5963
5682
Age
10.4
60.
0410
.75
0.04
Fem
ale
.505
.006
.507
.006
Chi
ld L
abor
(ILO
def
initi
on)
.568
.015
.382
.019
Scho
ol a
ttend
ance
.743
.014
.872
.012
Wor
k an
d no
t atte
nd sc
hool
(ILO
Def
initi
on)
.181
.009
.071
.007
Wor
k C
hara
cter
istic
sO
utsi
de o
f Hou
seho
ld.0
23.0
03.0
14.0
02W
ithin
hou
seho
ld in
Agr
icul
ture
.260
.017
.220
.021
With
in h
ouse
hold
in B
usin
ess
.044
.006
.027
.006
In h
ome
prod
uctio
n.5
17.0
14.5
29.0
18>=
7 ho
urs i
n ho
me
prod
uctio
n.4
34.0
13.3
58.0
20A
ny W
ork
(all
cate
gorie
s).6
16.0
15.5
75.0
18A
ll m
eans
are
wei
ghte
d to
refle
ctin
g sa
mpl
ing
prob
abili
ties.
Sta
ndar
d er
rors
are
cor
rect
ed fo
r sam
ple
desi
gn.
A c
hild
eng
ages
in "
child
labo
r" if
a c
hild
wor
ks a
n ho
ur o
r mor
e pe
r wee
k in
agr
icul
ture
, a h
ouse
hold
bu
sine
ss, o
utsi
de o
f the
hou
seho
ld fo
r pay
or a
s a d
omes
tic se
rvan
t, or
wor
ks 7
or m
ore
hour
s per
wee
k in
ho
useh
old
wor
k or
cho
res.
We
are
mis
sing
info
rmat
ion
on h
ouse
hold
wor
k fo
r 59
child
ren.
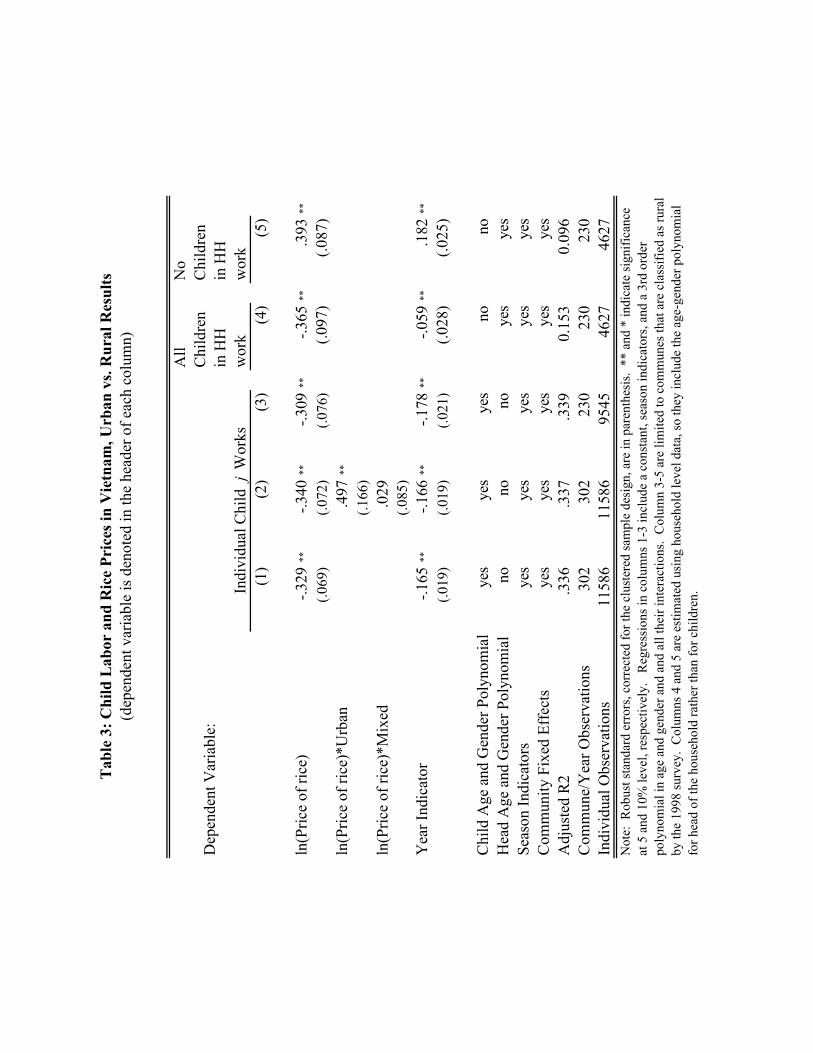
Tab
le 3
: Chi
ld L
abor
and
Ric
e Pr
ices
in V
ietn
am, U
rban
vs.
Rur
al R
esul
ts(d
epen
dent
var
iabl
e is
den
oted
in th
e he
ader
of e
ach
colu
mn)
Dep
ende
nt V
aria
ble:
Indi
vidu
al C
hild
j W
orks
All
Chi
ldre
n in
HH
w
ork
No
Chi
ldre
n in
HH
w
ork
(1)
(2)
(3)
(4)
(5)
ln(P
rice
of ri
ce)
-.329
**-.3
40**
-.309
**-.3
65**
.393
**
(.069
)(.0
72)
(.076
)(.0
97)
(.087
)ln
(Pric
e of
rice
)*U
rban
.497
**
(.166
)ln
(Pric
e of
rice
)*M
ixed
.029
(.085
)Y
ear I
ndic
ator
-.165
**-.1
66**
-.178
**-.0
59**
.182
**
(.019
)(.0
19)
(.021
)(.0
28)
(.025
)
Chi
ld A
ge a
nd G
ende
r Pol
ynom
ial
yes
yes
yes
nono
Hea
d A
ge a
nd G
ende
r Pol
ynom
ial
nono
noye
sye
sSe
ason
Indi
cato
rsye
sye
sye
sye
sye
sC
omm
unity
Fix
ed E
ffec
tsye
sye
sye
sye
sye
sA
djus
ted
R2
.336
.337
.339
0.15
30.
096
Com
mun
e/Y
ear O
bser
vatio
ns30
230
223
023
023
0In
divi
dual
Obs
erva
tions
1158
611
586
9545
4627
4627
Not
e: R
obus
t sta
ndar
d er
rors
, cor
rect
ed fo
r the
clu
ster
ed sa
mpl
e de
sign
, are
in p
aren
thes
is.
** a
nd *
indi
cate
sign
ifica
nce
at 5
and
10%
leve
l, re
spec
tivel
y.
Reg
ress
ions
in c
olum
ns 1
-3 in
clud
e a
cons
tant
, sea
son
indi
cato
rs, a
nd a
3rd
ord
er
poly
nom
ial i
n ag
e an
d ge
nder
and
and
all
thei
r int
erac
tions
. C
olum
n 3-
5 ar
e lim
ited
to c
omm
unes
that
are
cla
ssifi
ed a
s rur
al
by th
e 19
98 su
rvey
. C
olum
ns 4
and
5 a
re e
stim
ated
usi
ng h
ouse
hold
leve
l dat
a, so
they
incl
ude
the
age-
gend
er p
olyn
omia
l fo
r hea
d of
the
hous
ehol
d ra
ther
than
for c
hild
ren.

Tab
le 4
: Chi
ld L
abor
and
Ric
e Pr
ices
with
Tim
e-V
aryi
ng R
egio
n an
d A
cces
sibi
lity
Con
trol
s
(1)
(2)
(3)
(4)
(5)
ln(P
rice
of ri
ce)
-.269
**-.2
91**
-.293
**-.3
10**
-.307
**
(.098
)(.0
83)
(.109
)(.0
91)
(.119
)Y
ear I
ndic
ator
-.260
**-.2
67**
-.318
**-.3
38**
-.365
**
(.027
)(.0
31)
(.041
)(.0
35)
(.048
)
Reg
ion
*Yea
rno
yes
yes
yes
yes
Acc
esib
ility
*Yea
rno
nono
yes
yes
Age
and
Gen
der P
olyn
omia
lye
sye
sye
sye
sye
sSe
ason
Indi
cato
rsye
sye
sye
sye
sye
sC
omm
unity
Fix
ed E
ffec
tsno
yes
noye
sno
Hou
seho
ld F
ixed
Eff
ects
ye
sno
yes
noye
sA
djus
ted
R2
.422
.342
.424
.343
.425
Com
mun
e/Y
ear O
bser
vatio
ns23
023
023
023
023
0In
divi
dual
Obs
erva
tions
9545
9545
9545
9545
9545
Not
e: R
obus
t sta
ndar
d er
rors
, cor
rect
ed fo
r the
clu
ster
ed sa
mpl
e de
sign
, are
in p
aren
thes
is.
** a
nd *
in
dica
te si
gnifi
canc
e at
5 a
nd 1
0% le
vel,
resp
ectiv
ely.
Reg
ress
ions
in a
ll co
lum
ns in
clud
e a
cons
tant
, se
ason
indi
cato
rs, a
nd a
3rd
ord
er p
olyn
omia
l in
age
and
gend
er a
nd a
nd a
ll th
eir i
nter
actio
ns.
In c
olum
ns
2-5,
a re
gion
indi
cato
r int
erac
ted
with
a y
ear e
ffec
t is i
nclu
ded
in th
e re
gres
sion
. A
cces
ibili
ty is
mea
sure
d by
whe
ther
regu
lar t
rans
port
is a
vaila
ble
to a
com
mun
e an
d w
heth
er th
e ro
ad to
com
mun
e is
pav
ed.
In
colu
mns
4 a
nd 5
, an
acce
ssib
ility
indi
cato
r int
erac
ted
with
a y
ear e
ffec
t is i
nclu
ded
in th
e re
gres
sion
.

Tab
le 5
: Chi
ld L
abor
, Ric
e Pr
ices
, and
Cha
nges
in In
fras
truc
ture
(dep
ende
nt v
aria
ble
is a
n in
dica
tor w
heth
er c
hild
wor
ks)
(1)
(2)
(3)
(4)
(5)
(6)
(7)
ln(P
rice
of ri
ce)
-.278
**-.3
10**
-.300
**-.3
10**
-.277
**-.3
08**
-.309
**
(.082
)(.0
76)
(.077
)(.0
77)
(.077
)(.0
75)
(.076
)Y
ear I
ndic
ator
-.132
**-.1
81**
-.170
**-.1
80**
-.161
**-.1
61**
-.183
**
(.044
)(.0
24)
(.021
)(.0
23)
(.024
)(.0
22)
(.021
)
Infr
astru
ctur
e Im
prov
emen
t:
Age
and
Gen
der P
olyn
omia
lye
sye
sye
sye
sye
sye
sye
sSe
ason
Indi
cato
rsye
sye
sye
sye
sye
sye
sye
sC
omm
unity
Fix
ed E
ffec
tsye
sye
sye
sye
sye
sye
sye
sA
djus
ted
R2
.339
.339
.339
.339
.339
.339
.340
Com
mun
e/Y
ear O
bser
vatio
n23
023
023
023
023
023
023
0In
divi
dual
Obs
erva
tions
9545
9545
9545
9545
9545
9545
9545
All
regr
essi
ons a
llow
for d
iffer
ent t
ime
trend
s in
com
mun
ities
with
the
indi
cate
d ty
pe o
f inf
rast
ruct
ure
impr
ovem
ent (
a in
fras
truct
ure
impr
ovem
ent *
yea
r ind
icat
or is
incl
uded
in e
ach
regr
essi
on).
Reg
ress
ions
in a
ll co
lum
ns in
clud
e a
cons
tant
, sea
son
indi
cato
rs, a
nd a
3rd
or
der p
olyn
omia
l in
age
and
gend
er a
nd a
nd a
ll th
eir i
nter
actio
ns. R
obus
t sta
ndar
d er
rors
, cor
rect
ed fo
r the
clu
ster
ed sa
mpl
e de
sign
, are
in
pare
nthe
sis.
**
and
* in
dica
te si
gnifi
canc
e at
5 a
nd 1
0% le
vel,
resp
ectiv
ely.
Any
Roa
dsEl
ectri
city
Irrig
atio
nSc
hool
sH
ealth
Oth
er
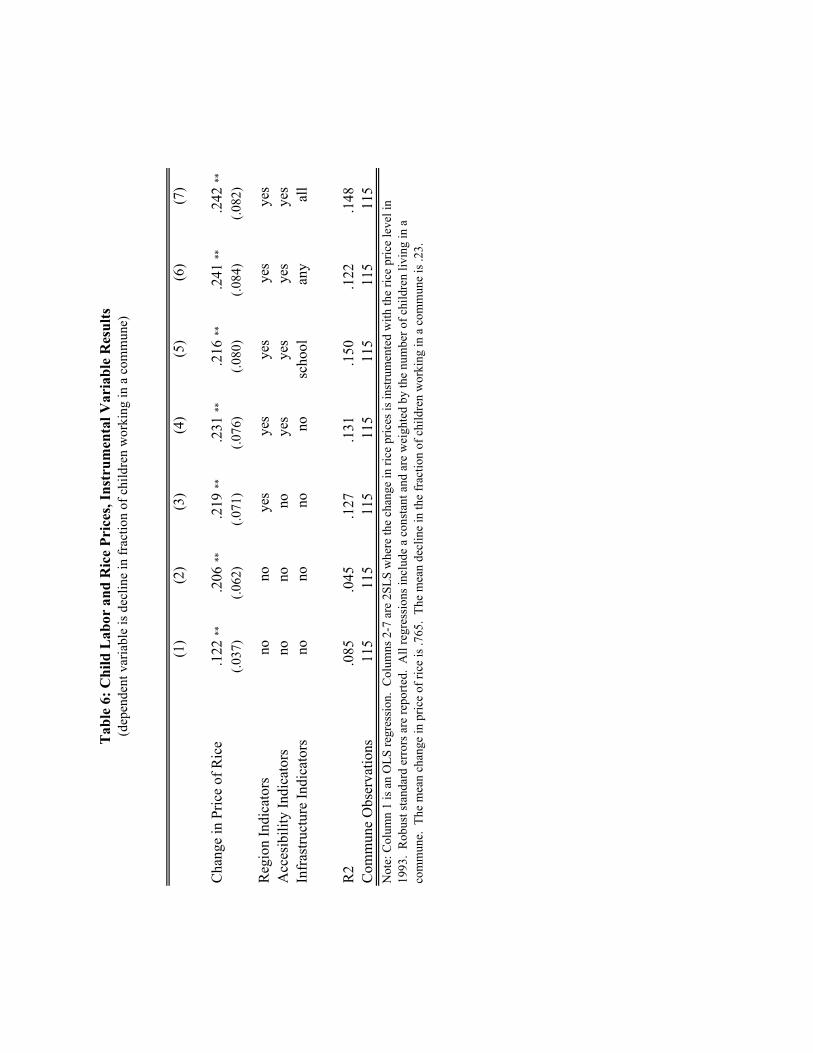
Tab
le 6
: Chi
ld L
abor
and
Ric
e Pr
ices
, Ins
trum
enta
l Var
iabl
e R
esul
ts(d
epen
dent
var
iabl
e is
dec
line
in fr
actio
n of
chi
ldre
n w
orki
ng in
a c
omm
une)
(1)
(2)
(3)
(4)
(5)
(6)
(7)
Cha
nge
in P
rice
of R
ice
.122
**.2
06**
.219
**.2
31**
.216
**.2
41**
.242
**
(.037
)(.0
62)
(.071
)(.0
76)
(.080
)(.0
84)
(.082
)
Reg
ion
Indi
cato
rsno
noye
sye
sye
sye
sye
sA
cces
ibili
ty In
dica
tors
nono
noye
sye
sye
sye
sIn
fras
truct
ure
Indi
cato
rsno
nono
nosc
hool
any
all
R2
.085
.045
.127
.131
.150
.122
.148
Com
mun
e O
bser
vatio
ns11
511
511
511
511
511
511
5N
ote:
Col
umn
1 is
an
OLS
regr
essi
on.
Col
umns
2-7
are
2SL
S w
here
the
chan
ge in
rice
pric
es is
inst
rum
ente
d w
ith th
e ric
e pr
ice
leve
l in
1993
. R
obus
t sta
ndar
d er
rors
are
repo
rted.
All
regr
essi
ons i
nclu
de a
con
stan
t and
are
wei
ghte
d by
the
num
ber o
f chi
ldre
n liv
ing
in a
co
mm
une.
The
mea
n ch
ange
in p
rice
of ri
ce is
.765
. Th
e m
ean
decl
ine
in th
e fr
actio
n of
chi
ldre
n w
orki
ng in
a c
omm
une
is .2
3.

Tab
le 7
: C
hild
labo
r, R
ice
Pric
es, a
nd L
andh
oldi
ngs
(dep
ende
nt v
aria
ble
is a
n in
dica
tor w
heth
er c
hild
wor
ks)
(1)
(2)
(3)
(4)
(5)
(6)
(7)
ln(P
rice
of R
ice)
-.223
**-.0
23-.3
96**
-.401
**-.2
30**
-.071
.360
(.094
)(.1
21)
(.093
)(.1
22)
(.111
)(.1
42)
(.461
)ln
(Pric
e of
Ric
e)*l
n(H
H L
and
Hol
ding
s)-.1
16**
-.122
**-.1
03**
-.104
**-.1
03**
(.033
)(.0
41)
(.038
)(.0
50)
(.050
)ln
(Pric
e of
rice
) * H
olds
Any
Lan
d.8
63**
.731
**.6
47**
.463
(.303
)(.3
74)
(.344
)(.4
43)
ln(H
H L
and
Hol
ding
s).1
08**
.096
**
(.037
)(.0
43)
Ow
n A
ny L
and
-0.8
09**
-.608
(.339
)(.3
80)
Yea
r Ind
icat
or-.1
79**
-.258
**-.1
75**
-.241
**-.1
75**
-.236
**-.2
26**
(.021
)(.0
27)
(.028
)(.0
37)
(.028
)(.0
36)
(.038
)
Age
and
Gen
der P
olyn
omia
lye
sye
sye
sye
sye
sye
sye
sSe
ason
Indi
cato
rsye
sye
sye
sye
sye
sye
sye
sC
omm
unity
Fix
ed E
ffec
tsye
sno
yes
noye
sno
noH
ouse
hold
Fix
ed E
ffec
ts
noye
sno
yes
noye
sye
sA
djus
ted
R2
.341
.424
.343
.429
.345
.432
.428
Com
mun
e/Y
ear O
bser
vatio
ns23
023
015
415
415
415
415
4In
divi
dual
Obs
erva
tions
9545
9545
6318
6318
6318
6318
5219
Not
e: S
ampl
e in
col
umns
3-7
rest
ricte
d to
chi
ldre
n in
com
mun
ities
that
did
not
redi
strib
ute
land
bet
wee
n 19
93 a
nd 1
998.
In
addi
tion,
7 ru
ral
com
mun
es h
ave
been
dro
pped
bec
ause
of m
issi
ng in
form
atio
n on
land
redi
strib
utio
n. I
n co
lum
n 7,
the
sam
ple
is a
dditi
onal
ly re
stric
ted
to c
hild
ren
in h
ouse
hold
s tha
t ow
n ag
ricul
tura
l lan
d. R
obus
t sta
ndar
d er
rors
, cor
rect
ed fo
r the
clu
ster
ed sa
mpl
e de
sign
, are
in p
aren
thes
is. *
* an
d *
indi
cate
si
gnifi
canc
e at
5 a
nd 1
0% le
vel,
resp
ectiv
ely.
Reg
ress
ions
in a
ll co
lum
ns in
clud
e a
cons
tant
, sea
son
indi
cato
rs, a
nd a
3rd
ord
er p
olyn
omia
l in
age
and
gend
er a
nd a
nd a
ll th
eir i
nter
actio
ns.
The
mea
n an
d m
edia
n of
the
loga
rithm
of 1
993
land
hold
ings
for h
ouse
hold
s in
colu
mns
1-2
is 8
.24.
The
m
ean
of th
e lo
garit
hm o
f 199
3 la
ndho
ldin
gs fo
r hou
seho
lds i
n co
lum
ns 3
-7 is
8.3
9 (th
e m
edia
n is
8.2
8).
Rur
al C
omm
unes
with
out L
and
Red
istri
butio
n B
etw
een
1993
and
199
8A
ll R
ural
Com
mun
es

Tab
le 8
: Chi
ld L
abor
, Ric
e Pr
ices
, and
Loc
al L
abor
Mar
kets
(1)
(2)
(3)
(4)
(5)
(6)
(7)
ln(P
rice
of R
ice)
-.292
**-.2
58**
-.800
**-.0
40.0
02(.0
77)
(.100
)(.0
71)
(.120
)(.1
19)
ln(P
rice
of R
ice)
*ln(
HH
Lan
d H
oldi
ngs)
-.123
**-.1
32**
(.041
)(.0
41)
ln(P
rice
of R
ice)
* H
olds
Any
Lan
d.7
62*
.836
**
(.371
)(.3
67)
ln(C
hild
Agr
Day
Wag
es)
.094
**.0
76*
.078
.004
.058
.041
(.038
)(.0
42)
(.057
)(.0
60)
(.057
)(.0
61)
ln(A
dult
Agr
Day
Wag
es)
.042
-.003
-.023
-.150
**-.0
32-.0
41(.0
30)
(.034
)(.0
45)
(.047
)(.0
46)
(.045
)Sc
hool
Impr
ovem
ents
* Y
ear
-.059
*
(.033
)Y
ear
-.283
**-.2
79**
-.199
**-.2
71**
-.259
**-.2
26**
(.016
)(.0
17)
(.027
)(.0
37)
(.037
)(.0
43)
Age
and
Gen
der P
olyn
omia
lye
sye
sye
sye
sye
sye
sye
sSe
ason
Indi
cato
rsye
sye
sye
sye
sye
sye
sye
sC
omm
unity
Fix
ed E
ffec
tsye
sye
sye
sno
nono
noH
ouse
hold
Fix
ed E
ffec
ts
nono
noye
sye
sye
sye
sA
djus
ted
R2
0.33
80.
337
0.33
90.
422
0.40
90.
424
0.42
4C
omm
une/
Yea
r Obs
erva
tions
230
230
230
230
230
230
230
Indi
vidu
al O
bser
vatio
ns95
4595
4595
4595
4595
4595
4595
45
Not
e: R
obus
t sta
ndar
d er
rors
, cor
rect
ed fo
r the
clu
ster
ed sa
mpl
e de
sign
, are
in p
aren
thes
is.
** a
nd *
indi
cate
sign
ifica
nce
at 5
and
10%
leve
l, re
spec
tivel
y.
Sch
ool i
mpr
ovem
ents
is a
n in
dica
tor v
aria
ble
that
is 1
if th
e co
mm
unity
surv
ey re
ports
any
impr
ovem
ents
in sc
hool
ing
infr
astru
ctur
e (th
e m
ean
of
this
var
iabl
e is
.61)
inte
ract
ed w
ith th
e ye
ar in
dica
tor.
Hen
ce it
allo
ws a
diff
eren
t 199
8 m
ean
of c
hild
labo
r in
com
mun
ities
that
hav
e sc
hool
im
prov
emen
ts.

Tabl
e 9:
Par
ticip
atio
n in
Var
ious
Eco
nom
ic A
ctiv
ities
by
Age
, Gen
der,
and
Yea
r
Chi
ld
Labo
rEv
er
Scho
oled
Cur
rent
ly
Atte
ndin
g Sc
hool
Wag
e W
ork
Agr
. In
HH
HH
B
usin
ess
Hom
e Pr
od.
Hom
e Pr
od
(>=7
hrs
)
Hou
rs in
H
ome
Prod
(1)
(2)
(3)
(4)
(5)
(6)
(7)
(8)
(9)
Girl
s 1993
Age
s 6-1
10.
474
0.85
30.
964
0.00
30.
179
0.02
00.
475
0.38
210
.93
Age
s 12-
130.
827
0.93
80.
698
0.03
60.
406
0.07
60.
795
0.69
013
.20
Age
s 14-
150.
936
0.90
00.
305
0.08
40.
628
0.11
10.
894
0.79
912
.78
1998
Age
s 6-1
10.
304
0.94
30.
988
0.00
10.
104
0.00
60.
442
0.30
08.
43A
ges 1
2-13
0.61
50.
959
0.86
40.
013
0.37
60.
043
0.83
70.
600
9.27
Age
s 14-
150.
703
0.94
30.
637
0.05
10.
498
0.06
80.
854
0.65
59.
54B
oys 1993
Age
s 6-1
10.
411
0.83
90.
985
0.00
40.
172
0.01
30.
370
0.29
910
.16
Age
s 12-
130.
757
0.93
20.
814
0.03
30.
429
0.04
50.
620
0.49
610
.01
Age
s 14-
150.
850
0.92
10.
538
0.06
10.
572
0.10
00.
598
0.46
49.
32
1998
Age
s 6-1
10.
217
0.95
40.
990
0.00
00.
125
0.00
80.
339
0.21
07.
42A
ges 1
2-13
0.44
30.
981
0.91
30.
012
0.34
30.
020
0.66
90.
418
7.89
Age
s 14-
150.
521
0.97
00.
763
0.04
40.
453
0.09
40.
697
0.42
57.
36A
ll m
eans
are
wei
ghte
d to
refle
ct sa
mpl
ing
prob
abili
ties.
Sc
hool
ing
parti
cipa
tion
rate
s are
con
ditio
nal o
n ev
er h
avin
g at
tend
ed sc
hool
. H
ours
in h
ome
prod
uctio
n is
con
ditio
nal o
n w
orki
ng in
hom
e pr
oduc
tion.
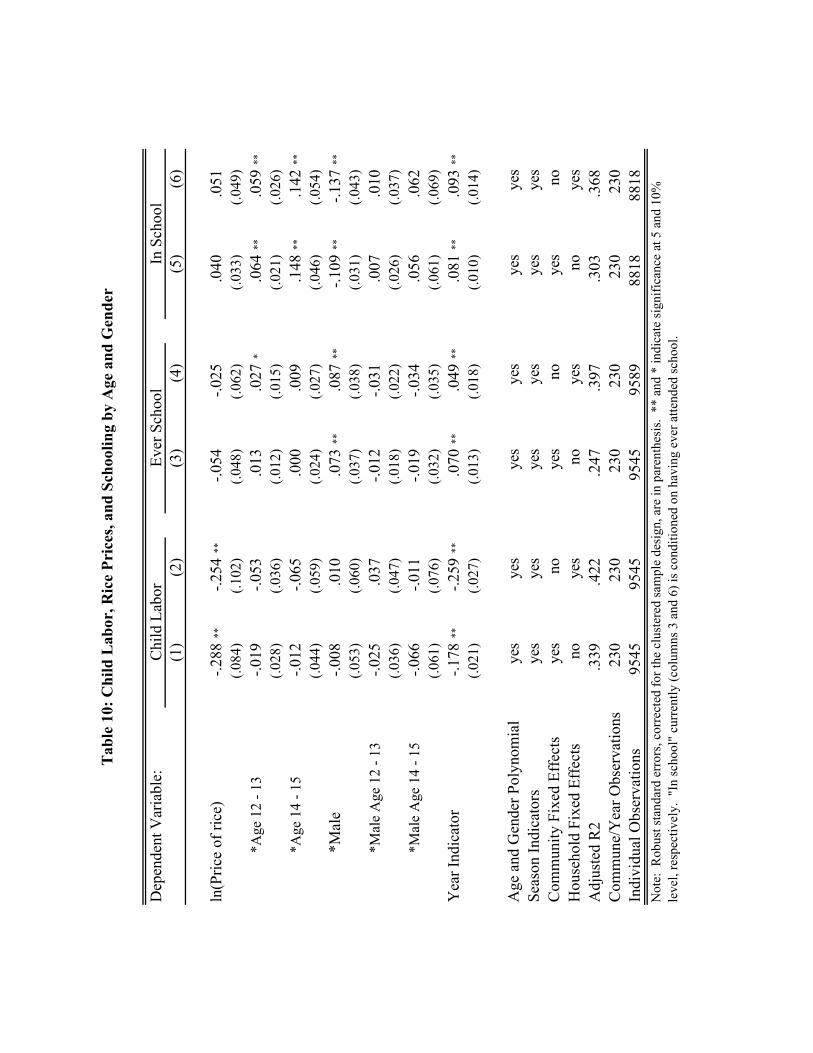
Tab
le 1
0: C
hild
Lab
or, R
ice
Pric
es, a
nd S
choo
ling
by A
ge a
nd G
ende
r
(1)
(2)
(3)
(4)
(5)
(6)
ln(P
rice
of ri
ce)
-.288
**-.2
54**
-.054
-.025
.040
.051
(.084
)(.1
02)
(.048
)(.0
62)
(.033
)(.0
49)
*Age
12
- 13
-.019
-.053
.013
.027
*.0
64**
.059
**
(.028
)(.0
36)
(.012
)(.0
15)
(.021
)(.0
26)
*Age
14
- 15
-.012
-.065
.000
.009
.148
**.1
42**
(.044
)(.0
59)
(.024
)(.0
27)
(.046
)(.0
54)
*Mal
e-.0
08.0
10.0
73**
.087
**-.1
09**
-.137
**
(.053
)(.0
60)
(.037
)(.0
38)
(.031
)(.0
43)
*Mal
e A
ge 1
2 - 1
3-.0
25.0
37-.0
12-.0
31.0
07.0
10(.0
36)
(.047
)(.0
18)
(.022
)(.0
26)
(.037
)*M
ale
Age
14
- 15
-.066
-.011
-.019
-.034
.056
.062
(.061
)(.0
76)
(.032
)(.0
35)
(.061
)(.0
69)
Yea
r Ind
icat
or-.1
78**
-.259
**.0
70**
.049
**.0
81**
.093
**
(.021
)(.0
27)
(.013
)(.0
18)
(.010
)(.0
14)
Age
and
Gen
der P
olyn
omia
lye
sye
sye
sye
sye
sye
sSe
ason
Indi
cato
rsye
sye
sye
sye
sye
sye
sC
omm
unity
Fix
ed E
ffec
tsye
sno
yes
noye
sno
Hou
seho
ld F
ixed
Eff
ects
no
yes
noye
sno
yes
Adj
uste
d R
2.3
39.4
22.2
47.3
97.3
03.3
68C
omm
une/
Yea
r Obs
erva
tions
230
230
230
230
230
230
Indi
vidu
al O
bser
vatio
ns95
4595
4595
4595
8988
1888
18N
ote:
Rob
ust s
tand
ard
erro
rs, c
orre
cted
for t
he c
lust
ered
sam
ple
desi
gn, a
re in
par
enth
esis
. **
and
* in
dica
te si
gnifi
canc
e at
5 a
nd 1
0%
leve
l, re
spec
tivel
y. "
In sc
hool
" cu
rren
tly (c
olum
ns 3
and
6) i
s con
ditio
ned
on h
avin
g ev
er a
ttend
ed sc
hool
.
Dep
ende
nt V
aria
ble:
Ever
Sch
ool
In S
choo
lC
hild
Lab
or

Tab
le 1
1: T
ypes
of E
cono
mic
Act
iviti
es a
nd R
ice
Pric
es b
y A
ge a
nd G
ende
r
(1)
(2)
(3)
(4)
(5)
(6)
Wag
e W
ork
Wor
ks
for H
H in
A
gr
Wor
ks
for H
H in
B
us
Wor
ks in
H
ome
Prod
.
Wor
ks in
H
ome
Prod
(>
=7 h
rs)
Ln(H
ours
in
Hom
e Pr
od)
ln(P
rice
of ri
ce)
.015
.061
-.048
-.016
-.352
**-1
.148
**
(.020
)(.0
90)
(.031
)(.1
15)
(.121
)(.2
70)
*Age
12
- 13
-.011
-.055
*-.0
12-.0
01-.0
58*
.001
(.010
)(.0
34)
(.015
)(.0
36)
(.036
)(.0
72)
*Age
14
- 15
-.025
-.078
-.009
-.035
-.133
**-.1
24(.0
28)
(.063
)(.0
33)
(.061
)(.0
63)
(.124
)*M
ale
.011
.018
.046
*.0
81.1
07*
.078
(.021
)(.0
52)
(.028
)(.0
64)
(.063
)(.1
60)
*Mal
e A
ge 1
2 - 1
3-.0
01.0
07.0
06.0
04.0
92**
.192
**
(.014
)(.0
49)
(.019
)(.0
53)
(.048
)(.0
89)
*Mal
e A
ge 1
4 - 1
5-.0
14-.0
74.0
01.0
48.1
73**
.388
**
(.034
)(.0
84)
(.044
)(.0
91)
(.085
)(.1
59)
Yea
r Ind
icat
or-.0
16**
-.138
**-.0
13*
-.123
**-.1
15**
-.164
*
(.006
)(.0
30)
(.008
)(.0
29)
(.030
)(.0
88)
Age
and
Gen
der P
olyn
omia
lye
sye
sye
sye
sye
sye
sSe
ason
Indi
cato
rsye
sye
sye
sye
sye
sye
sH
ouse
hold
Fix
ed E
ffec
ts
yes
yes
yes
yes
yes
yes
Adj
uste
d R
2.1
74.4
06.1
99.3
58.3
46.3
90C
omm
une/
Yea
r Obs
erva
tions
230
230
230
230
230
230
Indi
vidu
al O
bser
vatio
ns95
8995
8995
8995
4295
4252
62
Rob
ust s
tand
ard
erro
rs, c
orre
cted
for t
he c
lust
ered
sam
ple
desi
gn, a
re in
par
enth
esis
. **
and
* in
dica
te si
gnifi
canc
e at
5 a
nd 1
0% le
vel,
resp
ectiv
ely.
We
are
mis
sing
hou
seho
ld p
rodu
ctio
n in
form
atio
n fo
r 47
child
ren.
In C
olum
n 6,
the
depe
nden
t var
iabl
e is
the
log
of h
ours
wor
ked
in h
ome
prod
uctio
n.
Dep
ende
nt V
aria
ble:
Not
es:
In C
olum
ns 1
-5 th
e de
pend
ent v
aria
ble
is a
n in
dica
tor f
or w
heth
er a
chi
ld w
orks
in th
e in
dica
ted
cate
gory
.

Tabl
e 12
: R
ice
Pric
es a
nd th
e D
ivisi
on o
f Hou
seho
ld W
ork
Hou
seho
ld L
evel
Reg
ress
ion
Dep
ende
nt V
aria
ble:
(1)
(2)
(3)
(4)
(5)
(6)
ln(P
rice
of R
ice)
-.553
**-.6
19**
-.536
**-.1
23**
-.094
-.028
(.136
)(.2
39)
(.300
)(.0
35)
(.060
)(.0
83)
ln(P
rice
of R
ice)
*ln(
HH
Lan
d H
oldi
ngs)
-.235
**-.1
04**
(.083
)(.0
39)
ln(P
rice
of R
ice)
* H
olds
Any
Lan
d1.
887
**.7
98**
(.723
)(.3
38)
ln(C
hild
Agr
Day
Wag
es)
.154
-.042
(.147
)(.0
37)
ln(A
dult
Agr
Day
Wag
es)
-.134
.058
**
(.112
)(.0
28)
Scho
ol Im
prov
emen
ts *
Yea
r-.0
53-.0
10(.0
88)
(.024
)Y
ear
-.142
**-.0
90-.0
53-.0
09-.0
05-.0
13(.0
47)
(.089
)(.0
88)
(.012
)(.0
21)
(.029
)
Hea
d A
ge a
nd G
ende
r Pol
ynom
ial
yes
yes
yes
yes
yes
yes
Seas
on In
dica
tors
yes
yes
yes
yes
yes
yes
Com
mun
ity F
ixed
Eff
ects
yes
nono
yes
nono
Hou
seho
ld F
ixed
Eff
ects
no
yes
yes
noye
sye
sA
djus
ted
R2
0.25
70.
221
0.23
10.
096
0.11
50.
127
Com
mun
e/Y
ear O
bser
vatio
ns23
023
023
023
023
023
0H
ouse
hold
Obs
erva
tions
4622
4622
4622
4622
4622
4622
Not
e: R
obus
t sta
ndar
d er
rors
, cor
rect
ed fo
r the
clu
ster
ed sa
mpl
e de
sign
, are
in p
aren
thes
is.
** a
nd *
indi
cate
sign
ifica
nce
at 5
and
10%
leve
l, re
spec
tivel
y. 5
hou
seho
lds d
o no
t rep
ort a
ny h
ome
prod
uctio
n.M
ean
log
tota
l hou
rs in
hou
seho
ld w
ork
in 1
993:
3.7
6M
ean
log
tota
l hou
rs in
hou
seho
ld w
ork
in 1
998:
3.4
8
Mea
n fr
actio
n of
tota
l hou
rs in
hou
seho
ld w
ork
perf
orm
ed b
y ch
ildre
n in
199
3: .2
66M
ean
frac
tion
of to
tal h
ours
in h
ouse
hold
wor
k pe
rfor
med
by
child
ren
in 1
998:
.238
Frac
tion
of H
ours
of H
ouse
hold
Wor
k Pe
rfor
med
by
Chi
ldre
n 6-
15To
tal H
ours
of H
ouse
hold
Wor
k in
the
Hou
seho
ld


