MARINE ECOLOGY PROGRESS SERIESMar Ecol Prog Ser
Vol. 299: 277–288, 2005 Published September 1
INTRODUCTION
Many coral reef fish use seagrass beds either as anursery habitat or as a feeding or resting habitat (Parrish1989, Baelde 1990, Blaber 2000, Beck et al. 2001). Al-though the utilisation of seagrass beds by reef fish hasbeen extensively studied, fewer studies have focused onthe interlinkages between fish communities of seagrassbeds and coral reefs (Sale 2002). In the present study,these interlinkages are defined as functional processeswhere fish communities between habitats influence each
other, i.e. by direct mechanisms such as migrations ofindividuals or indirect mechanisms such as predation orcompetition. Studies that have described such directinterlinkages have considered only ontogenetic migra-tions (Rooker & Dennis 1991, Appeldoorn et al. 1997,Nagelkerken et al. 2000a,b, Cocheret de la Morinière etal. 2002, Mumby et al. 2004, Nakamura & Sano 2004a) ordaily feeding migrations (Ogden & Buckman 1973,Ogden & Ehrlich 1977, Weinstein & Heck 1979, Baelde1990, Kochzius 1997) as functional processes thatstructure fish communities in the 2 habitats.
© Inter-Research 2005 · www.int-res.com*Email: [email protected]
Distribution of coral reef fishes along acoral reef–seagrass gradient: edge effects
and habitat segregation
Martijn Dorenbosch, Monique G. G. Grol, Ivan Nagelkerken*, Gerard van der Velde
Department of Animal Ecology and Ecophysiology, Institute for Wetland and Water Research, Radboud University Nijmegen,Toernooiveld 1, 6525 ED Nijmegen, The Netherlands
ABSTRACT: Coral reefs and seagrass beds are often located adjacent to one another, but little isknown about the degree to which their fish communities are interlinked. To determine whether coralreef fishes on the coral reef are interlinked with or segregated from fishes on adjacent seagrass beds,a 60 m coral reef–seagrass gradient was studied on the island of Zanzibar in the western IndianOcean. Using underwater visual census, coral reef fishes were surveyed in 4 habitat zones: (1) a coralpatch reef, (2) seagrass beds bordering the coral reef, (3) seagrass beds at a 30 m distance from thecoral reef edge and (4) seagrass beds at a 60 m distance from the coral reef edge. Based on the den-sities of juveniles and adults in the 4 zones, the 48 species that were observed were classified intoreef-associated species, seagrass-associated species, nursery species, generalists and rare species.Reef-associated species occurred almost exclusively on the coral reef and at the reef–seagrass edge,while seagrass-associated species occurred almost exclusively on the seagrass beds. Generalists andseagrass-associated species occurred in all 3 seagrass zones, but densities of generalists on seagrassbeds decreased with increasing distance from the reef, whereas that of seagrass-associated speciesincreased. Reef-associated and generalist species showed an edge effect, where densities on the sea-grass beds near the reef edge were higher than on the seagrass beds further away. Juvenile densitiesof nursery species on seagrass beds also increased with the distance from the reef, whereas theiradults showed the highest densities on the coral reef, suggesting a possible ontogenetic shift from theseagrass beds to the reef. The results of the present study show that this seagrass–coral reef land-scape features habitat segregation between species and life stages and shows an edge effect,possibly driven by competition mechanisms between species or life stages.
KEY WORDS: Coral reef fish · Seagrass beds · Habitat connectivity · Species interaction · Migrations · Edge effect
Resale or republication not permitted without written consent of the publisher
Mar Ecol Prog Ser 299: 277–288, 2005
The few studies that have examined interlinkagesbetween multiple fish species on seagrass beds andcoral reefs were carried out in situations where the 2habitat types were located at some distance (i.e. hun-dreds of metres) from each other. This distance maybe too large to result in species interactions betweenthese habitats, because species associated with 1 habi-tat may only migrate across short distances (metres) toadjacent habitats. No published studies seem to haveinvestigated fish species distribution patterns in acontinuous reef–seagrass gradient.
Where coral reefs and seagrass beds meet, interac-tions between fish communities associated with 1 ofthese habitats are very likely to occur in the edge zone:reef-associated fish may partly migrate into the sea-grass beds, whereas seagrass-associated fish maypartly migrate onto the reef. Although migration ofindividuals can directly influence the structure of fishcommunities in these habitats, interactions betweenspecies such as predation or competition for food andspace may also have a strong effect on the structure ofthese fish communities. Depending on the underlyingmechanisms, the transition of coral reef into seagrassbeds may therefore result in an ‘edge effect’ wherespecies show increases, decreases or no change inabundance (Ries & Sisk 2004). Sweatman & Robertson(1994) and Shulman (1985) showed that predation byreef-associated fish influenced the occurrence of ju-venile grunts and surgeonfishes on seagrass bedsdirectly bordering the reef in a short reef–seagrassgradient. In various coral-dwelling reef fish speciesthat co-exist on a small spatial scale, competitionappears to influence habitat selection (Eagle et al.2001, Munday et al. 2001, Clarke & Tyler 2003, Web-ster 2004). It is therefore possible that the fish commu-nities of the 2 habitats interact with each other at theedge of each habitat, giving rise to an edge effect,which results in habitat segregation, possibly drivenby competition or predation.
In the present study, it was hypothesised that thecomposition of reef fish species on seagrass bedswould change with increasing distance from the coralreef. Species that are mainly reef-associated wereexpected to dominate the fish community on the reefand perhaps also the reef–seagrass edge, whereasseagrass-associated species were expected to domi-nate the entire seagrass bed. On a 60 m coral reef–seagrass gradient, we examined the distribution of var-ious coral reef fish species to answer the followingquestions: (1) do fishes from the coral reef use adjacentseagrass beds as a habitat, (2) do densities of fishspecies on the seagrass bed change with increasingdistance from the reef and (3) how are densities of dif-ferent fish species related to each other along thisgradient?
MATERIALS AND METHODS
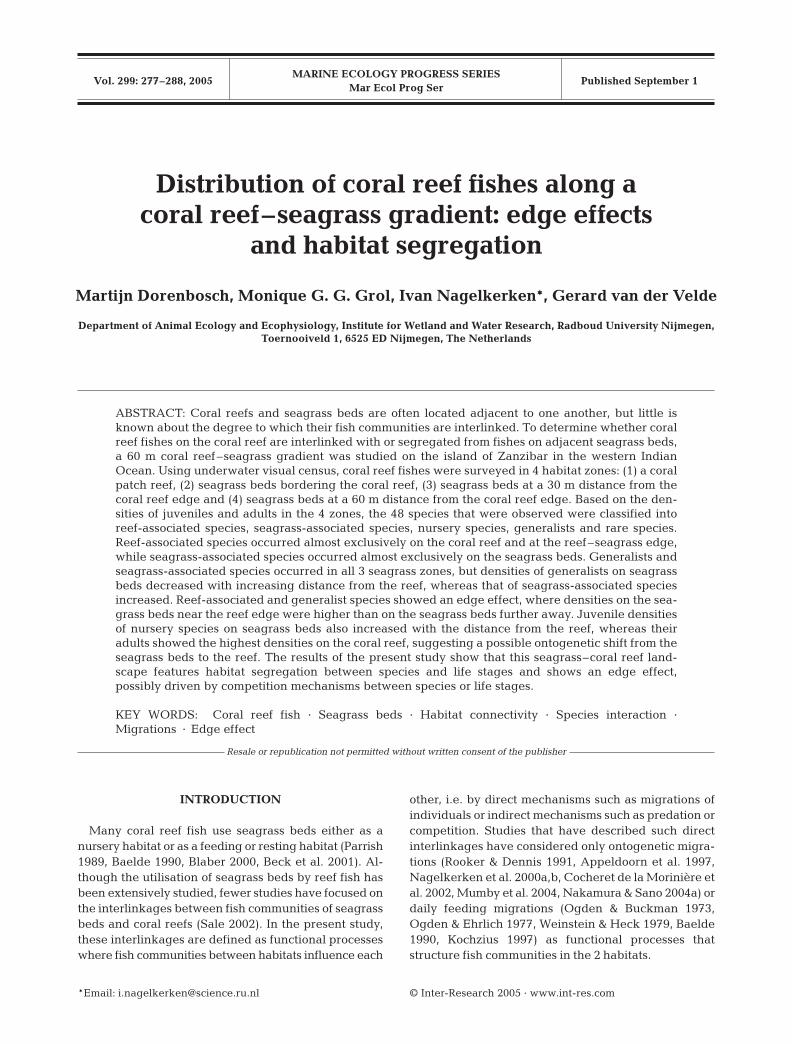
Study area. The present study was done on a contin-uous coral reef–seagrass gradient situated at theentrance of Chwaka Bay, a shallow marine bay on theeast coast of the island of Zanzibar (Tanzania) in thewestern Indian Ocean (Fig. 1). This bay was charac-terised by large areas of mangrove forest, mudflats andseagrass beds. There are no rivers that discharge inthis area. At the entrance of the bay, at an averagedepth of 11 m, 3 patch reefs were present (Fig. 1)which directly bordered uniform monospecific sea-grass beds with a 100% coverage of Thalassodendronciliatum. The width of the seagrass beds variedbetween 80 and 250 m, beyond which there wereseabeds of bare pebbles or sand. The lengths of thepatch reefs varied between 300 and 800 m, with awidth of about 100 m. No halos of reduced seagrasscover (as described for the Caribbean by Ogden et al.1973 and Hay 1984) were present at the reef–seagrass
278
0 10 km 20 kmN
ZanzibarTown
ChwakaBay
Schematic presentation of placement ofquadrats:
13
2
Mozam- bique
Tanzania
Kenya
Somalia
IndianOcean
Africancontinent
N 0 500km
Zanzibar
0 m30 m60 m
60 m
30 m0 m
quadrat
Patch reef
a)
b)
60 m
30 m0 m
Fig. 1. Overview of the study area (geographic location ofZanzibar island: latitude 6º10’S, longitude 39º10’E) and loca-tions of the 3 sampled patch reef–seagrass gradients. Aschematic presentation of the placement of quadrats in eachhabitat zone (coral reef, 0 m seagrass zone, 30 m seagrasszone and 60 m seagrass zone) is shown in (a) overview and(b) cross section. Numbers 1–3 indicate the locations of the
3 sampled patch reefs
Dorenbosch et al.: Coral reef fishes on a reef– seagrass gradient
edges. The 3 patch reefs all had a comparable coralcomplexity (mean coral cover 48.5% ± 25.7; meanmaximum coral height 1.0 m ± 0.4) and were not in-fluenced by other nearby coral reefs (distance to thenearest coral reef was 5.0 km).
Field sampling and study design. To study the distri-bution of coral reef fishes within this reef–seagrassgradient, 4 habitat zones were distinguished: the coralreef and 3 seagrass zones located at increasing dis-tances from the coral reef (0, 30 and 60 m from thecoral reef). A selection of the complete fish communityin each habitat zone was surveyed by means of under-water visual census using SCUBA and a stationarypoint-count method (Watson & Quinn 1997, Polunin &Roberts 2004). Fish species were selected based on ourability to identify them during underwater visual cen-sus, as well as on their commercial value for fisheries(Jiddawi & Stanley 1997). All species belonging to theHaemulidae, Lethrinidae, Lutjanidae, Mullidae, Nemi-pteridae, Scaridae and Siganidae families were in-cluded, as were 2 species of Acanthuridae (Acanthurusleucosternon and Naso unicornis), 2 Chaetodontidaespecies (Chaetodon mellanotus and C. auriga), 3 large-sized Labridae species (Cheilinus trilobatus, C. un-dulatus and Cheilio inermis) and 1 Zanclidae species(Zanclus cornutus).
Because underwater visibility ranged from 6 to 10 m,5 × 5 m quadrats were surveyed. Visual census surveysin the coral reef zone were performed at the centre ofthe patch reef, at a minimum distance of 15 m from theedge of the reef. Within the centre of the patch reef,quadrats were randomly placed with a minimum dis-tance of 20 m between each other. A total of 45quadrats were surveyed, divided over the 3 patchreefs: 20 quadrats on patch reef 1, 14 on reef 2 and 11on reef 3 (for patch reef numbers see Fig. 1). The num-ber of quadrats that was surveyed on each patch reefdepended on the size of the patch reef. To surveyquadrats on the seagrass beds, the distance to the coralreef was determined by placing a 60 m quadrat lineperpendicular to the edge of the coral reef (see Fig. 1for a schematic presentation of placement of quadrats).Visual census surveys were done at 0 – 5 m, 30 – 35 mand 60 – 65 m from the reef (hereafter referred to as the0 m, 30 m and 60 m seagrass zones). Seagrass quadratsbordering the reef started where the reef ended anddid not include any corals. At each side of the 60 mquadrat line, 2 quadrats were surveyed in each ofthe 3 seagrass zones (Fig. 1). The minimum distancebetween 2 quadrats on the seagrass beds was 20 m.After the 3 seagrass zones (i.e. 12 quadrats) had beensurveyed for the first time, the quadrat line was shiftedover a distance of 100 m and the survey was repeatedin a similar way as the first time. This procedure wasdone 2 to 4 times per patch reef, depending on its size.
A total of 34 quadrats were surveyed in the 0 m sea-grass zone (8 along patch reef 1, 10 along reef 2 and 16along reef 3), 34 in the 30 m seagrass zone (12 alongpatch reef 1, 6 along reef 2 and 16 along reef 3) and 32in the 60 m seagrass zone (10 along patch reef 1, 6along reef 2 and 16 along reef 3). The number of sur-veyed quadrats per zone in each patch reef gradientdiffered because sometimes patches of sand or pebblesinterrupted the seagrass beds surrounding the patchreef.
Visual census data were collected by 2 observerswho independently surveyed quadrats that were ran-domly allocated to the observers. On the seagrass bedsall quadrats to the left of the 60 m quadrat line wereallocated to 1 observer and at the same time all of thequadrats to the right were allocated to the otherobserver.
A 5 m rope was used as a reference for quadrat size.After placing the line, the observer waited 3 min tominimise fish disturbance. All target species within orpassing through the quadrat were then counted withina period of 10 min. During the first 7 min, the observerwas situated on the edge of the quadrat, while duringthe last 3 min the observer moved over the quadrat tosearch for small juvenile fish possibly hiding behindcorals or seagrass leaves. Care was taken not to countindividuals or groups of fish that regularly moved inand out the quadrat more than once. When surveyingthe 0 m seagrass zone, extra care was taken to onlycount fishes that were really present within the bor-ders of the seagrass quadrat. Fish were classified into2.5 cm size classes using an underwater slate. Surveyswere conducted between 07:00 and 14:00 h at high orlow tide, when water movement was minimal. Tominimize observer effects, species identification andquantification were first thoroughly practiced simulta-neously by the 2 observers until their results were com-parable. The observers were trained to estimate sizeclasses before the start of the study by repeatedlyestimating the sizes of 50 pieces of electrical wire ofknown length and representing all fish size classes,placed at random underwater. Training was continueduntil differences in size estimation were minimal (i.e.a deviation of no more than ±2.5 cm from the actuallength for objects <20 cm). Visual census data werecollected during 10 d in January 2004. This period fallswithin the middle of the northeast monsoon when rain-fall is limited and water temperatures are high. Salinityand temperature are relatively constant during thistime of the year and little temporal variation in fishassemblages was expected.
Because seagrass habitat complexity can influencefish densities (Sogard et al. 1987, Hyndes et al. 2003),shoot density and seagrass height were measured ineach of the 3 seagrass zones at the locations where the
279
Mar Ecol Prog Ser 299: 277–288, 2005
fish quadrats were surveyed. Mean seagrass heightwas quantified by measuring the length (to the nearestcm) of both the shoot and leaf of 40 seagrass plants ineach seagrass zone that were randomly selected in the3 patch reef–seagrass gradients. Mean shoot density ofeach seagrass zone was estimated by counting thenumber of shoots in 50 × 50 cm quadrats (taking 10replicate measurements per seagrass zone, randomlyplaced in the 3 patch reef–seagrass gradients).
Data analysis. Mean seagrass height and shoot den-sity were compared between the 3 seagrass zonesusing 1-way ANOVA. A non-parametric Spearmanrank correlation was performed to determine the rela-tionship between mean seagrass height and shootdensity on the 3 seagrass zones.
Fish counts of all individual quadrats collected byvisual census in the 3 patch reef–seagrass gradientswere used as replicates. Similarity in fish assemblagestructure between the 4 different habitat zones wascompared using cluster analysis of fish species densi-ties (with all size classes pooled), using the BioDiver-sity Pro computer program (McAleece 1997) on thebasis of Euclidean distances and using group averagelinkage.
Fish were recorded as juveniles when they weresmaller than 1⁄3 of the maximum species length (Nagel-kerken & van der Velde 2002). Maximum lengths ofspecies were obtained from FishBase World Wide Web(Froese & Pauly 2003). Specimens of species with amaximum length >90 cm were recorded as juvenileswhen they were <30 cm. For those species for whichthe maturation size was known, the one-third-of-maximum-length rule was found to be suitable todefine juveniles. This was tested for Chaetodon auriga,Chlorurus sordidus, Lethrinus lentjan, L. nebulosus,Lutjanus fulviflamma, L. lutjanus, Parupeneus macro-nema and Scarus psittacus.
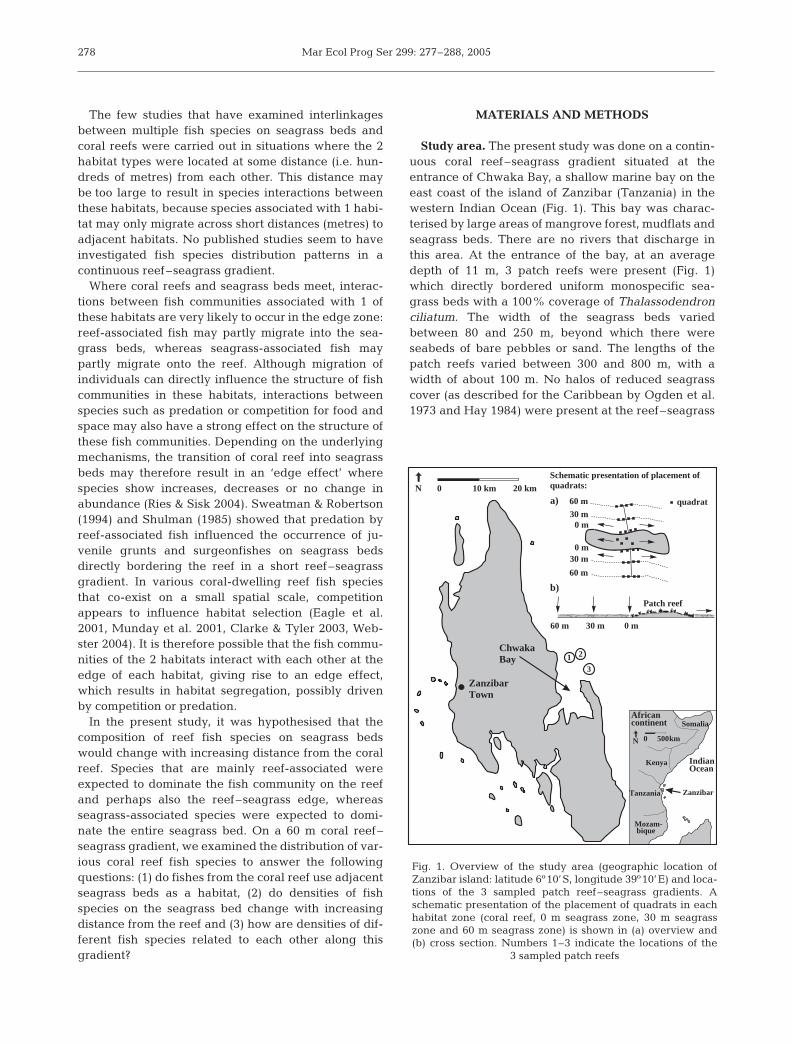
Based on the density distribution of juveniles andadults of the observed fish species along the coralreef–seagrass gradient, species were classified intoseagrass residents, nursery species, reef residents,generalists and rare species (according to criteria listedin Table 1). The term nursery species is used todescribe species that show high juvenile densities onthe seagrass beds and low densities on the coral reef,and of which the adults show the opposite pattern andare mainly concentrated on the reef. In the presentstudy, the term nursery species does not imply thatseagrass beds function as a nursery habitat per se (asdefined in Beck et al. 2001).
The criteria that were used here to classify speciesinto the 5 groups were arbitrarily chosen. To check thisclassification, principal component analyses (PCA) wasperformed on the distribution of juveniles and adults ofthe observed species in the 4 habitat zones (rare
species excluded). The classification of the species intothe 4 groups (according to Table 1) corresponded withclusters of juveniles and adults of species that could bedistinguished using PCA (see Fig. 2). Juveniles andadults of seagrass residents and juveniles of nurseryspecies were concentrated on the seagrass beds, whileadults of nursery species were concentrated on thecoral reef. Adults, generalists and reef residents wereseparated as 2 groups, although their juveniles showedno clear difference. Although density distributions oth-ers than the ones listed in Table 1 are theoretically pos-sible, these did not occur and were thus not used asclassification criteria.
The existence of possible interlinkages between fishcommunities of the 4 habitat zones can be derived fromthe density distributions of species on the gradient(such as the presence of an edge effect on species den-sities or species richness), and from relationships ofdensity patterns between different species groups. Toexamine these possible interlinkages along the gradi-ent, mean fish densities (pooling all size classes perquadrat), mean species richness, and mean total densi-ties of each species group were compared between the4 habitat zones. Differences between mean total fishdensity on the habitat zones were tested using 1-wayANOVA on log(x + 1) transformed data. A Levene’stest showed that variances were homogeneous afterlog-transformation. For mean species richness log-transformation was not needed (as determined withLevene’s test). ANOVA was followed by a Gabriel’spost-hoc test. Mean total fish densities between the 4habitat zones of each species group (adults and juve-niles pooled per quadrat) and mean total fish densitiesof juveniles and adults separately for each speciesgroup were compared using the following procedure:if variances were homogeneous (as determined with aLevene’s test), a 1-way ANOVA was used on log(x + 1)transformed data followed by a Gabriel’s post-hoc
280
Species Juvenile density Adult density group (% of SJD) (% of SAD)
Seagrass residents >70, sg >70, sgNursery species >70, sg >70, reefGeneralists 30 to 70, sg 30 to 70, sgReef residents >70, reef >70, reefRare species Total fish density < 0.25 individuals
100 m–2 (averaged for all quadrats ofall habitat zones)
Table 1. Criteria used to categorise species into 5 differentgroups. JD: mean juvenile density on either the coral reef(based on all coral reef quadrats, reef) or seagrass (based onall seagrass quadrats. sg); SJD: sum of JD on the coral reefand seagrass; AD: mean adult density on either the coral reefor seagrass; SAD: sum of AD on the coral reef and seagrass
Dorenbosch et al.: Coral reef fishes on a reef– seagrass gradient
comparison. If variances were not homogeneous(not even after log-transformation), a Kruskal-Wallistest was used on non-transformed data followed by aDunnett’s T3 post-hoc comparison.
To detect possible interactions between speciesgroups that occurred in high densities on the seagrassbeds, correlations between mean fish densities of gen-eralists and seagrass residents, between generalistsand nursery species and between seagrass residentsand nursery species along the seagrass gradient wereexamined by calculating non-parametric Spearmanrank correlations. A Spearman rank correlation wasalso calculated between mean fish densities of juve-niles and adults of nursery species along the seagrassgradient. All analyses were performed using SPSS ver-sion 11.5. PCA was performed using the Canoco 4.0program (ter Braak & Smilauer 1998). Species densitieswere log(x + 1) transformed, scaling was focussed oninter-species distances, and species scores weredivided by the standard deviation.
RESULTS
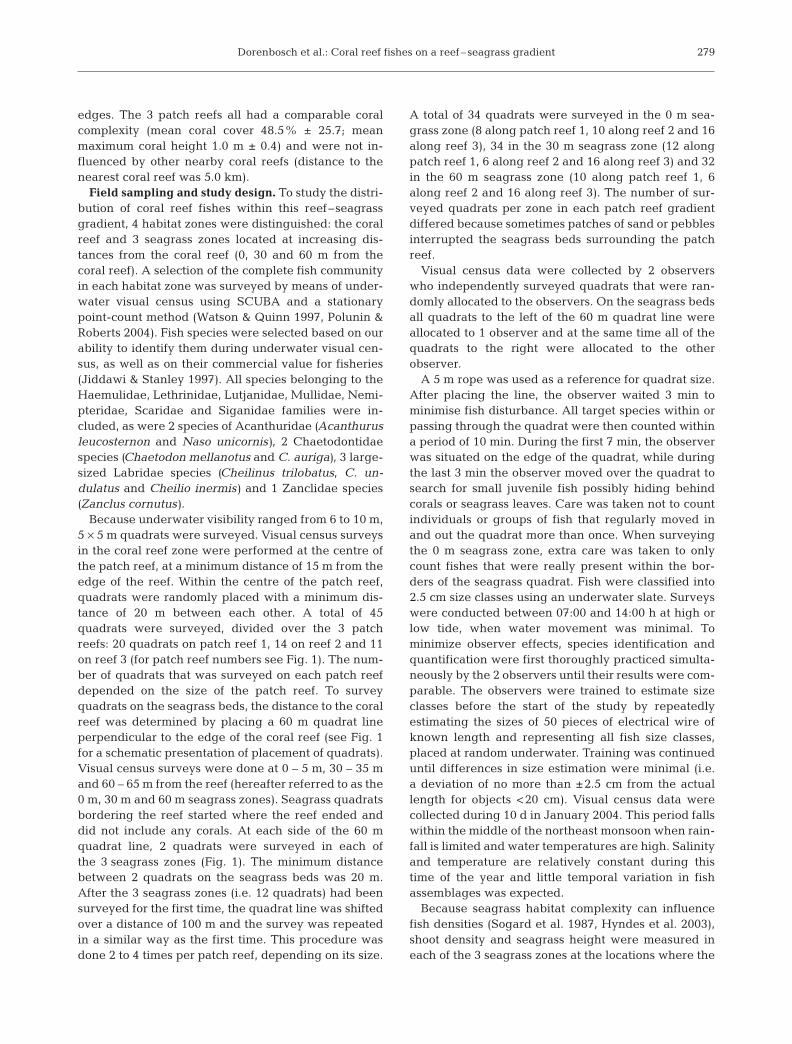
No significant differences in mean seagrass height(F = 1.08; p = 0.36; 1-way ANOVA) or mean shoot den-sity (F = 2.28; p = 0.11; 1-way ANOVA) were foundbetween the 3 seagrass zones (Fig. 3). There was nosignificant correlation between mean seagrass heightand mean shoot density (Spearman rank correlationcoefficient rs < 0.01; p = 1.00).
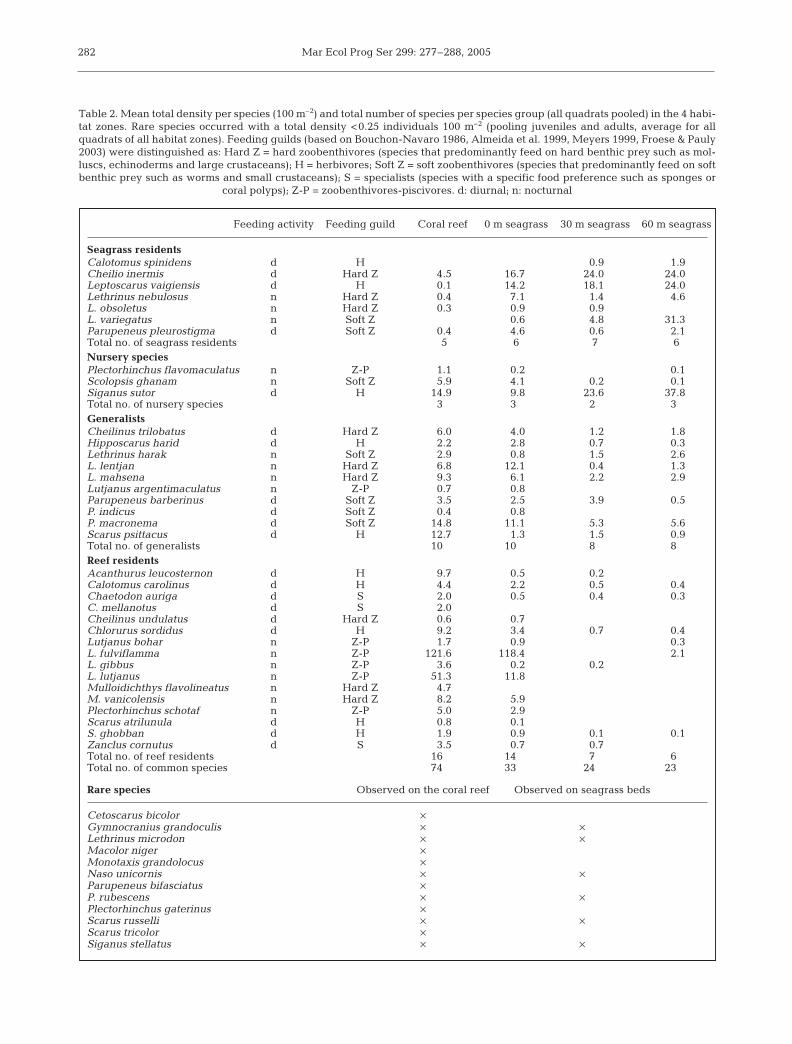
In total, 48 species of the selected fish families wereobserved along the gradient (Table 2). Reef residentswere represented by a greater number of species (n = 16)than generalists (n = 10) and seagrass residents (n = 7).Nursery species had the smallest number of species(n = 3). Twelve species occurred at very low densities.
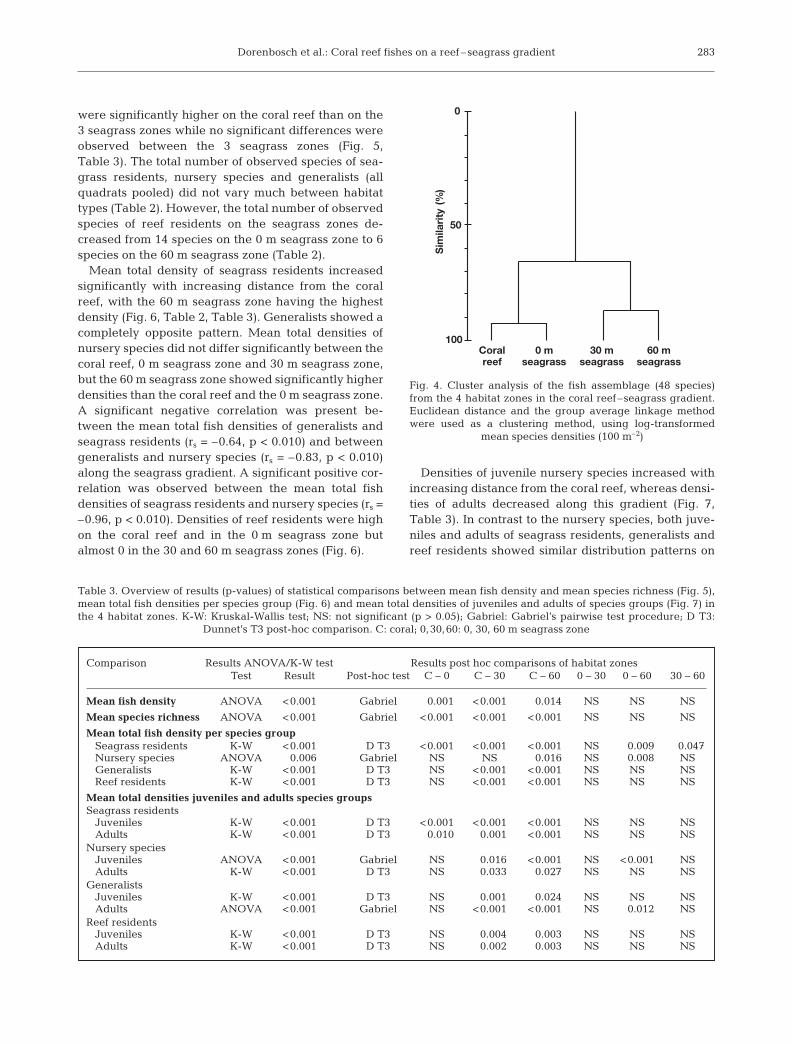
Cluster analysis showed a great similarity betweenthe coral reef and the 0 m seagrass zone, and betweenthe 30 and 60 m seagrass zones (Fig. 4). Both meantotal fish densities and mean total species richness
281
Fig 3. Mean shoot height and seagrass density in the 3 sea-grass zones
Coral
60 m SG
30 m SG
0 m SG
00
GeneralistsNursery speciesReef residentsSeagrass residentsHabitat zones
a) Juveniles 1.0
–1.0
–1.0
1.0
Fig 2. Principal component analysis (PCA) of mean densities of (a) juveniles and (b) adults of the observed species on the 4 habitat zones. Rare species (Tables 1 & 2) are not included. Coral: coral reef zone; SG: seagrass zone
60 m SG
30 m SG
Coral
0 m SG
00
b) Adults
–1.0
–1.0
Mar Ecol Prog Ser 299: 277–288, 2005282
Feeding activity Feeding guild Coral reef 0 m seagrass 30 m seagrass 60 m seagrass
Seagrass residentsCalotomus spinidens d H 0.9 1.9Cheilio inermis d Hard Z 4.5 16.7 24.0 24.0Leptoscarus vaigiensis d H 0.1 14.2 18.1 24.0Lethrinus nebulosus n Hard Z 0.4 7.1 1.4 4.6L. obsoletus n Hard Z 0.3 0.9 0.9L. variegatus n Soft Z 0.6 4.8 31.3Parupeneus pleurostigma d Soft Z 0.4 4.6 0.6 2.1Total no. of seagrass residents 5 6 7 6Nursery speciesPlectorhinchus flavomaculatus n Z-P 1.1 0.2 0.1Scolopsis ghanam n Soft Z 5.9 4.1 0.2 0.1Siganus sutor d H 14.9 9.8 23.6 37.8Total no. of nursery species 3 3 2 3GeneralistsCheilinus trilobatus d Hard Z 6.0 4.0 1.2 1.8Hipposcarus harid d H 2.2 2.8 0.7 0.3Lethrinus harak n Soft Z 2.9 0.8 1.5 2.6L. lentjan n Hard Z 6.8 12.1 0.4 1.3L. mahsena n Hard Z 9.3 6.1 2.2 2.9Lutjanus argentimaculatus n Z-P 0.7 0.8Parupeneus barberinus d Soft Z 3.5 2.5 3.9 0.5P. indicus d Soft Z 0.4 0.8P. macronema d Soft Z 14.8 11.1 5.3 5.6Scarus psittacus d H 12.7 1.3 1.5 0.9Total no. of generalists 10 10 8 8Reef residentsAcanthurus leucosternon d H 9.7 0.5 0.2Calotomus carolinus d H 4.4 2.2 0.5 0.4Chaetodon auriga d S 2.0 0.5 0.4 0.3C. mellanotus d S 2.0Cheilinus undulatus d Hard Z 0.6 0.7Chlorurus sordidus d H 9.2 3.4 0.7 0.4Lutjanus bohar n Z-P 1.7 0.9 0.3L. fulviflamma n Z-P 121.6 118.4 2.1L. gibbus n Z-P 3.6 0.2 0.2L. lutjanus n Z-P 51.3 11.8Mulloidichthys flavolineatus n Hard Z 4.7M. vanicolensis n Hard Z 8.2 5.9Plectorhinchus schotaf n Z-P 5.0 2.9Scarus atrilunula d H 0.8 0.1S. ghobban d H 1.9 0.9 0.1 0.1Zanclus cornutus d S 3.5 0.7 0.7Total no. of reef residents 16 14 7 6Total no. of common species 74 33 24 23
Rare species Observed on the coral reef Observed on seagrass beds
Cetoscarus bicolor ×Gymnocranius grandoculis × ×Lethrinus microdon × ×Macolor niger ×Monotaxis grandolocus ×Naso unicornis × ×Parupeneus bifasciatus ×P. rubescens × ×Plectorhinchus gaterinus ×Scarus russelli × ×Scarus tricolor ×Siganus stellatus × ×
Table 2. Mean total density per species (100 m–2) and total number of species per species group (all quadrats pooled) in the 4 habi-tat zones. Rare species occurred with a total density <0.25 individuals 100 m–2 (pooling juveniles and adults, average for allquadrats of all habitat zones). Feeding guilds (based on Bouchon-Navaro 1986, Almeida et al. 1999, Meyers 1999, Froese & Pauly2003) were distinguished as: Hard Z = hard zoobenthivores (species that predominantly feed on hard benthic prey such as mol-luscs, echinoderms and large crustaceans); H = herbivores; Soft Z = soft zoobenthivores (species that predominantly feed on softbenthic prey such as worms and small crustaceans); S = specialists (species with a specific food preference such as sponges or
coral polyps); Z-P = zoobenthivores-piscivores. d: diurnal; n: nocturnal
Dorenbosch et al.: Coral reef fishes on a reef– seagrass gradient
were significantly higher on the coral reef than on the3 seagrass zones while no significant differences wereobserved between the 3 seagrass zones (Fig. 5,Table 3). The total number of observed species of sea-grass residents, nursery species and generalists (allquadrats pooled) did not vary much between habitattypes (Table 2). However, the total number of observedspecies of reef residents on the seagrass zones de-creased from 14 species on the 0 m seagrass zone to 6species on the 60 m seagrass zone (Table 2).
Mean total density of seagrass residents increasedsignificantly with increasing distance from the coralreef, with the 60 m seagrass zone having the highestdensity (Fig. 6, Table 2, Table 3). Generalists showed acompletely opposite pattern. Mean total densities ofnursery species did not differ significantly between thecoral reef, 0 m seagrass zone and 30 m seagrass zone,but the 60 m seagrass zone showed significantly higherdensities than the coral reef and the 0 m seagrass zone.A significant negative correlation was present be-tween the mean total fish densities of generalists andseagrass residents (rs = –0.64, p < 0.010) and betweengeneralists and nursery species (rs = –0.83, p < 0.010)along the seagrass gradient. A significant positive cor-relation was observed between the mean total fishdensities of seagrass residents and nursery species (rs =–0.96, p < 0.010). Densities of reef residents were highon the coral reef and in the 0 m seagrass zone butalmost 0 in the 30 and 60 m seagrass zones (Fig. 6).
Densities of juvenile nursery species increased withincreasing distance from the coral reef, whereas densi-ties of adults decreased along this gradient (Fig. 7,Table 3). In contrast to the nursery species, both juve-niles and adults of seagrass residents, generalists andreef residents showed similar distribution patterns on
283
Coralreef
0 mseagrass
30 mseagrass
60 mseagrass
Sim
ilari
ty(%
)
100
50
0
Fig. 4. Cluster analysis of the fish assemblage (48 species)from the 4 habitat zones in the coral reef–seagrass gradient.Euclidean distance and the group average linkage methodwere used as a clustering method, using log-transformed
mean species densities (100 m–2)
Comparison Results ANOVA/K-W test Results post hoc comparisons of habitat zonesTest Result Post-hoc test C – 0 C – 30 C – 60 0 – 30 0 – 60 30 – 60
Mean fish density ANOVA <0.001 Gabriel <0.001 <0.001 <0.014 NS NS NS
Mean species richness ANOVA <0.001 Gabriel <0.001 <0.001 <0.001 NS NS NS
Mean total fish density per species groupSeagrass residents K-W <0.001 D T3 <0.001 <0.001 <0.001 NS <0.009 <0.047Nursery species ANOVA <0.006 Gabriel NS NS <0.016 NS <0.008 NSGeneralists K-W <0.001 D T3 NS <0.001 <0.001 NS NS NSReef residents K-W <0.001 D T3 NS <0.001 <0.001 NS NS NS
Mean total densities juveniles and adults species groupsSeagrass residents
Juveniles K-W <0.001 D T3 <0.001 <0.001 <0.001 NS NS NSAdults K-W <0.001 D T3 <0.010 <0.001 <0.001 NS NS NS
Nursery speciesJuveniles ANOVA <0.001 Gabriel NS <0.016 <0.001 NS <0.001 NSAdults K-W <0.001 D T3 NS <0.033 <0.027 NS NS NS
GeneralistsJuveniles K-W <0.001 D T3 NS <0.001 <0.024 NS NS NSAdults ANOVA <0.001 Gabriel NS <0.001 <0.001 NS <0.012 NS
Reef residentsJuveniles K-W <0.001 D T3 NS <0.004 <0.003 NS NS NSAdults K-W <0.001 D T3 NS <0.002 <0.003 NS NS NS
Table 3. Overview of results (p-values) of statistical comparisons between mean fish density and mean species richness (Fig. 5),mean total fish densities per species group (Fig. 6) and mean total densities of juveniles and adults of species groups (Fig. 7) inthe 4 habitat zones. K-W: Kruskal-Wallis test; NS: not significant (p > 0.05); Gabriel: Gabriel’s pairwise test procedure; D T3:
Dunnet’s T3 post-hoc comparison. C: coral; 0,30,60: 0, 30, 60 m seagrass zone
Mar Ecol Prog Ser 299: 277–288, 2005
the gradient (Fig. 7, Table 3). A significant negativecorrelation was present between mean total adult den-sities and juvenile densities of nursery species alongthe seagrass gradient (rs = –0.88, p < 0.010).
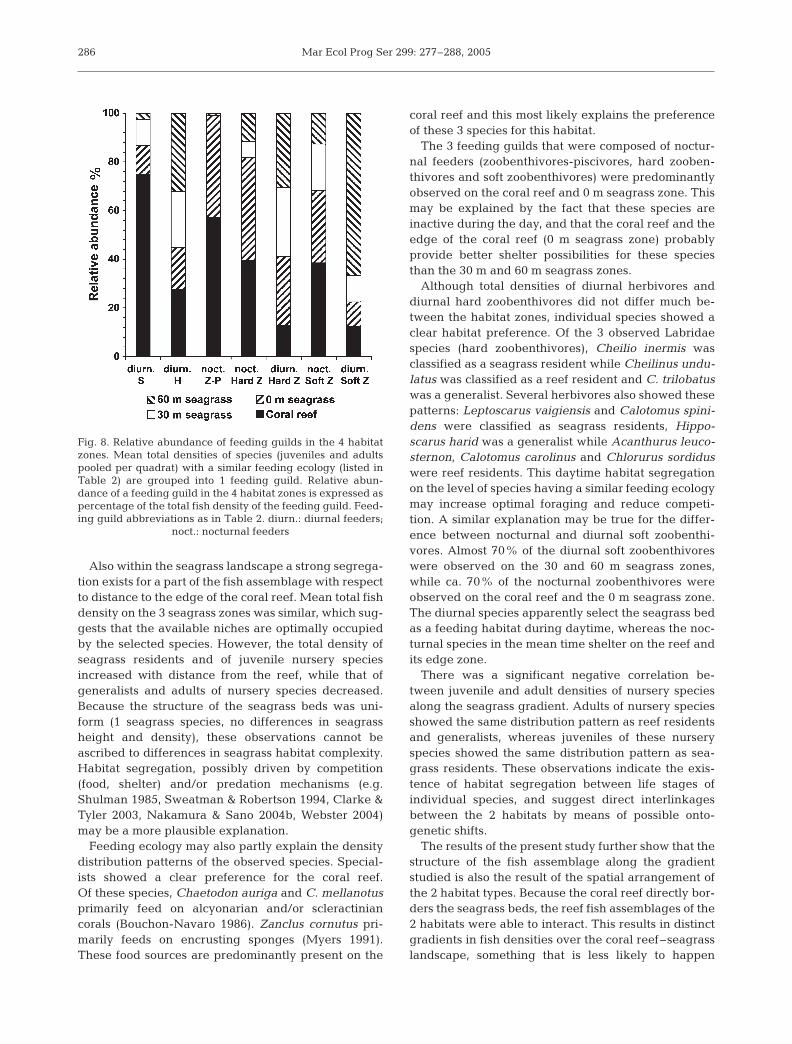
At the level of feeding guilds, specialists consisted of3 species of reef residents (see Table 2), and about75% of the density of this feeding guild was observedon the coral reef (Fig. 8). Chaetodon mellanotus wasexclusively observed on the reef while C. auriga andZanclus cornutus also occurred in very low densities inthe seagrass zones. Herbivores were more or lessequally distributed over the habitat zones. However,this feeding guild was represented by species of allspecies groups with specific habitat preferences: sea-grass residents in seagrass (Calotomus spinidens andLeptoscarus vaigiensis), reef residents on reef (Acan-thurus leucosternon, Calotomus coralinus, Chlorurussordidus, Scarus atrilunula and S. ghobban) and bothnursery species (Siganus sutor) and generalists (Hip-poscarus harid and Scarus psittacus) on seagrass andreef. Almost the complete density of the nocturnalzoobenthivores-piscivores (all observed Lutjanidaeand Haemulidae species) was observed on the coralreef and the 0 m seagrass zone. The density distribu-tion of nocturnal hard zoobenthivores showed a com-parable pattern: almost 80% of the total density wasobserved on the coral reef and the 0 m seagrass zone.This feeding guild was represented by species ofLethrinidae that were classified as seagrass residents
(Lethrinus nebulosus and L. obsoletus) and generalists(L. lentjan and L. mahsena), and by 2 species of reefresidents (Mulloidichthys flavolineatus and M. vani-colensis). Comparable to diurnal herbivores, diurnalhard zoobenthivores were almost equally distributedover all habitat zones. On species level, however, thespecies were separated by habitat use: Cheilio inermison seagrass, Cheilinus undulatus on reef and C. trilo-batus on both reef and seagrass. Nocturnal softzoobenthivores showed a comparable pattern as thatof nocturnal hard zoobenthivores, and 70% of the den-sity was observed on the coral reef and the 0 m sea-grass zone alone. One of the species of this guild wasclassified as a seagrass resident and did not occur onthe coral reef (Lethrinus variegatus). The other 2 spe-cies occurred in higher densities on the coral reef(Scolopsis ghanam and Lethrinus harak). Almost 90%of the density of diurnal soft zoobenthivores wasobserved in the seagrass zones. This feeding guild con-sisted entirely of species of Mullidae that were classi-fied as seagrass residents (Parupeneus pleurostigma)and generalists (Parupeneus barberinus, P. indicus andP. macronema).
DISCUSSION
The reef fish assemblages we observed along thecoral reef–seagrass gradient show segregation as wellas an interlinkage between the 2 habitat types, de-
284
AB
B
B
1
2
2 2
0
50
100
150
200
250
300
350
400
Coral reef 0 mSeagrass
30 mSeagrass
60 mSeagrass
Mea
n fis
h d
ensi
ty +
SE
(100
m–2
)
0
5
10
15
20
25
30
35
40
45
50Fish density
Species richness
Coral reef 0 m Seagrass
30 m Seagrass
60 m Seagrass
Mea
n sp
ecie
s ri
chne
ss +
SE
(100
m–2
)
Fig. 5. Mean fish density and mean species richness of juve-niles and adults (pooling all species) in the 4 habitat zones.Different numbers indicate significant differences (Table 3)for juveniles, while different letters indicate significant differ-ences for adults. Juveniles were tested using 1-way ANOVA;
adults were tested using a Kruskal-Wallis test
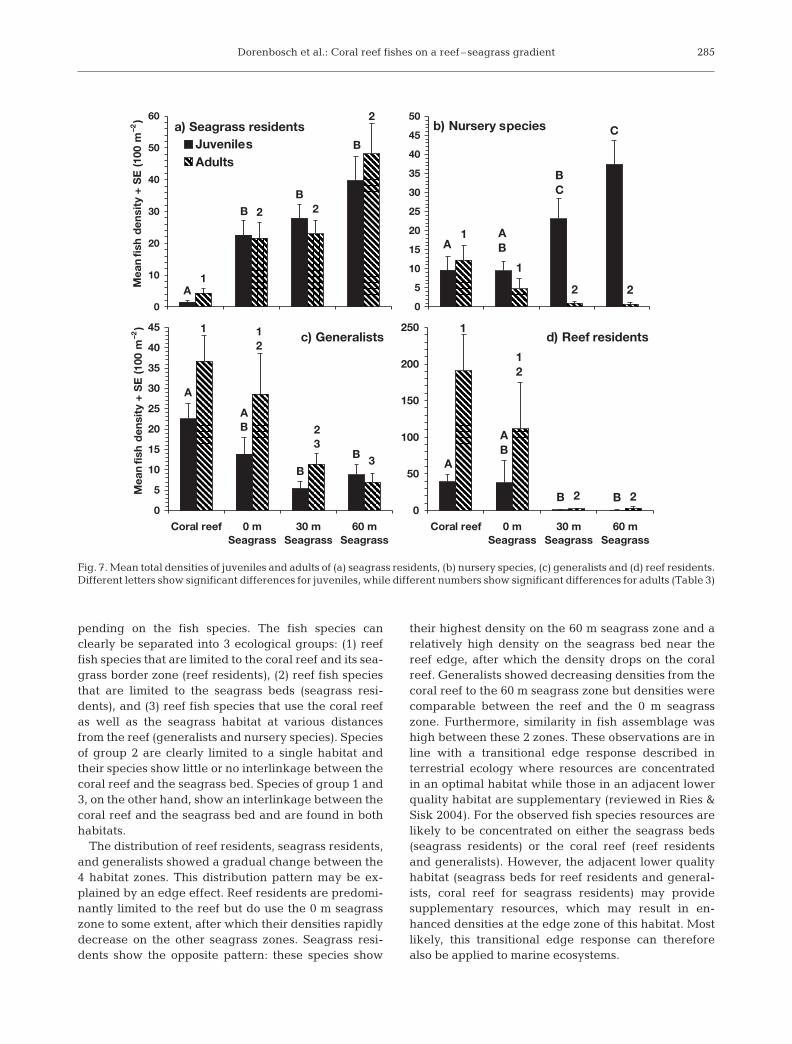
Fig. 6. Mean total fish densities (pooling all size classes) ofseagrass residents, nursery species, generalists and reef resi-dents in the 4 habitat zones. Different letters indicate sig-nificant differences (Table 3). Seagrass residents, generalistsand reef residents were tested using a Kruskal-Wallis test,
nursery species were tested using 1-way ANOVA
Dorenbosch et al.: Coral reef fishes on a reef– seagrass gradient
pending on the fish species. The fish species canclearly be separated into 3 ecological groups: (1) reeffish species that are limited to the coral reef and its sea-grass border zone (reef residents), (2) reef fish speciesthat are limited to the seagrass beds (seagrass resi-dents), and (3) reef fish species that use the coral reefas well as the seagrass habitat at various distancesfrom the reef (generalists and nursery species). Speciesof group 2 are clearly limited to a single habitat andtheir species show little or no interlinkage between thecoral reef and the seagrass bed. Species of group 1 and3, on the other hand, show an interlinkage between thecoral reef and the seagrass bed and are found in bothhabitats.
The distribution of reef residents, seagrass residents,and generalists showed a gradual change between the4 habitat zones. This distribution pattern may be ex-plained by an edge effect. Reef residents are predomi-nantly limited to the reef but do use the 0 m seagrasszone to some extent, after which their densities rapidlydecrease on the other seagrass zones. Seagrass resi-dents show the opposite pattern: these species show
their highest density on the 60 m seagrass zone and arelatively high density on the seagrass bed near thereef edge, after which the density drops on the coralreef. Generalists showed decreasing densities from thecoral reef to the 60 m seagrass zone but densities werecomparable between the reef and the 0 m seagrasszone. Furthermore, similarity in fish assemblage washigh between these 2 zones. These observations are inline with a transitional edge response described interrestrial ecology where resources are concentratedin an optimal habitat while those in an adjacent lowerquality habitat are supplementary (reviewed in Ries &Sisk 2004). For the observed fish species resources arelikely to be concentrated on either the seagrass beds(seagrass residents) or the coral reef (reef residentsand generalists). However, the adjacent lower qualityhabitat (seagrass beds for reef residents and general-ists, coral reef for seagrass residents) may providesupplementary resources, which may result in en-hanced densities at the edge zone of this habitat. Mostlikely, this transitional edge response can thereforealso be applied to marine ecosystems.
285
a) Seagrass residentsB
B
B
A
2
22
1
0
10
20
30
40
50
60
Coral reef 0 mSeagrass
30 mSeagrass
60 mSeagrass
Mea
nfis
hd
ensi
ty+
SE
(100
m–2
)JuvenilesAdults
b) Nursery species C
BC
ABA
22
1
1
0
5
10
15
20
25
30
35
40
45
50
Coral reef 0 mSeagrass
30 mSeagrass
60 mSeagrass
c) Generalists
B
B
AB
A
3
23
12
1
0
5
10
15
20
25
30
35
40
45
Coral reef 0 mSeagrass
30 mSeagrass
60 mSeagrass
Mea
nfis
hd
ensi
ty+
SE
(100
m–2
)
d) Reef residents
BB
AB
A
22
12
1
0
50
100
150
200
250
Coral reef 0 mSeagrass
30 mSeagrass
60 mSeagrass
Fig. 7. Mean total densities of juveniles and adults of (a) seagrass residents, (b) nursery species, (c) generalists and (d) reef residents.Different letters show significant differences for juveniles, while different numbers show significant differences for adults (Table 3)
Mar Ecol Prog Ser 299: 277–288, 2005
Also within the seagrass landscape a strong segrega-tion exists for a part of the fish assemblage with respectto distance to the edge of the coral reef. Mean total fishdensity on the 3 seagrass zones was similar, which sug-gests that the available niches are optimally occupiedby the selected species. However, the total density ofseagrass residents and of juvenile nursery speciesincreased with distance from the reef, while that ofgeneralists and adults of nursery species decreased.Because the structure of the seagrass beds was uni-form (1 seagrass species, no differences in seagrassheight and density), these observations cannot beascribed to differences in seagrass habitat complexity.Habitat segregation, possibly driven by competition(food, shelter) and/or predation mechanisms (e.g.Shulman 1985, Sweatman & Robertson 1994, Clarke &Tyler 2003, Nakamura & Sano 2004b, Webster 2004)may be a more plausible explanation.
Feeding ecology may also partly explain the densitydistribution patterns of the observed species. Special-ists showed a clear preference for the coral reef.Of these species, Chaetodon auriga and C. mellanotusprimarily feed on alcyonarian and/or scleractiniancorals (Bouchon-Navaro 1986). Zanclus cornutus pri-marily feeds on encrusting sponges (Myers 1991).These food sources are predominantly present on the
coral reef and this most likely explains the preferenceof these 3 species for this habitat.
The 3 feeding guilds that were composed of noctur-nal feeders (zoobenthivores-piscivores, hard zooben-thivores and soft zoobenthivores) were predominantlyobserved on the coral reef and 0 m seagrass zone. Thismay be explained by the fact that these species areinactive during the day, and that the coral reef and theedge of the coral reef (0 m seagrass zone) probablyprovide better shelter possibilities for these speciesthan the 30 m and 60 m seagrass zones.
Although total densities of diurnal herbivores anddiurnal hard zoobenthivores did not differ much be-tween the habitat zones, individual species showed aclear habitat preference. Of the 3 observed Labridaespecies (hard zoobenthivores), Cheilio inermis wasclassified as a seagrass resident while Cheilinus undu-latus was classified as a reef resident and C. trilobatuswas a generalist. Several herbivores also showed thesepatterns: Leptoscarus vaigiensis and Calotomus spini-dens were classified as seagrass residents, Hippo-scarus harid was a generalist while Acanthurus leuco-sternon, Calotomus carolinus and Chlorurus sordiduswere reef residents. This daytime habitat segregationon the level of species having a similar feeding ecologymay increase optimal foraging and reduce competi-tion. A similar explanation may be true for the differ-ence between nocturnal and diurnal soft zoobenthi-vores. Almost 70% of the diurnal soft zoobenthivoreswere observed on the 30 and 60 m seagrass zones,while ca. 70% of the nocturnal zoobenthivores wereobserved on the coral reef and the 0 m seagrass zone.The diurnal species apparently select the seagrass bedas a feeding habitat during daytime, whereas the noc-turnal species in the mean time shelter on the reef andits edge zone.
There was a significant negative correlation be-tween juvenile and adult densities of nursery speciesalong the seagrass gradient. Adults of nursery speciesshowed the same distribution pattern as reef residentsand generalists, whereas juveniles of these nurseryspecies showed the same distribution pattern as sea-grass residents. These observations indicate the exis-tence of habitat segregation between life stages ofindividual species, and suggest direct interlinkagesbetween the 2 habitats by means of possible onto-genetic shifts.
The results of the present study further show that thestructure of the fish assemblage along the gradientstudied is also the result of the spatial arrangement ofthe 2 habitat types. Because the coral reef directly bor-ders the seagrass beds, the reef fish assemblages of the2 habitats were able to interact. This results in distinctgradients in fish densities over the coral reef–seagrasslandscape, something that is less likely to happen
286
Fig. 8. Relative abundance of feeding guilds in the 4 habitatzones. Mean total densities of species (juveniles and adultspooled per quadrat) with a similar feeding ecology (listed inTable 2) are grouped into 1 feeding guild. Relative abun-dance of a feeding guild in the 4 habitat zones is expressed aspercentage of the total fish density of the feeding guild. Feed-ing guild abbreviations as in Table 2. diurn.: diurnal feeders;
noct.: nocturnal feeders
Dorenbosch et al.: Coral reef fishes on a reef– seagrass gradient
when there is some distance between the 2 habitats.This confirms the suggestion that the spatial arrange-ment of habitat types contributes to the structure of theassociated fish species (Holbrook et al. 2002, Kendallet al. 2003, Grober-Dunsmore et al. 2004).
In conclusion, the present study shows the existenceof habitat segregation between species or life stages ofcoral reef fishes along a continuous seagrass–coralreef gradient. Competition and feeding mechanisms,ontogenetic shifts, and the spatial arrangement of thehabitats may be important factors in the process ofhabitat segregation.
Acknowledgements. This study was funded by the Nufficthrough the ENVIRONS-MHO programme, by PADI Awareproject and by Quo Vadis fund of the Radboud UniversityNijmegen (The Netherlands). We would like to thank themanagement and staff of the Institute of Marine Science inZanzibar for the use of their facilities and for their support. Weare also grateful to Simgeni Juma Simgeni and AbdallaMakame Mweleza for their help in the field. This is publica-tion No. 361 of the Centre for Wetland Ecology.
LITERATURE CITED
Almeida AJ, Marques A, Saldanha L (1999). Some aspects ofthe biology of 3 fish species from the seagrass beds atInhaca Island, Mozambique. Cybium 23:369–376
Appeldoorn RS, Recksiek CW, Hill RL, Pagan FE, Dennis GD(1997) Marine protected areas and reef fish movements:the role of habitat in controlling ontogenetic migration.Proc 8th Int Coral Reef Symp 2:1917–1922
Baelde P (1990) Differences in the structure of fish assem-blages in Thalassia testudinum beds in Guadeloupe,French West Indies, and their ecological significance. MarBiol 105:163–173
Beck MW, Heck KL, Able KW, Childers DL, Eggleston DB,Gillanders BM, Halpern B, Hays CG, Hoshino K, MinelloTJ, Orth RJ, Sheridan PF, Weinstein MP (2001) The identi-fication, conservation, and management of estuarine andmarine nurseries for fish and invertebrates. Bioscience 51:633–641
Blaber SJM (2000) Tropical estuarine fishes: ecology,exploitation and conservation. Blackwell Science, Oxford
Bouchon-Navaro Y (1986) Partitioning of food and spaceresources by Chaetodontid fishes on coral reefs. J Exp MarBiol Ecol 103:21–40
Clarke RD, Tyler JC (2003) Differential space utilization bymale and female spinyhead blennies, Acanthemblemariaspinosa (Teleostei: Chaenopsidae). Copeia 2:241–247
Cocheret de la Morinière E, Pollux BJA, Nagelkerken I, vander Velde G (2002) Post-settlement life cycle migrationpatterns and habitat preferences of coral reef fish that useseagrass and mangrove habitats as nurseries. Estuar CoastShelf Sci 55:309–321
Eagle JV, Jones GP, McCormick MI (2001) A multi-scale studyof the relationships between habitat use and the distribu-tion and abundance patterns of 3 coral reef angelfishes(Pomacanthidae). Mar Ecol Prog Ser 241:253–265
Froese R, Pauly D (eds) (2003) Fish Base. World Wide Webelectronic publication. www.fishbase.org
Grober-Dunsmore R, Frazer TK, Beets J, Funicelli N, Zwick
PD (2004) The significance of adjacent habitats on reef fishassemblage structure: are relationships detectable at alandscape scale? In: Proceedings of the 55th Gulf andCaribbean Fisheries Institute Meetings, Xel Ha, Mexico,2002. Gulf and Caribbean Fisheries Institute, Fort Pierce,FL, p 713–734
Hay ME (1984) Patterns of fish and urchin grazing onCaribbean coral reefs: are previous results typical? Eco-logy 65:446–454
Holbrook SJ, Brooks AJ, Schmitt RJ (2002) Predictability offish assemblages on coral patch reefs. Mar Freshw Res53:181–188
Hyndes GA, Kendrick AJ, MacArthur LD, Stewart E (2003)Differences in the species- and size-composition of fishassemblages in 3 distinct seagrass habitats with differingplant and meadow structure. Mar Biol 142:1195–1206
Jiddawi NS, Stanley RD (1997) Fisheries stock assessment inthe traditional fishery sector: the information needs. Cana-dian International Development Agency, Zanzibar
Kendall MS, Christensen JD, Hillis-Starr Z (2003) Multi-scaledata used to analyze the spatial distribution of Frenchgrunts, Haemulon flavolineatum, relative to hard and softbottom in a benthic landscape. Environ Biol Fish 66:19–26
Kochzius M (1997) Interrelation of ichthyofauna from aseagrass meadow and coral reef in the Philippines. In:Proceedings of the 5th Indo-Pacific Fisheries Confer-ence, Nouméa, 1997. Antenne Museum-Ephe, Moorea,p 517–535
McAleece N (1997) BioDiversity Pro Beta 2. The NaturalHistory Museum London/Scottish Association for MarineScience, London
Mumby PJ, Edwards AJ, Ernesto Arias-Gonzalez JE, Linde-man PG and 7 others (2004) Mangroves enhance the bio-mass of coral reef fish communities in the Caribbean.Nature 427:533–536
Munday PL, Jones GP, Caley MJ (2001) Interspecific competi-tion and coexistence in a guild of coral-dwelling fishes.Ecology 82:2177–2189
Myers RF (1991) Micronesian reef fishes: a practical guide tothe identification of the coral reef fishes of the tropicalcentral and western Pacific, 2th edn. Coral Graphics, Barri-gada, Territory of Guam
Nagelkerken I, van der Velde G (2002) Do non-estuarinemangroves harbour higher densities of juvenile fish thanadjacent shallow-water and coral reef habitats in Curaçao(Netherlands Antilles)? Mar Ecol Prog Ser 245:191–204
Nagelkerken I, Dorenbosch M, Verberk WCEP, Cocheret dela Morinière E, van der Velde G (2000a) Importance ofshallow-water biotopes of a Caribbean bay for juvenilecoral reef fishes: patterns in biotope association, commu-nity structure and spatial distribution. Mar Ecol Prog Ser202:175–193
Nagelkerken I, van der Velde G, Gorissen MW, Meijer GJ,van’t Hof T, den Hartog C (2000b) Importance of man-groves, seagrass beds and the shallow coral reef as a nurs-ery for important coral reef fishes, using a visual censustechnique. Estuar Coast Shelf Sci 51:31–44
Nakamura Y, Sano M (2004a) Comparison between commu-nity structures of fishes in Enhalus acoroides- and Thalas-sia hemprichii-dominated seagrass beds on fringing coralreefs in the Ryuku Islands, Japan. Ichthyol Res 51:38–45
Nakamura Y, Sano M (2004b) Is there really lower predationrisk for juvenile fishes in a seagrass bed compared with anadjacent coral area? Bull Mar Sci 74:477–482
Ogden JC, Buckman NS (1973) Movements, foraging groups,and diurnal migrations of the striped parrotfish Scaruscroicensis Bloch (Scaridae). Ecology 54:589–596
287
Mar Ecol Prog Ser 299: 277–288, 2005
Ogden JC, Ehrlich PR (1977) The behaviour of heterotypicresting schools of juvenile grunts (Pomadasyidae). MarBiol 42:273–280
Ogden JC, Brown RA, Salesky N (1973) Grazing by the echi-noid Diadema antillarum Philippi: formation of halosaround West Indian patch reefs. Science 182:715–717
Parrish JD (1989) Fish communities of interacting shallow-water habitats in tropical oceanic regions. Mar Ecol ProgSer 58:143–160
Polunin NVC, Roberts CM (2004) Greater biomass and valueof target coral-reef fishes in 2 small Caribbean marinereserves. Mar Ecol Prog Ser 100:167–176
Ries L, Sisk T (2004) A predictive model of edge effects.Ecology 85:2917–2926
Rooker JR, Dennis GD (1991) Dial, lunar and seasonalchanges in a mangrove fish assemblage off southwesternPuerto Rico. Bull Mar Sci 49: 684–698
Sale P (2002) Coral reef fishes: Dynamics and diversity in acomplex ecosystem. Academic Press, San Diego, CA
Shulman MJ (1985) Recruitment of coral reef fishes: effects of
distribution of predators and shelter. Ecology 66:1056–1066Sogard SM, Powell GVN, Holmquist JG (1987) Epibenthic fish
communities on Florida Bay banks: relations with physicalparameters and seagrass cover. Mar Ecol Prog Ser 40:25–39
Sweatman H, Robertson DR (1994) Grazing halos and preda-tion on juvenile Caribbean surgeonfishes. Mar Ecol ProgSer 111:1–6
ter Braak CJF, Smilauer P (1998) Reference manual and user’sguide to Canoco for Windows: Software for canonicalcommunity ordination (version 4). Microcomputer power,Ithaca, NY
Watson RA, Quinn TJ (1997) Performance of transect andpoint count underwater visual census methods. EcolModel 104:103–112
Webster MS (2004) Density dependence via intercohortcompetition in a coral-reef fish. Ecology 85:986–994
Weinstein MP, Heck KL (1979) Ichthyofauna of seagrassmeadows along the Caribbean coast of Panama and theGulf of Mexico: composition, structure and communityecology. Mar Biol 50:97–107
288
Editorial responsibility: Otto Kinne (Editor-in-Chief),Oldendorf/Luhe, Germany
Submitted: October 20, 2004; Accepted: May 26, 2005Proofs received from author(s): August 3, 2005


