Disease Trends: Challenges and
Opportunities
Credit Insurers Association
Mark Skillan, M.D., Consulting Medical DirectorMay 11, 2017

Leading Causes of Death and Disease Trends in the U.S.
Select Areas of Interest
▪ Heart Disease
▪ Diabetes
▪ Cancer: Lung, Breast, Prostate, Colon, Melanoma
More Recent Trends/Challenges in Risk Assessment
▪ HIV
▪ e-Cigarettes
▪ Gender Identity
▪ Genetic testing/Rare Diseases
Agenda
2© 2015 Munich American Reassurance Company. All rights reserved.
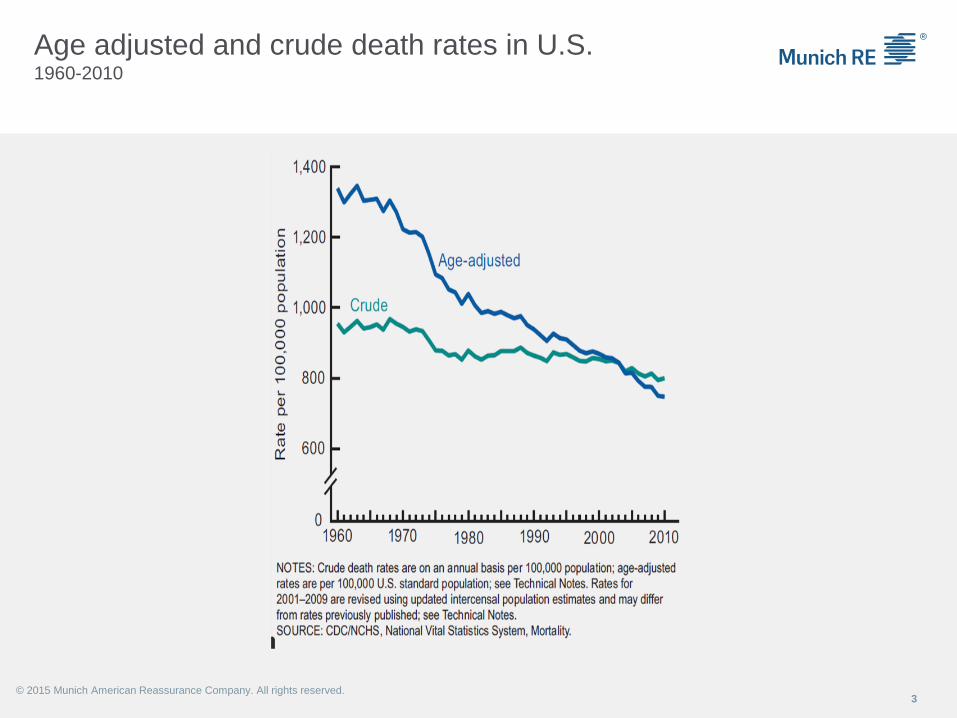
Age adjusted and crude death rates in U.S. 1960-2010
3© 2015 Munich American Reassurance Company. All rights reserved.
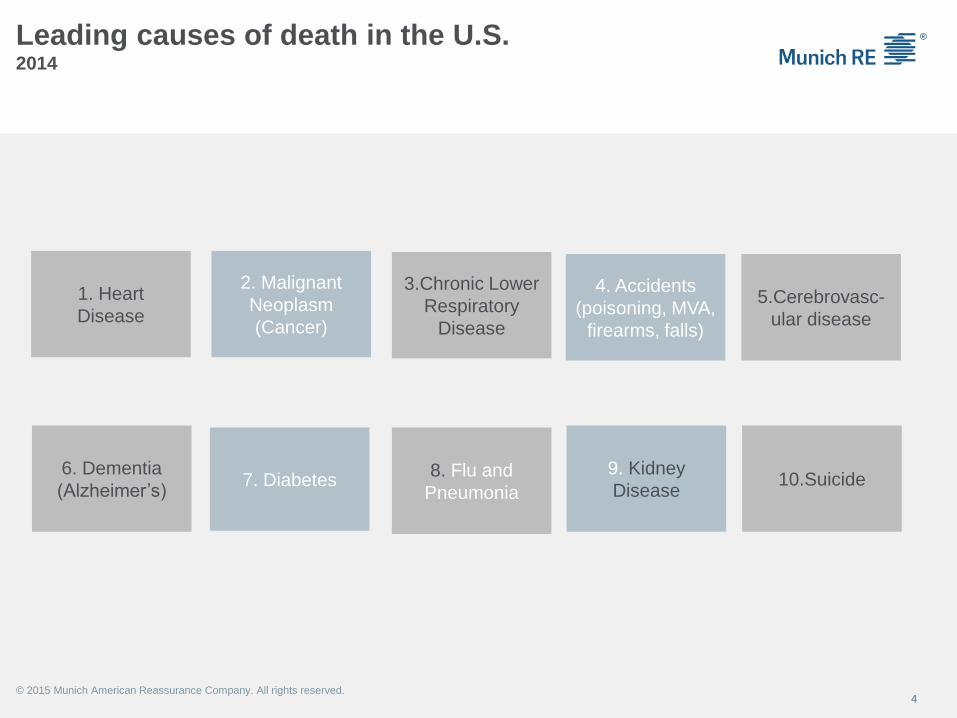
Leading causes of death in the U.S.2014
4
1. Heart
Disease
6. Dementia
(Alzheimer’s)
2. Malignant
Neoplasm
(Cancer)
7. Diabetes
3.Chronic Lower
Respiratory
Disease
8. Flu and
Pneumonia
4. Accidents
(poisoning, MVA,
firearms, falls)
9. Kidney
Disease
5.Cerebrovasc-
ular disease
10.Suicide
© 2015 Munich American Reassurance Company. All rights reserved.
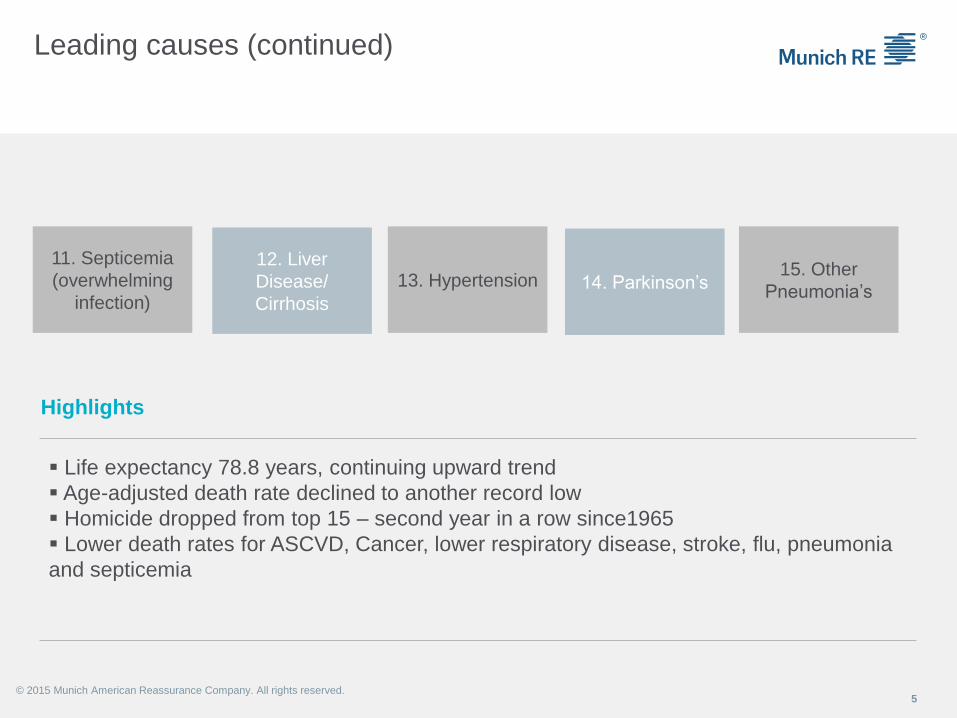
Leading causes (continued)
5
11. Septicemia
(overwhelming
infection)
12. Liver
Disease/
Cirrhosis
13. Hypertension 14. Parkinson’s15. Other
Pneumonia’s
▪ Life expectancy 78.8 years, continuing upward trend
▪ Age-adjusted death rate declined to another record low
▪ Homicide dropped from top 15 – second year in a row since1965
▪ Lower death rates for ASCVD, Cancer, lower respiratory disease, stroke, flu, pneumonia
and septicemia
Highlights
© 2015 Munich American Reassurance Company. All rights reserved.
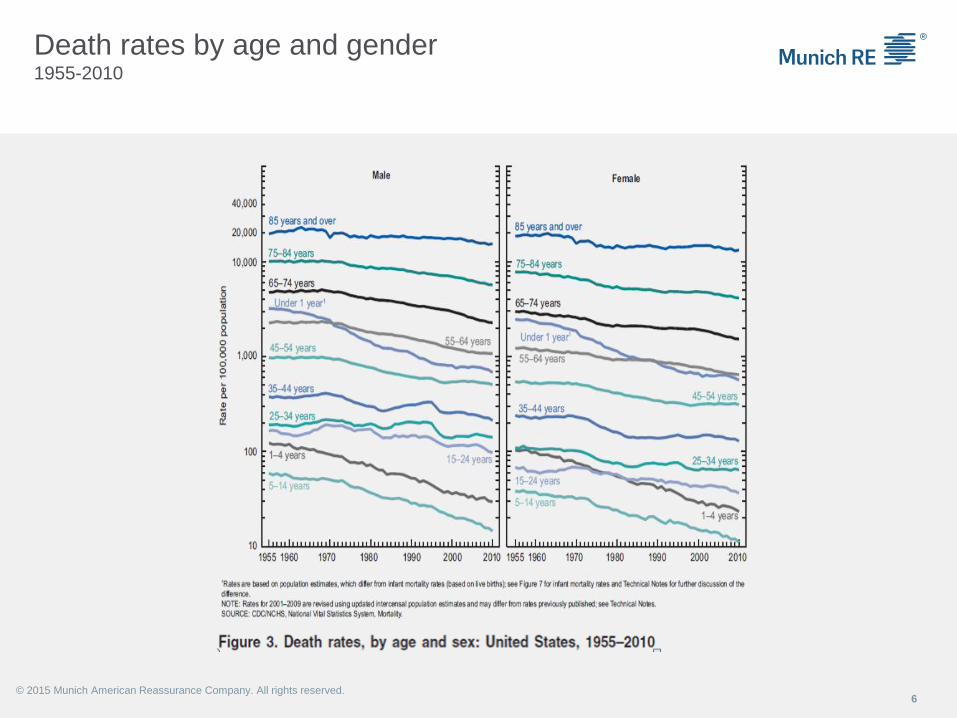
Death rates by age and gender 1955-2010
6© 2015 Munich American Reassurance Company. All rights reserved.
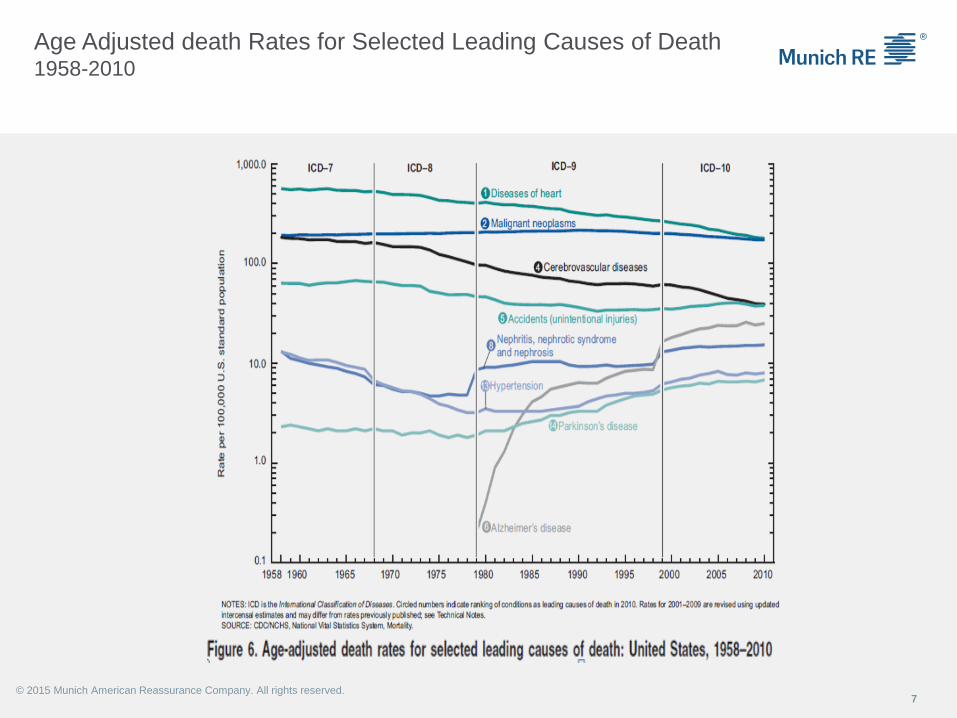
Age Adjusted death Rates for Selected Leading Causes of Death 1958-2010
7© 2015 Munich American Reassurance Company. All rights reserved.
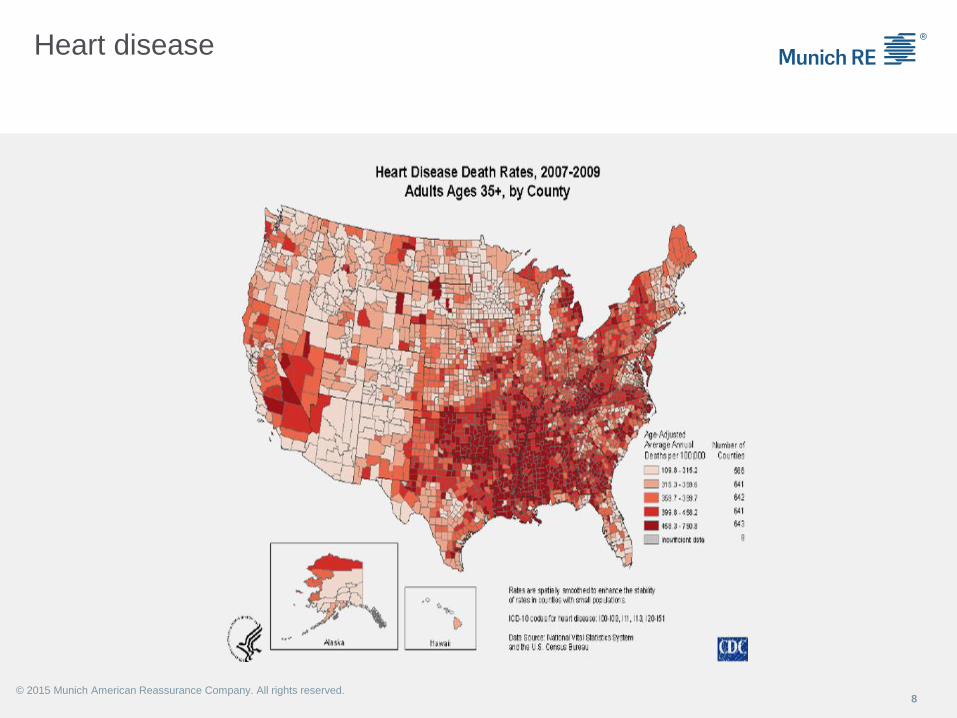
Heart disease
8© 2015 Munich American Reassurance Company. All rights reserved.
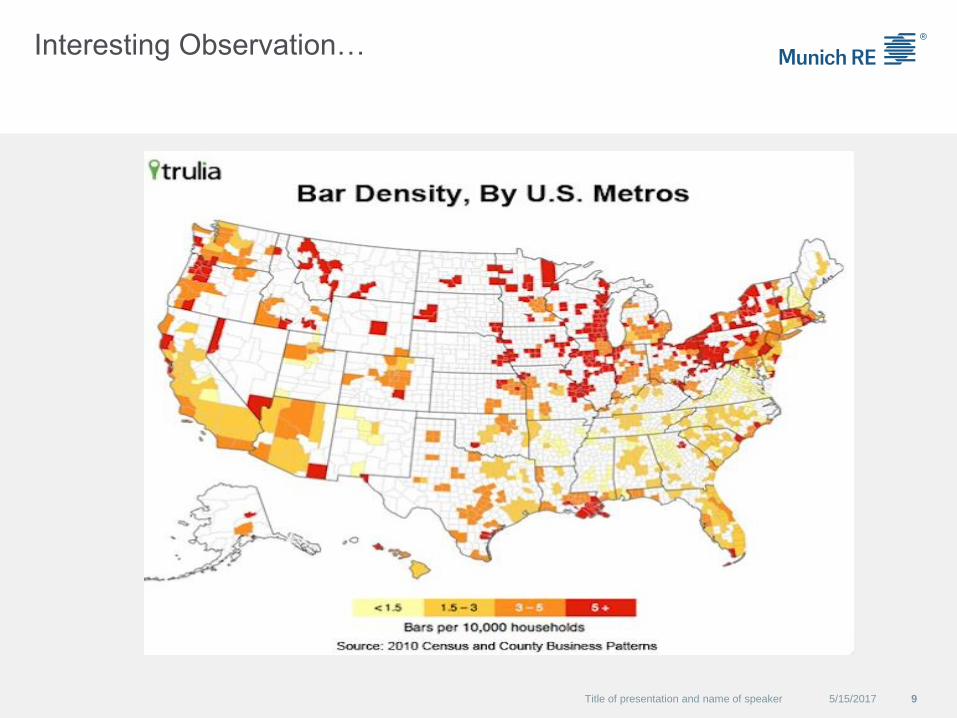
Interesting Observation…
5/15/2017Title of presentation and name of speaker 9
Heart disease
10
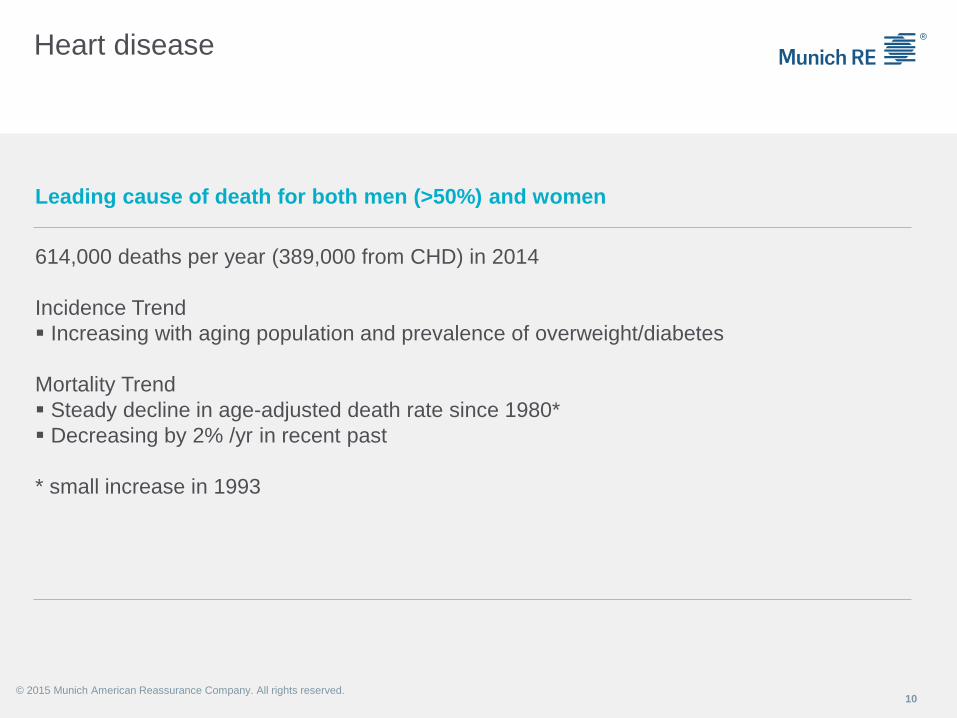
Leading cause of death for both men (>50%) and women
614,000 deaths per year (389,000 from CHD) in 2014
Incidence Trend
▪ Increasing with aging population and prevalence of overweight/diabetes
Mortality Trend
▪ Steady decline in age-adjusted death rate since 1980*
▪ Decreasing by 2% /yr in recent past
* small increase in 1993
© 2015 Munich American Reassurance Company. All rights reserved.
Heart disease – trends and implications
11
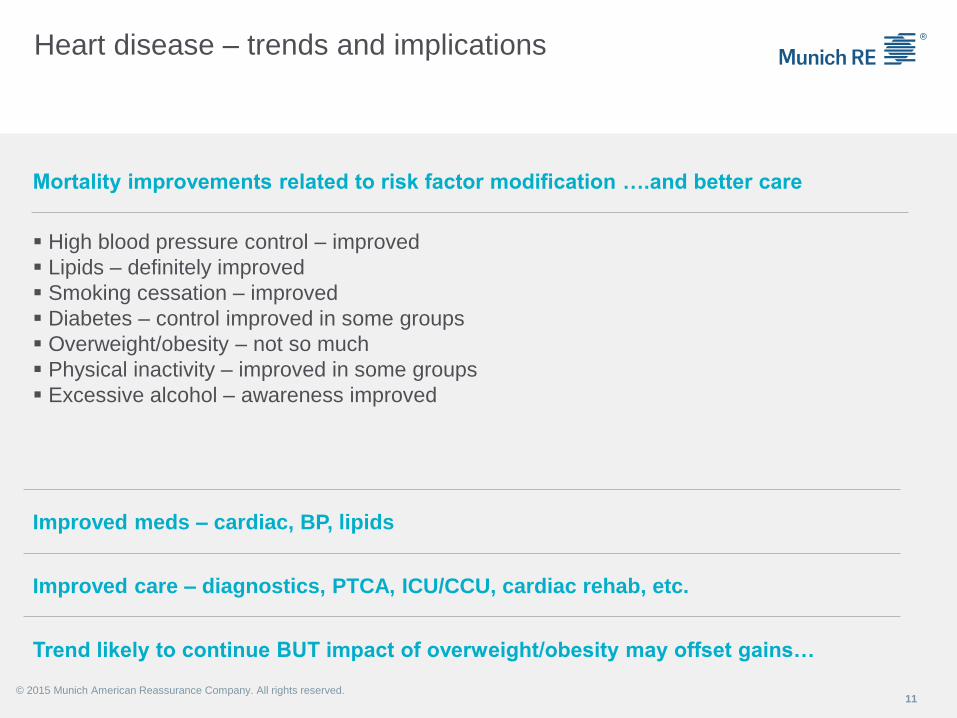
Mortality improvements related to risk factor modification ….and better care
▪ High blood pressure control – improved
▪ Lipids – definitely improved
▪ Smoking cessation – improved
▪ Diabetes – control improved in some groups
▪ Overweight/obesity – not so much
▪ Physical inactivity – improved in some groups
▪ Excessive alcohol – awareness improved
Improved meds – cardiac, BP, lipids
Improved care – diagnostics, PTCA, ICU/CCU, cardiac rehab, etc.
Trend likely to continue BUT impact of overweight/obesity may offset gains…
© 2015 Munich American Reassurance Company. All rights reserved.
Diabetes
12
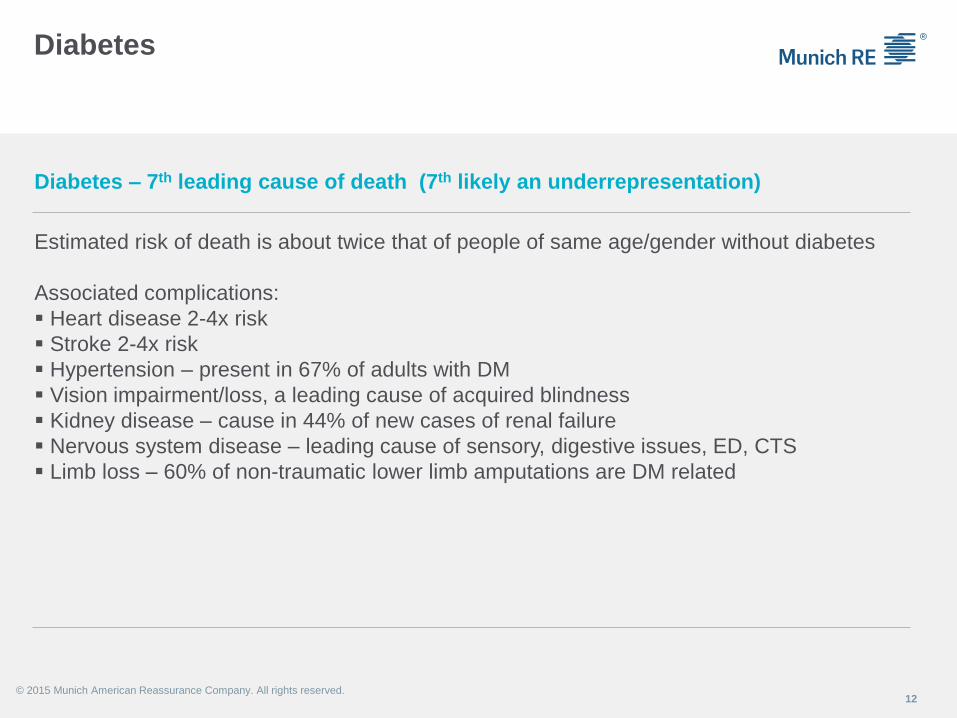
Diabetes – 7th leading cause of death (7th likely an underrepresentation)
Estimated risk of death is about twice that of people of same age/gender without diabetes
Associated complications:
▪ Heart disease 2-4x risk
▪ Stroke 2-4x risk
▪ Hypertension – present in 67% of adults with DM
▪ Vision impairment/loss, a leading cause of acquired blindness
▪ Kidney disease – cause in 44% of new cases of renal failure
▪ Nervous system disease – leading cause of sensory, digestive issues, ED, CTS
▪ Limb loss – 60% of non-traumatic lower limb amputations are DM related
© 2015 Munich American Reassurance Company. All rights reserved.

Diagnosed diabetes, U.S. 1958-2010
13© 2015 Munich American Reassurance Company. All rights reserved.
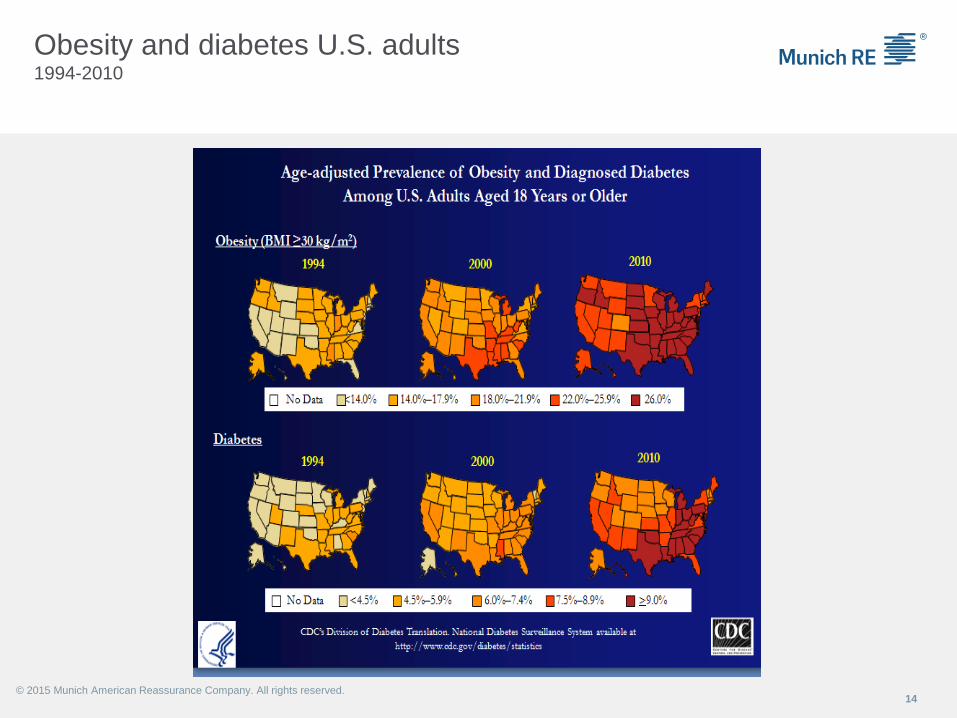
Obesity and diabetes U.S. adults 1994-2010
14© 2015 Munich American Reassurance Company. All rights reserved.
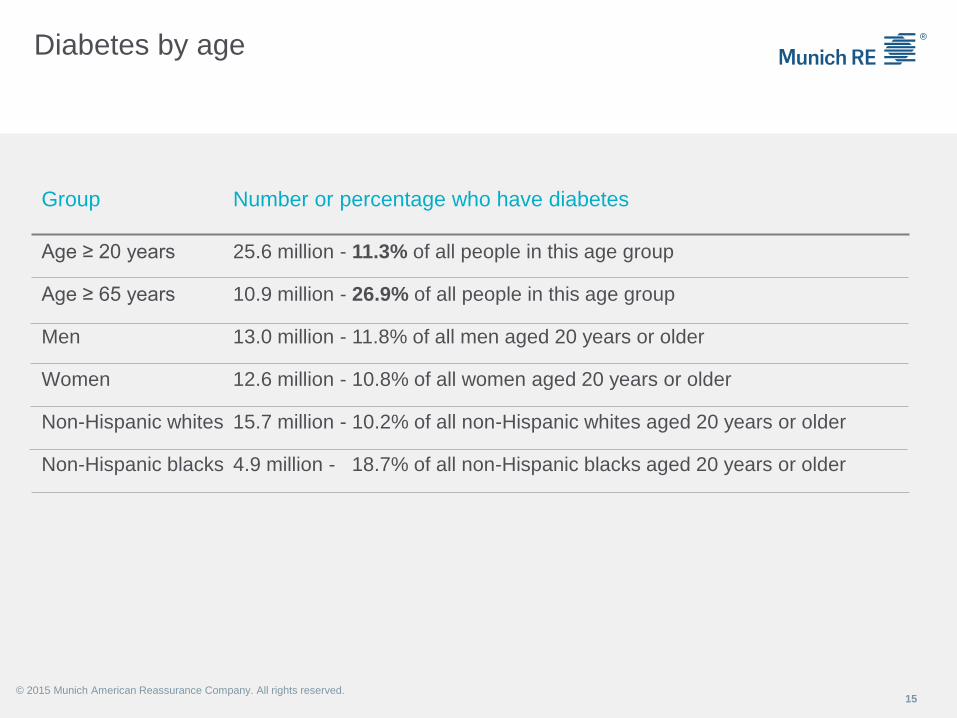
Diabetes by age
15
Age ≥ 20 years 25.6 million - 11.3% of all people in this age group
Group Number or percentage who have diabetes
Age ≥ 65 years 10.9 million - 26.9% of all people in this age group
Men 13.0 million - 11.8% of all men aged 20 years or older
Women 12.6 million - 10.8% of all women aged 20 years or older
Non-Hispanic whites 15.7 million - 10.2% of all non-Hispanic whites aged 20 years or older
Non-Hispanic blacks 4.9 million - 18.7% of all non-Hispanic blacks aged 20 years or older
© 2015 Munich American Reassurance Company. All rights reserved.

Age group and diabetes
16© 2015 Munich American Reassurance Company. All rights reserved.
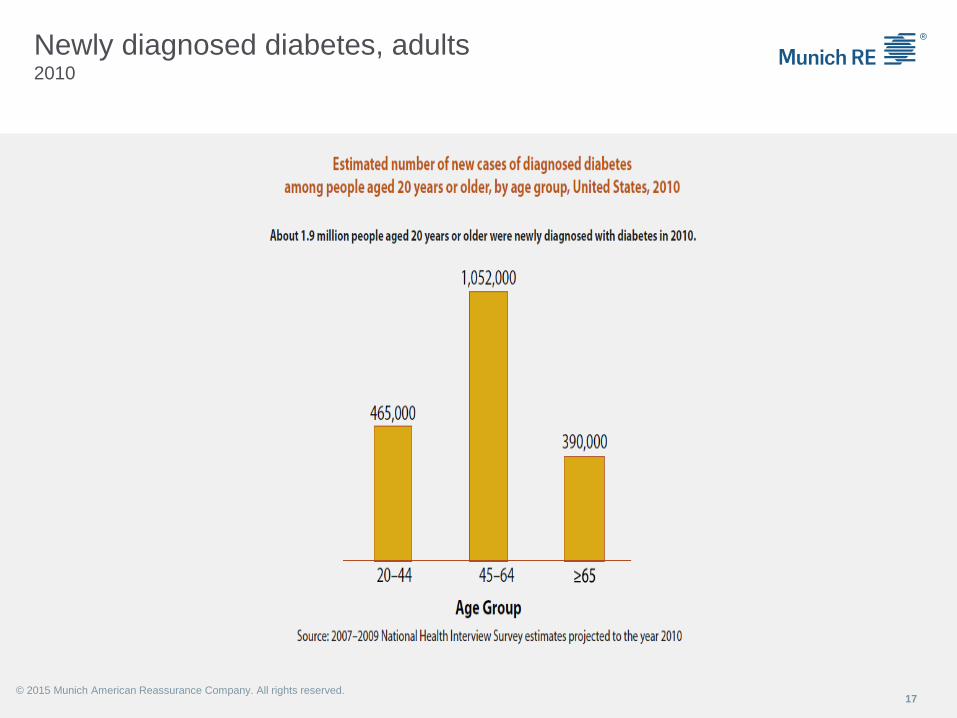
Newly diagnosed diabetes, adults2010
17© 2015 Munich American Reassurance Company. All rights reserved.
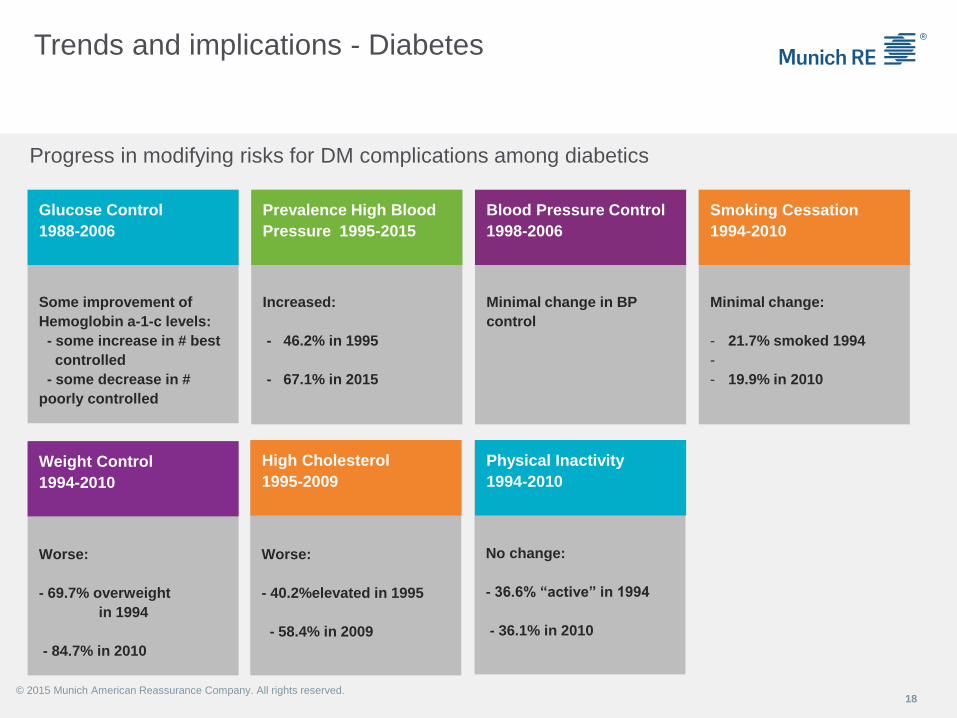
Trends and implications - Diabetes
18
No change:
- 36.6% “active” in 1994
- 36.1% in 2010
Worse:
- 40.2%elevated in 1995
- 58.4% in 2009
Worse:
- 69.7% overweight
in 1994
- 84.7% in 2010
Some improvement of
Hemoglobin a-1-c levels:
- some increase in # best
controlled
- some decrease in #
poorly controlled
Minimal change in BP
control
Minimal change:
- 21.7% smoked 1994
-
- 19.9% in 2010
Increased:
- 46.2% in 1995
- 67.1% in 2015
Glucose Control
1988-2006
Prevalence High Blood
Pressure 1995-2015
Blood Pressure Control
1998-2006
Smoking Cessation
1994-2010
Weight Control
1994-2010
High Cholesterol
1995-2009
Physical Inactivity
1994-2010
Progress in modifying risks for DM complications among diabetics
© 2015 Munich American Reassurance Company. All rights reserved.
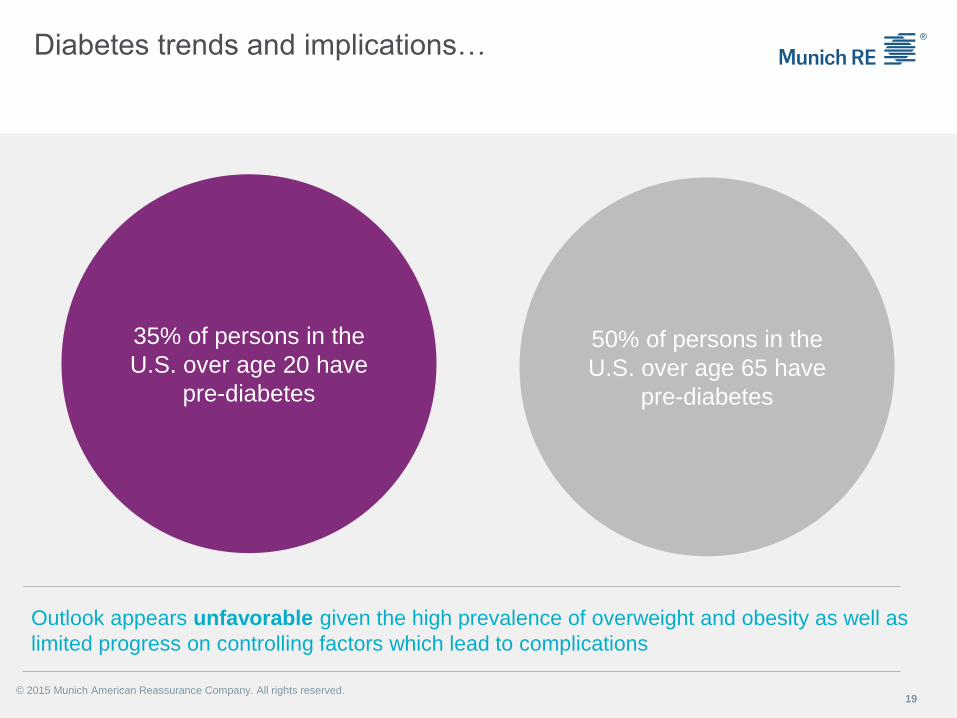
Diabetes trends and implications…
19
35% of persons in the
U.S. over age 20 have
pre-diabetes
50% of persons in the
U.S. over age 65 have
pre-diabetes
Outlook appears unfavorable given the high prevalence of overweight and obesity as well as
limited progress on controlling factors which lead to complications
© 2015 Munich American Reassurance Company. All rights reserved.
Breast Cancer
20
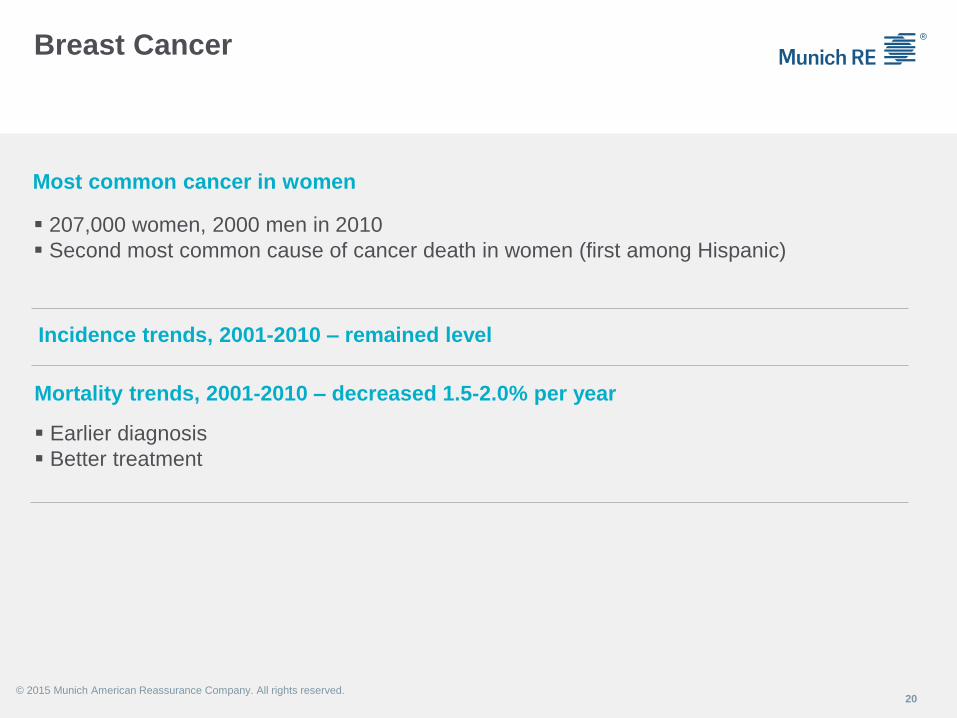
Most common cancer in women
▪ 207,000 women, 2000 men in 2010
▪ Second most common cause of cancer death in women (first among Hispanic)
Incidence trends, 2001-2010 – remained level
Mortality trends, 2001-2010 – decreased 1.5-2.0% per year
© 2015 Munich American Reassurance Company. All rights reserved.
▪ Earlier diagnosis
▪ Better treatment

Risk of breast cancer increases with age
21© 2015 Munich American Reassurance Company. All rights reserved.
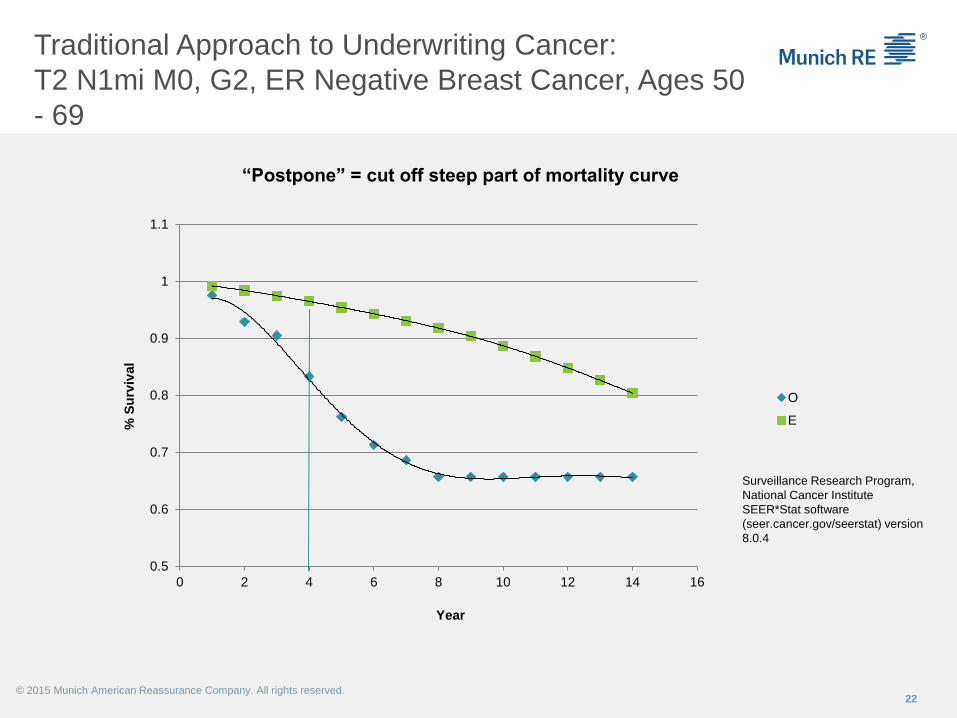
Traditional Approach to Underwriting Cancer:
T2 N1mi M0, G2, ER Negative Breast Cancer, Ages 50
- 69
22
Surveillance Research Program,
National Cancer Institute
SEER*Stat software
(seer.cancer.gov/seerstat) version
8.0.4
© 2015 Munich American Reassurance Company. All rights reserved.
0.5
0.6
0.7
0.8
0.9
1
1.1
0 2 4 6 8 10 12 14 16
% S
urv
ival
Year
“Postpone” = cut off steep part of mortality curve
O
E
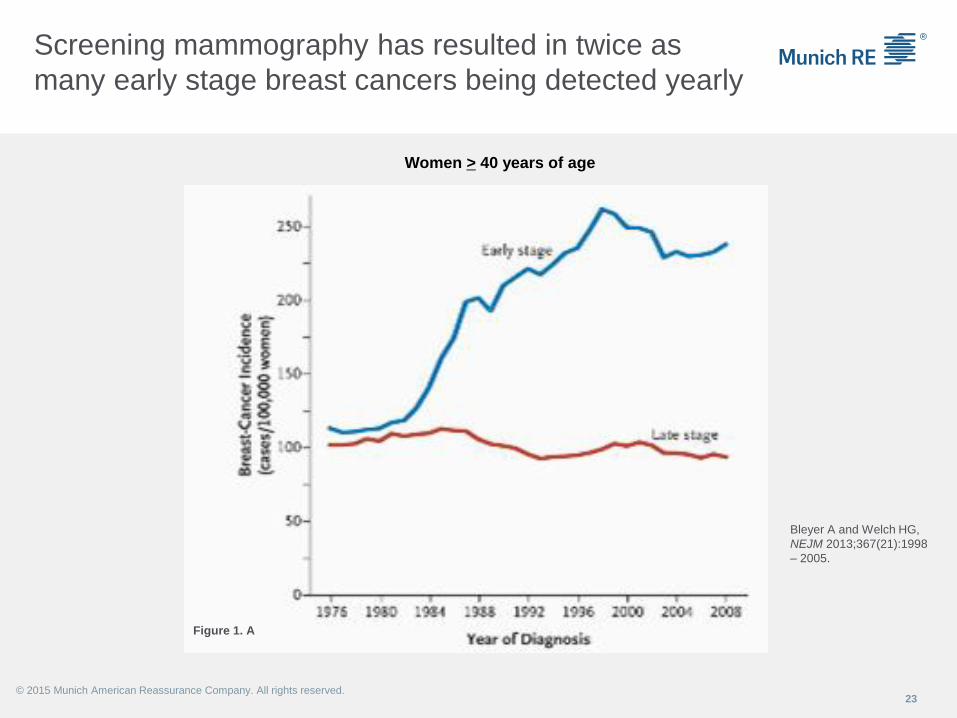
Screening mammography has resulted in twice as
many early stage breast cancers being detected yearly
23
Figure 1. A
Women > 40 years of age
Bleyer A and Welch HG,
NEJM 2013;367(21):1998
– 2005.
© 2015 Munich American Reassurance Company. All rights reserved.
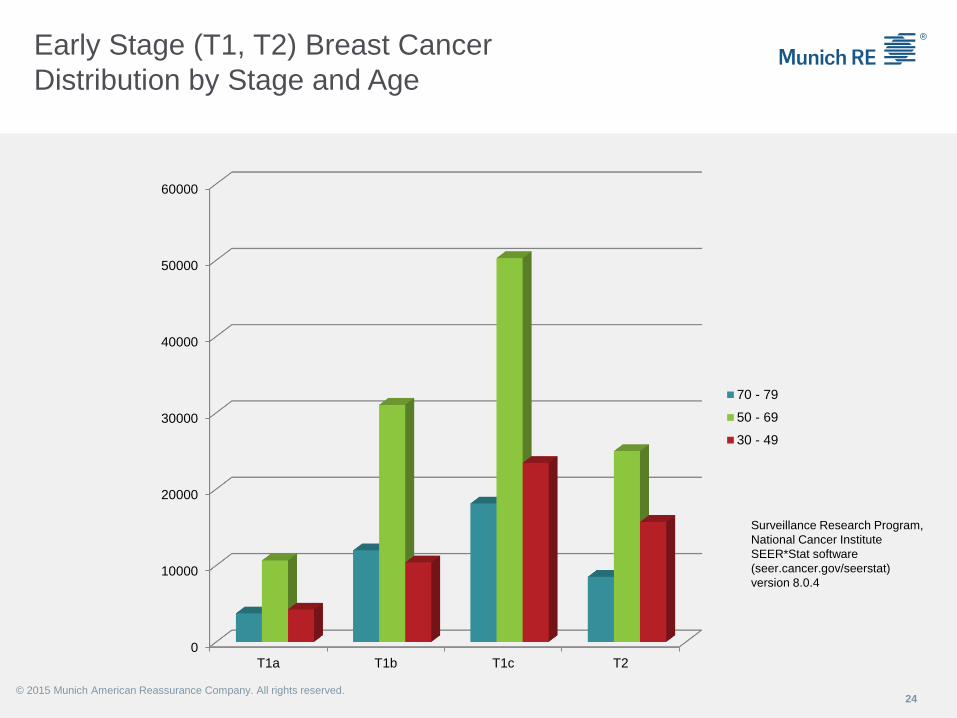
Early Stage (T1, T2) Breast Cancer
Distribution by Stage and Age
24
0
10000
20000
30000
40000
50000
60000
T1a T1b T1c T2
70 - 79
50 - 69
30 - 49
Surveillance Research Program,
National Cancer Institute
SEER*Stat software
(seer.cancer.gov/seerstat)
version 8.0.4
© 2015 Munich American Reassurance Company. All rights reserved.
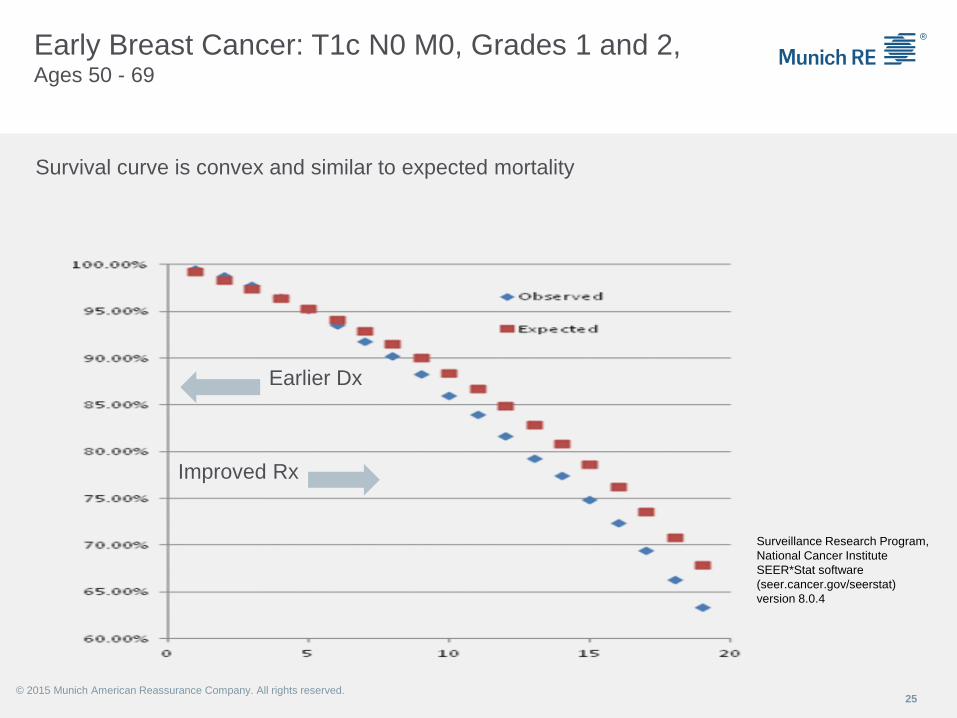
Early Breast Cancer: T1c N0 M0, Grades 1 and 2,Ages 50 - 69
25
Surveillance Research Program,
National Cancer Institute
SEER*Stat software
(seer.cancer.gov/seerstat)
version 8.0.4
Survival curve is convex and similar to expected mortality
Earlier Dx
Improved Rx
© 2015 Munich American Reassurance Company. All rights reserved.
Long-term adverse effects from therapy for early stage
breast cancer result in ongoing increased mortality risk
26
Radiation
▪ Increase incidence of coronary artery disease
▪ Myocardial damage from radiation
Chemotherapy
© 2015 Munich American Reassurance Company. All rights reserved.
▪ Increased incidence of hematologic malignancies
▪ Cardiomyopathy
Early Stage (T1 T2 N0 M0) Breast Cancer
27
Survival curves are convex
▪ Little advantage to postpone period
▪Debits better reflect the risk vs. temporary flat extra rating format
© 2015 Munich American Reassurance Company. All rights reserved.
Menopause and Age alter mortality risk in early
stage breast cancer
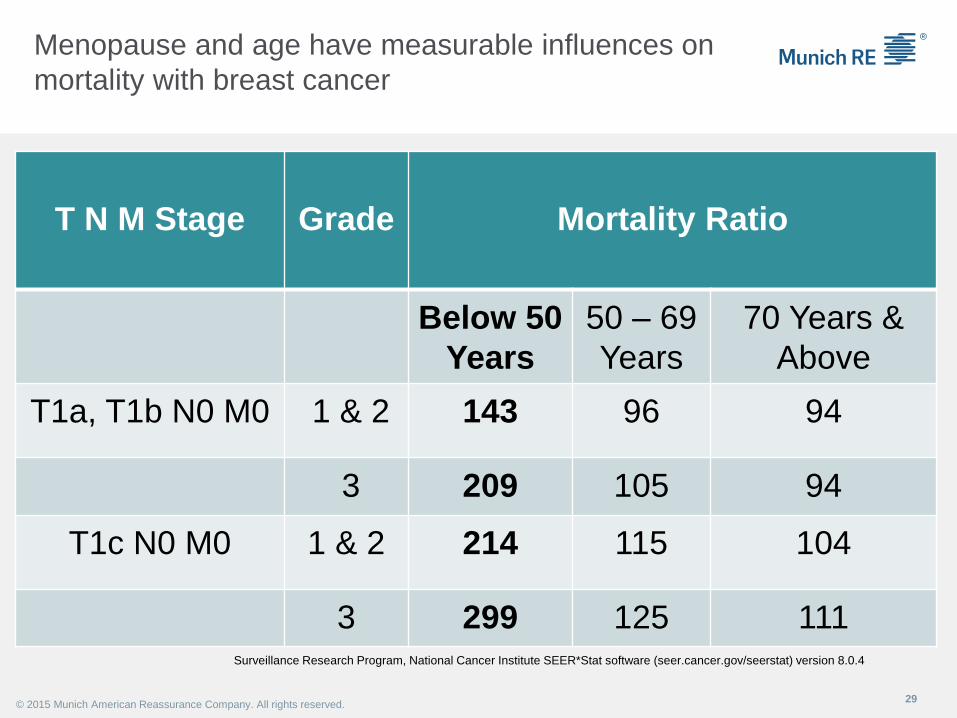
Menopause and age have measurable influences on
mortality with breast cancer
29
T N M Stage Grade Mortality Ratio
Below 50
Years
50 – 69
Years
70 Years &
Above
T1a, T1b N0 M0 1 & 2 143 96 94
3 209 105 94
T1c N0 M0 1 & 2 214 115 104
3 299 125 111Surveillance Research Program, National Cancer Institute SEER*Stat software (seer.cancer.gov/seerstat) version 8.0.4
© 2015 Munich American Reassurance Company. All rights reserved.
And above age 70…
30
Early Stage breast cancer (T1 size) effectively treated with
lumpectomy and tamoxifen
More sensitive to effects of hormonal Rx in later years –
especially beyond 75 years
© 2015 Munich American Reassurance Company. All rights reserved.
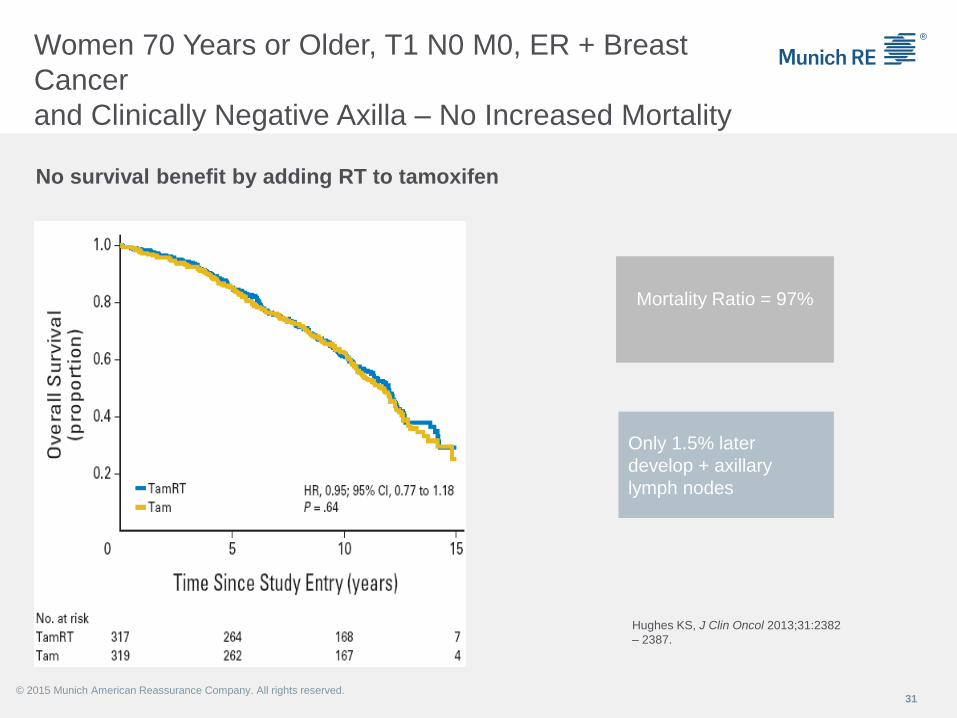
Women 70 Years or Older, T1 N0 M0, ER + Breast
Cancer
and Clinically Negative Axilla – No Increased Mortality
31
No survival benefit by adding RT to tamoxifen
Mortality Ratio = 97%
Only 1.5% later
develop + axillary
lymph nodes
© 2015 Munich American Reassurance Company. All rights reserved.
Hughes KS, J Clin Oncol 2013;31:2382
– 2387.
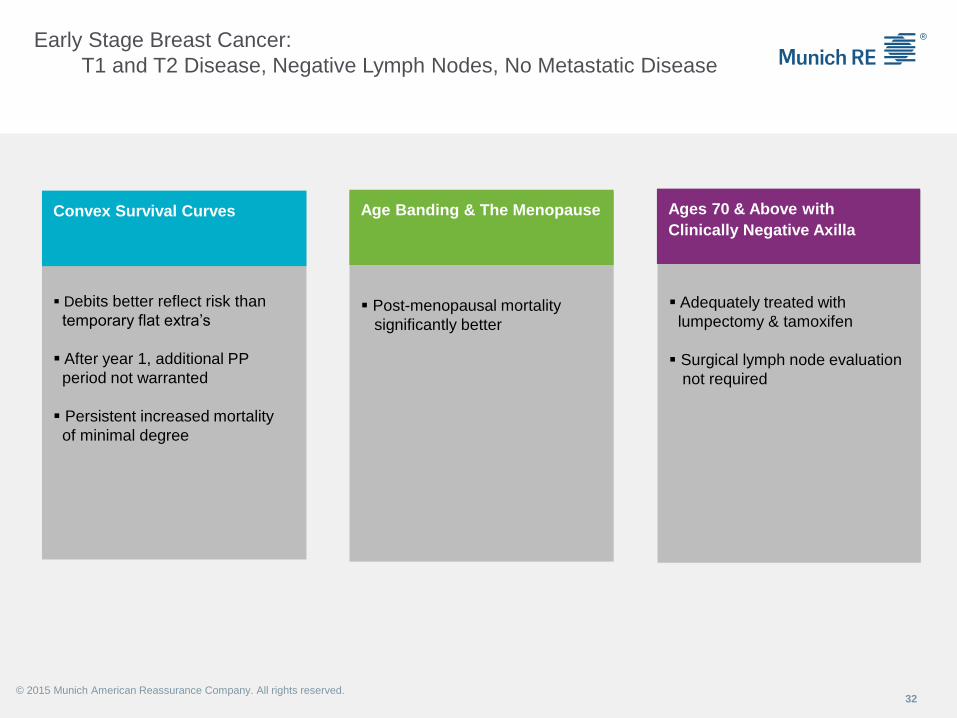
Early Stage Breast Cancer:
T1 and T2 Disease, Negative Lymph Nodes, No Metastatic Disease
32
▪ Debits better reflect risk than
temporary flat extra’s
▪ After year 1, additional PP
period not warranted
▪ Persistent increased mortality
of minimal degree
▪ Adequately treated with
lumpectomy & tamoxifen
▪ Surgical lymph node evaluation
not required
▪ Post-menopausal mortality
significantly better
Convex Survival Curves Age Banding & The Menopause Ages 70 & Above with
Clinically Negative Axilla
© 2015 Munich American Reassurance Company. All rights reserved.
Trends and implications – Breast Cancer
33
With aging population and better screening, incidence likely to rise
Outlook for early stage breast cancer has improved
Improved understanding of the most common breast cancer risks encountered:
▪ More limited PP period translates to earlier offers
▪ Small rating, no temporary extra premium charge
▪ Bottom line: More and more favorable offers than in past
For applicants with early stage breast cancer within 5 years of therapy
For the balance of the policy, more accurate pricing of the risk
© 2015 Munich American Reassurance Company. All rights reserved.
▪ Extra mortality for those entering insured pool after traditional PP period was often not
previously covered
Lung Cancer
34
More Americans die from lung cancer than any other cancer
▪ Diagnosed: 201,000 – M:F 107,000: 94,000 (2010)
▪ Deaths: 158,000 – M:F 88,000: 71,000 (2010)
Incidence trends 2001-2010
© 2015 Munich American Reassurance Company. All rights reserved.
▪ Decreased 2.3 – 2.7% per year in men
▪ Decreased 0.6 – 0.7% per year in women, stayed level in black women
Mortality trends 2001-2010
▪ Decreased 2.5 – 3.3% in men, biggest improvement among black men
▪ Decreased 0.9 – 1.0% in women
Trends and implications – Lung Cancer
35
Decrease incidence and mortality in men reflects smoking reduction over past 20-30 years in
men
Lack of improvement in women likely reflects both later adoption and discontinuance of
smoking among women
© 2015 Munich American Reassurance Company. All rights reserved.
Screening remains problematic and controversial – CXR vs. CT, etc
Therapies except for the earliest found lesions and one subgroup (NSCLC) remains less than
optimal
Key to future remains risk factor reduction

Colorectal Cancer
36
Third most common cancer in men and women
▪ Diagnosed: 132,000 – M:F 68,000: 64,000 (2010)
▪ Deaths: 52,000
Incidence trends 2001-2010
▪ Decreased 2.0 – 4.0% per year in men
▪ Decreased 2.0 – 3.3% per year in women
Mortality trends 2001-2010
▪ Decreased by 1.4 – 3.0% per year in men
▪ Decreased by 2.0 – 3.3% among women
Second leading cause of cancer death in cancers which affect both men and women
© 2015 Munich American Reassurance Company. All rights reserved.

Trends and implications: Colorectal Cancer
37
Education, screening and surveillance has had a favorable impact
▪ More earlier stage lesions at diagnosis
▪ Able to offer on best cases and do so earlier
Incidence increases with age thus incidence likely to increase
▪ Treatment for later stage disease remains sub-optimal
▪ Current ratings for these may be underpriced in the market
© 2015 Munich American Reassurance Company. All rights reserved.
Prostate Cancer
38
Most common cancer among men in U.S.
▪ Lifetime risk >16%
Second leading cause of cancer death in men
© 2015 Munich American Reassurance Company. All rights reserved.
▪ Diagnosed: 196,000 in 2010
▪ Deaths: 29,000
Incidence trends 2001-2010
▪ Decreased by 2.6 – 4.0% per year
Mortality trends
▪ Decreased by 3.0 – 3.8% per year (3.8% in black men!)
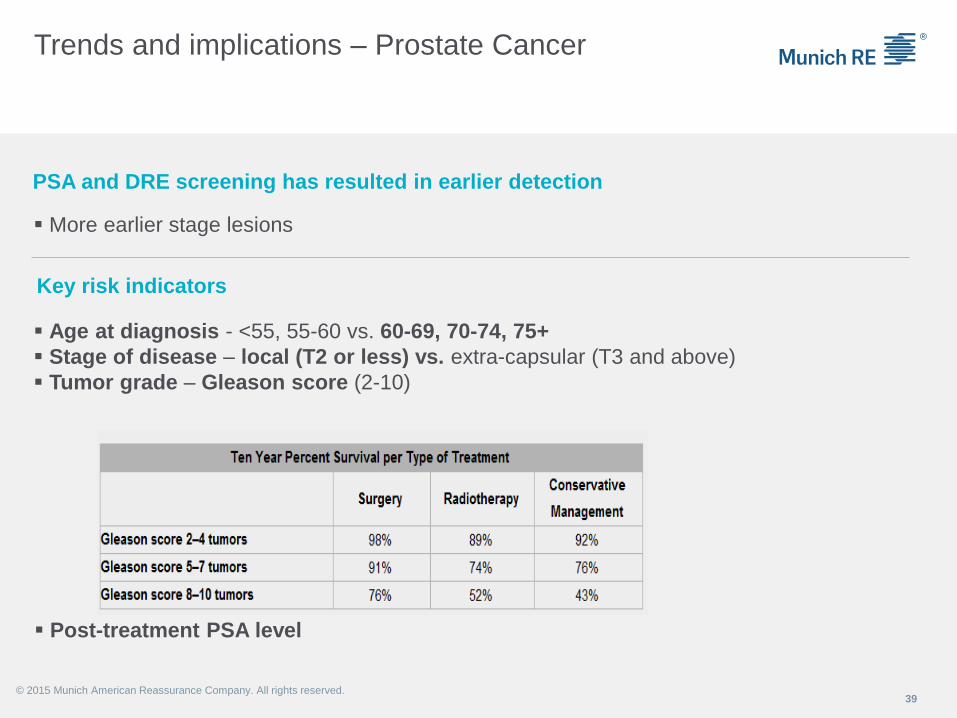
Trends and implications – Prostate Cancer
39
PSA and DRE screening has resulted in earlier detection
▪ More earlier stage lesions
Key risk indicators
© 2015 Munich American Reassurance Company. All rights reserved.
▪ Age at diagnosis - <55, 55-60 vs. 60-69, 70-74, 75+
▪ Stage of disease – local (T2 or less) vs. extra-capsular (T3 and above)
▪ Tumor grade – Gleason score (2-10)
▪ Post-treatment PSA level
Trends and implications – Prostate Cancer
(continued)
40
With latest SEER data, improved ability to quantify risk
▪ Earlier offers for better/best risks
▪ Better offers for many than before, especially at >60, >70
Second leading cause of cancer death in men
© 2015 Munich American Reassurance Company. All rights reserved.
▪ Controversy over screening/over-treatment may lower detection of early tumors
▪ More men may elect “watchful waiting”
▪ Focus on ED risk may likewise affect number of younger men opting for radiation
rather than surgery with less certain outlook for cure in some cases

Skin Cancer - Melanoma
41
Skin cancer is the commonest form of cancer in the U.S.
Most are basal cell or squamous cell cancers with minimal mortality impact
Melanoma is potentially a bad actor
▪ Diagnosed melanomas: 61,000 M:F 35,200:25,800 in 2010
▪ Deaths: 9,200 M:F 6,000:3,200
Incidence
© 2015 Munich American Reassurance Company. All rights reserved.
▪ Increased by 1.6% per year in white men, remained level in others
▪ Increased by 1.6% per year in white women, remained level in others
Mortality
▪ Increased by 1.0% per year in white men, remained level in others
Trends and implications: Melanoma
42
Education and screening has had an impact but this is likely being offset by
▪ Growth of aging population
▪ More outdoor activities
▪ Increasing residency in warmer climates
▪ Inadequate adherence to SPF protection measures
There is more data on mortality risk based on microscopic findings (stage, grade) at
diagnosis and other prognostic indicators
© 2015 Munich American Reassurance Company. All rights reserved.
▪ Improved offers for earlier stages with good prognosis markers
▪ Later stages remain problematic
▪ Newer therapies show promise
Challenges and Opportunities…
Heart Disease
Diabetes
Cancer: Breast , Lung, Colorectal, Prostate, Melanoma
Also on the disease trend horizon…
- HIV Disease – a treatable chronic disease?
- e Cigarettes – low or risk free?
- Gender identity – the Facebook response
- DTC Genetic testing – and consumer knowledge base
- Genetic Advances and Rare Diseases – potential social media impact
43© 2015 Munich American Reassurance Company. All rights reserved.
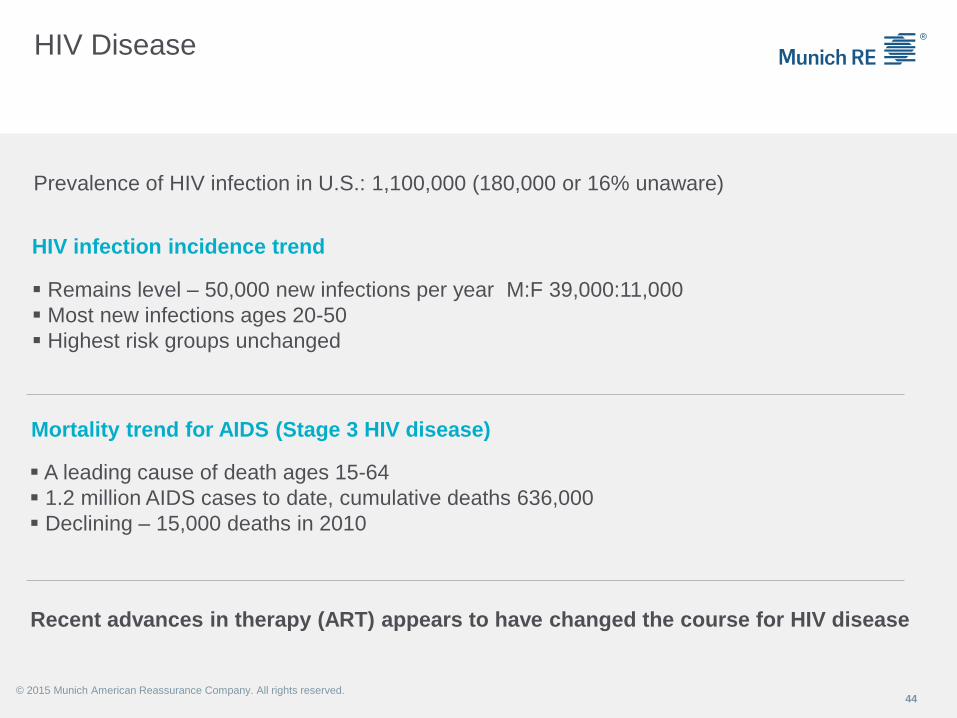
HIV Disease
44© 2015 Munich American Reassurance Company. All rights reserved.
Mortality trend for AIDS (Stage 3 HIV disease)
HIV infection incidence trend
▪ Remains level – 50,000 new infections per year M:F 39,000:11,000
▪ Most new infections ages 20-50
▪ Highest risk groups unchanged
▪ A leading cause of death ages 15-64
▪ 1.2 million AIDS cases to date, cumulative deaths 636,000
▪ Declining – 15,000 deaths in 2010
Prevalence of HIV infection in U.S.: 1,100,000 (180,000 or 16% unaware)
Recent advances in therapy (ART) appears to have changed the course for HIV disease
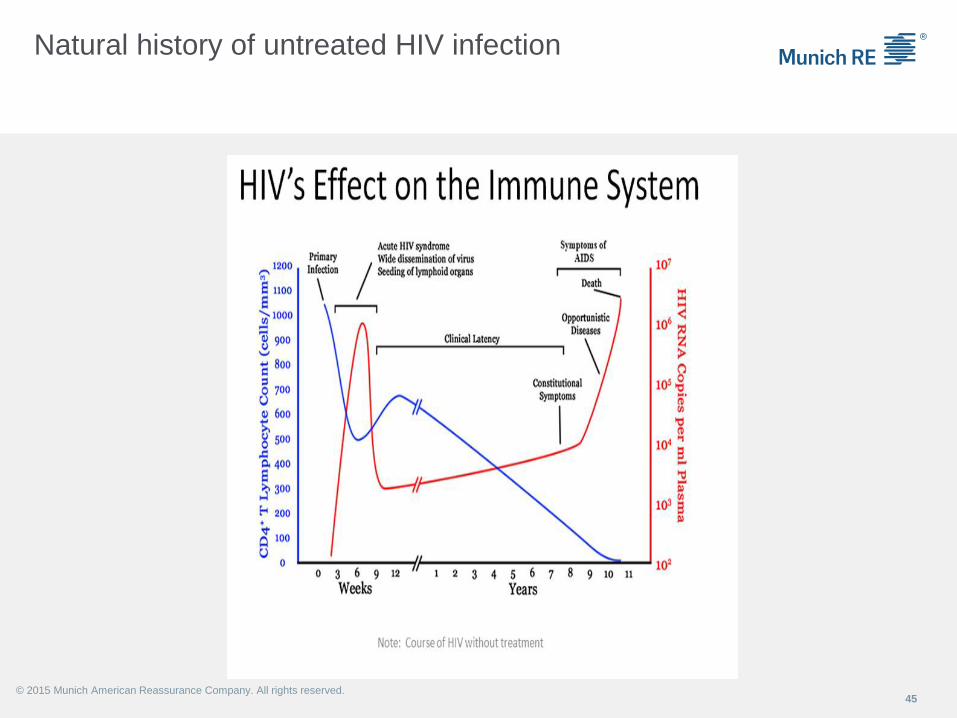
Natural history of untreated HIV infection
45© 2015 Munich American Reassurance Company. All rights reserved.

Trends and implications: HIV Disease
46© 2015 Munich American Reassurance Company. All rights reserved.
▪ Remarkable progress has been made in therapies since 1995
▪ The latest drug combo’s appear to be effective over the long term (so far) with
much more limited side effects than their predecessors
▪ There are reliable prognostic markers (CD4 count, HIV viral load, etc)
▪ Insurance (including whole life) is being offered in the US and abroad
▪ Just another chronic disease? Challenges include
▪ niche market
▪ the newer drug regimens are relatively novel (?2006)
▪ even if HIV is successfully suppressed, there appears to be some increased
risk for non-HIV related death (CAD, etc), i.e., premature aging
▪ A vaccine to prevent HIV infection seems a long way off.
▪ PreP for those at risk is here but not a panacea
▪A long-acting pre-exposure prophylactic medication may be available near term
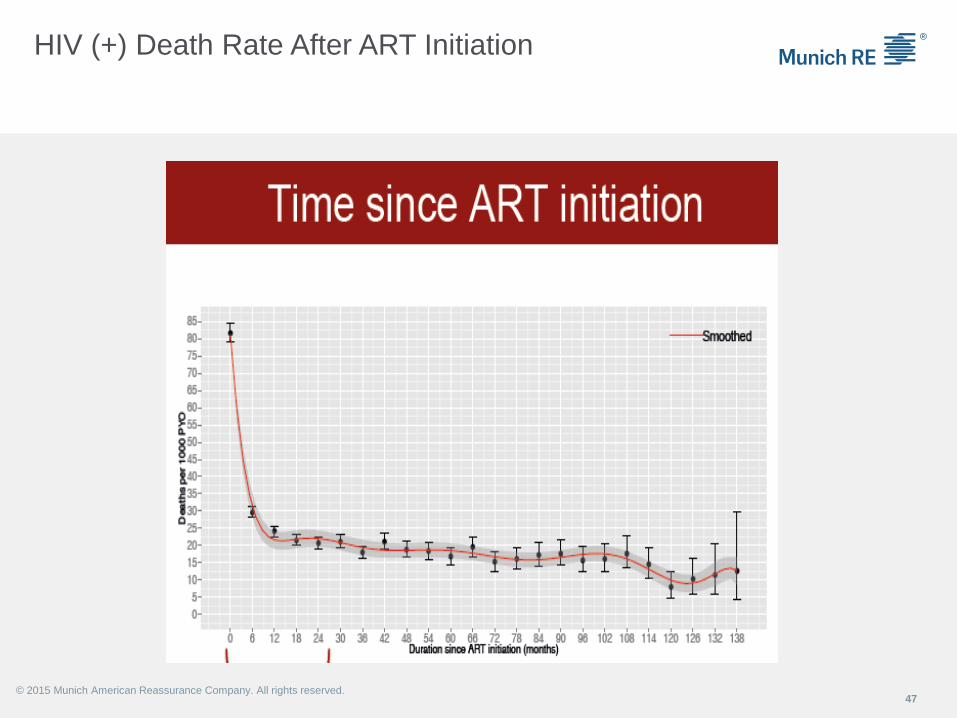
HIV (+) Death Rate After ART Initiation
47© 2015 Munich American Reassurance Company. All rights reserved.
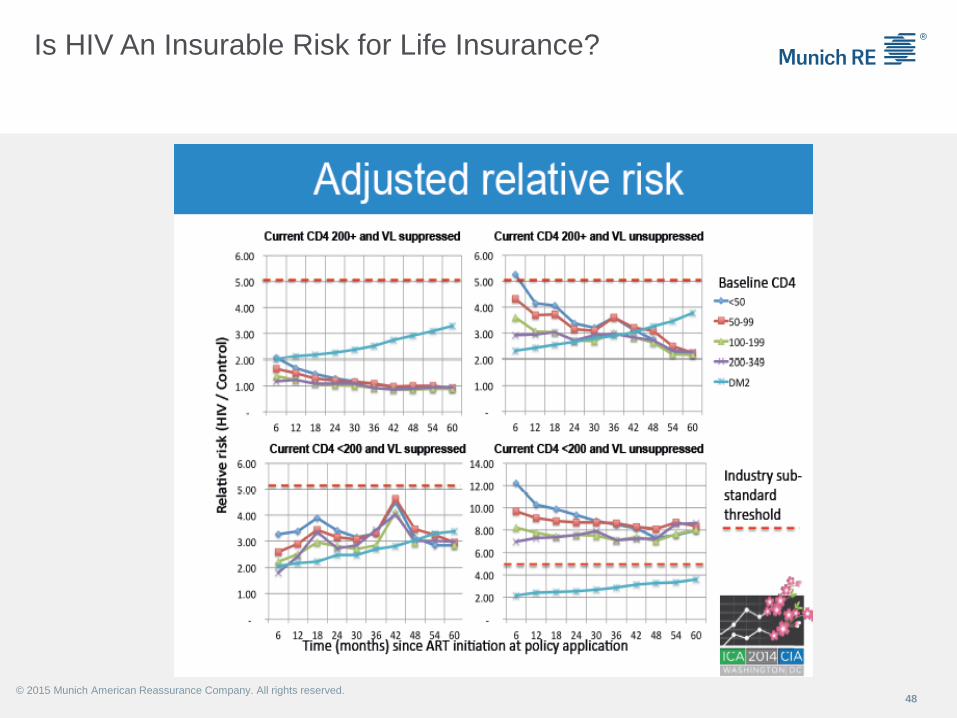
Is HIV An Insurable Risk for Life Insurance?
48© 2015 Munich American Reassurance Company. All rights reserved.
e-Cigarettes: ToB or not ToB
49© 2015 Munich American Reassurance Company. All rights reserved.
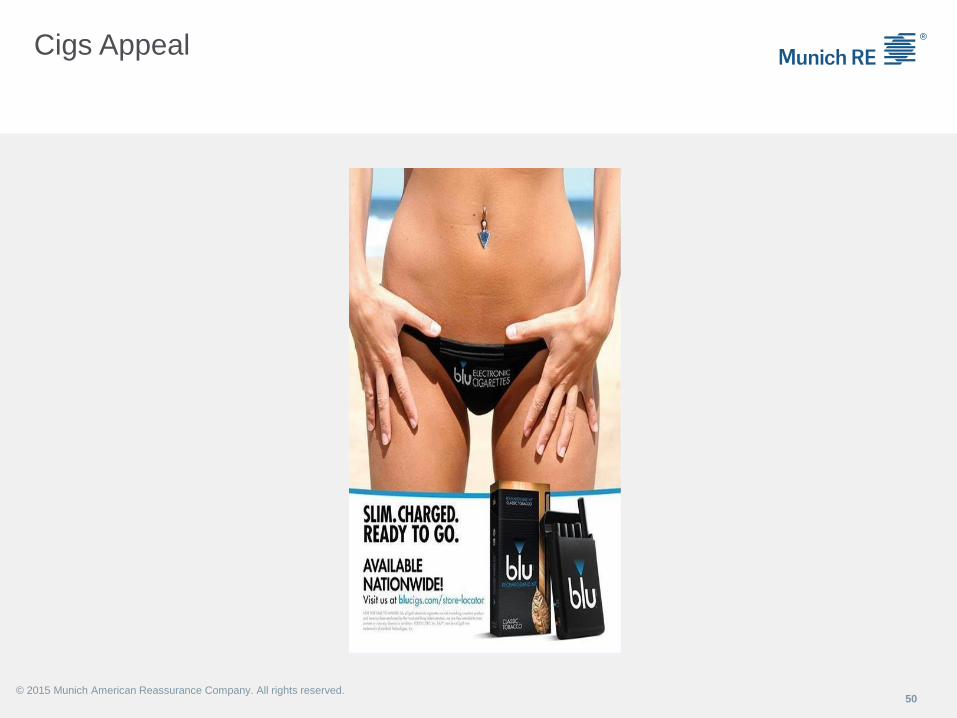
Cigs Appeal
50© 2015 Munich American Reassurance Company. All rights reserved.
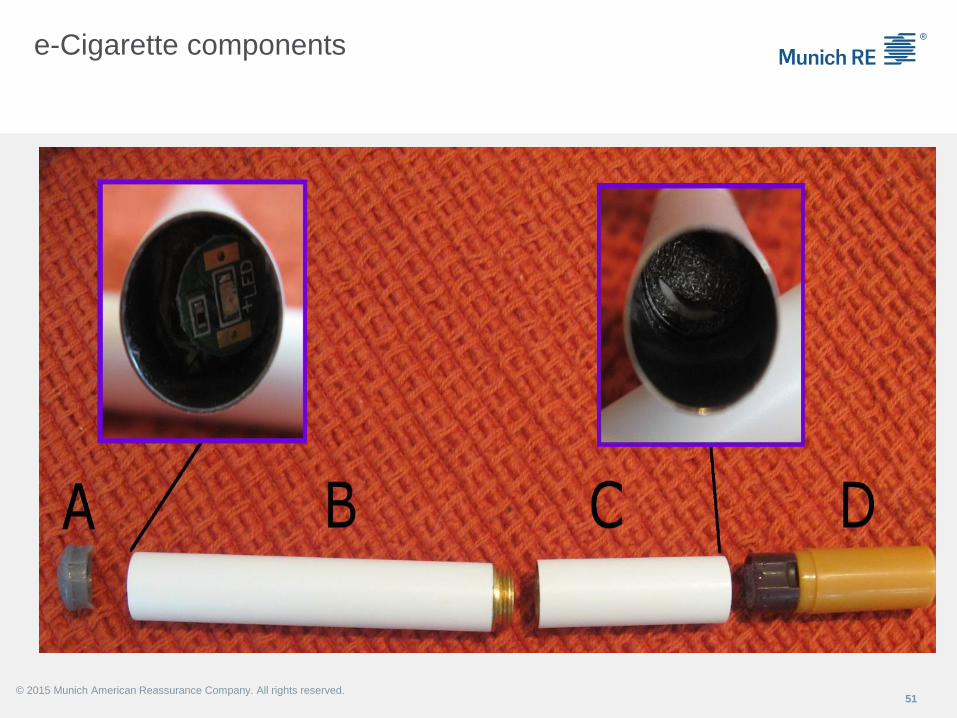
e-Cigarette components
51© 2015 Munich American Reassurance Company. All rights reserved.
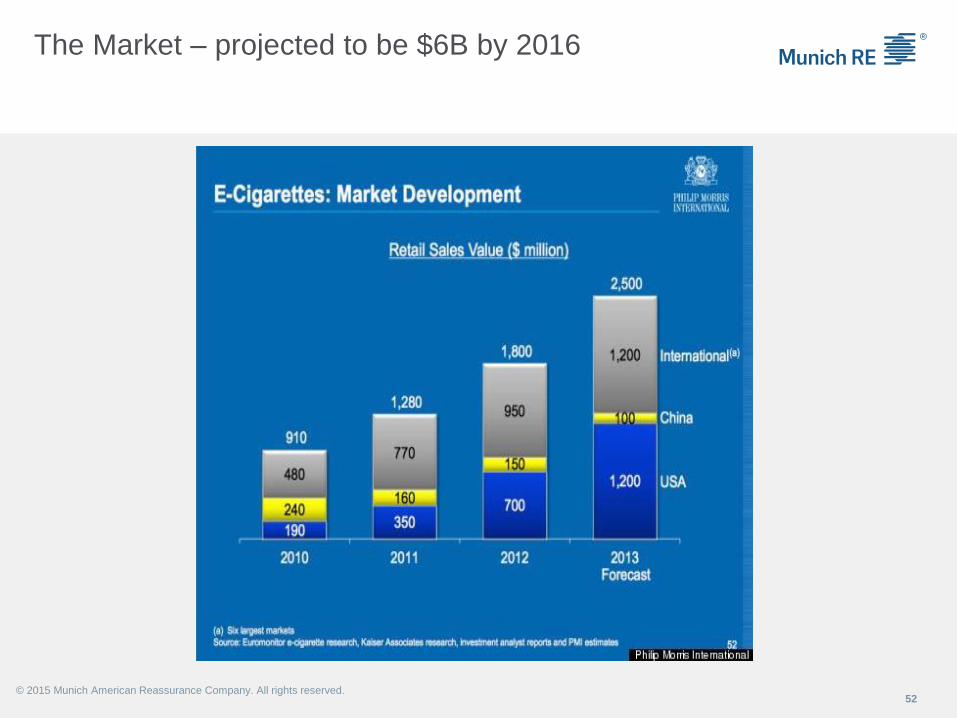
The Market – projected to be $6B by 2016
52© 2015 Munich American Reassurance Company. All rights reserved.
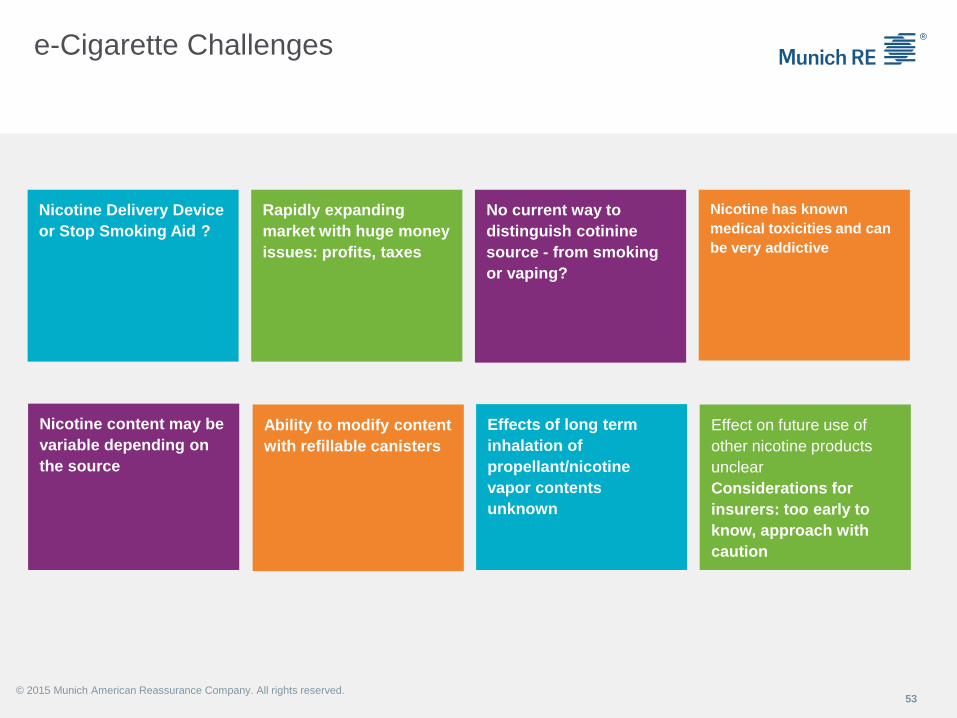
e-Cigarette Challenges
53
Nicotine Delivery Device
or Stop Smoking Aid ?
Rapidly expanding
market with huge money
issues: profits, taxes
No current way to
distinguish cotinine
source - from smoking
or vaping?
Nicotine has known
medical toxicities and can
be very addictive
Nicotine content may be
variable depending on
the source
Ability to modify content
with refillable canisters
Effects of long term
inhalation of
propellant/nicotine
vapor contents
unknown
Effect on future use of
other nicotine products
unclear
Considerations for
insurers: too early to
know, approach with
caution
© 2015 Munich American Reassurance Company. All rights reserved.
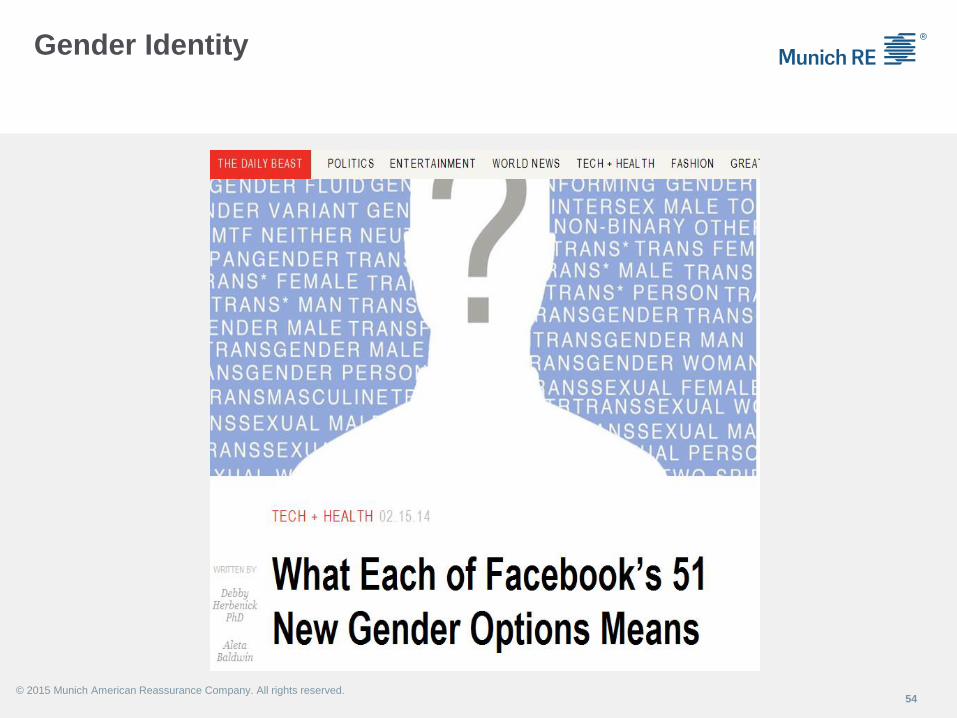
Gender Identity
54© 2015 Munich American Reassurance Company. All rights reserved.
Whose definition is it… anyway?
55
Gender identity vs. chromosomal make-up
▪ Which should prevail when applying for insurance?
▪ Activity in legislatures since 2013….
▪ Considerations for insurers –
▪ gender specific conditions remain, e.g., prostate cancer, ovarian cancer, breast
cancer
▪ supplemental hormone use side effects, tobacco, substance abuse
▪ co-morbid mental health issues may be part of the picture in some cases
▪ insurability may be more dependent on product line and co-morbidities
© 2015 Munich American Reassurance Company. All rights reserved.

Genetic testing
56
Genetic information
57
Medical, legal, social debates likely to re-surface
▪ Who can view a person’s genetic information?
▪ What constitutes genetic information?
Insurers consider genetic information part of routine medical information
Improving genetic tests (now at the research level) will highlight the issues
© 2015 Munich American Reassurance Company. All rights reserved.
▪ Become less costly to perform
▪ Direct to consumer testing (23 and me, etc) is far from perfect - now
▪ Genetic links to uncommon disorders are being uncovered
▪ Medical and actuarial data for uncommon disorders remain limited
Insurers will want to continue to “Do The Right Thing” but difficult challenges lie ahead
Rare Diseases: A Significant Underwriting Challenge
Ahead?
1. Rare disease defined
2. Challenge for insurance industry
3. Rare disease – patient perspective
4. Rare disease – medical perspective
5. Industry challenges ...and opportunities
© 2015 Munich American Reassurance Company. All rights reserved.
Exceptionally rare
▪ Rarest disease in the world
▪ One single diagnosed patient born in 1984
▪ No other patient since publication of the disease in 1999
Ribose-5-phosphate isomerase deficiency
© 2015 Munich American Reassurance Company. All rights reserved.
Rare ….but well known
▪ Cystic Fibrosis
▪ ALS (Steven Hawking)
▪ Sjögren Syndrome (Venus Williams)
▪ Parkinson‘s Disease (Michael J. Fox)
▪ Churg-Strauss-Syndrome (Taku Takeuchi)
60© 2015 Munich American Reassurance Company. All rights reserved.
Characteristics of rare diseases
▪ 80% genetic, hence generally chronic by nature
▪ May become apparent (symptomatic) at different ages, at birth or later
▪ 20% infectious or not genetic, may be transient
© 2015 Munich American Reassurance Company. All rights reserved.
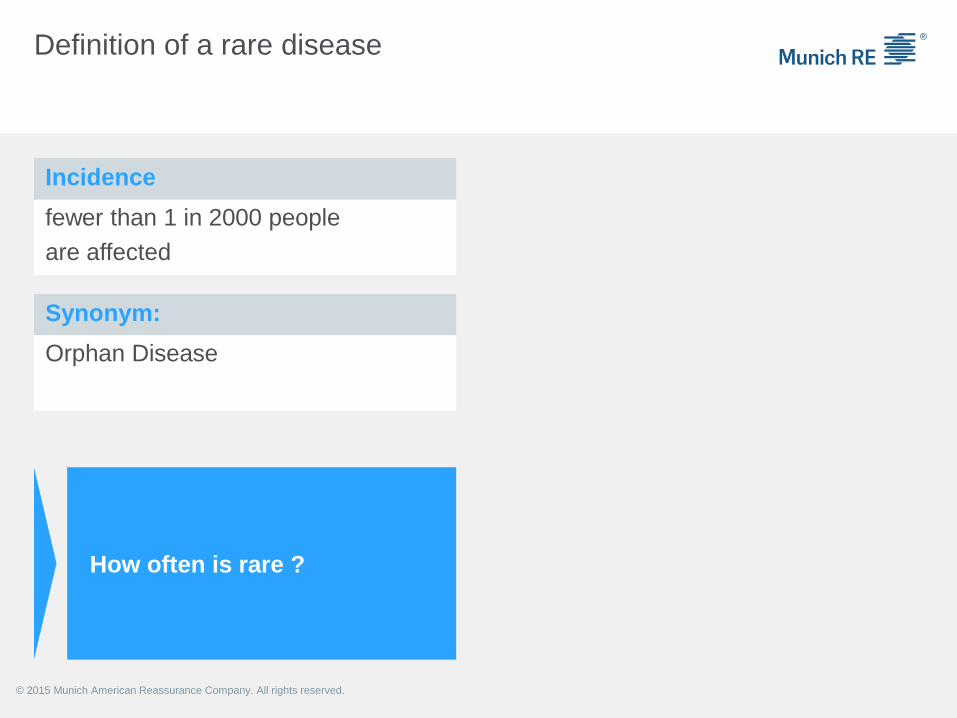
Definition of a rare disease
fewer than 1 in 2000 people
are affected
How often is rare ?
Incidence
Synonym:
Orphan Disease
© 2015 Munich American Reassurance Company. All rights reserved.
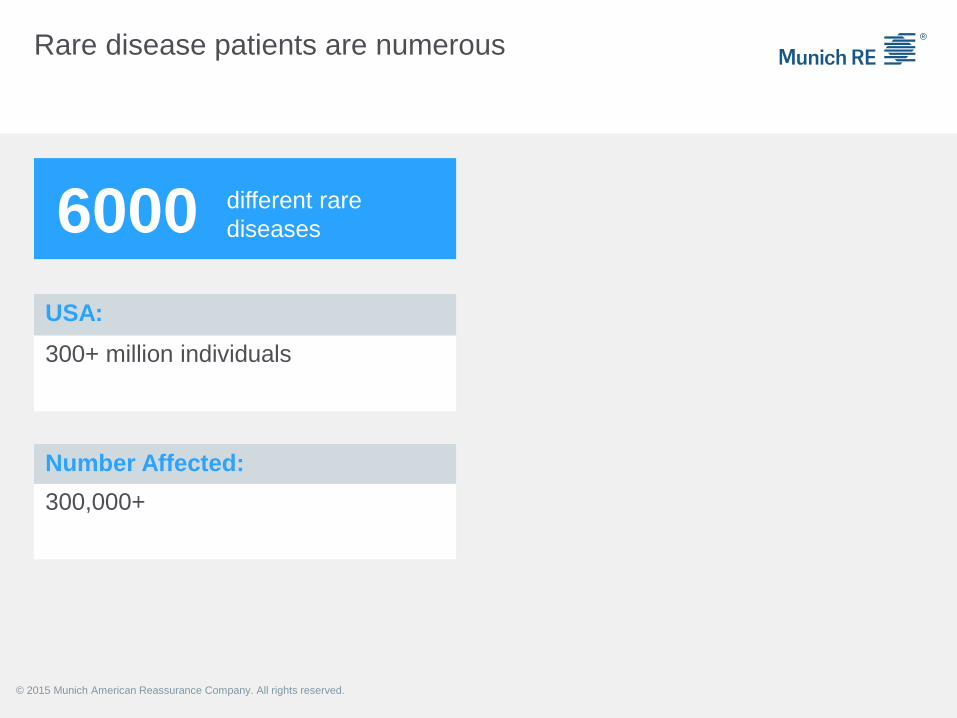
Rare disease patients are numerous
300+ million individuals
6000 different rare
diseases
USA:
Number Affected:
300,000+
© 2015 Munich American Reassurance Company. All rights reserved.
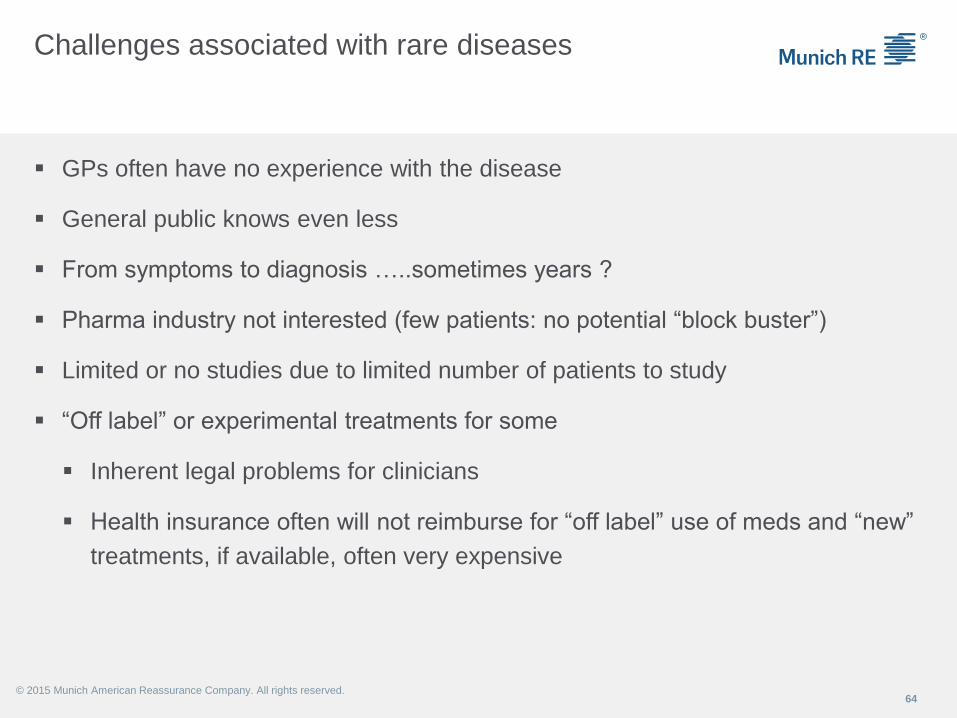
Challenges associated with rare diseases
▪ GPs often have no experience with the disease
▪ General public knows even less
▪ From symptoms to diagnosis …..sometimes years ?
▪ Pharma industry not interested (few patients: no potential “block buster”)
▪ Limited or no studies due to limited number of patients to study
▪ “Off label” or experimental treatments for some
▪ Inherent legal problems for clinicians
▪ Health insurance often will not reimburse for “off label” use of meds and “new”
treatments, if available, often very expensive
64© 2015 Munich American Reassurance Company. All rights reserved.
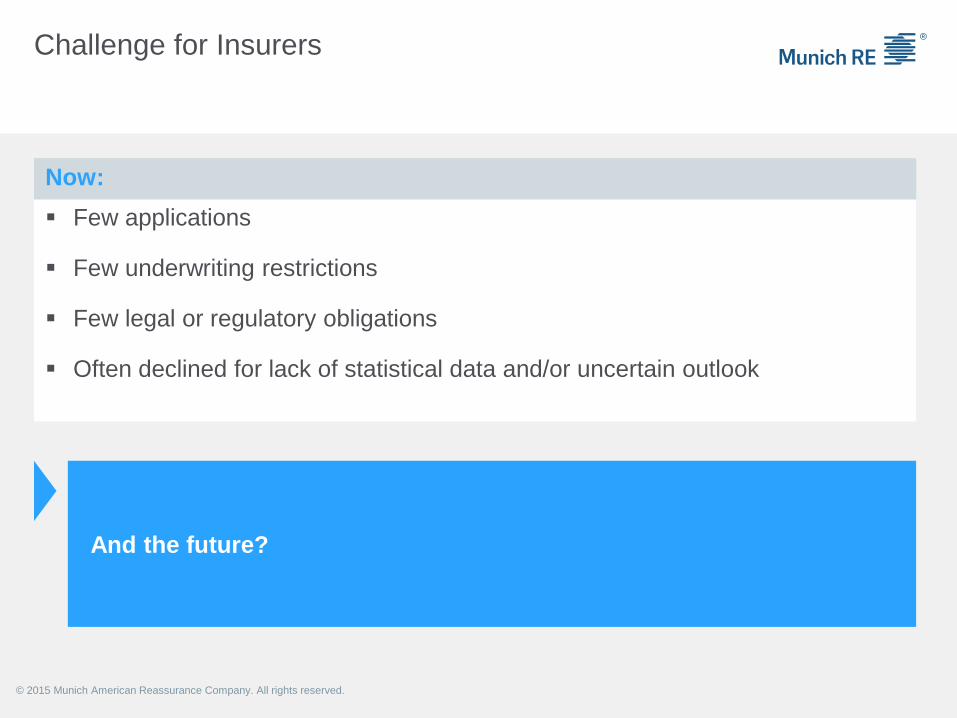
Now:
Challenge for Insurers
▪ Few applications
▪ Few underwriting restrictions
▪ Few legal or regulatory obligations
▪ Often declined for lack of statistical data and/or uncertain outlook
And the future?
© 2015 Munich American Reassurance Company. All rights reserved.
Challenge for Insurers
Challenge for insurance industry
Whole genome sequencing
Year 2020: most “idiopathic diseases”
will be classified as “genetic diseases”
Expected: up to 10% of the population
may be diagnosed with rare disease
Good news: New treatment options, better
prognosis, more will become insurable
More and more rare diseases are being discovered
© 2015 Munich American Reassurance Company. All rights reserved.
Challenge for Insurers
Challenge for insurance industry
High organizational level with
global networks via social media
Increased expectation for
justification of underwriting
decisions
Reputational risk for insurers and
reinsurers if an applicant with
a rare disease is considered unfairly
treated
Increasingly Linked Interest groups and regulators
© 2015 Munich American Reassurance Company. All rights reserved.
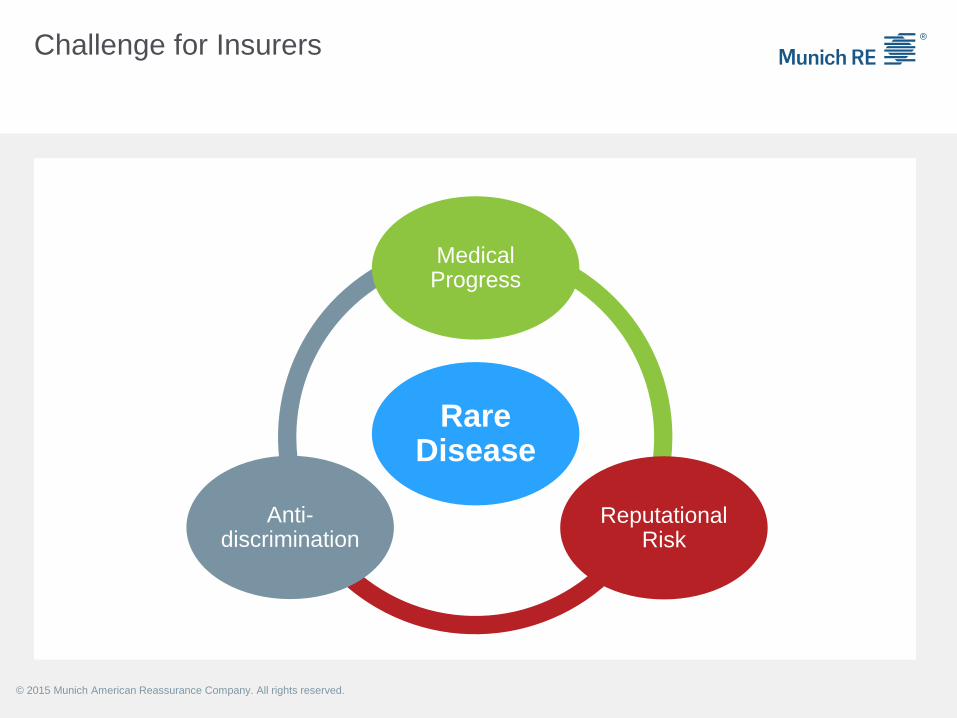
Challenge for Insurers
Rare Disease
Medical Progress
Reputational Risk
Anti-discrimination
© 2015 Munich American Reassurance Company. All rights reserved.
Challenge for Insurers
▪ The ideal: underwriting decisions should be individualized, consistent and –
as much as possible – based on medical evidence
▪ Decline based on lack of statistical data may no longer go unchallenged
Going forward:
© 2015 Munich American Reassurance Company. All rights reserved.
Challenge for Insurers
Challenge for insurance industry Evidence-Based Risk Assessment Today
Limited or no manual guidance for
rare diseases
Limited long-term clinical studies
Limited experiential data
Added medical expertise will be
essential
© 2015 Munich American Reassurance Company. All rights reserved.
Opportunity for Insurers
Doctors’ approachAnticipate the challenges coming
Facilitate research
Develop standards and
share morbidity and mortality findings
with the underwriting community and
clinicians as well
© 2015 Munich American Reassurance Company. All rights reserved.
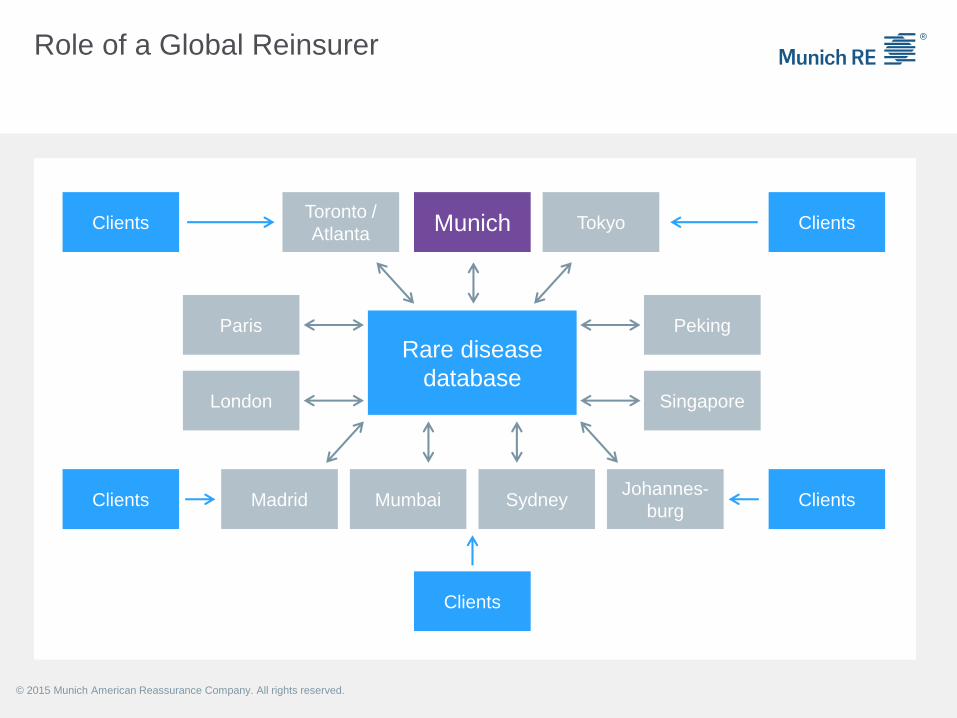
Role of a Global Reinsurer
Rare disease
database
MunichToronto /
AtlantaClients Tokyo Clients
ClientsClients
Clients
Paris
London
Peking
Singapore
Madrid Mumbai SydneyJohannes-
burg
© 2015 Munich American Reassurance Company. All rights reserved.

Global Approach
Better understand risks associated with rare or uncommon diseases
▪ Provide a globally consistent approach
▪ Provide actuarial or at least the best of known experience-based medical
opinions for underwriting of rare risks
▪ Advance the Industry
Munich Re Rare Disease Database
© 2015 Munich American Reassurance Company. All rights reserved.

Opportunity for Insurers – Rare Diseases
Be prepared to respond to an evolving market
• Determine insurability on evidence available
•Where feasible, offer a product that both meets an applicant’s needs and provides
an acceptable return
• Add to the Industry (and clinical) knowledge base
© 2015 Munich American Reassurance Company. All rights reserved.

Thank you
Mark Skillan, M.D.
© 2
012 M
ünchener
Rückvers
icheru
ngs-G
esellschaft ©
2012 M
unic
h R
ein
sura
nce C
om
pany


