
DISASTERS AND MEGACITIES: CRITICAL GEOGRAPHIES OF FLOOD
HAZARDS & SOCIAL INEQUITIES IN THE CASE OF METRO MANILA
Doracie
B. Zoleta‐Nantes, PhDResearch Fellow and Convener of Master of Natural Hazards
Resource Management in Asia‐Pacific ProgramCrawford School, College of Asia and the Pacific
The Australian National University
This seminar will address the following concerns:
• Are big cities becoming more hazardous?
• How do environmental processes and change influence the geography of risk and
vulnerability in megacities?
• How have Metro Manila’s uneven development and formation of ethnic enclaves
with different economic opportunities and political capacity contributed to the
degradation of its environmental landscapes and marginalization of some cultural
groups?
• How have decades of inappropriate planning and poor management of
infrastructure development programs in the megacity contributed to the scale of
the September 2009 flood disaster that was triggered by Typhoon Ondoy
(also
known as Tropical Storm Ketsana)?
• What creative approaches and effective solutions can be undertaken to reduce
the increasing propensity of Metro Manila to hazardous flooding and mitigate its
impacts among the most vulnerable groups?

Urbanisation
• the expansion of urban areas
• increasing concentration of people in urban centers due to natural increase in population and
migration of people from rural areas to city centers.
• In 1804, there were about I billion people; only 3% of this total lived in cities
• In 1999, there were about 6 billion people; 47% of the total lived in urban centers
• the world's urban population will double every 38 years.
• By 2030 The UN forecasts that the urban population will rise to nearly 5 billion, or three out of
five people will be in cities
• Sources:• http://www.un.org/esa/population/publications/popnews/Newsltr_87.pdf• http://www.census.gov/ipc/www/idb/worldpopinfo.php• http://en.wikipedia.org/wiki/File:Urbanized_population_2006.png
Some definitions
• Hazard
‐the intrinsic unavoidable natural occurrence of something that may
cause adversities
• Risk ‐
combination of the probability of an event and its negative
consequences; hazard X elements at risk X vulnerability
• Vulnerability ‐
characteristics and circumstances that make a community,
system, or asset susceptible to the damaging effects of a hazard
• Disaster ‐
A serious disruption of the functioning of a community or a society …
which exceeds their ability to cope using its own resources
• Mitigation
‐
lessening or limitation of the adverse impacts of hazards and
related disasters
Source:• United Nation’s International Disaster Strategy for Disaster Reduction
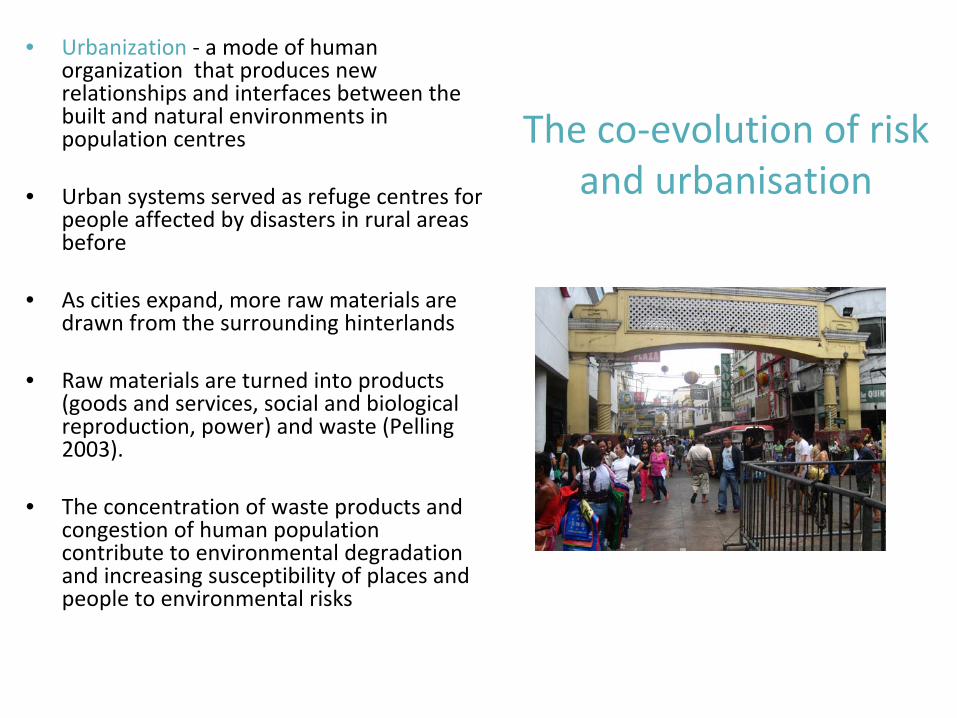
The co‐evolution of risk and urbanisation
• Urbanization ‐
a mode of human
organization that produces new
relationships and interfaces between the
built and natural environments in
population centres
• Urban systems served as refuge centres for
people affected by disasters in rural areas
before
• As cities expand, more raw materials are
drawn from the surrounding hinterlands
• Raw materials are turned into products
(goods and services, social and biological
reproduction, power) and waste (Pelling
2003).
• The concentration of waste products and
congestion of human population
contribute to environmental degradation
and increasing susceptibility of places and
people to environmental risks
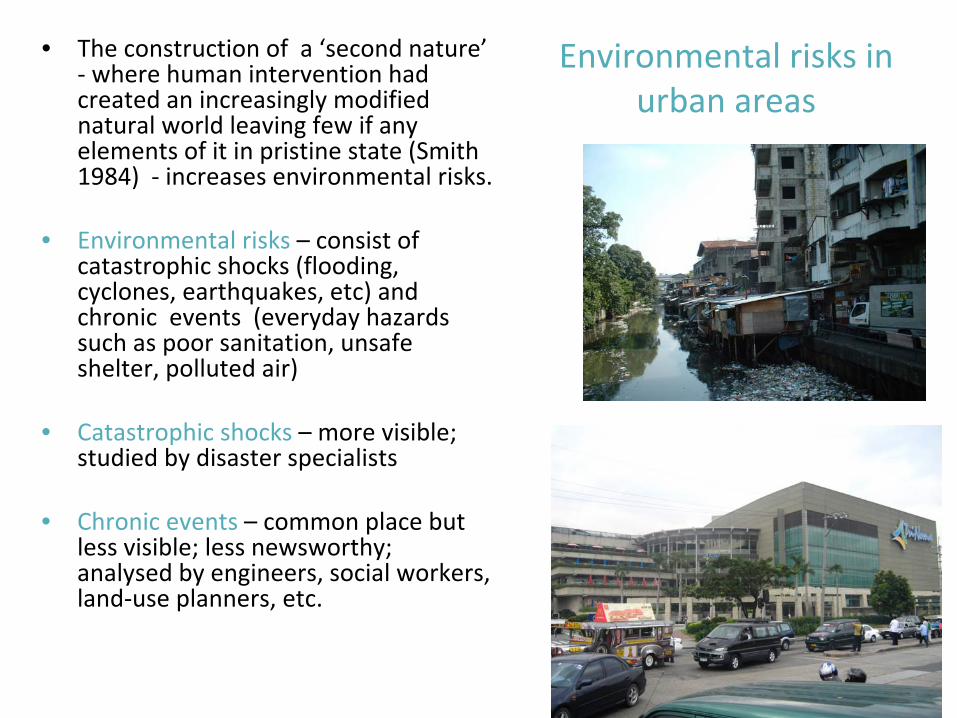
Environmental risks in urban areas
• The construction of a ‘second nature’
‐
where human intervention had
created an increasingly modified
natural world leaving few if any
elements of it in pristine state (Smith
1984) ‐
increases environmental risks.
• Environmental risks
–
consist of
catastrophic shocks (flooding,
cyclones, earthquakes, etc) and
chronic events (everyday hazards
such as poor sanitation, unsafe
shelter, polluted air)
• Catastrophic shocks
– more visible;
studied by disaster specialists
• Chronic events
–
common place but
less visible; less newsworthy;
analysed by engineers, social workers,
land‐use planners, etc.
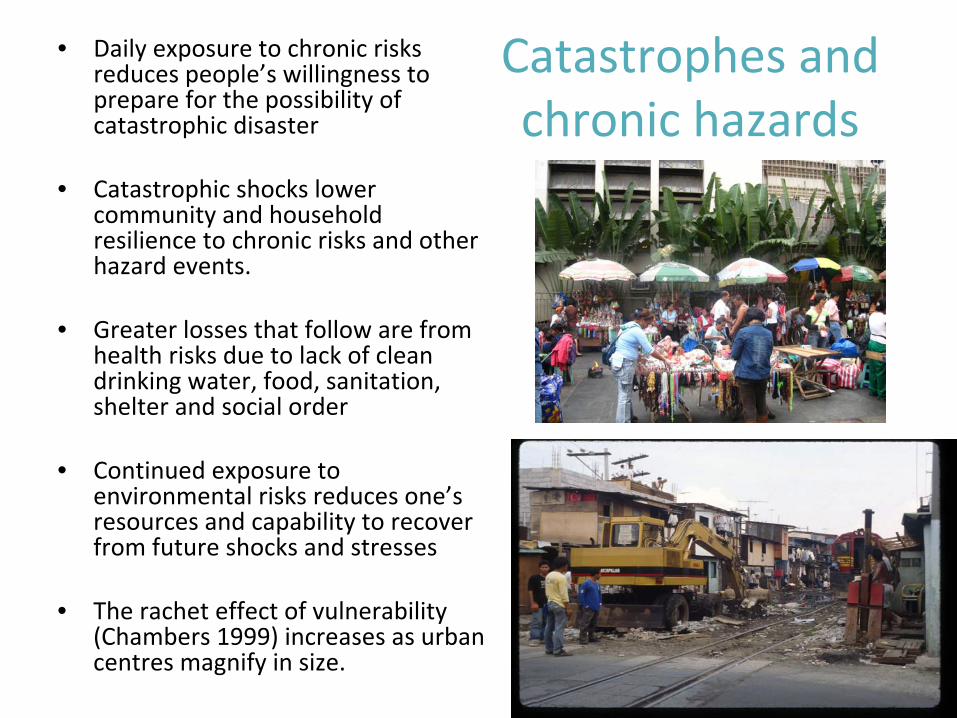
Catastrophes and chronic hazards
• Daily exposure to chronic risks
reduces people’s willingness to
prepare for the possibility of
catastrophic disaster
• Catastrophic shocks lower
community and household
resilience to chronic risks and other
hazard events.
• Greater losses that follow are from
health risks due to lack of clean
drinking water, food, sanitation,
shelter and social order
• Continued exposure to
environmental risks reduces one’s
resources and capability to recover
from future shocks and stresses
• The rachet
effect of vulnerability
(Chambers 1999) increases as urban
centres magnify in size.
Megacities and disasters
• A megacity is a large population center consisting of a metropolitan area,
or a conurbation of two metropolitan areas and its adjacent zone
of
influence
• It has a population in excess of 8 million (Nichols, 1995) to 10
million
(Hardoy, Mitlin
and Satterthwaite, 1992).
• It is synonymous with the term megalopolis
• At the start of the 21st
century, there were 18 megacities
• Megacities increasingly become the locus of risks (Mitchell 1999)
• Occurrence of catastrophic and chronic risks become a predominant
feature of megacities
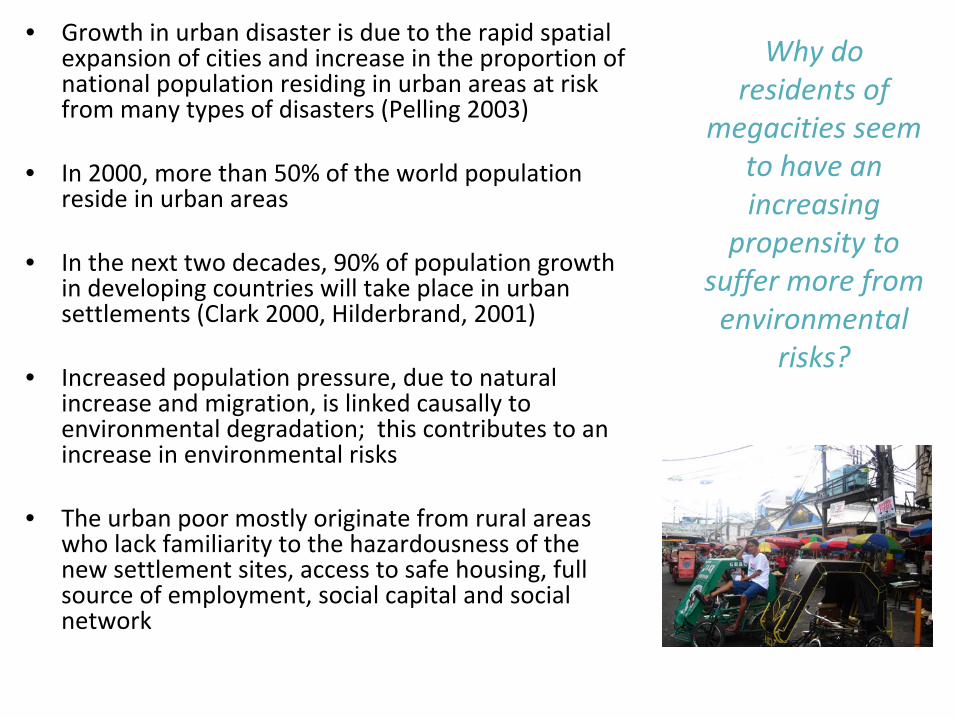
Why do
residents of
megacities seem
to have an
increasing
propensity to
suffer more from
environmental
risks?
• Growth in urban disaster is due to the rapid spatial
expansion of cities and increase in the proportion of
national population residing in urban areas at risk
from many types of disasters (Pelling
2003)
• In 2000, more than 50% of the world population
reside in urban areas
• In the next two decades, 90% of population growth
in developing countries will take place in urban
settlements (Clark 2000, Hilderbrand, 2001)
• Increased population pressure, due to natural
increase and migration, is linked causally to
environmental degradation; this contributes to an
increase in environmental risks
• The urban poor mostly originate from rural areas
who lack familiarity to the hazardousness of the
new settlement sites, access to safe housing, full
source of employment, social capital and social
network
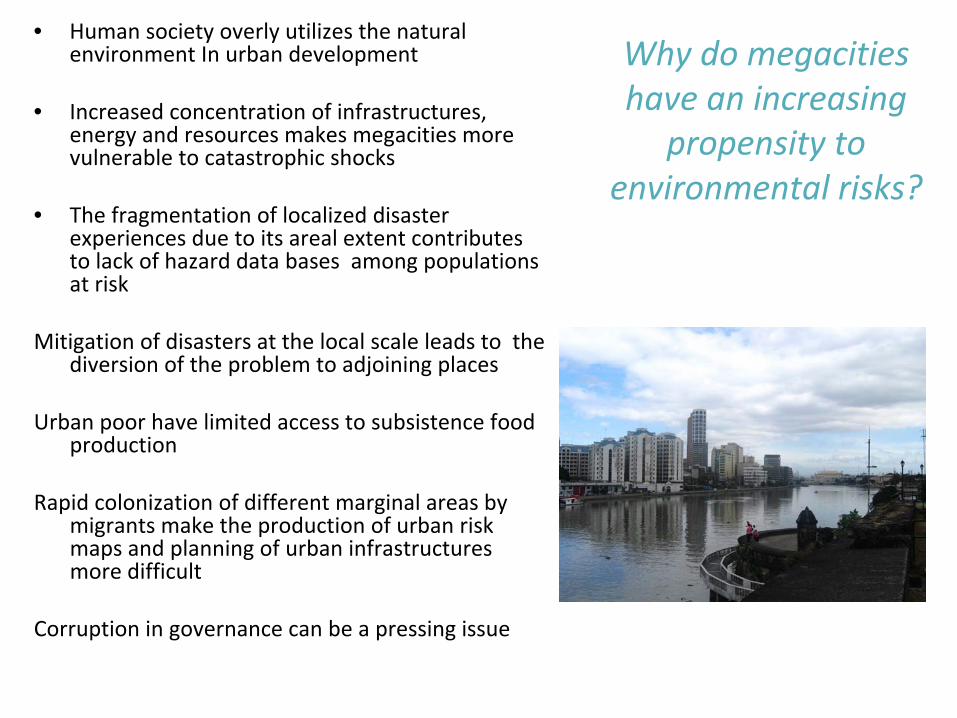
Why do megacities have an increasing propensity to
environmental risks?
• Human society overly utilizes the natural
environment In urban development
• Increased concentration of infrastructures,
energy and resources makes megacities more
vulnerable to catastrophic shocks
• The fragmentation of localized disaster
experiences due to its areal extent contributes
to lack of hazard data bases among populations
at risk
Mitigation of disasters at the local scale leads to the
diversion of the problem to adjoining places
Urban poor have limited access to subsistence food
production
Rapid colonization of different marginal areas by
migrants make the production of urban risk
maps and planning of urban infrastructures
more difficult
Corruption in governance can be a pressing issue
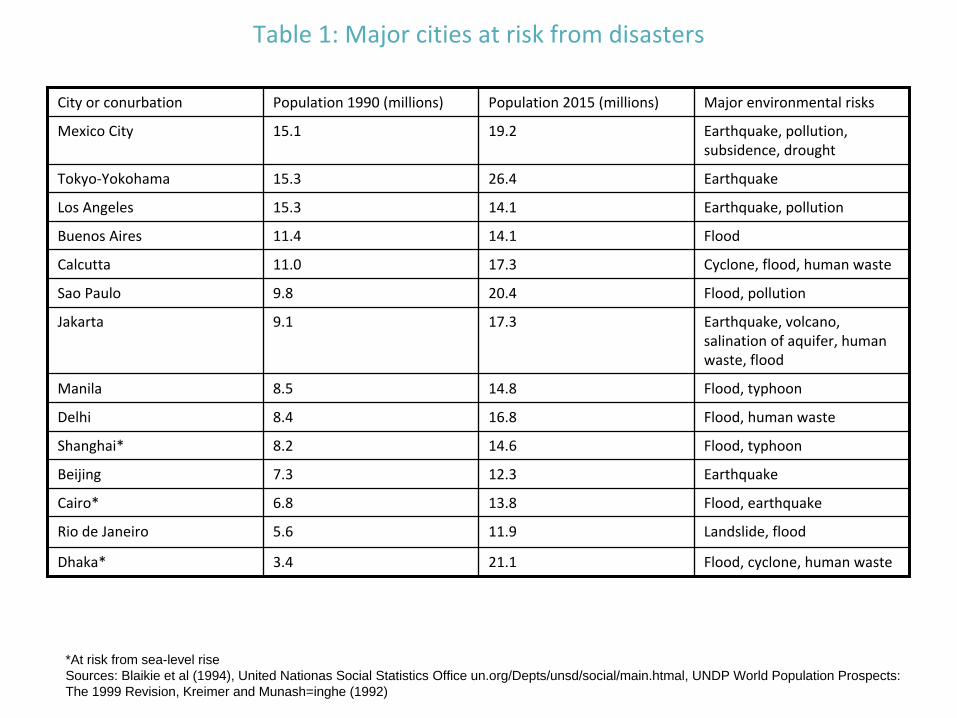
Table 1: Major cities at risk from disasters
City or conurbation Population 1990 (millions) Population 2015 (millions) Major environmental risks
Mexico City 15.1 19.2 Earthquake, pollution,
subsidence, drought
Tokyo‐Yokohama 15.3 26.4 Earthquake
Los Angeles 15.3 14.1 Earthquake, pollution
Buenos Aires 11.4 14.1 Flood
Calcutta 11.0 17.3 Cyclone, flood, human waste
Sao Paulo 9.8 20.4 Flood, pollution
Jakarta 9.1 17.3 Earthquake, volcano,
salination
of aquifer, human
waste, flood
Manila 8.5 14.8 Flood, typhoon
Delhi 8.4 16.8 Flood, human waste
Shanghai* 8.2 14.6 Flood, typhoon
Beijing 7.3 12.3 Earthquake
Cairo* 6.8 13.8 Flood, earthquake
Rio de Janeiro 5.6 11.9 Landslide, flood
Dhaka* 3.4 21.1 Flood, cyclone, human waste
*At risk from sea-level riseSources: Blaikie et al (1994), United Nationas Social Statistics Office un.org/Depts/unsd/social/main.htmal, UNDP World Population Prospects: The 1999 Revision, Kreimer and Munash=inghe (1992)

The case of Metro Manila, the Philippines
• Uneven regional
development
• Formation of ethnic
enclaves
• Degradation of
environmental landscapes
• Marginalisation of cultural
groups
• Increasing propensity to
flood hazards
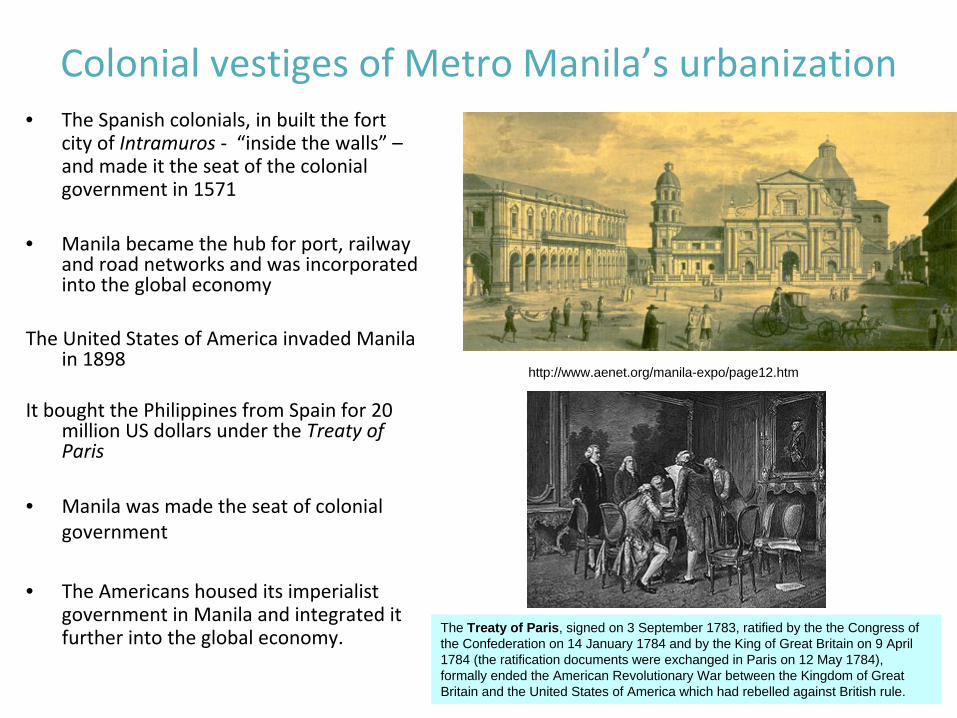
Colonial vestiges of Metro Manila’s urbanization• The Spanish colonials, in built the fort
city of Intramuros
‐
“inside the walls”
–
and made it the seat of the colonial
government in 1571
• Manila became the hub for port, railway
and road networks and was incorporated
into the global economy
The United States of America invaded Manila
in 1898
It bought the Philippines from Spain for 20
million US dollars under the Treaty of
Paris
• Manila was made the seat of colonial
government
• The Americans housed its imperialist
government in Manila and integrated it
further into the global economy.
http://www.aenet.org/manila-expo/page12.htm
The Treaty of Paris, signed on 3 September 1783, ratified by the the Congress of the Confederation on 14 January 1784 and by the King of Great Britain on 9 April 1784 (the ratification documents were exchanged in Paris on 12 May 1784), formally ended the American Revolutionary War between the Kingdom of Great Britain and the United States of America which had rebelled against British rule.

• On May 29, 1976
(through PD 940), Metro
Manila became the
Philippines’
National
Capital Region.
• An urban conurbation in
Asia.
• 16 autonomous cities and
one municipality.
• Land area of 63, 600
hectares is densely
settled
• Depends on resources
coming from nearby
spaces and all other
places for its daily
operations and existence
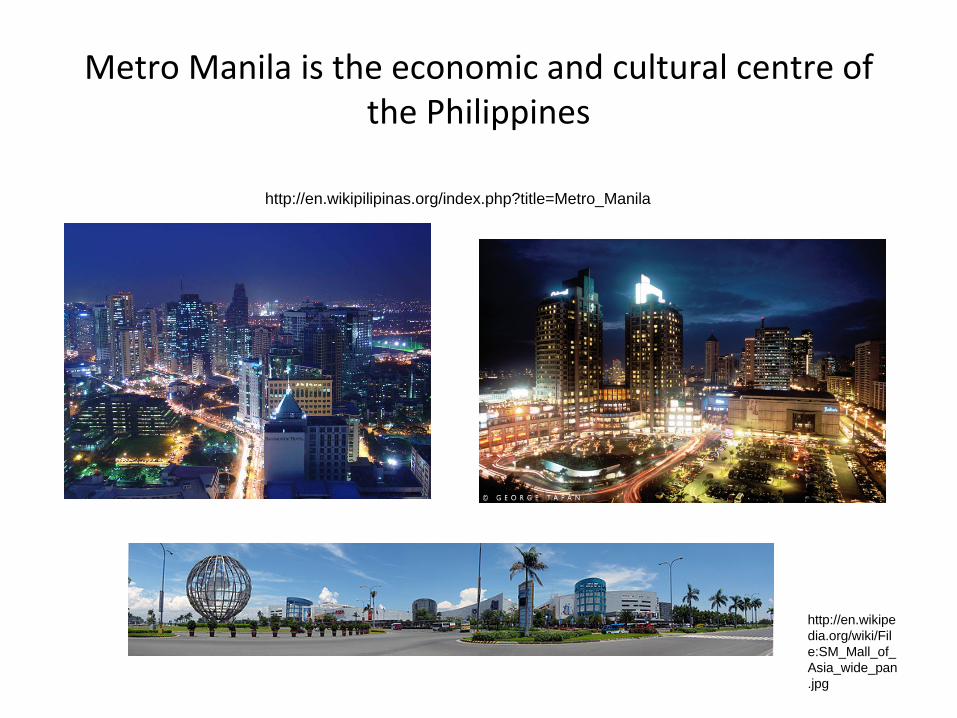
Metro Manila is the economic and cultural centre of the Philippines
http://en.wikipilipinas.org/index.php?title=Metro_Manila
http://en.wikipe dia.org/wiki/Fil e:SM_Mall_of_ Asia_wide_pan .jpg

70% of poor Filipinos live in the rural areas
The region with the highest percentage of poor families are:
ARMM (67.3 per cent); Bicol (61 per cent); and Central Mindanao (56.1 per cent.
Four ARMM provinces are among the top ten poorest provinces in the country (FIES 2000).
The average family income among urban residents is PHP 204,977 (AUD 4960.44) while it is PHP 85,373 (AUD 2066.03) among rural residents.
The Philippines

The Philippines
35.79 million persons are in the labor force; 35.8% is employed in agriculture in 2004; 46 % in 1990.
• Philippine Agriculture contributes 18.7% of the total GDP in 2006.
• Top export products are coconut oil (Netherlands and USA), banana (Japan), and pineapple (USA).
Photographs of the Philippine Department of Agriculture
A typical farming system consists of a major crop and a few livestock such as pigs and poultry, with rice, corn and coconut as composite crops.
A good mixture of small, medium and large farms, owned and managed by single families.
From about 3.6 hectares in the 1960s and 1970s, the average farm size declined to 2.8 hectares in the 1990s (Ravago and Cruz 2004)
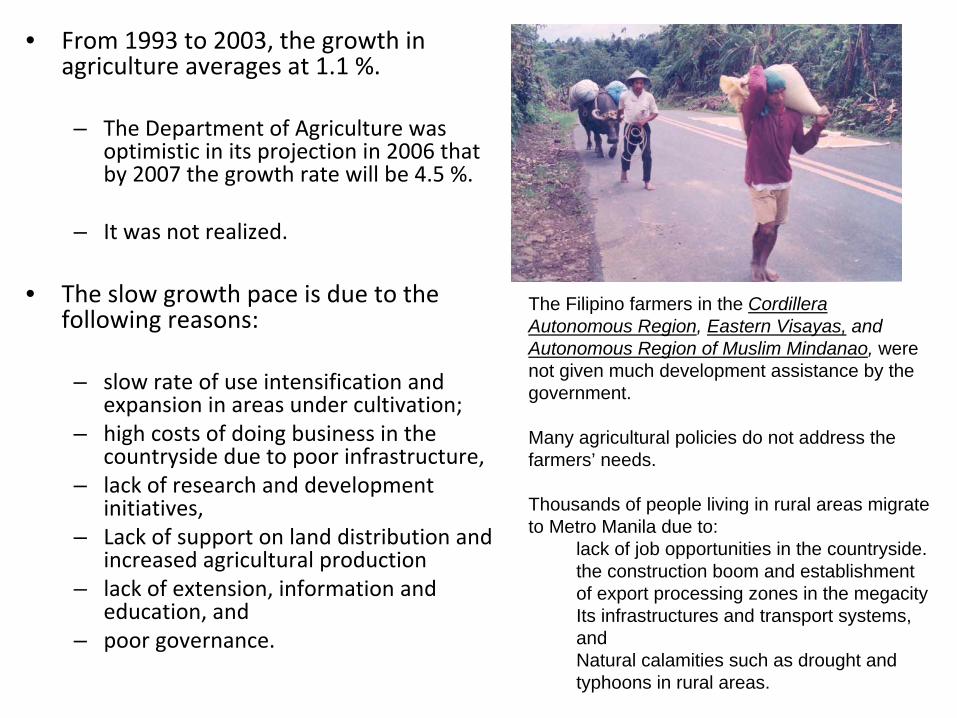
• From 1993 to 2003, the growth in
agriculture averages at 1.1 %.
– The Department of Agriculture was
optimistic in its projection in 2006 that
by 2007 the growth rate will be 4.5 %.
– It was not realized.
• The slow growth pace is due to the
following reasons:
– slow rate of use intensification and
expansion in areas under cultivation;
– high costs of doing business in the
countryside due to poor infrastructure,
– lack of research and development
initiatives,
– Lack of support on land distribution and
increased agricultural production
– lack of extension, information and
education, and
– poor governance.
The Filipino farmers in the Cordillera Autonomous Region, Eastern Visayas, and Autonomous Region of Muslim Mindanao, were not given much development assistance by the government.
Many agricultural policies do not address the farmers’ needs.
Thousands of people living in rural areas migrate to Metro Manila due to:
lack of job opportunities in the countryside.the construction boom and establishment of export processing zones in the megacityIts infrastructures and transport systems, andNatural calamities such as drought and typhoons in rural areas.

There is a big difference in the conditions in Metro Manila and other places in the
Philippine countryside.
The overconcentration of development infrastructure, utilities and services in the
business districts of Metro Manila is matched by a scarcity of sufficient transport
systems and development infrastructures in rural Philippines.
Economic primacyRate of urbanization in the Philippines was:
30 % in 1960; 54% in 1995; and
61 % by 2010.
Over 12 million residents; 14 % of the country’s total population.
In 2007, it generated 33 % of the country’s Gross Domestic Product (GDP) – PhP 2.479 billion or AUD 59.99 million.
Industrial and manufacturing activities are concentrated in the NCR
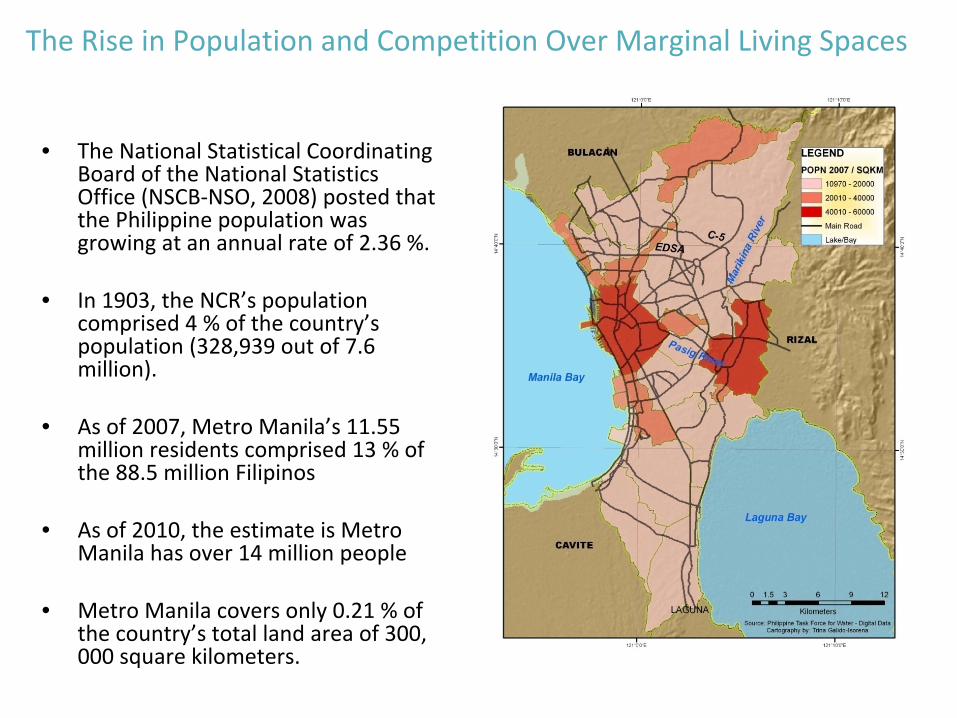
• The National Statistical Coordinating
Board of the National Statistics
Office (NSCB‐NSO, 2008) posted that
the Philippine population was
growing at an annual rate of 2.36 %.
• In 1903, the NCR’s population
comprised 4 % of the country’s
population (328,939 out of 7.6
million).
• As of 2007, Metro Manila’s 11.55
million residents comprised 13 % of
the 88.5 million Filipinos
• As of 2010, the estimate is Metro
Manila has over 14 million people
• Metro Manila covers only 0.21 % of
the country’s total land area of 300,
000 square kilometers.
The Rise in Population and Competition Over Marginal Living Spaces

Table 2: Percentage share of the National Capital Region on the total population of the Philippines from 1903‐
2007.
Source: National Statistical Coordination Board, National Statistics Office, 2008.
Year Philippines NCR Percentage
1903 7,635,426 328,939 4.31
1918 10,314,310 461,166 4.47
1939 16,000,303 993,889 6.21
1948 19,234,182 1,569,128 8.16
1960 27,087,685 2,462,488 9.09
1970 36,684,486 3,966,695 10.81
1975 42,070,660 4,970,006 11.81
1980 48,098,460 5,925,884 12.32
1990 60,703,206 7,948,392 13.09
1995 68,615,706 9,454,040 13.78
2000 76,504,077 9,932,560 12.98
2007 88,574,614 11,553,427 13.04
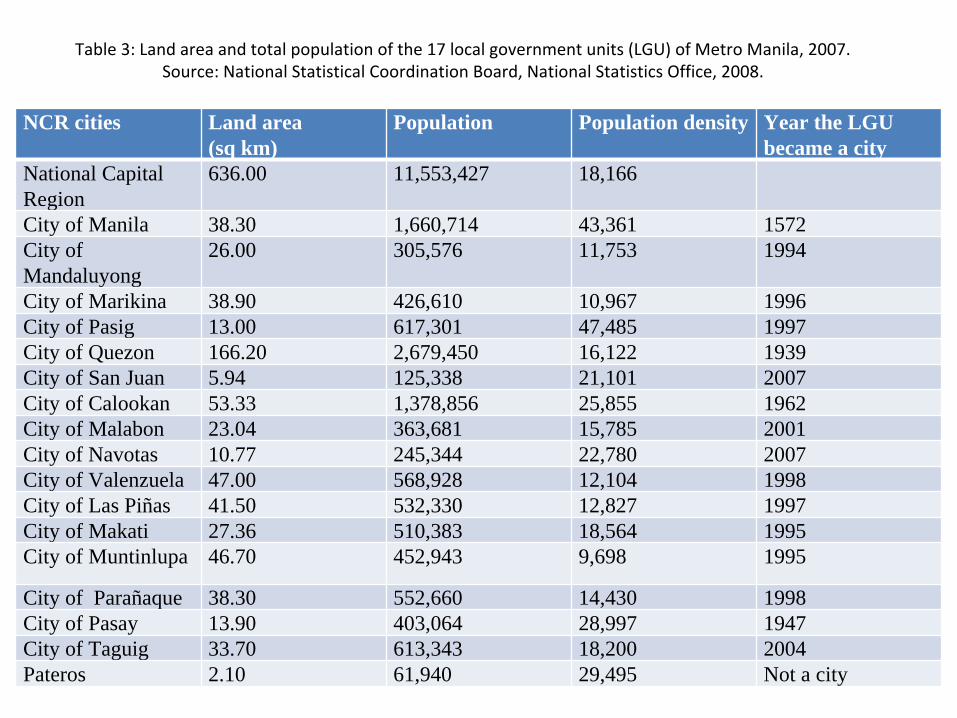
Table 3: Land area and total population of the 17 local government units (LGU) of Metro Manila, 2007.
Source: National Statistical Coordination Board, National Statistics Office, 2008.
NCR cities Land area (sq km)
Population Population density Year the LGU became a city
National Capital Region
636.00 11,553,427 18,166
City of Manila 38.30 1,660,714 43,361 1572City of Mandaluyong
26.00 305,576 11,753 1994
City of Marikina 38.90 426,610 10,967 1996City of Pasig 13.00 617,301 47,485 1997City of Quezon 166.20 2,679,450 16,122 1939City of San Juan 5.94 125,338 21,101 2007City of Calookan 53.33 1,378,856 25,855 1962City of Malabon 23.04 363,681 15,785 2001City of Navotas 10.77 245,344 22,780 2007City of Valenzuela 47.00 568,928 12,104 1998City of Las Piñas 41.50 532,330 12,827 1997City of Makati 27.36 510,383 18,564 1995City of Muntinlupa 46.70 452,943 9,698 1995
City of Parañaque 38.30 552,660 14,430 1998City of Pasay 13.90 403,064 28,997 1947City of Taguig 33.70 613,343 18,200 2004Pateros 2.10 61,940 29,495 Not a city

Many migrants to Metro Manila are either,
under‐employed, unemployed, or
underpaid and thus, unable to get decent
homes.
38 % of the country’s poor live in urban areas
22% of the urban population is poor
9.57 million urban dwellers were below the
poverty level
• They compete for minute living spaces in
the metropolis, with appalling conditions,
vulnerable to health, social and
environmental risks.
• Millions reside in spaces without
sewerage facilities, such as in shanties
built on pavements of side streets, open
areas beside railways, and covered spaces
under concrete bridges.
• 3.56 million urban dwellers lack sanitation
coverage
• Source: USAUD
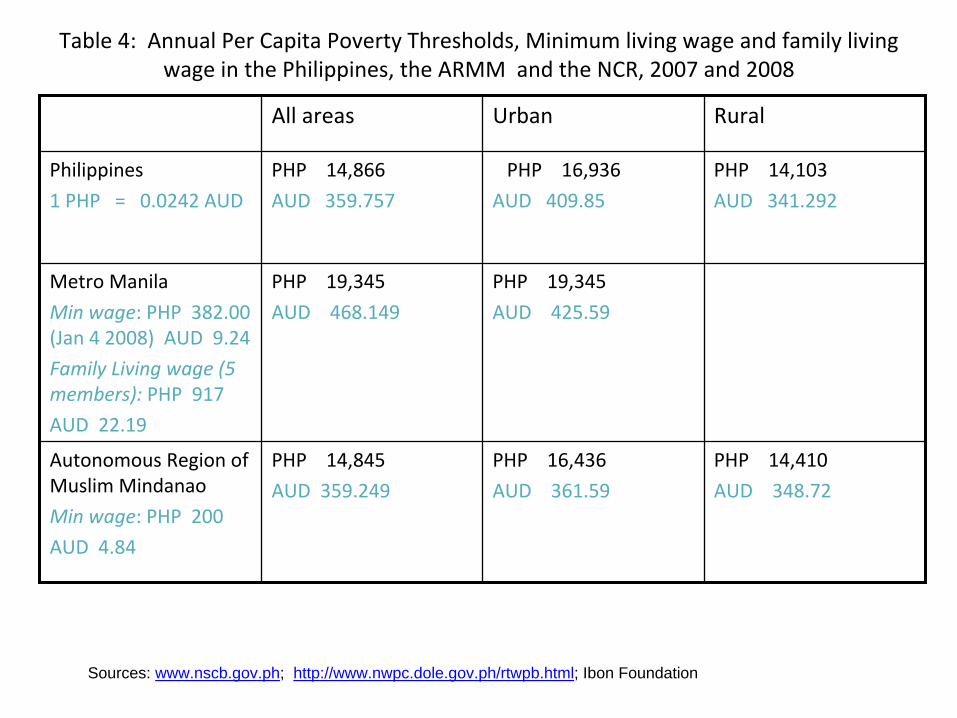
Table 4: Annual Per Capita Poverty Thresholds, Minimum living wage and family living
wage in the Philippines, the ARMM and the NCR, 2007 and 2008
All areas Urban Rural
Philippines
1 PHP
=
0.0242 AUD
PHP 14,866
AUD
359.757
PHP
16,936
AUD
409.85
PHP 14,103
AUD
341.292
Metro Manila
Min wage: PHP 382.00
(Jan 4 2008) AUD 9.24
Family Living wage (5
members):
PHP 917
AUD 22.19
PHP 19,345
AUD
468.149
PHP 19,345
AUD
425.59
Autonomous Region of
Muslim Mindanao
Min wage: PHP 200
AUD 4.84
PHP 14,845
AUD 359.249
PHP 16,436
AUD 361.59
PHP 14,410
AUD
348.72
Sources: www.nscb.gov.ph; http://www.nwpc.dole.gov.ph/rtwpb.html; Ibon Foundation
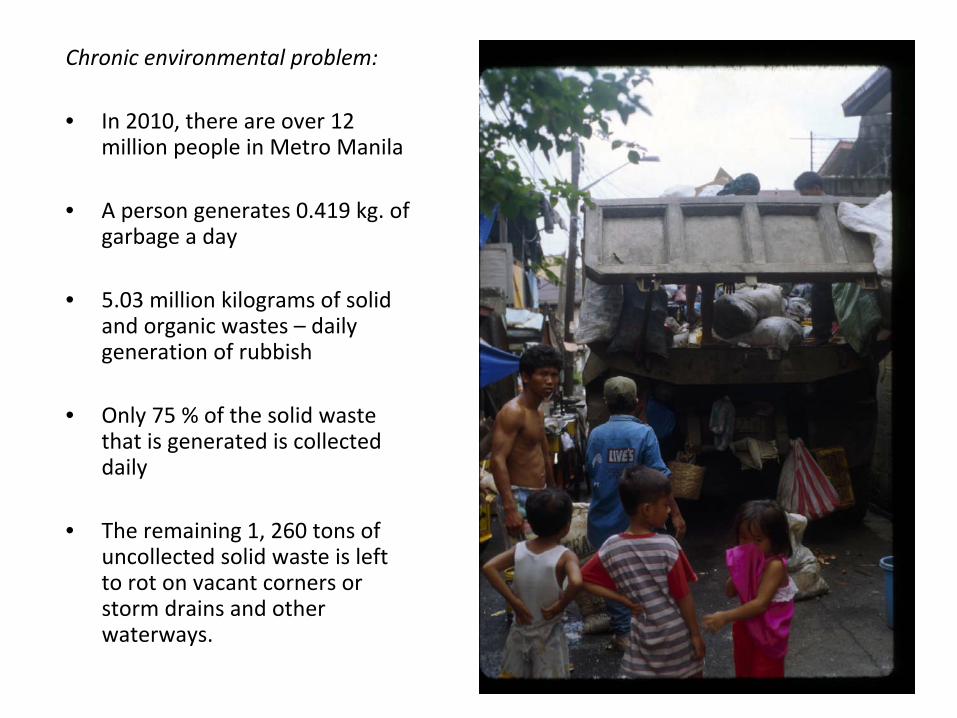
Chronic environmental problem:
• In 2010, there are over 12
million people in Metro Manila
• A person generates 0.419 kg. of
garbage a day
• 5.03 million kilograms of solid
and organic wastes –
daily
generation of rubbish
• Only 75 % of the solid waste
that is generated is collected
daily
• The remaining 1, 260 tons of
uncollected solid waste is left
to rot on vacant corners or
storm drains and other
waterways.

Metro Manila has five major rivers :
– the rivers of Pasig, Marikina, Paranaque‐
Zapote, Malabon‐Tullahan‐Tenejeros
River and San Juan.
It has two minor waterways –– the rivers of Pateros‐Taguig
and the
Napindan.
All seven rivers flow towards Manila Bay.
Lack of environmental pollution control and
abatement systems on waste disposal among
industries and households has transformed the
river systems into sewage and industrial
effluent storage areas.
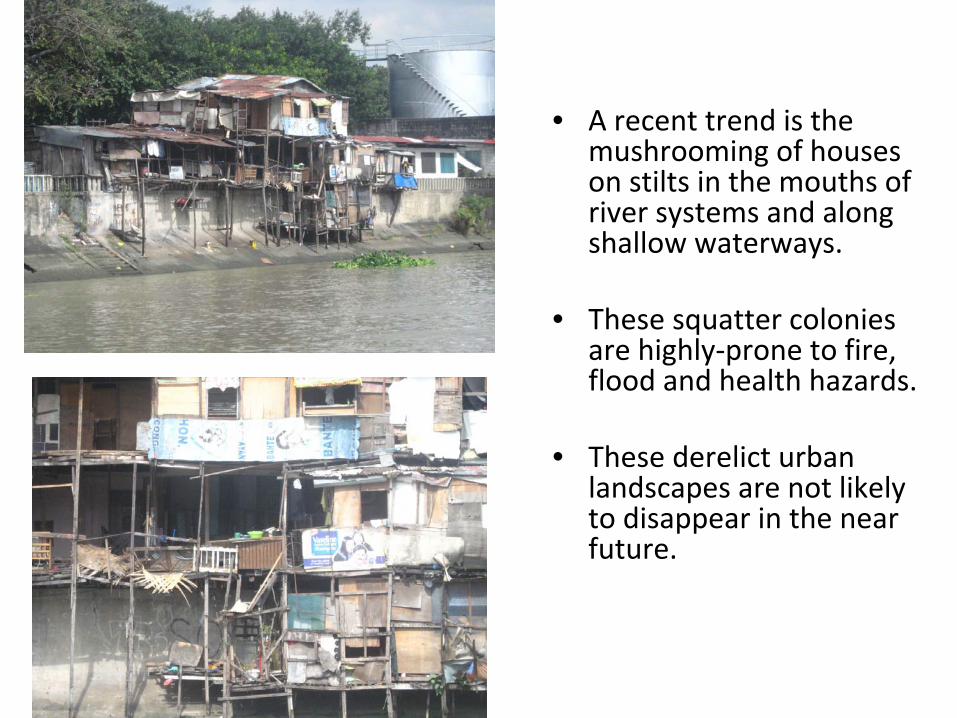
• A recent trend is the
mushrooming of houses
on stilts in the mouths of
river systems and along
shallow waterways.
• These squatter colonies
are highly‐prone to fire,
flood and health hazards.
• These derelict urban
landscapes are not likely
to disappear in the near
future.

Spatial concentration of
wealth and socio‐political
privileges: The Makati Central
Business District and Manila
Chinatown
Another trend in Metro Manila is the increasing exclusivity of affluent enclaves.
The Chinese Filipinos’ success in trading and manufacturing had some roots in the mid-16th century Philippines
http://www.chinatownology.com/chinatown_manil a.html
They enjoyed the support of the Spaniards in undertaking their trading activities.Manila Chinatown is a culturally distinct enclave.
It has established relations with financial centers in Southeast and East Asia and in the western and eastern coasts of the United States of America, Canada and Australia.
Chinese Filipino residents assert their rights for political representation in these spaces.
They control the political machineries that decide on the provision of infrastructures to support the competitiveness of their financial and cultural enclaves.
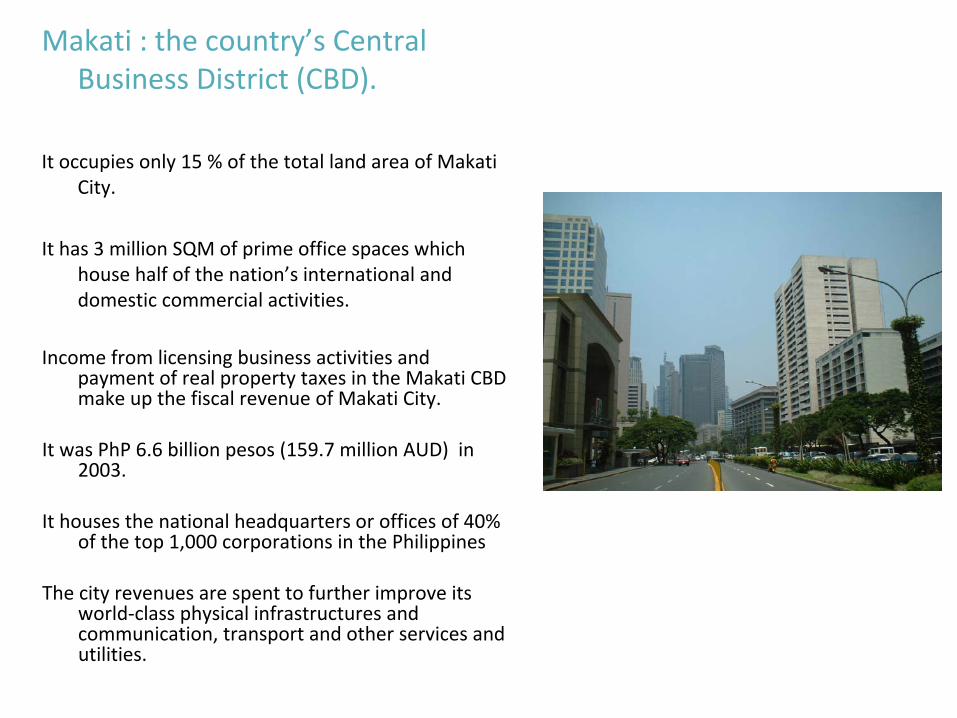
Makati : the country’s Central
Business District (CBD).
It occupies only 15 % of the total land area of Makati
City.
It has 3 million SQM of prime office spaces which
house half of the nation’s international and
domestic commercial activities.
Income from licensing business activities and
payment of real property taxes in the Makati CBD
make up the fiscal revenue of Makati City.
It was PhP
6.6 billion pesos (159.7 million AUD) in
2003.
It houses the national headquarters or offices of 40%
of the top 1,000 corporations in the Philippines
The city revenues are spent to further improve its
world‐class physical infrastructures and
communication, transport and other services and
utilities.

• Adjacent to the Makati CBD are the wealthiest
neighborhoods in the country where access is
restricted by providers of security services.
• They have considerable control over financial
resources allocation of the country.
• To support their interests, they wield the
decision‐making in economic and political
machineries of the nation.
• They can improve the physical, cultural, social,
economic, and political infrastructures in their
living spaces with the use of government or
their own personal resources.
• The experiences of wealthy neighborhoods
adjoining financial districts are the opposite of
those in economically‐deprived spaces, such
as the Muslim Filipino enclaves.
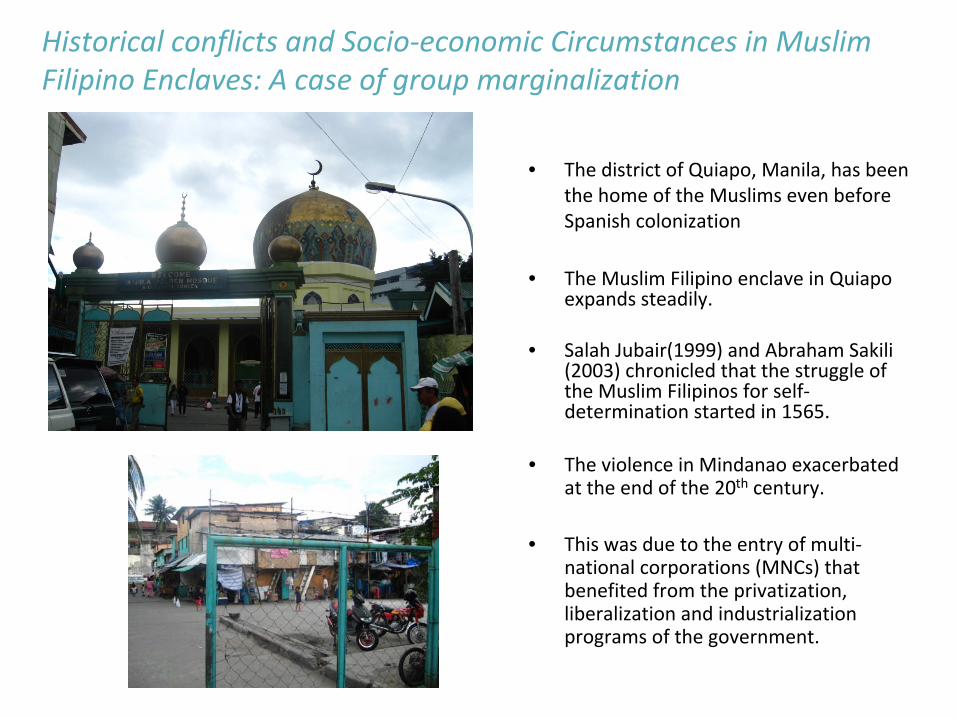
Historical conflicts and Socio‐economic Circumstances in Muslim
Filipino Enclaves: A case of group marginalization
• The district of Quiapo, Manila, has been
the home of the Muslims even before
Spanish colonization
• The Muslim Filipino enclave in Quiapo
expands steadily.
• Salah
Jubair(1999) and Abraham Sakili
(2003) chronicled that the struggle of
the Muslim Filipinos for self‐
determination started in 1565.
• The violence in Mindanao exacerbated
at the end of the 20th
century.
• This was due to the entry of multi‐
national corporations (MNCs) that
benefited from the privatization,
liberalization and industrialization
programs of the government.
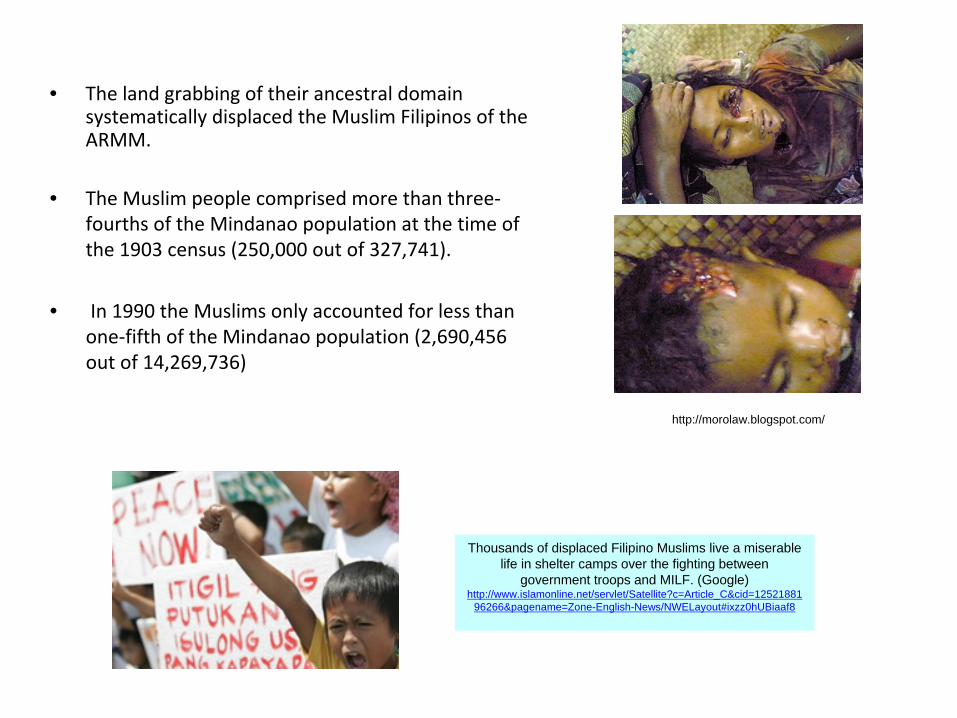
• The land grabbing of their ancestral domain
systematically displaced the Muslim Filipinos of the
ARMM.
• The Muslim people comprised more than three‐
fourths of the Mindanao population at the time of
the 1903 census (250,000 out of 327,741).
• In 1990 the Muslims only accounted for less than
one‐fifth of the Mindanao population (2,690,456
out of 14,269,736)
http://morolaw.blogspot.com/
Thousands of displaced Filipino Muslims live a miserable life in shelter camps over the fighting between
government troops and MILF. (Google) http://www.islamonline.net/servlet/Satellite?c=Article_C&cid=12521881
96266&pagename=Zone-English-News/NWELayout#ixzz0hUBiaaf8
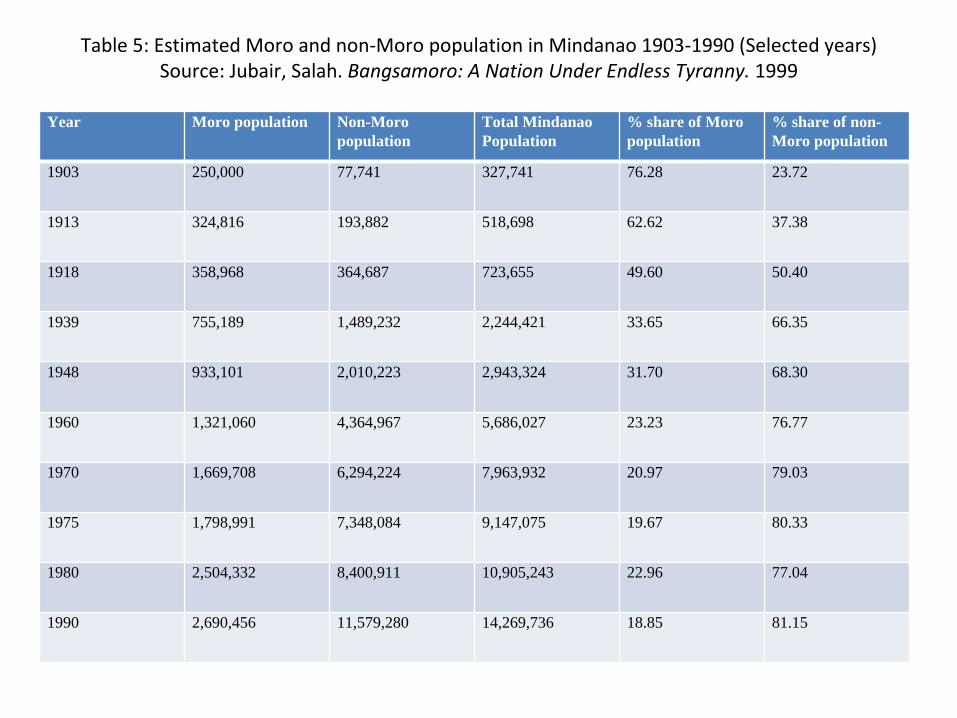
Table 5: Estimated Moro and non‐Moro population in Mindanao 1903‐1990 (Selected years)
Source: Jubair, Salah. Bangsamoro: A Nation Under Endless Tyranny. 1999
Year Moro population Non-Moro population
Total Mindanao Population
% share of Moro population
% share of non- Moro population
1903 250,000 77,741 327,741 76.28 23.72
1913 324,816 193,882 518,698 62.62 37.38
1918 358,968 364,687 723,655 49.60 50.40
1939 755,189 1,489,232 2,244,421 33.65 66.35
1948 933,101 2,010,223 2,943,324 31.70 68.30
1960 1,321,060 4,364,967 5,686,027 23.23 76.77
1970 1,669,708 6,294,224 7,963,932 20.97 79.03
1975 1,798,991 7,348,084 9,147,075 19.67 80.33
1980 2,504,332 8,400,911 10,905,243 22.96 77.04
1990 2,690,456 11,579,280 14,269,736 18.85 81.15
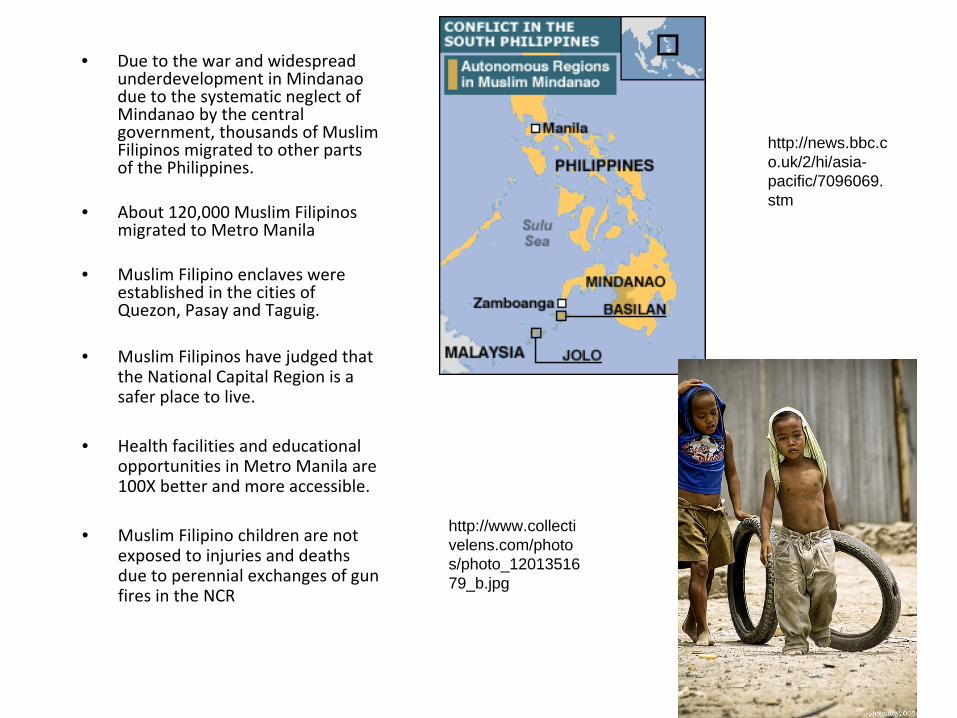
• Due to the war and widespread
underdevelopment in Mindanao
due to the systematic neglect of
Mindanao by the central
government, thousands of Muslim
Filipinos migrated to other parts
of the Philippines.
• About 120,000 Muslim Filipinos
migrated to Metro Manila
• Muslim Filipino enclaves were
established in the cities of
Quezon, Pasay and Taguig.
• Muslim Filipinos have judged that
the National Capital Region is a
safer place to live.
• Health facilities and educational
opportunities in Metro Manila are
100X better and more accessible.
• Muslim Filipino children are not
exposed to injuries and deaths
due to perennial exchanges of gun
fires in the NCR
http://news.bbc.c o.uk/2/hi/asia- pacific/7096069. stm
http://www.collecti velens.com/photo s/photo_12013516 79_b.jpg
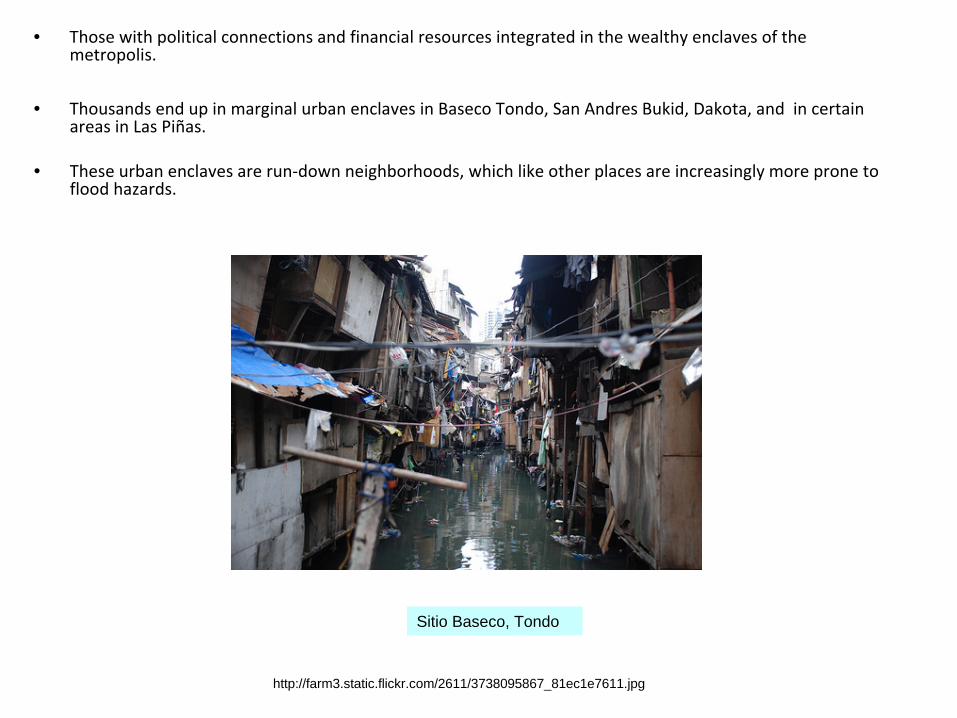
• Those with political connections and financial resources integrated in the wealthy enclaves of the
metropolis.
• Thousands end up in marginal urban enclaves in Baseco
Tondo, San Andres Bukid, Dakota, and in certain
areas in Las Piñas.
• These urban enclaves are run‐down neighborhoods, which like other places are increasingly more prone to
flood hazards.
Sitio Baseco, Tondo
http://farm3.static.flickr.com/2611/3738095867_81ec1e7611.jpg


The PHILIPPINES is a hazard- and disaster-prone country. In 2001, 317 disasters devastated the country.
Destruction to properties - PhP 9.223 billion pesos AUD 242.105 million
Typhoon occurrences – average of 19 typhoons a year; 40% or 8 typhoons directly hit the northern Philippines; 6 of which are very destructive
http://upload.wikimedia.org/wikipedia/en/6/6f/Tropical_cyclones_1945_2006_wikicolor.png

Most of Metro Manila lies on semi‐alluvial fans that were formed by the deposition
of sediments on the eastern shore of Manila Bay by the Malabon‐Tullahan
river
systems in the north, the Marikina‐Pasig river systems in the east and by the
Paranaque, Las Pinas
and other rivers in the south.
Thus, many parts of the metropolis are on low‐lying deltaic plains.
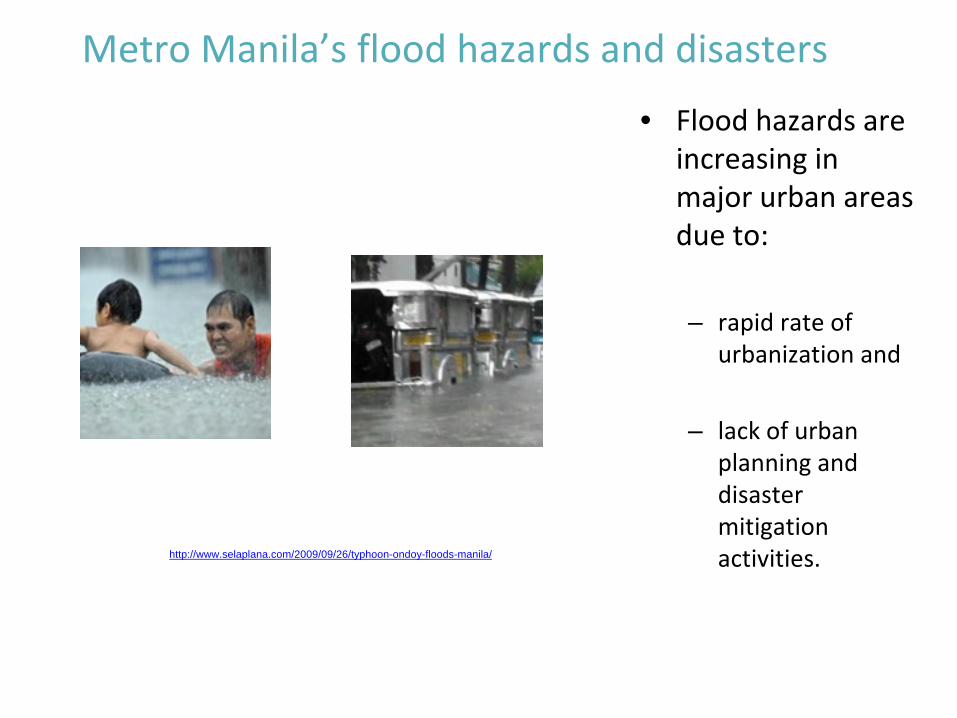
• Flood hazards are
increasing in
major urban areas
due to:
– rapid rate of
urbanization and
– lack of urban
planning and
disaster
mitigation
activities.
Metro Manila’s flood hazards and disasters
http://www.selaplana.com/2009/09/26/typhoon-ondoy-floods-manila/

Chronic risks:
Only 10 % of the drainage facilities in Metro Manila is dredged,
de‐
clogged or maintained each year (14 meters a day).
Most drainage canals are inaccessible due to the encroachment of
squatter communities on waterways’
service roads.
Indiscriminate waste disposal seriously clogs the storm drainage
canals
and waterways.
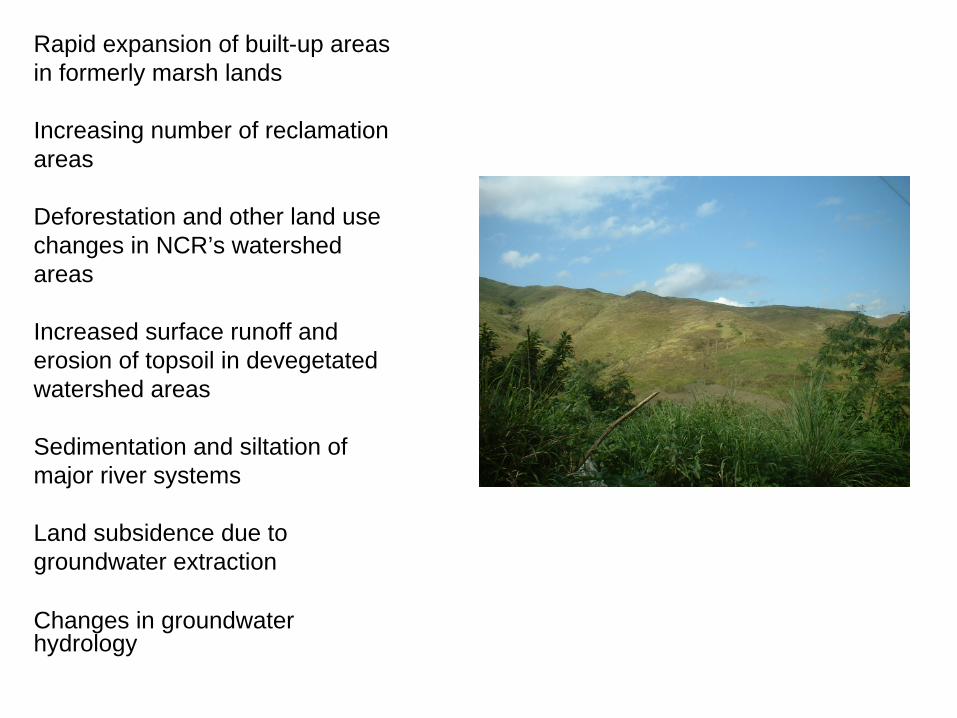
Rapid expansion of built-up areas in formerly marsh lands
Increasing number of reclamation areas
Deforestation and other land use changes in NCR’s watershed areas
Increased surface runoff anderosion of topsoil in devegetated watershed areas
Sedimentation and siltation of major river systems
Land subsidence due to groundwater extraction
Changes in groundwater hydrology
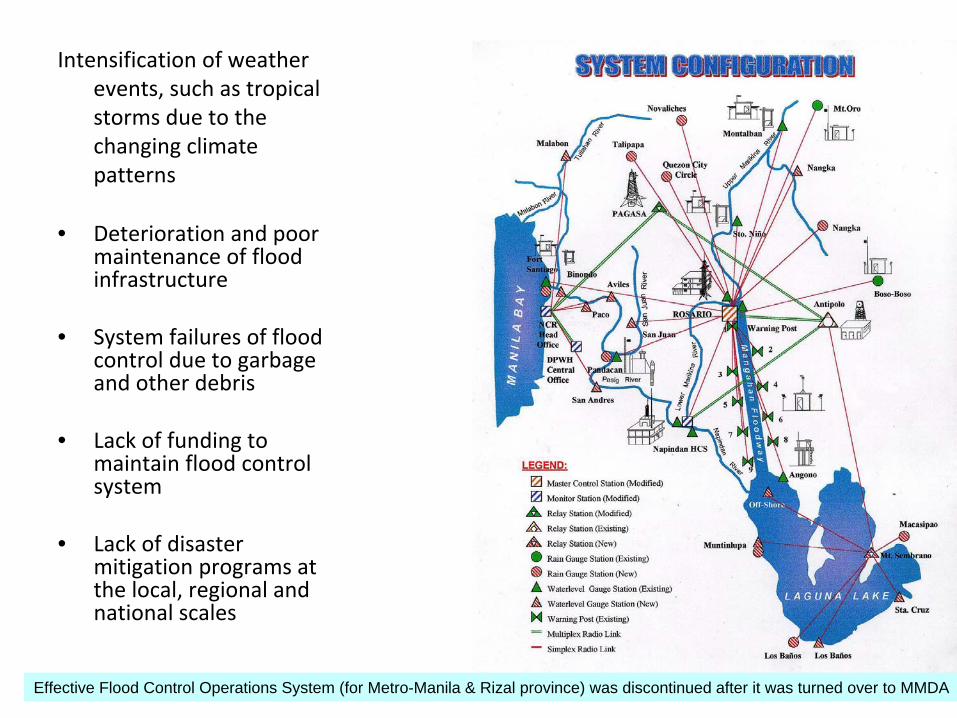
Intensification of weather
events, such as tropical
storms due to the
changing climate
patterns
• Deterioration and poor
maintenance of flood
infrastructure
• System failures of flood
control due to garbage
and other debris
• Lack of funding to
maintain flood control
system
• Lack of disaster
mitigation programs at
the local, regional and
national scales
Effective Flood Control Operations System (for Metro-Manila & Rizal province) was discontinued after it was turned over to MMDA
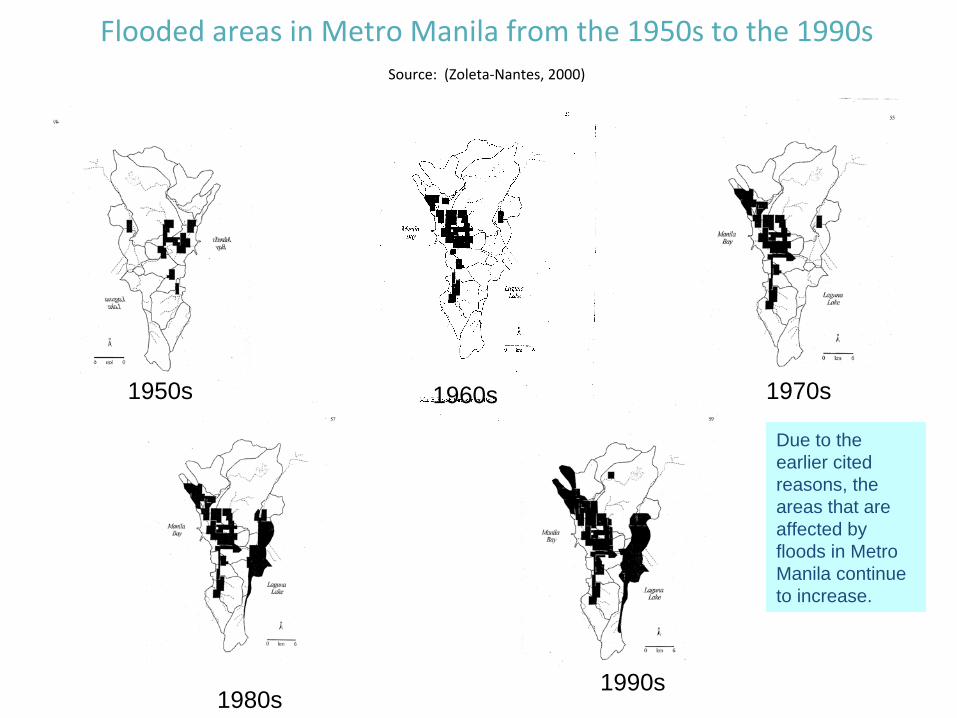
Flooded areas in Metro Manila from the 1950s to the 1990s
Source:
(Zoleta‐Nantes, 2000)
1950s 1960s 1970s
1980s1990s
Due to the earlier cited reasons, the areas that are affected by floods in Metro Manila continue to increase.
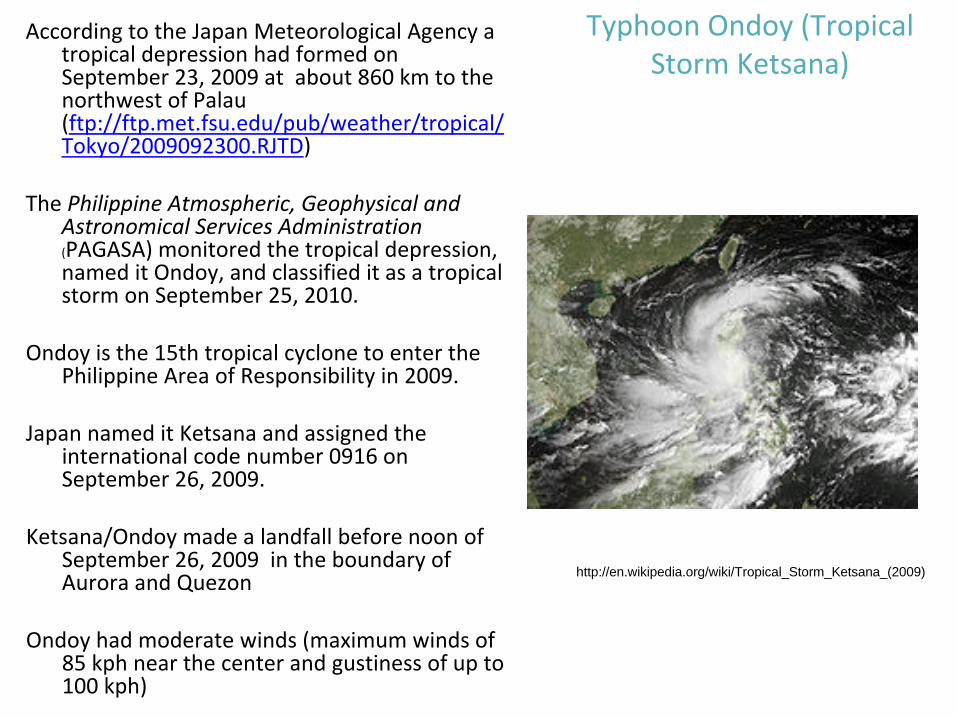
Typhoon Ondoy
(Tropical
Storm Ketsana)According to the Japan Meteorological Agency a
tropical depression had formed on
September 23, 2009 at about 860 km to the
northwest of Palau
(ftp://ftp.met.fsu.edu/pub/weather/tropical/
Tokyo/2009092300.RJTD)
The Philippine Atmospheric, Geophysical and
Astronomical Services Administration
(
PAGASA) monitored the tropical depression,
named it Ondoy, and classified it as a tropical
storm on September 25, 2010.
Ondoy
is the 15th tropical cyclone to enter the
Philippine Area of Responsibility in 2009.
Japan named it Ketsana
and assigned the
international code number 0916 on
September 26, 2009.
Ketsana/Ondoy
made a landfall before noon of
September 26, 2009 in the boundary of
Aurora and Quezon
Ondoy
had moderate winds (maximum winds of
85 kph
near the center and gustiness of up to
100 kph)
http://en.wikipedia.org/wiki/Tropical_Storm_Ketsana_(2009)
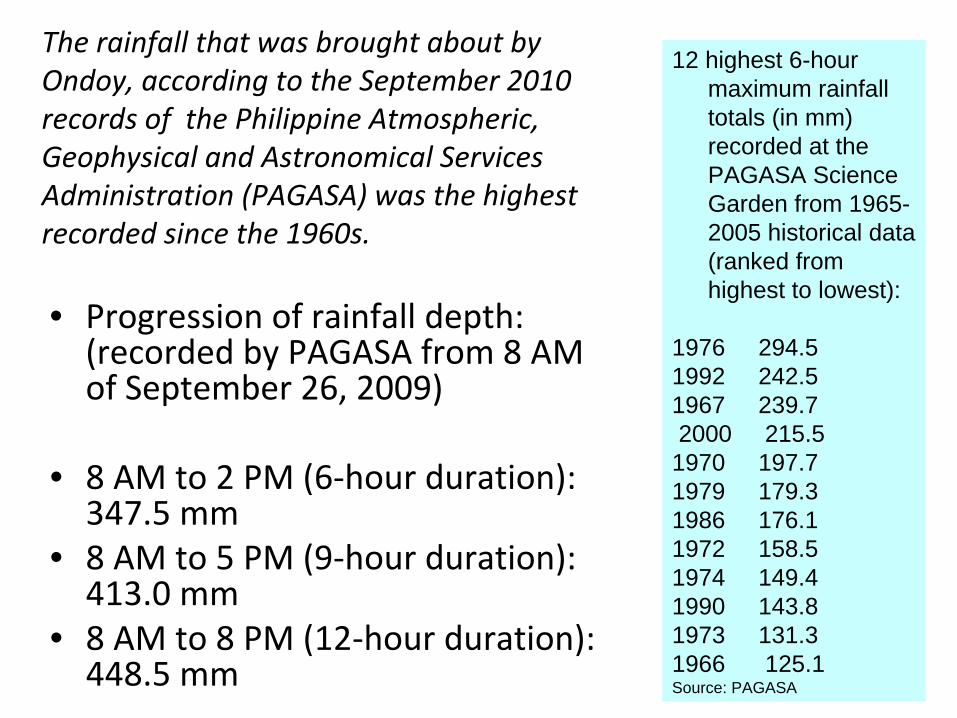
The rainfall that was brought about by
Ondoy, according to the September 2010
records of the Philippine Atmospheric,
Geophysical and Astronomical Services
Administration (PAGASA) was the highest
recorded since the 1960s.
• Progression of rainfall depth: (recorded by PAGASA from 8 AM
of September 26, 2009)
• 8 AM to 2 PM (6‐hour duration): 347.5 mm
• 8 AM to 5 PM (9‐hour duration): 413.0 mm
• 8 AM to 8 PM (12‐hour duration): 448.5 mm
12 highest 6-hour maximum rainfall totals (in mm) recorded at the PAGASA Science Garden from 1965- 2005 historical data (ranked from highest to lowest):
1976 294.51992 242.51967 239.72000 215.51970 197.71979 179.31986 176.11972 158.51974 149.41990 143.81973 131.31966 125.1Source: PAGASA
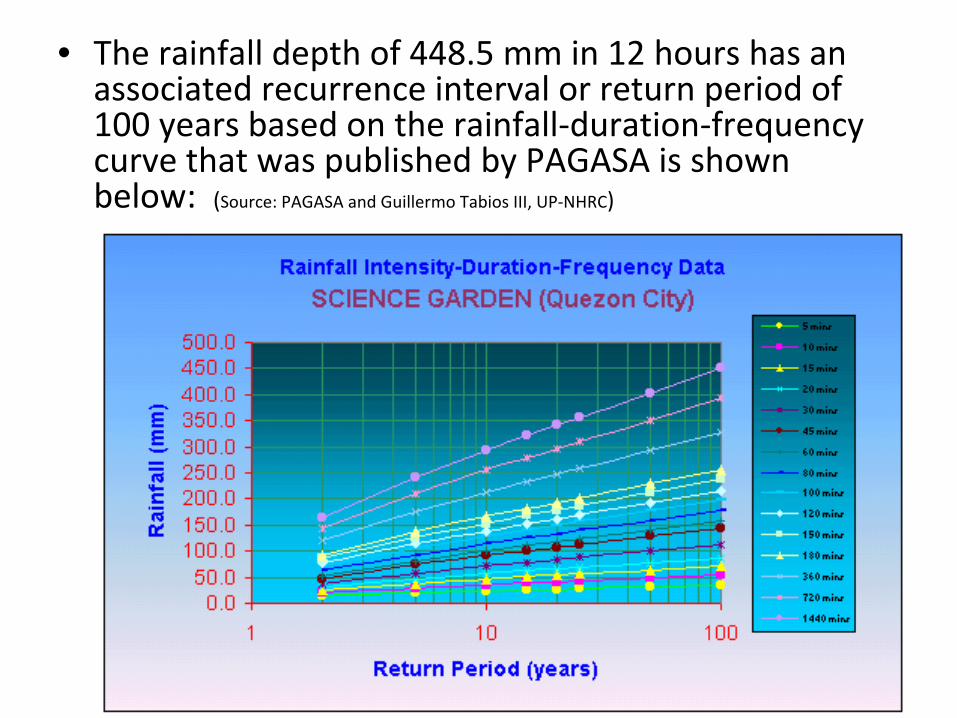
• The rainfall depth of 448.5 mm in 12 hours has an associated recurrence interval or return period of 100 years based on the rainfall‐duration‐frequency
curve that was published by PAGASA is shown below: (Source: PAGASA and Guillermo Tabios
III, UP‐NHRC)

• At 2:00 PM on September 26, 2009, Ondoy/Ketsana reached Metro Manila and caused widespread flooding
in the whole metropolis (80%), most especialy into the following cities:
– Antipolo, Makati, Malabon, Manila, Marikina, Pasay, Pasig, Quezon, San Juan, Taguig and Valenzuela were heavily
flooded and soaked with mud.
• Flood depths ranged from 2 feet to 6 feet, while on the shores of Laguna Lake, the floods almost reached 20
feet.
• Major roads in Metro Manila, particularly EDSA, C5, Espana, Aurora and 32 other road sections were
flooded (http://www.gmanews.tv/story/173229/metro‐manila‐25‐provinces‐placed‐under‐state‐of‐
calamity).
Residents swim towards high ground during flooding caused by Typhoon Ketsana in Cainta Rizal, east of Manila September 27, 2009. (REUTERS/Erik de Castro)
http://www.boston.co m/bigpicture/2009/09/t yphoon_ketsana_ond oy.html?p1=Well_Mos tPop_Emailed7

Schools were closed; 280,000 people were displaced; 464 people were reported dead; thousands were injured
International and domestic flights were cancelled for a day.
Power supply, communication lines and water supply were lost.
Metro Manila residents were warned of apossible outbreak of leptospirosis.
The total damage as of September 28, 2009 was AUD $ 108.7 million.
There were major disruptions in transportation and other community services and utilities.
Residents wait for rescuers at a building during flooding caused by Typhoon Ketsana in Cainta Rizal, east of Manila September 27, 2009. (REUTERS/Erik de Castro)
http://www.boston.com/ bigpicture/2009/09/typh oon_ketsana_ondoy.ht ml?p1=Well_MostPop_ Emailed7

Computation of flood
discharge at the Marikina
River in Sto. Nino, due to
the rains that were
brought about by Ondoy*
SWATCH Model computedPeak Flood Discharge = 5770 cu.m./sof Marikina River at Sto
Niño on 26 September
2009,
based on thePoint Hourly Rainfall at Science Garden, QCSynoptic Station withapplied area reduction factor = 0.6
Source: PAGASA
*Source: PAGASA
Source: Guillermo Tabios III, UP-NHRC

• The cities of Marikina and Pasig and Cainta , Rizal were the most affected in Metro Manila.
• Floods in some parts of these places were observed to be about 5‐8 meters in depth.
• The floodwaters which carried mud, garbage, and all sorts of debris were mixed with bunker oil
which spilled from the Noah’s Paper Mill in Marikina City.
• These places are where most of the wealthy and middle class residential subdivisions (33) are
located.
Residents stand on electric wires to stay on
high ground while others wade in neck-
deep flood waters caused by Typhoon Ketsana in Cainta
Rizal, east of Manila September 27, 2009. (REUTERS/Erik de
Castro) #
http://www.boston.co m/bigpicture/2009/09/ typhoon_ketsana_on doy.html?p1=Well_M ostPop_Emailed7

Flooded areas in Marikina Valley –
9/2009 Typhoon Ondoy
(Ketsana)
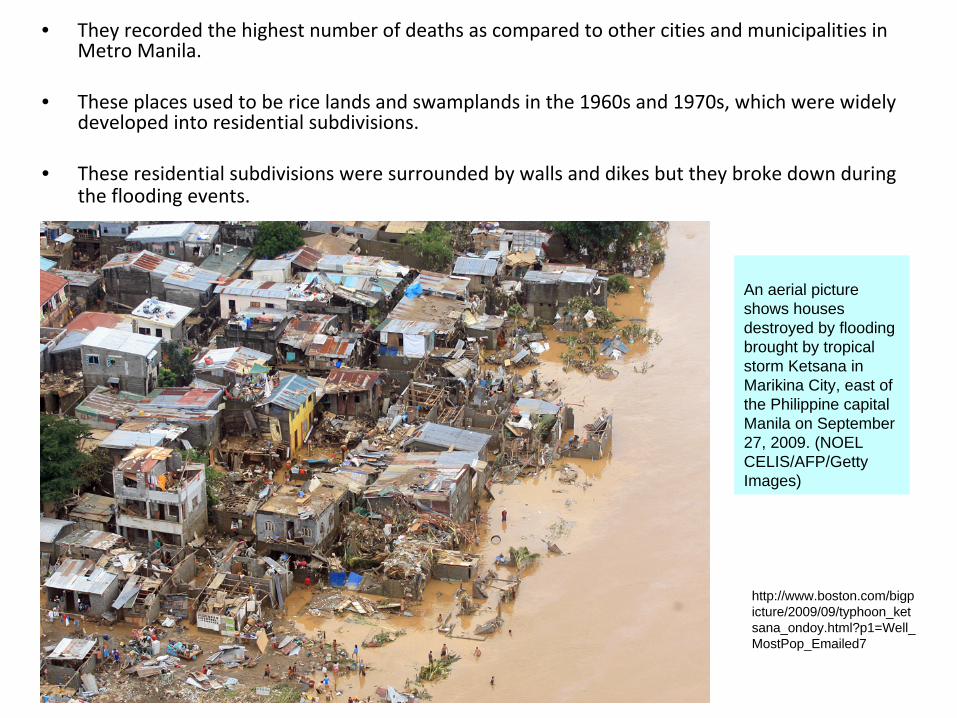
• They recorded the highest number of deaths as compared to other cities and municipalities in
Metro Manila.
• These places used to be rice lands and swamplands in the 1960s and 1970s, which were widely
developed into residential subdivisions.
• These residential subdivisions were surrounded by walls and dikes but they broke down during
the flooding events.
An aerial picture shows houses destroyed by flooding brought by tropical storm Ketsana in Marikina City, east of the Philippine capital Manila on September 27, 2009. (NOEL CELIS/AFP/Getty Images)
http://www.boston.com/bigp icture/2009/09/typhoon_ket sana_ondoy.html?p1=Well_ MostPop_Emailed7

What lies ahead?• The concentration of infrastructure, energy, utilities,
economic opportunities, information and people in
the metropolis will greatly contribute to the rate of
urbanization and spatial extent of Metro Manila.
• This will lead to the formation of “Mega Manila”
– an area that will incorporate the adjacent towns
and cities in the Central Luzon Region (provinces
of Bulacan, Nueva Ecija
and Pampanga) in the
northern part of the metropolis,
– and the CALABARZON (provinces of Cavite,
Laguna, Batangas, Rizal, and Quezon) and
MIMAROPA (provinces of Mindoro,
Marinduque, Romblon, and Palawan) regions in
the southern portion of Metro Manila.
This has implications on how the megalopolis will
deal with many environmental challenges such
as the ones highlighted by Ondoy/Ketsana.
Mega Manila will contain nearly half of the country’s population.
http://en.wikipilipinas.org/index.php
http://en.wikipilipinas.org/index.php?title=Mega_Manila
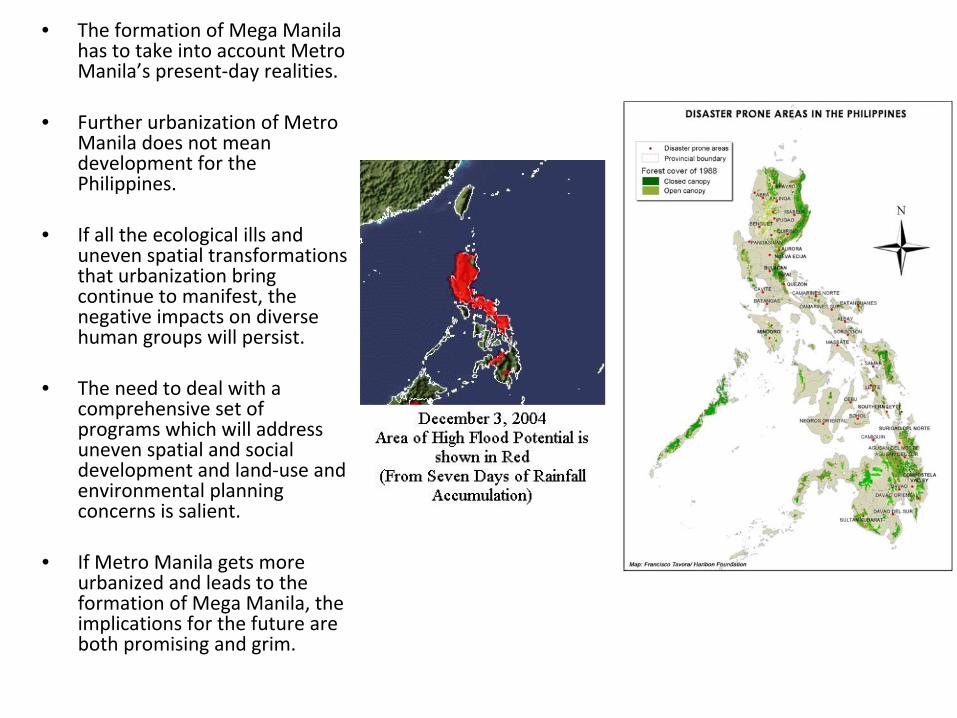
• The formation of Mega Manila
has to take into account Metro
Manila’s present‐day realities.
• Further urbanization of Metro
Manila does not mean
development for the
Philippines.
• If all the ecological ills and
uneven spatial transformations
that urbanization bring
continue to manifest, the
negative impacts on diverse
human groups will persist.
• The need to deal with a
comprehensive set of
programs which will address
uneven spatial and social
development and land‐use and
environmental planning
concerns is salient.
• If Metro Manila gets more
urbanized and leads to the
formation of Mega Manila, the
implications for the future are
both promising and grim.

What needs to
be done?
• There is a need for:
• More spatially and socially equitable resource allocation
and regional development
• More initiatives to address the ecological ills and
environmental consequences of unplanned urbanization
• More resources and attention for incorporating disaster
reduction programs in development strategies and
economic development
• Managing the conditions of urban spaces in relation to
adjoining non‐urban spaces from where resources
emanate
• Comprehensive land use planning that takes into account
the hazardousness of places and vulnerability of
communities into development goals.

Further readings and references:
• Agoncillo, Teodoro A. 1990. History of the Filipino People. Quezon City: Garotech Publishing.
• Binay, Jejomar C. 2006. Makati. A City for the People. Makati: FCA Printhouse.
• Diokno, Maria Serena and Villegas, Ramon. 1998. ‘The end of the galleon trade’, in Kasaysayan. The Story of the FilipinoPeople, volume 4. Hong Kong: Asia Publishing Company Limited.
• Japan International Cooperation Agency and Metropolitan Manila Development Agency. 1999. The Study on Solid Waste Management for Metro Manila in the Republic of the Philippines. Final Report Supporting Report, Pacific Consultants International Kokusai Kogyo Co., Ltd., Manila: JICA-MMDA.
• Jubair, Salah. 1999. Bangsamoro: A Nation Under endless Tyranny. Kuala Lumpur: IQ Marin Sbn Bhd, 1999.
• National Statistical Coordination Board - National Statistics Office. 2008. Population Figures and Gross Regional Domestic Product at Current Prices of the Philippines. Philippines: National Statistical Coordination Board-National Statistics Office.
• Ohmachi, Tatsuo and Roman, Emerlinda A. 2002. Metro Manila: In Search for a Sustainable Future. Quezon City, Philippines: University of the Philippines Press.
• Sakili, Abraham P. 2003. Space and Identity: Expressions in the Culture, Arts and Society of the Muslims in the Philippines. Quezon City: Asian Center, University of the Philippines.
• Salita, Domingo C. 1974. Geography and Natural Resources of the Philippines. Quezon City: University of the Philippines Press.
• Wikipedia-The Free Encyclopedia. 2008. “Mega Manila.” Retrieved from http://en.wikipedia.org/wiki/Mega_Manila
• Zoleta-Nantes, D. 2000. “Flood landscapes of Metro Manila.” Pp. 35-51, in Pressures of urbanization: Flood control and drainage in Metro Manila, edited by Dr. L. Liongson, Guillermo Tabios and Peter Castro. Quezon City: UP CIDS.
• Zoleta-Nantes, D. 2002. “Differential Impacts of Flood Hazards among the Street children, the Urban Poor and Residents of Wealthy Neighborhood in Metro Manila, Philippines.” Journal of Mitigation and Adaptation Strategies for Global Change, 7(3): 239-266.
• Zoleta-Nantes, D. B. 2010. “Manila, Philippines.” Pp. 483-486 in Encyclopedia of Urban Studies, edited by Ray Hutchison. California: Sage Publications, Inc.


