Download - Digital transformation of a Fashion Company

i
Digital transformation of a Fashion Company
Gustaf Brännström
- An internship and case study with focus on the
implementation of enhanced Data Infrastructure &
Business Intelligence based processes.
Internship report presented as partial requirement for
obtaining the Master’s degree in Statistics and Information
Management
ii
NOVA Information Management School
Instituto Superior de Estatística e Gestão de Informação
Universidade Nova de Lisboa
DIGITAL TRANSFORMATION OF A FASHION COMPANY
-
AN INTERNSHIP AND CASE STUDY WITH FOCUS ON THE
IMPLEMENTATION OF ENHANCED DATA INFRASTRUCTURE &
BUSINESS INTELLIGENCE BASED PROCESSES
by
Gustaf Brännström
Internship report presented as partial requirement for obtaining the master’s degree in Information
Management, with a specialization in Business Intelligence & Knowledge Management.
Advisor / Co Advisor: Roberto Henriques
iii
ABSTRACT
Within the last decade organizations in most industry segments have been forced to
transform from focusing on the core business to also adopt digitally advanced and data driven
processes. The in-house competence to lead and execute a digital transformation are, in many
organizations, a scarce commodity. Hence the transformation for companies is challenging and to
decide on the pace, options and strategic focus is a complex task.
The fast paced and global industry of fashion retail does not differ from the above and is will
be forced to rely on new technical advancements such as Machine Learning, Advanced Analytics and
Big data to increase revenue and stay competitive.
The company Nudie Jeans Co. is one of the leading brands in sustainable fashion. The
company is focused on denim products with the mission of providing long-lasting and eco-friendly
products to the world. The company has a worldwide distribution network with presence of sales
over all continents via three main channels – Retail, e-Commerce, and additional wholesale
customers. With the objectives of Nudie Jeans Co., to stay competitive and gain market shares in the
increasingly global and digital market, the company must adopt, evolve, and transform the digital
architecture and usage of data.
This internship will be focused on specific projects where Nudie Jeans Co. will transform from their
former digital framework to a more up-to-date and sustainable structure. This involves three phases,
migration to the cloud, implementation of new Business intelligence tools and finally development of
predictive demand planning model.

iv
KEYWORDS
Business Intelligence; Data Migration; Digital Transformation; Fashion Retail; Nudie Jeans Co.;
Predictive Demand Planning

v
INDEX
1. Introduction .................................................................................................................. 1
1.1. Problem Identification ........................................................................................... 1
1.2. Company background ............................................................................................ 2
1.2.1. Company structure ......................................................................................... 3
1.2.2. Sales Channels ................................................................................................ 3
1.2.3. Product development & Quality Control ....................................................... 4
1.2.4. Supply Chain ................................................................................................... 5
1.2.5. IT & System infrastructure ............................................................................. 5
1.2.6. CSR .................................................................................................................. 6
1.3. General objective .................................................................................................. 7
1.3.1. Specific Objectives .......................................................................................... 7
1.4. Internship goals ..................................................................................................... 8
1.5. Limitations ............................................................................................................. 8
1.6. Internship report overview ................................................................................... 9
2. Literature & technical review ..................................................................................... 10
2.1. Literature ............................................................................................................. 10
2.1.1. Digital transformation .................................................................................. 14
2.1.2. Cloud Computing .......................................................................................... 14
2.1.3. Business Intelligence .................................................................................... 14
2.1.4. Predictive Demand Planning ........................................................................ 14
2.2. Technical .............................................................................................................. 15
2.2.1. Cloud Computing .......................................................................................... 16
2.2.2. Business Intelligence tools ........................................................................... 18
2.2.3. Predictive Demand Planning Methods ......................................................... 23
3. Methodology .............................................................................................................. 25
3.1. BADIR ................................................................................................................... 25
3.1.1. BADIR – Decision Science Framework .......................................................... 26
3.1.2. BADIR – Data Science Framework ................................................................ 29
4. Project details (result & discussion) ........................................................................... 33
4.1. Phase 1: Lift & Shift ............................................................................................. 33
4.1.1. Work progress & results - Phase 1: .............................................................. 33
4.2. Phase 2: Qlik Sense implementation ................................................................... 35

vi
4.2.1. Work progress & results - Phase 2: .............................................................. 36
4.3. Phase 3: Predictive Demand model with ML-techniques ................................... 38
4.3.1. Work progress & results - Phase 3: .............................................................. 38
5. Conclusion .................................................................................................................. 41
6. Limitations and recommendations for future works ................................................. 43
7. References .................................................................................................................. 44
8. Appendix A - Organisational chart .............................................................................. 46
9. Appendix B – Main System flow chart ........................................................................ 47

vii
LIST OF FIGURES
Figure 1.Corporation Structure of Nudie Jeans.......................................................................... 3
Figure 2. Nudie Jeans flow of goods in 2020 .............................................................................. 5
Figure 3. Phases of Internship Project at Nudie Jeans ............................................................... 7
Figure 4. Venn Diagram of relation between Internship Topics .............................................. 10
Figure 5. Difference of Service models and On-Premises (Stephen Watts, 2019) .................. 17
Figure 6. Magic Quadrant for Analytics and Business Intelligence Platforms (Richardson,
Sallam, Schlegel, Austin, & Sun, 2020). ............................................................................ 19
Figure 7. BADIR-framework overview. Source: aryng.com (October, 2020) ........................... 25
Figure 8. BADIR - Decision Science Business Question development ...................................... 26
Figure 9. BADIR - Data Science Business Question development ............................................ 30
Figure 10. Structure testing process for Supply Chain system in the Migration to the cloud. 34
Figure 11. Inbound KPI-dashboard Nudie Jeans ...................................................................... 37
Figure 12. Outbound KPI-dashboard Nudie Jeans ................................................................... 37
Figure 13. Ad-hoc dashboard request New customers (Online).............................................. 38
Figure 14. Phase 3 level of completion (BADIR) ....................................................................... 40

viii
LIST OF TABLES
Table 1. Literature Overview .................................................................................................... 11
Table 2. Business Question development Phase 2: ................................................................. 27
Table 3. Business Question development Phase 3: ................................................................. 31
Table 4. Blocks of Analysis Plan - BADIR ................................................................................... 40

ix
LIST OF ABBREVIATIONS AND ACRONYMS
Acronym 1 BI – Business Intelligence
Acronym 2 DMP – Demand Management Platform
Acronym 3 DM – Data Mining
Acronym 4 DT – Digital Transformation
Acronym 6 ERP – Enterprise Resource planning
Acronym 5 ML – Machine Learning

1
1. INTRODUCTION
Many different business and industry segments are undergoing large digital transformations
towards a more data driven and fast-paced information sharing system. These changes are driven by
the advancement within information and communication technology in the last decades. Companies
are not only looking to digitalize their core business but also to find new digital technologies that can
enhance other aspects of their organizations such as sales channels, financial services, supply chain
and more (Matt, 2015).
According to (Tabrizi, Lam, Girard, & Irvin, 2019), in a recent study with interviews of many CEO’s
and leaders, there are indications of great concern about projects of digital transformation (DT). A
review of the result of all DT related projects within the study shows that approximately 70% does
not succeed to reach the intended goals. In many cases the shortcomings of DT-projects are related
to insufficient focus on organizational agility encompass the major changes.
The contemporary industry segment of fashion retail is characterized by rapidly changing trends
and by the importance of delivering and having the right product available at exactly the right time
and with the best price (Nenni, 2013). There are plenty of factors that interact and are important to
properly manage and to succeed in the market. Hence, it is of utmost importance to provide good
estimations and predictions of “what” and “how many” the future market e will demand. Retail
fashion brands are currently working with domain knowledge and utilization of collected data to fine
tune processes and models which can aid in I the important strategic decision making.
The retail fashion brand of Nudie Jeans Co. was founded back in 2001 by Maria Erixon and Joakim
Levin in Gothenburg, Sweden. Ever since the start, the company has focused on delivering
sustainable products to the market of and has today a global reach through 3 main sales channels - e-
Commerce (nudiejeans.com), own brand retail stores (Nudie Jeans Repair Shops) and Wholesale
distribution. Four main collections releases per year includes new products as well as carry-over
styles that runs through collections. The company sell approximately 1 million pair of jeans annually,
alongside with other product categories such as, Shirts, Jackets, Accessories, Sweatshirts and T-shirts,
which all are from in-house production design as Nudie Jeans Co. do not sell external brands in their
sales-channels.
As large industries and companies all over are continuously enhancing their digital capabilities
through transformations it is evident and vital also for smaller companies, with less resources to also
attempt follow the trend to stay competitive. As many examples in history, companies that are not
being flexible and willing to change can ultimately lose everything and vanish from the markets.
1.1. PROBLEM IDENTIFICATION
Regarding the Nudie Jeans Co., being a fairly young corporation, the need of knowledge and
enhanced strategy to build up a workable data architecture for the enablement of Business
Intelligence (BI) and data analytics is evident. The company has previously focused on more branch
specific implementations and developments but has the last years identified the need for additional
internal knowledge and work towards data infrastructure, analytics, and data science. In accordance
with the report by (Tabrizi, Lam, Girard, & Irvin, 2019), and the difficultness of succeeding with set

2
goals in DT-projects, a company like Nudie Jeans Co., must attentively review and work through the
process in an agile way.
The focus on DT has become even more urgent during the period of COVID-19 whereas physical
retail stores have been closed and an increasingly faster shift towards e-Commerce has been seen.
The trend towards e-Commerce and digitalization in the market underlines the problem and need for
fashion companies to focus on Digital Transformation to not become obsolete and lose market
shares in the future to come.
1.2. COMPANY BACKGROUND
Nudie Jeans Co. was founded 2001 in Gothenburg, Sweden by the designer Maria Erixon Levin
and the punk-rock drummer Joakim Levin. Since the early days the company defined a vision and a
goal of being a sustainable denim brand in both social and environmental aspects.
The brand and the company are mainly focused on Denim products with Jeans being its primary
product of sales, hence they product catalogue ranges over most categories of apparel, such as
accessories, jackets, shirts, and pants. The set range of products Men’s wear and/or Unisex have
been the focus for many years but Nudie Jeans has since the last two years broaden its collection
towards a supplementary designated collection line for female.
Production and sourcing of material for the products of sales are aligned with the originating
idea of sustainability from both social and environmental aspects and most of the suppliers are
located within the EU (nudiejeans.com, 2020)
According to Allabolag.se (2020), the yearly revenue for 2019 was approximately 38 million EUR
and annual revenue has in last 4 years steadily been around the 40 million EUR mark. The company
distribute and sells about 1 million jeans annually on a global market reaching through its different
sales channels all continents of the world.
3
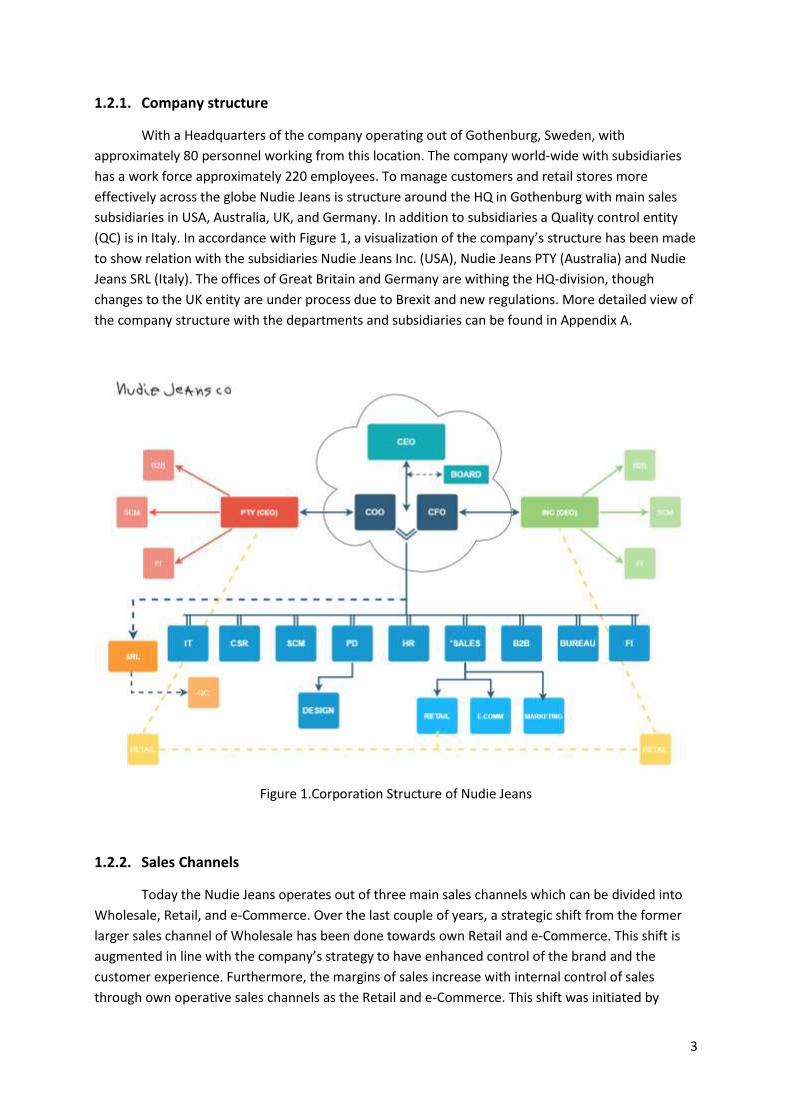
1.2.1. Company structure
With a Headquarters of the company operating out of Gothenburg, Sweden, with
approximately 80 personnel working from this location. The company world-wide with subsidiaries
has a work force approximately 220 employees. To manage customers and retail stores more
effectively across the globe Nudie Jeans is structure around the HQ in Gothenburg with main sales
subsidiaries in USA, Australia, UK, and Germany. In addition to subsidiaries a Quality control entity
(QC) is in Italy. In accordance with Figure 1, a visualization of the company’s structure has been made
to show relation with the subsidiaries Nudie Jeans Inc. (USA), Nudie Jeans PTY (Australia) and Nudie
Jeans SRL (Italy). The offices of Great Britain and Germany are withing the HQ-division, though
changes to the UK entity are under process due to Brexit and new regulations. More detailed view of
the company structure with the departments and subsidiaries can be found in Appendix A.
Figure 1.Corporation Structure of Nudie Jeans
1.2.2. Sales Channels
Today the Nudie Jeans operates out of three main sales channels which can be divided into
Wholesale, Retail, and e-Commerce. Over the last couple of years, a strategic shift from the former
larger sales channel of Wholesale has been done towards own Retail and e-Commerce. This shift is
augmented in line with the company’s strategy to have enhanced control of the brand and the
customer experience. Furthermore, the margins of sales increase with internal control of sales
through own operative sales channels as the Retail and e-Commerce. This shift was initiated by
4
further development and projects of the nudiejeans.com (e-Commerce) and a more formalized plan
on how to operate physical retail stores.
The wholesale channel is focused on longer lasting relationships with B2B retailers and web
shops to distribute and sell large bulk-orders for the B2B customer to resell in local market or online.
This department of sales is both locally and over-head managed where the subsidiaries and sales
offices are responsible for curating and working with B2B customers per designated area of sales.
The subsidiary of Nudie Jeans Inc (US) is working towards the Northern & Central American markets,
whereas Nudie Jeans PTY (AUS), are set towards the larger area of Australia and South East Asia.
Other geographical markets of sales are primarily managed by the HQ wholesale department, with
exception for UK and GE which are local managed. In addition to larger retailers and online B2B
customers, distributor and agent contracts for specific markets are also active to reach markets
which have a larger cultural and/or legislative market restriction such as Japan.
Worldwide there are 34 Nudie Jeans Repair Shops, of which 24 are operated by Nudie Jeans
HQ’s retail department and the 2 subsidiaries. The remaining are managed by Distributors within
their local markets or through franchise agreements. The stores are designated Nudie Jeans Repair
shops where the consumer can purchase product, repair jeans for free and hand-in old Nudie Jeans
for discounts of new purchases.
Through nudiejeans.com which is the primary website for the company also e-Commerce
sales are processed. The e-Commerce platform is managed and operated from the HQ office in
Sweden. Today the main warehouse resides in Borås, Sweden and offers shipping world-wide with
the exception of a few countries. Due to different time-zones and local market expertise, supportive
e-Commerce sales support functions are conducted by the subsidiaries and distributors.
Furthermore, Nudie Jeans is undergoing a large project of consolidating the two channels of
sales Retail and e-Commerce into a so-called omnichannel. The concept of “omnichannel” is widely
adopted and a challenge for retailers today, where the definition lies in creating the same shopping
experience in whatever medium the purchase takes place (Bulovi & Covic , 2020). With the objective
of implementing fully operational OMNI-channel flow in 2021 Nudie Jeans aims at giving any
consumer the same experience either if visiting the store or the e-Commerce platform. Within this
project larger IT and systems investments are done to link the two sales channels closer so e.g., an e-
Com customer in Australia purchases a pair of jeans from nudiejeans.com which will be supplied by a
locally Nudie Jeans Repairs shop in Australia.
1.2.3. Product development & Quality Control
The work of developing new products and designs is handled by the Product development
and design department at HQ. Within this department there are four main processes to be the
design, procurement, demand-planning, and production control. Generally, there are 4 main
collection on a yearly base to be developed, these are divided into Spring, Summer, Fall and Winter
collection, whereas the Spring and Fall are the larger collections in both order volume and product
range. In addition to the main collections smaller collections are developed side-by-side in coherence
with trends and request from external and/or internal actor.
5
In consultation with the Supply Chain and CSR-department the Product development team
are planning production and what suppliers to collaborate with as well as the sourcing material of for
the production site. In the process of creating a new collection the attention to predict demand of a
new products is also overseen by this department with cross-functional dialogues with sales channels
and management.
The subsidiary Nudie Jeans SRL in Italy focus on product and quality control of suppliers
located in Italy and Tunisia. This function within the company provides direct contact with the larger
suppliers and ensure the quality of products as well as the suppliers follow the social and
environmental requirements stated by the CSR-department.
1.2.4. Supply Chain
As one of the main operational functions within Nudie Jeans Co, the Supply Chain
department oversees the purchase of production, manage stock-levels, transportation, and
distribution of goods within the value chain. Functions as purchase and inbound logistics from
suppliers resides in the HQ, and the distribution towards B2B customers are operated through
subsidiaries as well as from HQ depending on the market. This department is also responsible for
trade-regulations and fulfilling that orders, both inbound and outbound are delivered on time and at
full.
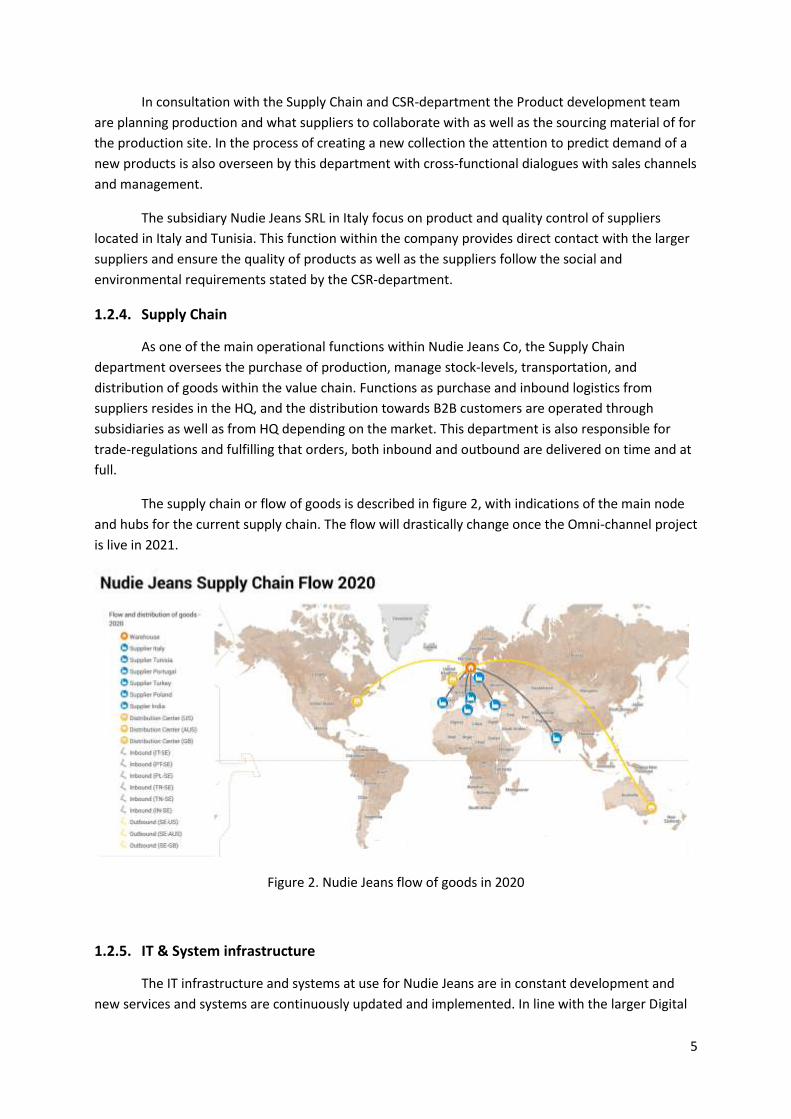
The supply chain or flow of goods is described in figure 2, with indications of the main node
and hubs for the current supply chain. The flow will drastically change once the Omni-channel project
is live in 2021.
Figure 2. Nudie Jeans flow of goods in 2020
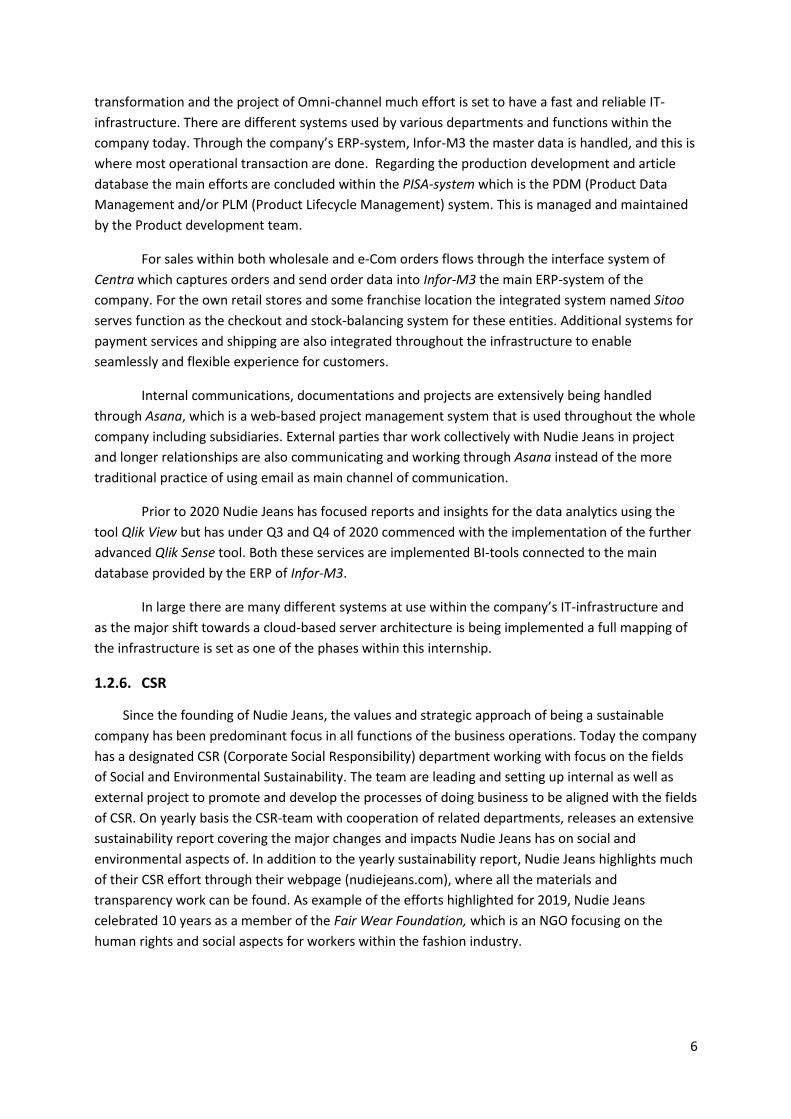
1.2.5. IT & System infrastructure
The IT infrastructure and systems at use for Nudie Jeans are in constant development and
new services and systems are continuously updated and implemented. In line with the larger Digital
6
transformation and the project of Omni-channel much effort is set to have a fast and reliable IT-
infrastructure. There are different systems used by various departments and functions within the
company today. Through the company’s ERP-system, Infor-M3 the master data is handled, and this is
where most operational transaction are done. Regarding the production development and article
database the main efforts are concluded within the PISA-system which is the PDM (Product Data
Management and/or PLM (Product Lifecycle Management) system. This is managed and maintained
by the Product development team.
For sales within both wholesale and e-Com orders flows through the interface system of
Centra which captures orders and send order data into Infor-M3 the main ERP-system of the
company. For the own retail stores and some franchise location the integrated system named Sitoo
serves function as the checkout and stock-balancing system for these entities. Additional systems for
payment services and shipping are also integrated throughout the infrastructure to enable
seamlessly and flexible experience for customers.
Internal communications, documentations and projects are extensively being handled
through Asana, which is a web-based project management system that is used throughout the whole
company including subsidiaries. External parties thar work collectively with Nudie Jeans in project
and longer relationships are also communicating and working through Asana instead of the more
traditional practice of using email as main channel of communication.
Prior to 2020 Nudie Jeans has focused reports and insights for the data analytics using the
tool Qlik View but has under Q3 and Q4 of 2020 commenced with the implementation of the further
advanced Qlik Sense tool. Both these services are implemented BI-tools connected to the main
database provided by the ERP of Infor-M3.
In large there are many different systems at use within the company’s IT-infrastructure and
as the major shift towards a cloud-based server architecture is being implemented a full mapping of
the infrastructure is set as one of the phases within this internship.
1.2.6. CSR
Since the founding of Nudie Jeans, the values and strategic approach of being a sustainable
company has been predominant focus in all functions of the business operations. Today the company
has a designated CSR (Corporate Social Responsibility) department working with focus on the fields
of Social and Environmental Sustainability. The team are leading and setting up internal as well as
external project to promote and develop the processes of doing business to be aligned with the fields
of CSR. On yearly basis the CSR-team with cooperation of related departments, releases an extensive
sustainability report covering the major changes and impacts Nudie Jeans has on social and
environmental aspects of. In addition to the yearly sustainability report, Nudie Jeans highlights much
of their CSR effort through their webpage (nudiejeans.com), where all the materials and
transparency work can be found. As example of the efforts highlighted for 2019, Nudie Jeans
celebrated 10 years as a member of the Fair Wear Foundation, which is an NGO focusing on the
human rights and social aspects for workers within the fashion industry.
7
1.3. GENERAL OBJECTIVE
The general objective of this internship is to aid Nudie Jeans Co. in their transition towards a
refined data infrastructure, data management and data analytics. This will be done by implementing
contemporary techniques within the field of data and information management. The company has
prior to the internship set up projects of the transition with defined external as well as internal
parties. As a supportive and technical role in the projects, the internship will work with preparatory
tasks, trials, and development alongside the company’s different departments, with a focus towards
Supply Chain and Purchasing.
Considering the limited in-house competence in the field of digital transformation a central role
for the intern is also to objectively assess and monitor the progress of the projects. Specifically, the
intern shall focus on how the company can utilize and enhance the usage of advanced analytics and
data science related tools.
1.3.1. Specific Objectives
In accordance with the general strategy of modernizing the IT and data usage of the company,
the internship is divided in to three specified objectives and/or phases. These objectives are
chronologically planned over the larger DT project, where the final step is to get improved utilization
of data for the purpose of machine learning and data science related processes.
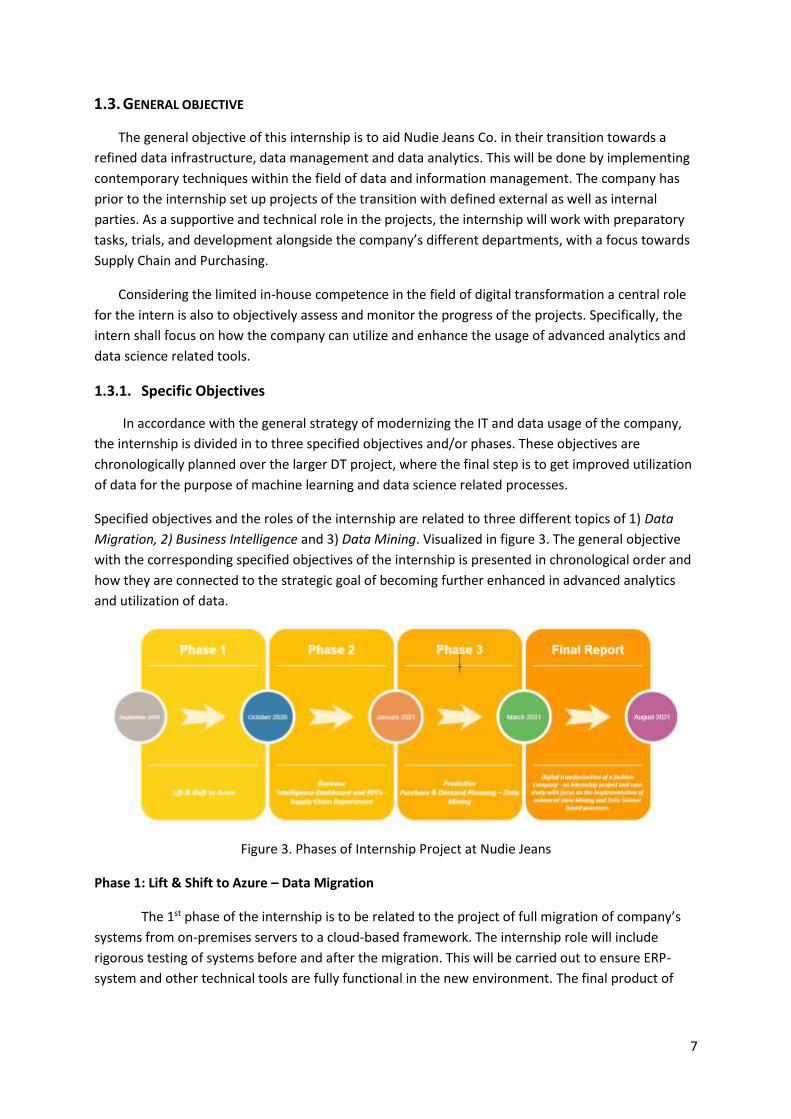
Specified objectives and the roles of the internship are related to three different topics of 1) Data
Migration, 2) Business Intelligence and 3) Data Mining. Visualized in figure 3. The general objective
with the corresponding specified objectives of the internship is presented in chronological order and
how they are connected to the strategic goal of becoming further enhanced in advanced analytics
and utilization of data.
Figure 3. Phases of Internship Project at Nudie Jeans
Phase 1: Lift & Shift to Azure – Data Migration
The 1st phase of the internship is to be related to the project of full migration of company’s
systems from on-premises servers to a cloud-based framework. The internship role will include
rigorous testing of systems before and after the migration. This will be carried out to ensure ERP-
system and other technical tools are fully functional in the new environment. The final product of

8
this phase is to fully map the IT-infrastructure through visualization of flow-chart regarding how the
data flow and what system are master for the underlying data.
Phase 2: Qlik Sense – Business Intelligence
The 2nd phase of the digital transformation project is related to the newly acquired Business
Intelligence tool, Qlik Sense. The functionality of this BI-tool is to more comprehensibly present vital
KPI’s through interactive dashboards connected to the company’s main ERP-system and data bases.
First focus for this part is for the intern to act in a leading role to ensure the proper implementation
in line with the operations and business needs of the Supply Chain department. Thereafter the
internship will include the process of building functional dashboards and creating KPI’s within the BI-
tool. In this phase tight communication between the stakeholders will be managed to ensure
accuracy and usage of correct data for the BI-reports.
Phase 3: Predictive Demand Planning – Data Mining
The 3rd part of the internship deals with the vision of Nudie Jeans to become a more data
driven and digitally mature organization. With the usage of Machine Learning (ML), a demo trial of a
predictive model will be developed to aid in the decision making of purchasing and demand planning.
To narrow the scope of the predictive modeling, a certain set styles and/or product will be assigned
to the project. The predictive models will be tested to prove or disprove if the hypothesis is more
accurate than existing methods of forecasting.
The data upon which the model will be built will be extracted from the company’s ERP-
system and data base. Primary modelling of the project will be conducted in Jupyter Notebook
through Python language. Aiming towards ML and other novel techniques that can be applied for the
purpose of the project a few different approaches will be reviewed and assessed. In accordance with
(Ren, Chan, & Siqin, 2020) the choice of the best model for demand forecasting is a difficult task that
has to be thoroughly investigated to fit the specific question and data at hand.
1.4. INTERNSHIP GOALS
In line with the set phases and specified objectives of the internship, the goals to achieve at the
end is to have acted as a supportive, assessing, and structuring resource of the digital transformation
of Nudie Jeans. The set phases are aligned with the company’s aspirations and will be as an
underlying stage of documentation for future work and development. In this sense the internship
shall serve goals to enhance my personal knowledge and understanding of real-life DT-projects. This
includes in-depth understanding of BI-tools and potential usage of advanced analytics.
1.5. LIMITATIONS
Limitations of this internship project and report are based on the scope of the general and
specific objectives. The internship is set through a broader spectrum of digital transformation, and
each sub-field in the specified phases are limited in the sense that extensive research on all topics is
not pursued due to time and work limitations. The internship project covers the time span from 1st of
September 2020 to 31st of March 2021.
9
1.6. INTERNSHIP REPORT OVERVIEW
In chronological order for this internship the report is structured as below:
Chapter 1 with subsections describes the background of the internship with limitations and
objective, as well as an overview of Nudie Jeans and the structure of the company.
Chapter 2 covers the review literature essential for the internship and the report along with a
technical review divided into the sub-fields of study which the 3 phases of internship cover.
Chapter 3 describes in detail the adopted methodology of BADIR, and how this was applied to
the phases of the internship.
Chapter 4 includes the result and discussion of the internship work with segmentation between
the different phases of the internship. This chapter covers the work progress of how the internship
with related tasks was processed.
Chapter 5 withholds the conclusion of the report and input on how the internship progressed as
well as concluded.
Chapter 6 discusses the limitations and future works that can be continued based upon the
conclusion and result of the internship.
.

10
2. LITERATURE & TECHNICAL REVIEW
This section will provide a deeper understanding of the underlying and prior research related to
the topic at hand as well as reviews of existing and newly implemented technical aspects of Nudie
Jeans Co. within their transitional project in Digital Transformation.
The literature reviewed for this internship, are given to add context and information to the topic
of the internship rather than defining what kind of research gap this report covers. In the sense of
this being a company-based internship the review of prior literature is limited to related topics and
recent publications. A broader spectrum describing different system is presented to grasp strength
and weaknesses of the system and/or tools implemented by the company.
2.1. LITERATURE
In line with the structure of the internship focus of literature review will be set on the aspects of
Digital Transformation, Business Intelligence and Predictive Demand Planning. Associating to the
three main topics of literature much of the prior research upon the topics are related to fashion and
retail operations.
Most of the reviewed literature are concentrated around prior studies and articles form
academic and business-related journals. As the topic is in a continuously and rapidly changing
domain a limitation to recent studies has been selected with the attention of a span of 3-4 years
back. Additionally, less recent sources of information have been reviewed to back fundamental
definitions and information of concepts covered by this report. Set in figure 4, I visualized through a
Venn diagram which showcases the topics of the literature review, and how all relates to the broader
objective of Digital transformation.
Figure 4. Venn Diagram of relation between Internship Topics
11
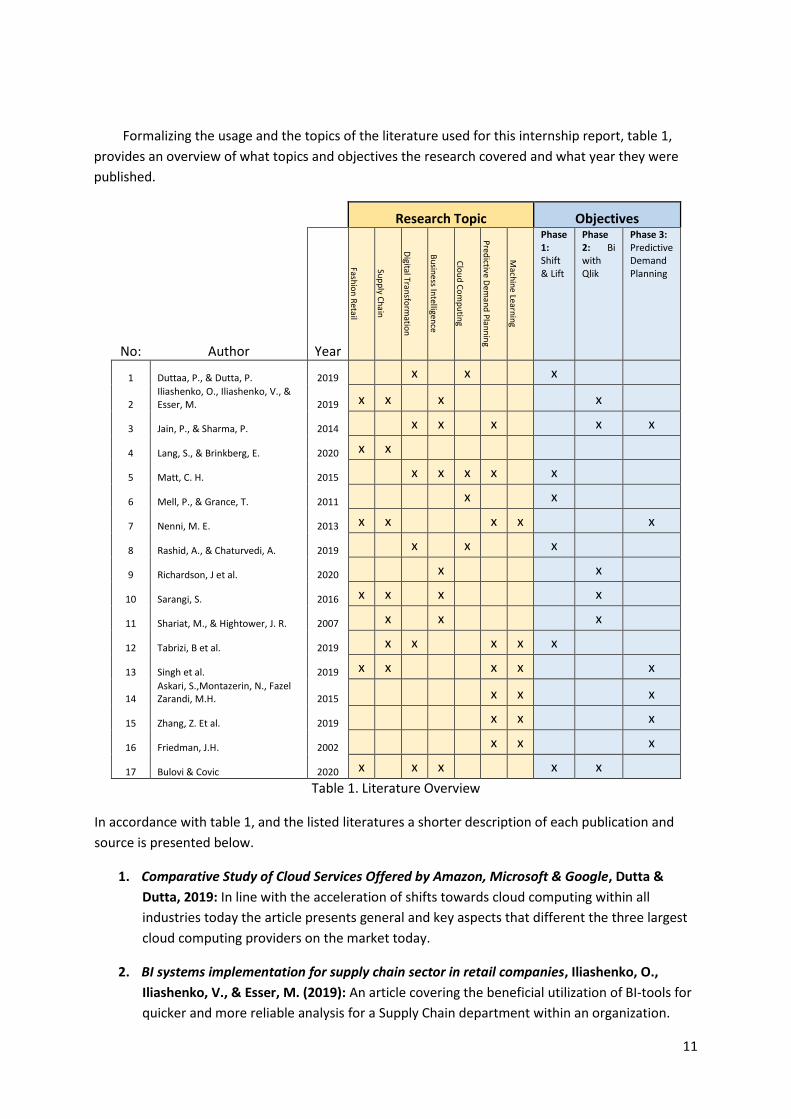
Formalizing the usage and the topics of the literature used for this internship report, table 1,
provides an overview of what topics and objectives the research covered and what year they were
published.
Research Topic Objectives
No: Author Year
Fashio
n R
etail
Sup
ply C
hain
Digital Tran
sform
ation
Bu
siness In
telligence
Clo
ud
Co
mp
utin
g
Pred
ictive Dem
and
Plan
nin
g
Mach
ine Learn
ing
Phase 1: Shift & Lift
Phase 2: Bi with Qlik
Phase 3: Predictive Demand Planning
1 Duttaa, P., & Dutta, P. 2019 x x x
2 Iliashenko, O., Iliashenko, V., & Esser, M. 2019 x x x x
3 Jain, P., & Sharma, P. 2014 x x x x x
4 Lang, S., & Brinkberg, E. 2020 x x
5 Matt, C. H. 2015 x x x x x
6 Mell, P., & Grance, T. 2011 x x
7 Nenni, M. E. 2013 x x x x x
8 Rashid, A., & Chaturvedi, A. 2019 x x x
9 Richardson, J et al. 2020 x x
10 Sarangi, S. 2016 x x x x
11 Shariat, M., & Hightower, J. R. 2007 x x x
12 Tabrizi, B et al. 2019 x x x x x
13 Singh et al. 2019 x x x x x
14 Askari, S.,Montazerin, N., Fazel Zarandi, M.H. 2015 x x x
15 Zhang, Z. Et al. 2019 x x x
16 Friedman, J.H. 2002 x x x
17 Bulovi & Covic 2020 x x x x x
Table 1. Literature Overview
In accordance with table 1, and the listed literatures a shorter description of each publication and
source is presented below.
1. Comparative Study of Cloud Services Offered by Amazon, Microsoft & Google, Dutta &
Dutta, 2019: In line with the acceleration of shifts towards cloud computing within all
industries today the article presents general and key aspects that different the three largest
cloud computing providers on the market today.
2. BI systems implementation for supply chain sector in retail companies, Iliashenko, O.,
Iliashenko, V., & Esser, M. (2019): An article covering the beneficial utilization of BI-tools for
quicker and more reliable analysis for a Supply Chain department within an organization.

12
Review of some of the larger BI-tools on the market is described with functionality and
technical review, and a possible data source setup to support Supply Chain related KPI’s and
reports.
3. Comparative Study of Cloud Services Offered by Amazon, Microsoft & Google, Jain, P., &
Sharma, P. (2014): Covers the methodology and framework of BADIR on how decision
science and Data Science related project can go from a vaguely formulated business need
and/or questions to a final recommendation and implementation.
4. Nudie Jeans Sustainability Report 2019, Lang, S., & Brinkberg, 2019: The yearly sustainability
report of Nudie Jeans covers the aspects on which the company are working on towards
Social and Environmental challenges and through transparency presenting key performing
indicator related to the subject as e.g., C02 emissions.
5. Digital transformation strategies, Matt, C. H. (2015): Presents complexity of Digital
transformation with deeper research towards corporate strategies and how to unlock
potential benefits a Digital transformation can provide. Two approaches on strategic Digital
transformation are presented as well as four important dimensions to balance with the
transformation (1. Use of Technology, 2. Changes in value creation, 3. Structural Changes and
4. Financial aspects.)
6. The NIST Definition of Cloud Computing, Mell, P., & Grance, T. (2011). Provides a technical
standards definition of cloud computing, set by a U.S state authority for developing
guidelines of commercial usage.
7. Demand Forecasting in the Fashion Industry: A Review, Nenni, M. E., Giustiniano, L., &
Pirolo, L. (2013): Presents the subject of demand forecasting within the fashion industry and
the challenges of fast paced shifts in market and trends. An analysis of traditional and more
new methods of forecasting modeling is evaluated as well as the importance of an agile
supply chain.
8. Cloud Computing Characteristics and Service, Rashid, A., & Chaturvedi, A. (2019): Study
covering the main aspects of cloud computing and how technical differences between IaaS,
PaaS and SaaS are set. A guide towards a brief understanding of the concepts and how cloud
computing can benefit a organization.
9. Magic Quadrant for Analytics and Business Intelligence Platforms, Richardson, J., Sallam,
R., Schlegel, K., Austin, K., & Sun, J. (2020): A yearly report reviewing the main BI-tools on
the market today and how these different products are positioned through their set metrics
of the “magic quadrant” of Challengers, Leaders, Nice Players and Visionaries.
10. Business Intelligence Systems: A Necessity for Agile Supply Chains, Sarangi, S. (2016): Article
that investigate the need and/or necessity for a well-developed BI-tool of reporting and
analytics to achieve and agile supply chain within an organization. Presenting the
cornerstones of an Agile Supply Chain and how the role of BI is set to encompass decision on
fast and reliable analytics BI-tolls provide.

13
11. CONCEPTUALIZING BUSINESS INTELLIGENCE ARCHITECTURE, Shariat, M., & Hightower, J. R.
(2007): Report covering the fundamental definitions and usage of BI and how the concept
can improve analytical work at an organization, and how it leads to decision making. Further
the introductions are made to the components of which an enhanced BI-architecture is built.
12. Digital Transformation Is Not About Technology, Tabrizi, B et al. (2019): Article from the
Harvard Business Review, resented studies indicates that only few Digital Transformation
Projects of reaches their goal and are still set as highly important by executives. Exploring the
challenges organizations faces to successfully go through with Digital transformations, and
aspects to take into considerations.
13. Fashion retail: Forecasting demand for new items, Singh et al. (2019): Study that explores
the utilization of Machine Learning models to forecast future demand of new products
within the fashion and retail industries. Analyzing approaches by prior studies in the same
topic, describing the complexity of demand forecasting within the subjected industry the
article results with an experimental ML-technique of Gradient-Boosting to forecast demand.
14. A clustering based forecasting algorithm for multivariable fuzzy time series using linear
combinations of independent variables. Askari, S., Montazerin, N., & Fazel Zarandi, M.
(2015): Study researchers extensive two types of algorithms to use in forecasting within fuzzy
time series-models and how these are they are mathematically built up. The focus of the lays
in how the types of algorithms perform and results in the clustering fuzzy times series scoring
lower in testing error.
15. Predictive analytics with gradient boosting in clinical medicine. Zhang, Z. Et al. (2019):
Study based upon the need for more sophisticated forecasting models withing the clinical
medicine segment. This article provides a step-by-step explanation of the function on how
Gradient Boosting technique works.
16. Stochastic gradient boosting, Friedman, J.H. (2002): Studying the properties of the Gradient
Boosting technique and how accuracy of the model can be improved by randomizing training
the base learner by different data subsets. The article provides a more in depth
understanding of the Gradient Boosting and the how differential approaches with the
technique can result in higher accuracy.
17. The Impact of Digital Transformation on Sustainability in Fashion Retail, Bulovi & Covic
2020: Study exploring the linkage between the digital transformation of fashion companies
and how this trend and type of transition will affect the sustainability aspects within the
industry. Focusing on e-commerce as well as operational angle of the industry, the report
indicated enhanced digital usage will result in more data to build analysis and decisions
which can be a

14
2.1.1. Digital transformation
To grasp the fundamental of the concept of Digital Transformation as of being the general
objectives of the first phase of this internship, related articles and journals covering topic was
reviewed. In addition to DT the reviews were conducted on literature and reference sources
describing the basics of cloud computing and differential system infrastructure setups.
Much of the argumentation towards the need and importance of DT throughout
organizations in the current market are based on the Harvard Business Review article from Tabrizi, B.
et al (2019), with the title Digital Transformation Is Not About Technology. This article focuses on the
importance of DT and how to manage expectations of companies and employees that DT brings.
Additionally, the article covers some critical aspects of how to complete a successful DT and the
aspects to take in consideration.
2.1.2. Cloud Computing
Understanding the differences of cloud solutions available in the market was necessary for
the internship, and especially for phase: 1 covering the company’s migration from on-premises
solution to a cloud-based infrastructure as well as mapping the new system infrastructure. To collect
useful information of why the company, choose to perform the migration, articles as well as
documentations of definition was reviewed. The article from International Journal of Computer
Sciences and Engineering by Rashid, A., & Chaturvedi, A. in 2019, and the documentation by the NSIT
(National Institute of Standards and Technology), provided in-depth explanations of the cloud
concepts.
2.1.3. Business Intelligence
The main literature regarding the topic of Business Intelligence and related tools has been
through scientific research on the topic related to the 2nd phase of the internship of Developing KPI’s
and dashboards through BI-tool Qlik Sense for the usage of the Supply Chain department at Nudie
Jeans.
With reference to Table 1, the scientific reports and research review for this internship was
chosen based upon the relation to Supply Chain and the industry segment of fashion retail.
Additionally, literature regarding the topic of Business Intelligence and the tools was mainly focused
on the report of “2020 Gartner Magic Quadrant for Analytics and Business Intelligence Platforms”, to
receive a broader spectrum of the available tools on the market today and their composition of
specifications.
In line with the set-out objective of creating dashboards, KPI’s and reports useful for the
Supply Chain department, related articles covering aspects of commonly used KPI’s and
measurements of effectiveness have been reviewed. Hence, the appointment of KPI’s varies from the
subset of the business need and operations, though the literature of the topic provides information
on general setups and generic points of data for measuring efficiency and service levels.
2.1.4. Predictive Demand Planning
The prior research and articles related to the phase: 3 of the internships focuses on general
and as well as more specific studies regarding demand forecasting models within the fashion retail
15
segment. There are a lot of studies made on the subject and according to many of the reviewed
references the case of demand forecasting for Fashion retailers are particularly difficult due to fast
trends, variations of products, lead times etc. (Singh, Gupta, Jha, & Rajan, 2019). In line with the
many variations of aspects that can affexts a relevant forcast and demand model in the fashion retail
market, the trend and the availablity of the product fom multiple vendors are also diffuclt to forsee.
In some sense this can be seen as a fuzzy enviroment of focasting. Due this complexity of forcasting
the demand of new producst many companies today have put effort on developing agile and short
lead-time set supply chains (Nenni, Giustiniano, & Pirolo, 2013).
As outlined for this research topic and phase of the internship, focus of the literature has
been to recognize the market segments challenges of prediction and what models of forecasting that
is primarily used and successfully implemented.
Phase: 3 is following the inspirational structure from the report of Fashion Retail: Forecasting
Demand for New Items (2019) by Singh, Guptha, Jha & Rajan. The development of a forecasting
model for Nudie Jeans will be inspired by this report but with the differences to be appliable to the
business need and structure of the company in question.
The structured approach presented in the selected report of influence for this internship,
provides a primary examination of related work on how fashion retail companies today use
predictive forecasting models and what related research that have been conducted. Traditionally the
forecasting models within the market segment has been done though time series forecasting, which
are built up on the idea of continued scenarios where historical patterns are used to predict the
demand. Hence, these models are usually not ideal for forecasts of new products. A alternative
models such as average forecast, life cycle approach and bass model have been reviewed as simpler
ways of predicting demand, (Singh, Gupta, Jha, & Rajan, 2019).
Following the approach by Singh et al (2019), the models developed ranged from Random
forest (RF), Gradient Boosted Trees (GB), as well as deep learning model of two Neural Networks (NN)
of Multi-Layer Perception (MLP) and Long Short-Term Memory (LTSM). In the extended report of the
performance of the tested models, the GB and RF-model performed better than the NN-models
based on the selection of the study (Singh, Gupta, Jha, & Rajan, 2019). In accordance to this
conclusion this internship focus on developing a Gradient Boosting model for Demand prediciton of
products.
In consideration to the approach presented in the, reviews regarding Fuzzy Time Series (FTS)
have also been made. The FTS-models are commonly used in segments of for example stock
exchange and pollution (Askari, Montazerin, & Fazel Zarandi, 2015). Hence this type of model could
be suitable for the purpose of the specifics and difficulties within the retail fashion of predicting
demand focus as was set out in the named report.
2.2. TECHNICAL
In the context to the general objective of the internship through the digital transformation of
Nudie Jeans Co, a technical review of the adopted and alternative tools and/or systems has been
conducted. This section provides underlying information of tools and systems used through the
internship and their general function. Additionally, reviews of alternative systems are done to
16
understand the choice of systems provider and the set-up for Nudie Jeans Co, as well as necessary
background for later discussion.
2.2.1. Cloud Computing
According to (Mell & Grance, 2011) and the National Institute of Standards and Technology,
(NIST), the definition of Cloud Computing is set as model for enabling on-demand, ubiquitous,
convenient access of shared configurable computing resources. The resources in questions can be
both hardware and software related where e.g., networks, servers and applications are included.
Cloud computing is generally described with five essential characteristics, three types of Service
Models and four sets of Deployment Models (Rashid & Chaturvedi, 2019).
There are today several different cloud service providers acting in the market, where the top
three actors are 1. Amazon Web Services, 2. Microsoft Azure, 3. Google Cloud Platform, whereas the
number one Amazon Web Services holds around 30% of the global market shares (Duttaa & Dutta,
2019). The choice of cloud service-provider and the type of service to invest in can be difficult for
companies A clear understanding and examination of the company’s requirements is key for a
successful decision on implementation of cloud services (Duttaa & Dutta, 2019).
2.2.1.1. Essential Characteristics of Cloud Computing
Listing the defined characteristics of cloud computing are 1) On-demand Self Service, 2)
Broad Network access, 3) Resource Pooling, 4) Rapid Elasticity, 5) Measured Service (Mell & Grance,
2011).
1. On-demand Self-service: Services in cloud computing provides the possibility of
automatically allocate resources of e.g., storage and computing power without human
interactions.
2. Broad Network access: The proficiency over the network to access from different
variations of platforms, such as smart phones and laptops.
3. Resource Pooling: Computing resources are “pooled” jointly to serve in a multi-tenant
model. This enables usage of different physical and virtual resources to be dynamically
distributed according to the consumers demand of computing resources.
4. Rapid Elasticity: The computing resources in the cloud are possible to rapidly and
elastically increase or decrease based on the demand of the consumer. This can be done
manually or automatically to cover the needed demand of computing resources.
5. Measured Service: The services utilized by the consumer in the cloud can me metrified
to the usage of the computing resources over time. Hence the system automatically
optimizes the resource and in terms of payment and allocation of resources it is
comparable to electricity services.

17
2.2.1.2. Service Models of Cloud Computing
Compared to generic on-premises services the cloud computing commonly is defined upon
three service models 1. IaaS (Infrastructure as a Service), 2. PaaS (Platform as a Service), 3. SaaS
(Software as a Service). The disparity of these set of service models is shown in figure 5, with
comparison of on-premises setup and what functions that are managed locally or by the service
provider.
Figure 5. Difference of Service models and On-Premises (Stephen Watts, 2019)
• Infrastructure as a Service (IaaS): Provides the user of the services to host out their primarily
on-premises servers to larger data centers which include storage, networking, servers, and
virtualization managed by the service-provider. In this sense the consumer does not have to
manage the underlying server infrastructure but are controlling the operating systems and
deployment of applications (Mell & Grance, 2011). In some instances, this service can also
include billing, monitoring, security and log-access and storage-resiliency (Dutta & Dutta,
2019).
According to Rashid & Chaturvedi (2019), the below benefits can be derived by
implementing IaaS in comparison to on-premises infrastructure.
o These would be the reduce of cost of, the user pays for the service they want
(flexibility to scale up storage or process if needed).
18
o Provides access to an enterprise-wide IT-infrastructure for a more globally operated
company.
o The users pay for the service they need and can easily scaly up and down in the
process and storage capabilities depending on the demand.
• Platform as a Service (PaaS): Most commonly this type of cloud service is adopted by
software-developers as the PaaS normally does not replace a full IT-infrastructure but
provides an optimized cloud-based work environment for installing application and
uploading datasets (Dutta & Dutta, 2019). The PaaS can bring the benefits of the user not to
manage the upgrades on the infrastructure as it is managed by the service provider and
lower costs as upfront investments in hardware is not directly needed (Rashid & Chaturvedi,
2019)
• Software as a Service (SaaS): Is a fully outsourced cloud-service that lets the user focus on
the purpose and usage of the software without managing the underlying IT-aspects
characterized for IaaS and PaaS. A SaaS eliminates the need for the user of acquiring any
hardware procurement, maintenance, installation and more, typically this type of services
based on payments of monthly or hourly usage (Dutta & Dutta, 2019). Applications as this
type of services are usually accessible from different devices and interfaces as for example
web-browsers. In line with the characteristics of a SaaS deliver the benefits of rapid
scalability and elimination of any concerns regarding IT-infrastructure (Rashid & Chaturvedi,
2019).
• On-Premises: In comparison to the above-described cloud-services the on-premises
architecture is when the user basically control the full line of aspects and relies on managing
all locally. This setup can be difficult to manage and expensive for organizations when the
amount of data continues to increase and the need for managing and storing is of high
importance for many businesses.
2.2.2. Business Intelligence tools
The term of Business Intelligence (BI) ca be described as providing relevant, reliable
information on the right persons at the right time on order to achieve accurate and correct decision
making. This bridge of information to the stakeholders of a company can be done through analytical
methods and software’s that collect, structure and present data in a comprehendible and actionable
manner. The origin of the terminology of “Business Intelligence” was presented by the consulting
firm Gartner Group in the mid 1990’s (Shariat & Hightower, 2007). According to Sarangi (2016), BI
and the tools used for extracting the information overreaches the decision support system for
effectively managed operations over an organization as well as specific functions such as supply
chain or sales. In this sense BI is the process of creating structure, of previously messy data hold by
an organization to enable an easily accessible and user-friendly way to derive enhanced insights. This
is basically made, by making analytics on data less complex and more available across an
organization.
In line with the fast-paced digitalization over all types of markets, a desire and need to have
real-time analytics is evident (Iliashenko, Iliashenko, & Manfred, 2019). The utilization of BI

19
software’s and tools can deliver this as a means required to stay competitive in market and excel
with company profitability. Today there are many different and providers of BI-systems that
companies and organizations can invest in to increase the speed and accuracy of reporting and
analytics. The BI-platforms on the market today are both available from larger tech corporations
with wide range of products as well as BI-focused suppliers and startups with BI-platforms and
systems solely focused on the topic (Richardson, Sallam, Schlegel, Austin, & Sun, 2020). For example,
some tech leading companies that offers BI platforms are Microsoft, Alibaba, Oracle and IBM. The
more segment focused contributors to the BI-segment are Tableau, Qlik and Sisense.
In the last couple years, the Gartner Group, which established the term of BI, releases a
reviewing report covering the Analytical and Business Intelligence platforms available for the market
and how they are relevant in their evaluation on the market and trends. Showcased in figure 6, is the
Magic Quadrant from the Gartner report that indicates the main BI-platform providers, where
Microsoft, Tableau and Qlik are the top in their review (Richardson, Sallam, Schlegel, Austin, & Sun,
2020)
Figure 6. Magic Quadrant for Analytics and Business Intelligence Platforms (Richardson, Sallam, Schlegel, Austin, & Sun, 2020).
The output of the report Gartner report visualized in figure 6, was based upon different
characteristics of the BI-platforms and what the capabilities each product has, such as Security,
Manageability, Cloud capability Automated Insights, Advanced Analytics, Data Visualization,
Storytelling etc. Upon these characteristics the BI tools are presented within the quadrant, in the
figure Microsoft is ranked the highest on both the ability to execute and their completeness of vision,
20
therefore set as the leaders within the domain . Previous yearly reports on the on the topic by
Gartner have emphasized more on the differential aspects of i.e., data visualization, whereas this
year moved past this aspect as it has become more of a comparison of all providers (Richardson,
Sallam, Schlegel, Austin, & Sun, 2020). Instead, this report gives more weight towards Augmented
analytics, where users of platforms are looking for more enhanced ML and AI-assisted data
preparation that becomes a competitive differentiation (Richardson, Sallam, Schlegel, Austin, & Sun,
2020).
For this internship project a more detailed view of the top 3 leaders Microsoft, Tableau and
Qlik, is performed as per below to point out the main differences and specifications that characterize
each providers BI-platforms.
2.2.2.1. Microsoft Power-BI:
Being the leader of in the Magic Quadrant., Microsoft with their BI-platform has not always
had this market position. Microsoft launched their BI-platform Power BI in 2013 was set as a
“follower” to the other actors but has under the last 2 years added a wide range of features to their
platform which has strengthened their position in the segment (Richardson, Sallam, Schlegel, Austin,
& Sun, 2020). Through Power BI, Microsoft offers the user of the BI-tool comprehensible and
accessible data preparation, interactive dashboards, and augmented analytics. The product is both
available as SaaS solution via Microsoft cloud-service Azure, but also as an on-premises option
depending on the IT-infrastructure and need of the user. Furthermore, in 2019 Microsoft pushed
updates and new functionality for Power Bi on a weekly basis, all which are aligned with their
product having gone from being a “follower” to a “leader” in the rank of Analytics and Business
Intelligence platforms (Richardson, Sallam, Schlegel, Austin, & Sun, 2020).
In accord with the Gartner Report, Power BI has some strengths and weaknesses and/or
cautions to take in consideration for an organization when deciding upon if Microsoft BI-platform is
the best choice.
Strengths:
• With a fast-increasing number of users, the Microsoft Powe-BI tool becomes a more common
choice by many organizations as it is easily accessible throughout the office 365 platform
which is frequently applied by enterprises today. Many larger corporations such as Hewlett
Packard, Rolls-Royce and Henkel are deriving insights and advanced analytics through the
Power BI platform (Iliashenko, Iliashenko, & Esser, 2019).In addition to the accessibility
through Microsoft other systems the considerable low pricing model of $10 per/month for a
Power BI subscription the platform becomes more popular and which results in further
advancements in updates and new deployments to maintain their leading position
(Richardson, Sallam, Schlegel, Austin, & Sun, 2020).
• The extensive usage of Microsoft’s other products such as Microsoft Excel, the ability to learn
Power BI is much more adaptive to as many users already have previous skills and knowledge
in other Microsoft product range. This brings Power Bi to be generally more easily
implemented and the steps to utilize the deeper analytical functions shorter for new users as
the interface function in similarity.
21
• With Microsoft’s advancing with frequent updates of their BI-platform the product has
advances and outpaced many competitors through their innovative capabilities in automated
ML and augmented analytics (Richardson, Sallam, Schlegel, Austin, & Sun, 2020).
Weaknesses:
• The differences form the Power BI cloud service, and the On-premises service of the platform
are large, where key functionality such as streaming analytics natural language Q&A and
alerting is insufficient in the on-premises version (Richardson, Sallam, Schlegel, Austin, & Sun,
2020).
• An enterprise adopting Microsoft’s analytical and BI-platforms through the cloud are limited
to only use the Azure Cloud-solution as IaaS.
2.2.2.2. Tableau:
The BI-suit of Tableau is today in widely used among large enterprises as well as smaller
organizations, some of the well know users of the Tableau BI and analytic tools are Amazon, Pfizer
and Bank of America (Iliashenko, Iliashenko, & Esser, 2019). Tableau offers similar to the other top
contenders visual-based exploration of data for business users to derive and find patterns in their
data. The aspects which have significantly increased the market position for Tableau is their later
offerings of add-ons for augmented analytics where Natural Language Processing is providing
automated insights, as well as further enhanced data governance capabilities (Richardson, Sallam,
Schlegel, Austin, & Sun, 2020).
Tableau has over-time being one of the top leaders in the market segment, in 2019 it became
public that their competitor and of BI/CRM-platform provider Salesforce completed an acquisition of
Tableau (Richardson, Sallam, Schlegel, Austin, & Sun, 2020). Though this acquisition first was put on
hold by Competition Market Authorities the acquisition got cleared and the combined portfolio will
most likely strengthen both services.
Strength:
• With a large community of users Tableau demonstrate a high positive attitude of their
products and the community is almost fanlike where approximately 20.000 users attended
their yearly conference 2019 (Richardson, Sallam, Schlegel, Austin, & Sun, 2020). This
popularity among users drive new ideas and innovation both by the company internally as
well as externally by the fans.
• Tableau was one of the early adopters of more elaborative data visualization and have since
continued to excel in this area of making it more effortless for its users to create various
types of visualizations to present and identify insights.
• The tool provides the ability of great connectivity to a wide range of data sources, this has
also been one of the key success factors Tableau of providing users’ visual perceptions of the
various sources of data (Richardson, Sallam, Schlegel, Austin, & Sun, 2020).

22
Weaknesses:
• As one of their strength of being leaders in visualizations this aspect can also be seen as a
possible weakness for Tableau (Richardson, Sallam, Schlegel, Austin, & Sun, 2020). This is due
to the segment of BI-tools and platform moving towards augmented techniques and the
differences between visualizations between its competitors are not as large as it used to be.
• In comparison to the competitive market the aspect of data governance is not as developed
within the Tableau platform as in others. According to Richardson et al. (2020), and through
enquiries the Tableau receives the weakest reviews in relations to the possibilities of data
governance.
• The pricing model of Tableau have been widely appreciated by the general low-cost offering
of being a more advanced tool of BI and analytics. Though in the last years with the
company’s add-on features of i.e., Data management and other critical tools the company
has a higher price range. This difference and price setting for the company can be an issue
where new and needed functionalities are at larger expenses for the using organizations
(Richardson, Sallam, Schlegel, Austin, & Sun, 2020)
2.2.2.3. Qlik:
As the third reviewed BI-tool provider Qlik has today over 50.000 customers worldwide
where some of them are companies like PayPal, Airbus and Deloitte. The company offers today BI-
solution platforms through their two main products QlikView and Qlik Sense, where the second
named product is their latest and more advanced solution. Including in both products is the unique
Qlik Associative Engine, which differentiates from other competitors of not being a directly query-
based tool for analysis (Qlik, 2020). According to Richardson et al. (2020), this solution lets users of
various skill levels to operate and use the Qlik tool of combining data from various sources with less
experience as needed in other query-based tool. This specification of associative engine for the Qlik-
tools enables the utilization of AI/ML functionalities through context-aware insights and augmented
analysis which have been identified as an important aspect for future of BI-tools (Richardson, Sallam,
Schlegel, Austin, & Sun, 2020)
With their leading product of Qlik Sense, the company offers this as a SaaS solution creating
the accessibility through multiple devices and browsers. Among the many options of BI-tools and
platforms in the market Nudie Jeans Co., decided to implement the Qlik Sense solution. Of the
various deployments of this platform, they choose the Enterprise version, which is full a full SaaS
solution, which will be providing analytical insights throughout the whole company and its
subsidiaries.
Strength:
• Qlik and through their product catalogue have been distinguished over the years for their
flexibility of having the capabilities of a multi-cloud setup, where the customer can use on-
premises, cloud solutions or a mix-up of both types of infrastructure setup (Richardson,
Sallam, Schlegel, Austin, & Sun, 2020)

23
• Being in the segment of the BI and analytical tools for a longer period, Qlik has under the
years developed a profound product portfolio covering many of the aspects in the analytics
life cycle. More basic Business Analysts roles using capabilities of data visualizations as well
as more in-depth developer analytics are supported in the Qlik range of products which gives
an extensive range of capabilities in their platforms. (Richardson, Sallam, Schlegel, Austin, &
Sun, 2020). In accordance to the different level of expertice the Qlik tools are generally seen
as user friendly and easy to learn despite what background or previous skills the user has.
• Through the achievements of adding augmented analytics Qlik offers insights capabilities that
is unique to this provider to automatically uncover insights that more frequently would be
hidden in query-based tools (Richardson, Sallam, Schlegel, Austin, & Sun, 2020).
• Over the years Qlik has also developed and more easily comprehendable data literacy
process where users with no or little knowlegde of data can understand the data trhough
their Data Literacy Project (Richardson, Sallam, Schlegel, Austin, & Sun, 2020).
Weaknesses:
• With their newer and more advanced tool of Qlik Sense, many customers are still using the
older BI-platform Qlik View. Signs shows that the company and its users have issues with the
product migration to Qlik Sense, where customers point out that the complexity and
knowledge gap of upgrading the system is a concern (Richardson, Sallam, Schlegel, Austin, &
Sun, 2020). This slower paced transition to the Qlik Sense could possibly inhibit and delay
further developments as users are not investing in the new tool as swiftly.
• In addition, to the above Qlik may be somewhat missing out on momentum where users are
not implementing the Qlik Sense as rapidly as thought. Qlik could lose momentum in
advancements of new acquisitions and developments as users stay with their older BI-
platform Qlik View.
2.2.3. Predictive Demand Planning Methods
The part of the internship focused on Predictive demand planning and/or forecasting is as
previously stated based upon the report by Singh et al (2019), and their efforts of using ML-models
for the purpose. In line with the named report the focus was set on tree-based and Deep learning
models through a large data set of more than 1 million records in Azure instance (Singh, Gupta, Jha,
& Rajan, 2019). In comparison, the planned models of this report will be done through a smaller set
of data to explore the possibility of predictive demand planning through ML-models.
The data manipulation and efforts within the forming of models will be done with web-based
Jupyter Notebook, with selections of extracted data from Nudie Jeans through the coding-language
of Python. Within this tool of working with code to perform ML-models and visualizations extended
libraries such as example scikit-learn. These libraries enable the utilization of ML models within the
Jupyter Notebook environment.
24
There are several methods and models to predict and forecast demand of products, though in
accordance with the literature review the Gradient Boosted Tree and will be applied within this
internship report. Below section provides outlined description of the functionality of this model:
2.2.3.1. Gradient Boosted (GB)
The models of Gradient Boosting (GB) are a type of ensemble learning method that combines
multiple weak learners in prediction problems to stronger learners, all which to develop higher
accuracy of the model. This type of model falls under the segment of supervised machine learning
models. Most commonly the GB-models in ML-problem are built up in ensemble of decision trees
(DT) but there are no set requirements, e.g. Neural Networks could also be used as functional (Zhang,
Zhao, Canes, Steinberg, & Lyashevska, 2019). The ensemble models are built upon base learning
algorithms which produces weak rules upon each iteration and are as previously stated based DT.
After multiple iterations, the weak learners are combined to produce a stronger prediction.
According to Friedman (2002), the GB model provides an additive regression model by
sequentially fitting base learner by least squares at each iteration, where loss function is being
minimized by each iteration. Continuing the GB models improves the prediction efficiency starting
with a weak learner, where more attention is put to the misclassified predictions, this is iteratively
computed until all the misclassified predictions are corrected (Zhang, Zhao, Canes, Steinberg, &
Lyashevska, 2019).
Applying the GB-model through scikit-learn library there are different parameters to adjust for
the model to work as functional and be as efficient as possible. In general terms the parameters of
GB-models can be sectioned in to 3 main categories.
1) Tree-specific Parameters: Adjusts the setup parameters controlling the base learning models
within the ensemble of Decision trees. In example this parameter can be min_sample_split,
which constrains the minimum number of observations that are needed in a node for a split
(scikti.learn, 2020)
2) Boosting Parameter: Alter the conditions of the boosting application of the model. One of the
main parameters in this category is the n_estimators, which sets the number of sequential trees
that the model is built on (scikti.learn, 2020).
3) Miscellaneous Parameters: Are the overall criterion that are affecting on functionality.
Important parameters here is the loss, which determine what loss function to be used in the
model. In scikit.learn library the following functions are available “ls”- Least square regression,
“lad” – least absolute deviation, “huber”- combination of “ls” and “lad” and “quantile”- quantile
regression (scikti.learn, 2020).
Regarding the prior study of influence, much of the initial settings will be done accordingly to
their presented setup through the GB-Regression model. According to Singh et al. ( 2019), the GB-
regrission model was set up w Loss Function: Huber, and Criterion: MSE (mean squared error).

25
3. METHODOLOGY
The main purpose of this chapter is to provide and structural approach to the work within the
internship and describing the conceptual frameworks utilized to capture knowledge and insights.
With references to the set phases of the internship work-project interviews and domain specific
approaches is explained over the coming sections.
The adopted framework for phase 2 and 3 is described below. Application of this specific
framework was made as it is, in its versatility, applicable for both Decision Science and Data Science.
In adoption to the two applicable processes: Phase 2 will be set through the decision Science
framework of developing KPI’s, dashboards and reports within the domain of BI. Phase 3 is set to
develop a predictive demand planning model which will be formed around the approach of Data
science.
As addition to the presented frameworks interview through out the internship has been
conducted to retain broader understanding and insights of Nudie Jeans operations, business need
and strategy.
3.1. BADIR
The BADIR (“Business Question, Analysis Plan, Data Collection, Insights and Recommendation”),
is a formalized framework to streamline the steps from business needs and/or questions need
through an analytical approach insights and recommendations. This framework was originally
developed by Piyanka Jain, as a five-step process framework on how to turn data into to decisions.
The framework establishes a streamlined and comprehendible breakdown of the methodology on
how companies and organizations can work structured from a set of business questions and/or needs
to data-driven recommendations (Jain & Sharma, 2014). Figure 7, showcases the five articulated
steps of the approach.
Figure 7. BADIR-framework overview. Source: aryng.com (October, 2020)
This approach with its setup provides multifunctional application of both decision science and
data science related problems. In general, there is a slight difference on how the BADIR approach is
implemented between the two categories of problem. Hence the five steps are the same but with
some specified variation within each step with for the purpose of adoption (Jain & Sharma, 2014).
As this internship covers a general objective of digital transformation along with the specified
phases and objectives this methodology of BADIR will subsequently and primally be applied to Phase
2, and Phase 3. With the two-part approaches the Decision science format will be utilized in phase 2
and Data science scheme for the Phase 3. This combinative ratification and choice of methodology is
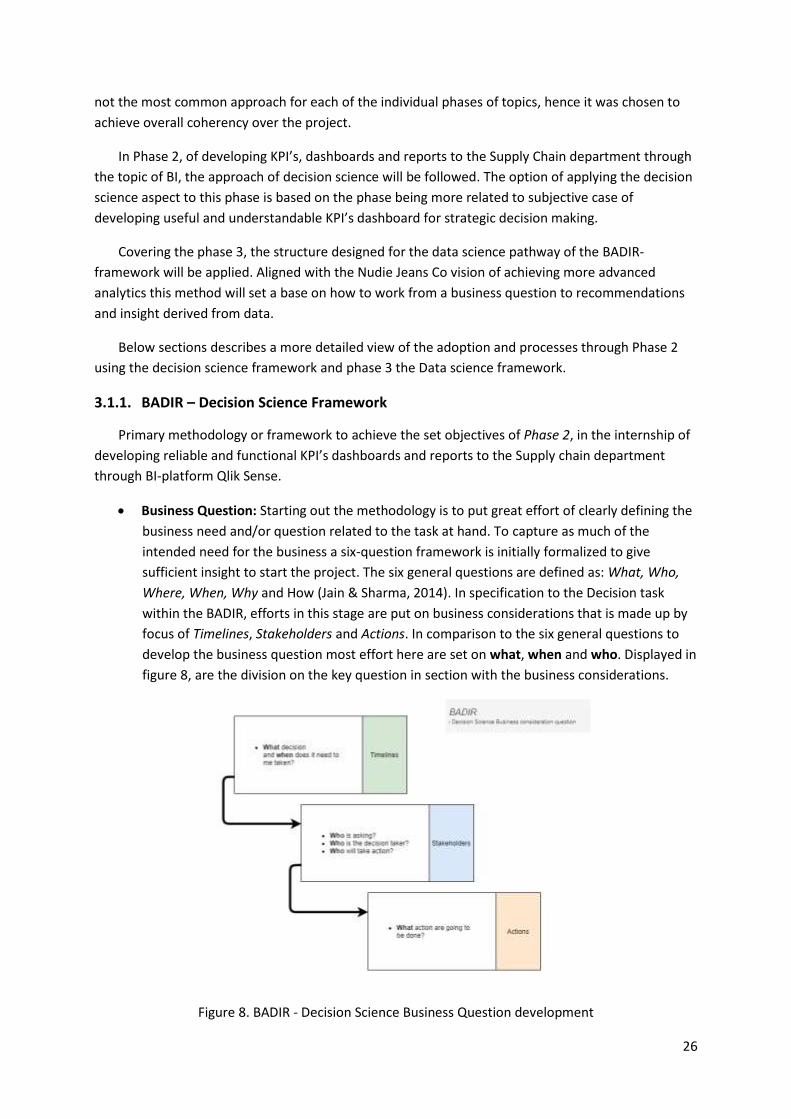
26
not the most common approach for each of the individual phases of topics, hence it was chosen to
achieve overall coherency over the project.
In Phase 2, of developing KPI’s, dashboards and reports to the Supply Chain department through
the topic of BI, the approach of decision science will be followed. The option of applying the decision
science aspect to this phase is based on the phase being more related to subjective case of
developing useful and understandable KPI’s dashboard for strategic decision making.
Covering the phase 3, the structure designed for the data science pathway of the BADIR-
framework will be applied. Aligned with the Nudie Jeans Co vision of achieving more advanced
analytics this method will set a base on how to work from a business question to recommendations
and insight derived from data.
Below sections describes a more detailed view of the adoption and processes through Phase 2
using the decision science framework and phase 3 the Data science framework.
3.1.1. BADIR – Decision Science Framework
Primary methodology or framework to achieve the set objectives of Phase 2, in the internship of
developing reliable and functional KPI’s dashboards and reports to the Supply chain department
through BI-platform Qlik Sense.
• Business Question: Starting out the methodology is to put great effort of clearly defining the
business need and/or question related to the task at hand. To capture as much of the
intended need for the business a six-question framework is initially formalized to give
sufficient insight to start the project. The six general questions are defined as: What, Who,
Where, When, Why and How (Jain & Sharma, 2014). In specification to the Decision task
within the BADIR, efforts in this stage are put on business considerations that is made up by
focus of Timelines, Stakeholders and Actions. In comparison to the six general questions to
develop the business question most effort here are set on what, when and who. Displayed in
figure 8, are the division on the key question in section with the business considerations.
Figure 8. BADIR - Decision Science Business Question development
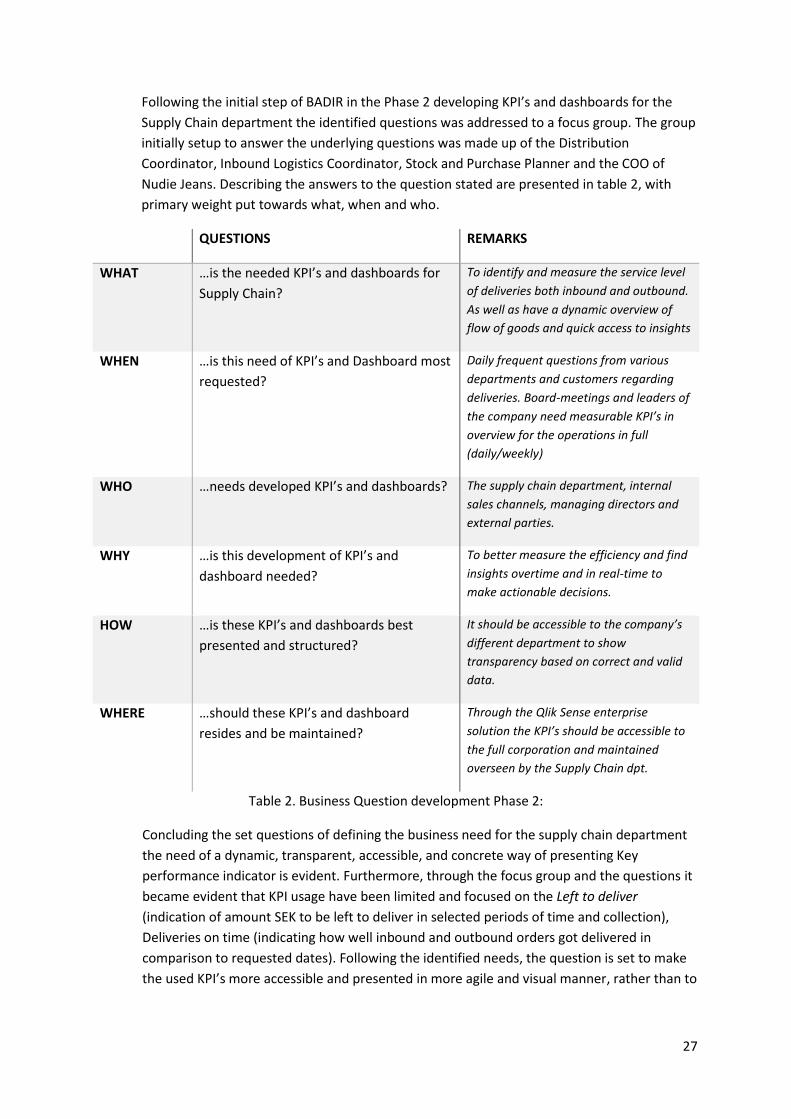
27
Following the initial step of BADIR in the Phase 2 developing KPI’s and dashboards for the
Supply Chain department the identified questions was addressed to a focus group. The group
initially setup to answer the underlying questions was made up of the Distribution
Coordinator, Inbound Logistics Coordinator, Stock and Purchase Planner and the COO of
Nudie Jeans. Describing the answers to the question stated are presented in table 2, with
primary weight put towards what, when and who.
QUESTIONS REMARKS
WHAT …is the needed KPI’s and dashboards for
Supply Chain?
To identify and measure the service level
of deliveries both inbound and outbound.
As well as have a dynamic overview of
flow of goods and quick access to insights
WHEN …is this need of KPI’s and Dashboard most
requested?
Daily frequent questions from various
departments and customers regarding
deliveries. Board-meetings and leaders of
the company need measurable KPI’s in
overview for the operations in full
(daily/weekly)
WHO …needs developed KPI’s and dashboards? The supply chain department, internal
sales channels, managing directors and
external parties.
WHY …is this development of KPI’s and
dashboard needed?
To better measure the efficiency and find
insights overtime and in real-time to
make actionable decisions.
HOW …is these KPI’s and dashboards best
presented and structured?
It should be accessible to the company’s
different department to show
transparency based on correct and valid
data.
WHERE …should these KPI’s and dashboard
resides and be maintained?
Through the Qlik Sense enterprise
solution the KPI’s should be accessible to
the full corporation and maintained
overseen by the Supply Chain dpt.
Table 2. Business Question development Phase 2:
Concluding the set questions of defining the business need for the supply chain department
the need of a dynamic, transparent, accessible, and concrete way of presenting Key
performance indicator is evident. Furthermore, through the focus group and the questions it
became evident that KPI usage have been limited and focused on the Left to deliver
(indication of amount SEK to be left to deliver in selected periods of time and collection),
Deliveries on time (indicating how well inbound and outbound orders got delivered in
comparison to requested dates). Following the identified needs, the question is set to make
the used KPI’s more accessible and presented in more agile and visual manner, rather than to

28
start developing new KPI’s. Hence newly developed KPI’s are set as a future desire to
increase the measuring capabilities of efficiency and operations.
• Analysis Plan: The second step in the framework is to set up an Analysis Plan, were
stakeholders and internal departments connected to the project are invited to reoccurring
conversations and/or meetings to discuss the development (Jain & Sharma, 2014).
Commonly this starts of with kick-off meeting where the project is lunched through assignees
being assigned task and the project plan is settled. By this initial step of defining a clear
structured analysis plan the stakeholders are aligned with the expectations of the project as
well as through reoccurring meetings are briefed with status updates.
After the initial focus-group meetings to define the business need a Project star-up meeting
was set with the stakeholders internally and with external consultants of Nudie Jeans. The
project start meeting focused on the understanding and the usage of the defined business
needs by the supply chain department and their expectations of the project. A formalized
project plan was rolled out with set deadlines and sprints to fulfill the business need stated
as well as scheduled follow-up meetings on weekly session. Agendas for each weekly meeting
was set prior to the scheduled time to enable stakeholders to be prepared and increase the
efficiency in the meetings.
As commentative medium through the project the SaaS tool Asana was chosen to discuss
issues, provide updates, structuralize assignees, and set deadlines.
• Data Collection: Following the steps of defining business needs and setting the project or
analysis plan is to review, understand, identify, and structure the data to be used as
underlying base for the analysis efforts. Importance to this step is vital for the coming
analytical processes, as if the data used are incorrect or not properly managed the output
will be useless or even worse providing miss guided insights for decision-takers (Jain &
Sharma, 2014).
The step is divided up into two preparatory steps before the data collection can be
completed: these are the Data Pull and Data cleansing and validation. The Data Pull, which
the defines where the data should be pulled from and what time-range it should be covering.
The second part of Data Cleansing and Validation is a process that takes much of the projects
efforts in time by cleaning the pulled data and validate through testing’s and in consolidation
with stakeholders (Jain & Sharma, 2014).
Within the phase 2, of the project the data to be used in the Qlik Sense BI-tool was pulled
from the main ERP-system (M3) of Nudie Jeans. Aligned with the set analysis plan and the
needed data du build the KPI’s selection of the needed variables and fields from the ERP
system was stated and selected in the data pull. The data loaded into the SaaS version of the
Qlik Sense Enterprise was validated in regard to the specified variables that were to be used
in the KPI’s and dashboard setup. Validation the data was conducted both through trials of
simpler test by of context within Qlik Sense but also along with checking exact description of
the fields through the backend of the ERP-system.
29
• Derive Insights: This step includes the testing of what insights can be derived from the data
cleaned and validated and to detect any abnormalities. According to the Jain & Sharma
(2014), this part of the framework is to validate findings with key stakeholders along with the
opportunity to examine new business questions than possible erupted with the findings.
Possible new findings of priorly unseen opportunity are great for the further development to
start new project on. Some findings in this part can in many cases be adjusted or added
swiftly as the underlying data preparation has already been completed. Hence a structural
approach for new opportunities is still recommended.
Viewings of the result of the KPI’s performed and dashboards was as in accordance with the
BADIR-framework set in phase 2, where the key stakeholders from the initial focus group was
invited for a demo. Within this meetings feedback upon the dashboards was made as well as
recommendation for further development that was not stated in the beginning of the
project. As the Developed KPI’s for the supply chain department focus on the Service Level of
deliveries on time (DOT) and deliveries in full (DIF), additional KPI’s such as adding external
sources of carbon emissions for the supply chain has been lifted.
• Recommendations: The final step in the framework adopted is set to formulize and make a
walk-through the full project including all the steps. This part set to discuss eventual issues
solved or experienced as well as presenting the final product of the project. Commonly this is
presented again to the key stakeholders that participated in the Derive Insights step but can
also include related departments to influence future and cross-functional development.
In regard to this last section of the framework, the phase 2 part of the internship has not
directly gone through a larger presentation with exception form the Derive Insights meeting.
Hence work and sharing the KPI’s and dashboards over different departments has been
conducted as well as presented the developed KPI’s to management.
3.1.2. BADIR – Data Science Framework
As structured from Phase 3: in this internship below sections and parts of the BADIR-framework
are used to pilot the general business need towards a model of prediction in future demand. The
structure for this part of the internship is based around the Data science track of BADIR.
• Business Question: With many relations to the procedure of the Business question-step
introduced for the decision science this par also includes the six initial questions to defining
the business question and/or hypothesis. The Context, Impacted Segment and Potential
Reasons are the drivers in this track of the BADIR-framework (Jain & Sharma, 2014).
Described in figure 9, are the setup and specified for the data science related projects (Jain &
Sharma, 2014).
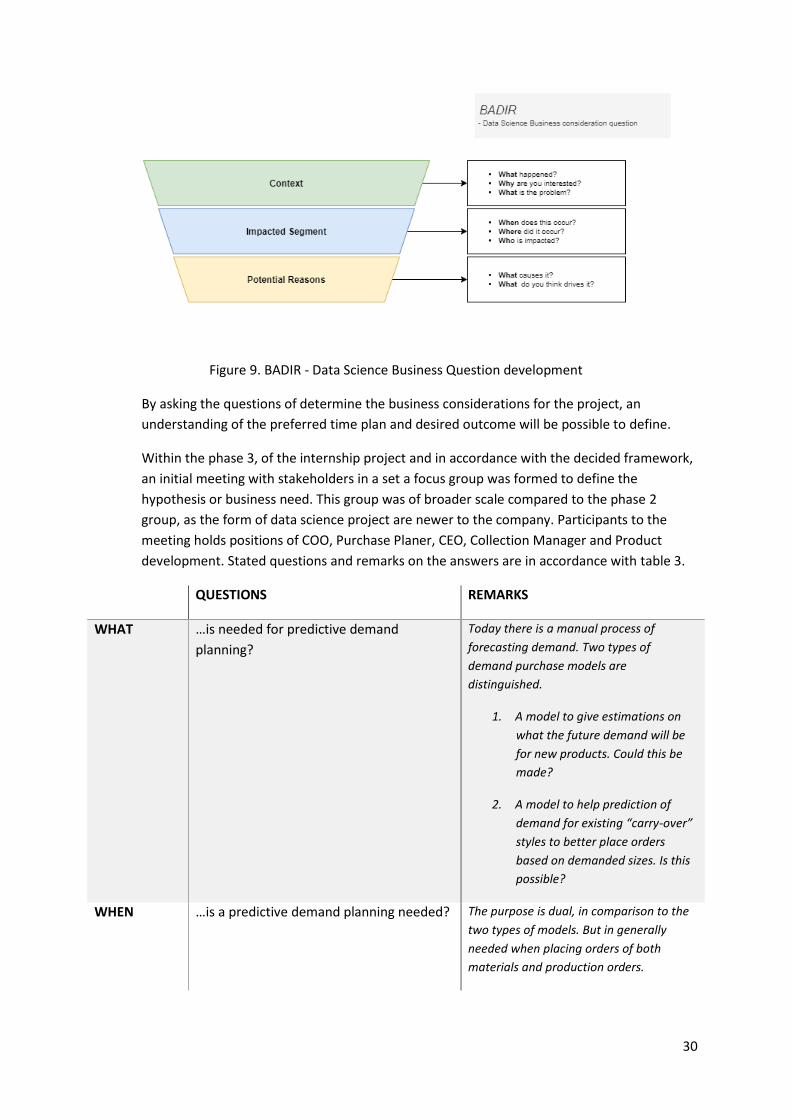
30
Figure 9. BADIR - Data Science Business Question development
By asking the questions of determine the business considerations for the project, an
understanding of the preferred time plan and desired outcome will be possible to define.
Within the phase 3, of the internship project and in accordance with the decided framework,
an initial meeting with stakeholders in a set a focus group was formed to define the
hypothesis or business need. This group was of broader scale compared to the phase 2
group, as the form of data science project are newer to the company. Participants to the
meeting holds positions of COO, Purchase Planer, CEO, Collection Manager and Product
development. Stated questions and remarks on the answers are in accordance with table 3.
QUESTIONS REMARKS
WHAT …is needed for predictive demand
planning?
Today there is a manual process of
forecasting demand. Two types of
demand purchase models are
distinguished.
1. A model to give estimations on
what the future demand will be
for new products. Could this be
made?
2. A model to help prediction of
demand for existing “carry-over”
styles to better place orders
based on demanded sizes. Is this
possible?
WHEN …is a predictive demand planning needed? The purpose is dual, in comparison to the
two types of models. But in generally
needed when placing orders of both
materials and production orders.

31
WHO …needs a predictive demand planning
model?
The model would be used by both design
and product development department as
well as supply chain for purchasing.
WHY …is predictive demand planning model
needed?
A more data driven machine learning
model for prediction future demand is
aligned with the company’s goals of
becoming mor digitally enhanced/mature.
Desire to be more data driven through
advanced analytics.
HOW …is predictive demand planning model
helping Nudie jeans?
The functional and efficient prediction
model would assist in better fulfilling the
demand of customer orders as well as
hopefully decreasing the stock-value.
WHERE …did the need for predictive demand
planning model come from?
The need for a model comes from similar
to the “HOW” but also from the desire and
vision to be a more data driven company.
Table 3. Business Question development Phase 3:
The information derived from the first meeting by posing the six defined questions the
business need was collected. Due to the dual business need of what a predictive demand
planning model should focus on it is evident that the company is eager adopt this type of
analytics. Though in consideration of and based on the literature review the focus of this
phase will be to aid in the forecast of future demand of new products. The specified business
question formulated is “How can Nudie Jeans with advanced analytics aid in the process of
forecast future demand of new products?”
To consolidate this into a hypothesis and/or business question it would be Can a predictive demand
model through ML-techniques aid efficiently in forecasting of new products?
• Analysis Plan: With the stated business questions leading into this step, a proper analysis
planning is important for the project not to halt. To properly set up an analysis plan it should
be built upon five blocks of Analysis Plan of the BADIR-framework aimed for data science
(Jain & Sharma, 2014). These critical building blocks are set up in chronological order of
Analysis Goals, Hypothesis, Methodology, Data Specification and Project Plan. All these
aspects should be clearly distinguished before a first kick-off meeting is conducted with the
identified key stakeholders.
In accordance with the five blocks, the first one of defining the analysis goal are aimed to
narrow down the broader defined business question to an analysis goal which is reach able
and agreed upon by the stakeholders (Jain & Sharma, 2014). When this is completed a
definition of an hypotheses is made for the project, an hypothesis to prove correct or fales.
Following the definition of the hypotheses is the decision on methodology which according
to Jain & Sharma (2014), is for example different types of analysis methods, such as Trend
Analysis, Segmentation and Predicative analytics. In connection to the choice of type of
analysis the data specifications are conducted to ensure only relevant data that can be

32
needed to potentially prove the hypothesis is collected (Jain & Sharma, 2014). Lastly is the
structing of the project plan with set deadlines, identification of assignees, needed resources
and clear prioritizations.
Phase 3 of the internship project and the Analysis plan started out by defining the hypothesis
based on the retrieved business question through communications with the stakeholders.
The set hypothesis to be proven, or not proven is defined as “Can a predictive demand model
through ML-techniques make significantly better forecast then current methods applied at
Nudie Jeans for new products?”. The type of analysis method for the project is set to a
predictive analysis and the data specifications are to be aimed to contain data related
product characteristics, marketing campaign, sales and discount and availability.
The structured project plan for this phase is as prior phases implemented in the SaaS project
management tool Asana, which enables clear overview of the project as well as
functionalities of assignees, deadlines etc.
• Data Collection: This step is in general the same approach as in the decision science track of
the BADIR-framework. The importance lays pulling the correct data from with in a set time
frame from the data source along with reviewing and understanding the pulled data. In
comparison more efforts of cleaning the data through transformations and validation is
required to enable a proficient analysis ML-model to function. This step in many data mining
and science project account for approximately 80% of the workload of preparing the data for
the coming modeling.
For phase 3, the extraction of data will in manly be from the Nudie Jeans main ERP-system.
Hence this extraction of datasets to the project at hand can be done both through their BI-
platform Qlik Sense or directly from the ERP-system. The preparatory work of validation the
data and cleaning the extraction will be managed through a Jupyter Notebook.
• Derive Insights: The focus of this step is to review patterns within the data, to model the
predictive analysis to prove or disprove the hypothesis and present findings within the
modeling work (Jain & Sharma, 2014).
The work in this step is mostly focused within the Jupyter notebook of building the GB-
regression models to see if this first base model will prove or disapprove the hypothesis.
Additionally, insight not directly seen in other systems of the company may be derived
through the data exploration phase with precedes the modeling phase.
• Recommendations: The last step in the is the data science track of BADIR in like the decision
science track. A more formal presentations of the work, insights and result of the project is
presented to the stakeholders. In addition to this track an executive summary is will be
presented for the audience to pose key questions of the work (Jain & Sharma, 2014).
Regarding the internship this report will be set as a documentation report for the
stakeholders to review and understand the concept. A final presentation of the work will also
be set to present to full internship as well as this stage of the phase 3, of predictive demand
planning.
33
4. PROJECT DETAILS (RESULT & DISCUSSION)
This chapter provides a process description of the different phases in the overviewing part of
Nudie Jeans Co. Digital transformation. The phases are set chronology throughout the internship
where the 1st project starts with the company’s shift and lift towards a cloud-based computing and
storage service. The 2nd phase focuses on the implementation of the newly acquired BI-tool software
Qlik Sense and the setup of reports and dashboard for Nudie Jeans Co’s Supply Chain department.
Lastly the 3rd phase involves the step of adding Machine Learning models to the operations of the
purchasing process. This is first inhouse project of enhanced analytics and data science related
aspects for the company, where much of the effort is put towards following there BADIR-framework
of formulating the project.
4.1. PHASE 1: LIFT & SHIFT
With regards to overviewing objective of digital transformation, this first phase of the internship
was initial set around understanding Nudie Jeans operational flow and usage of systems to be able to
function as a supportive role project of server migration, from on-premises to a cloud-based solution.
Basic understanding of cloud computing and the frameworks which the topic covers were to
examine and grasp a more in-depth understanding of the field and the strategic reasons for the
migration. Review of the technical aspects of cloud-solutions have been identified on the different
types of cloud-solutions (IaaS, PaaS, and SaaS) with comparison to on-premises setup. Interviews
and meetings with stakeholders and key personnel being administrative for the lift was conducted to
capture the business needs and goals with the set shift.
The general tasks appointed for the phase 1, was to prepare, structure and plan testing of the
operational flow for the Supply Chain department in critical ERP-system prior the lift to the cloud-
based solution. Furthermore, to act as a general support in the transition was appointed as well as
develop a clear system infrastructure mapping with described integrations and usage per
department.
4.1.1. Work progress & results - Phase 1:
At the start of the internship, Nudie Jeans Co. was already in the preparatory work for the
decision and planed shift from a full on-premises IT infrastructure to a Microsoft Azure IaaS cloud
solution. This decision of migration was based upon yearly review of the cost and ROI-rate for
running the operational it-infrastructure through a cloud provider compared to on-premises solution.
The pricing and cost-structure for cloud solutions have rapidly changed over the last couple of years
as the segment have experienced a large growth in demand. Additionally, to the cost-structure the
shift was also empowered of the companies desire to stay competitive in the future and access the
scalability that cloud-based solutions provide. Hence the lift to Azure did not fully disable the
functionality usage of an on-premises server solution. Some aspects of e.g., photos and Art directory
file material are still stored and set through the on-premises server due the size of the files and the
demand for fast access. In this sense the architecture of Nudie jeans systems setup can today be set
as a hybrid-solution whereas most of the core business and transactional data is working through the
new Azure IaaS environment.
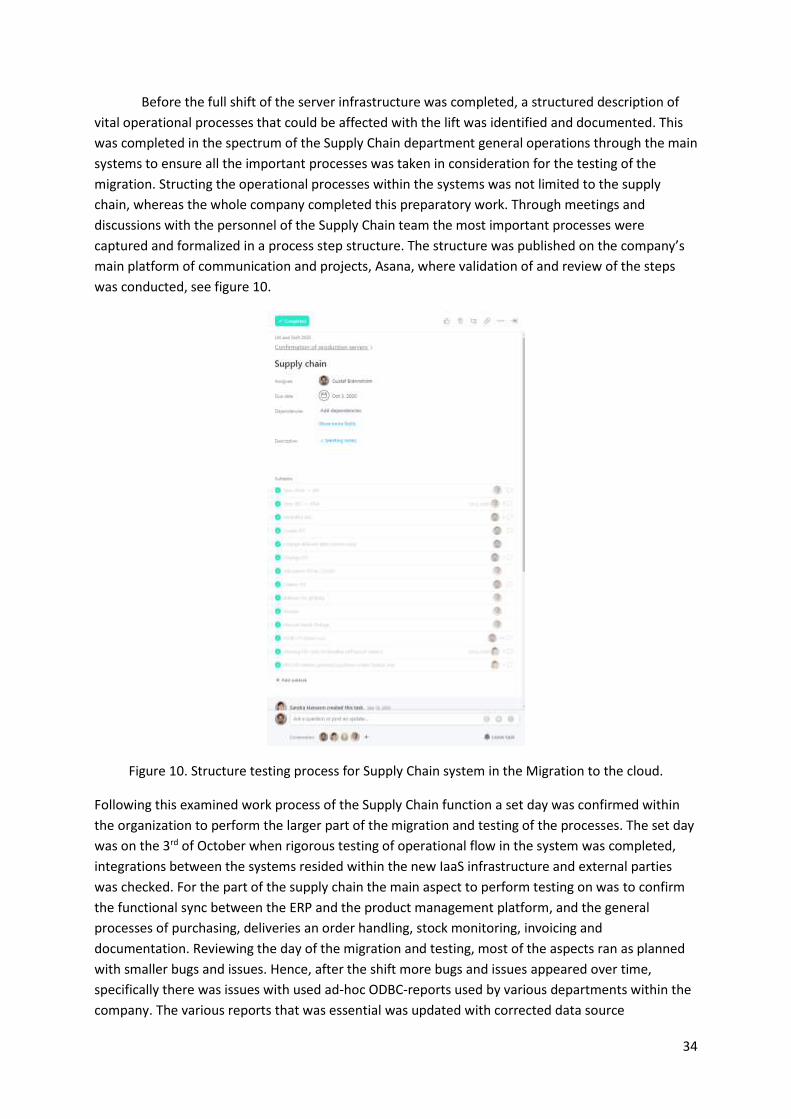
34
Before the full shift of the server infrastructure was completed, a structured description of
vital operational processes that could be affected with the lift was identified and documented. This
was completed in the spectrum of the Supply Chain department general operations through the main
systems to ensure all the important processes was taken in consideration for the testing of the
migration. Structing the operational processes within the systems was not limited to the supply
chain, whereas the whole company completed this preparatory work. Through meetings and
discussions with the personnel of the Supply Chain team the most important processes were
captured and formalized in a process step structure. The structure was published on the company’s
main platform of communication and projects, Asana, where validation of and review of the steps
was conducted, see figure 10.
Figure 10. Structure testing process for Supply Chain system in the Migration to the cloud.
Following this examined work process of the Supply Chain function a set day was confirmed within
the organization to perform the larger part of the migration and testing of the processes. The set day
was on the 3rd of October when rigorous testing of operational flow in the system was completed,
integrations between the systems resided within the new IaaS infrastructure and external parties
was checked. For the part of the supply chain the main aspect to perform testing on was to confirm
the functional sync between the ERP and the product management platform, and the general
processes of purchasing, deliveries an order handling, stock monitoring, invoicing and
documentation. Reviewing the day of the migration and testing, most of the aspects ran as planned
with smaller bugs and issues. Hence, after the shift more bugs and issues appeared over time,
specifically there was issues with used ad-hoc ODBC-reports used by various departments within the
company. The various reports that was essential was updated with corrected data source

35
connections and identifications keys, as well as updating the reports with SQL-hint command “WITH
(NOLOCK)”. This SQL statement was not encoded in the prior ad-hoc reports used by the company by
became an evident need when the migration took place to override previous transaction isolation
levels created from queries without the NOLOCK statement.
A meeting with the IT-department was set after the migration and majority of the bugs and
issues was solved. At this meeting general concepts of the systems and the IT-infrastructure was
further discussing, and an additional business need and/or task was formed at this meeting. The new
task assigned into the internship was to visually map the min system infrastructure and how the
systems are dependent and integrated. Hence due to confidentiality requirements by the IT-
department the completed mapping will not be presented in this report. Though to provide an
overview of the main systems structure of the company and their purpose see appendix 1. In
specification of the mapping of Nude Jeans system infrastructure the concepts of what kind of
service each system withholds is of importance along side how the systems are integrated. This is
were much of the technical review aspects are put into effort. Due to confidentiality, the presented
appendix in this report has limited information.
Shifting much of Nudie Jeans system structure towards the IaaS Azure solution there is also
and evident change where both ERP and PLM systems used today by Nudie Jeans are releasing full
SaaS solution instead of the current applied one. In accordance with this and in business of Retail
Fashion it can be preferable to not own the infrastructure rather than to pay monthly fees for SaaS
solutions where all the maintained and system related tasks are outsourcing to third party.
Evaluations will be done yearly by the company to see the possibilities of shifting more of the older
systems to full SaaS solutions as providers releases and improves these setups.
4.2. PHASE 2: QLIK SENSE IMPLEMENTATION
Phase 2, of the internship is formally structured around the BAIDR-framework in the decision
science track where the steps of progress are described in section 3.1.1 (Methodology).
During the year of 2020, Nudie Jeans Co., took the strategic decision of upgrading their existing
BI-tool to the further enhanced SaaS BI-platform of Qlik Sense Enterprise version. This decision of
upgrading and implementing this new system came as a consequence of the strategy to maintain and
expand their market shares over the coming years where it has been clear that a more mature data
driven decision making is needed. Prior to Qlik Sense the company used the older BI-tool from the
same provider, Qlik View. In accordance with the technical review presented in 2.2.2 Qlik with their
newest service Qlik Sense is ranked top 3 in the market of BI-tool in 2020, along with Microsoft’s
Power-BI and Tableau’s BI-platform. Through communication and discussion with the stakeholders at
Nudie Jeans other BI-platform such as Power-Bi was evaluated before the decision of implementing
Qlik Sense. Hence much of the underlying decision criteria’s that lead to the choice of Qlik was based
upon price, product capabilities and then companies prior experience to Qlik’s products. Through the
examination of different providers, I came clear that the full change of BI-platform would be more
complex and take longer period if adopted a new provider compared to Qlik. Objectively the
“weaknesses” pointed out for Qlik and their further development can on the longer perspective be
subject of concern for Nudie Jeans, but at the same time Nudie Jeans are only now upgrading form
Qlik View to Qlik Sense so there are many new functionalities and tools in the platform to apply. As

36
the main segment of Nudie Jeans is to distribute and sell apparel, they will most likely not be early
adopters of new emerging IT-techniques until they are proven valuable and properly functional.
4.2.1. Work progress & results - Phase 2:
Working closely with the supply chain team and understanding their processes and needs for
BI-related dashboards, reports and KPI’s was essential for this phase of the internship. Aligned with
the steps of BADIR the project started out with a set focus group to define the needs and useful KPI’s
for the department. Considering the KPI’s for the department in question had not previously been
extracted or viewed from the older BI-tool Qlik View, new defined KPI’s for measuring the effected
for the supply chain was set. As the supply chain department mainly works with inbound orders,
outbound/distribution of orders and stock & purchase monitoring these were the aspects to
consider. Conclusively the first KPI’s to perform where based on the service level of both inbound
and outbound orders. Service level is set as “delivery-in-full” (DIF) and “delivery-on-time” (DOT).
Where the DIF KPI see the percentage of how well an assortment is delivered compared to requested
and/or ordered qty, the value is not only basing on the total but also aggregated on DIF on each size
and color of an order. The second based KPI of DOT, indicates the percentage of an order delivered
upon the requested delivery date.
The defined KPI’s set as a first business need for the development though the Qlik Sense
platform. Through out the process of validating and checking the data to build the KPI’s upon a
weekly meeting was set to ensure the data was correct. In the sense of date dimensions within the
company’s ERP-system there was extra effort needed to ensure the date to be used was the correct
one. This especially concerned the DOT KPI, where the requested and delivery date were found in
two different tables of order-head and order-line.
The visualizations and setup of the dashboards for the KPI’s were divided based on the
inbound and outbound orders, though with usage of the same type of defined KPI’s. To make the two
aspects of the supply chain and KPI’s coherent, the dashboards were similarly setup with some
differences depending on the data connected to the order types. The data from inbound orders and
outbound orders resided in different tables of the ERP-systems database as well as the order type
are built up on different set of variables. The main types of orders that had to be combined in these
dashboards was, Inbound KPI’s: Purchase Orders, Outbound: Customer Orders (CO’s) and
Distribution Orders (DO’S). Challenges arose to combine the CO’s and DO’s into the same KPI
dashboard as both order types are outbound orders but resides in different tables within the ERP-
system and dose have significant differences.
Shown in figure 11-12, are final output of Supply Chains KPI-dashboards including the
functionality to selectively choose if the user wants to look at DIF or DOT. Over the project advices
and inputs from stakeholders were considered to showcase more information and the possibility to
drill up and down on specific information within the dashboards.

37
Figure 11. Inbound KPI-dashboard Nudie Jeans
Figure 12. Outbound KPI-dashboard Nudie Jeans
Hence the KPI’s in figure 12, might not indicate the best values, but in consideration to the
timeframe of January 2021 were many stores being set in lock-down due to the COVID-19 pandemic
this displays the reality.
After completion of the KPI-dashboards further ad-hoc reports has been requested and work
towards understanding the need for the requests of the reports as well as developing them are
continuously been done. As example of a request of additional ad-hoc report came from the E-
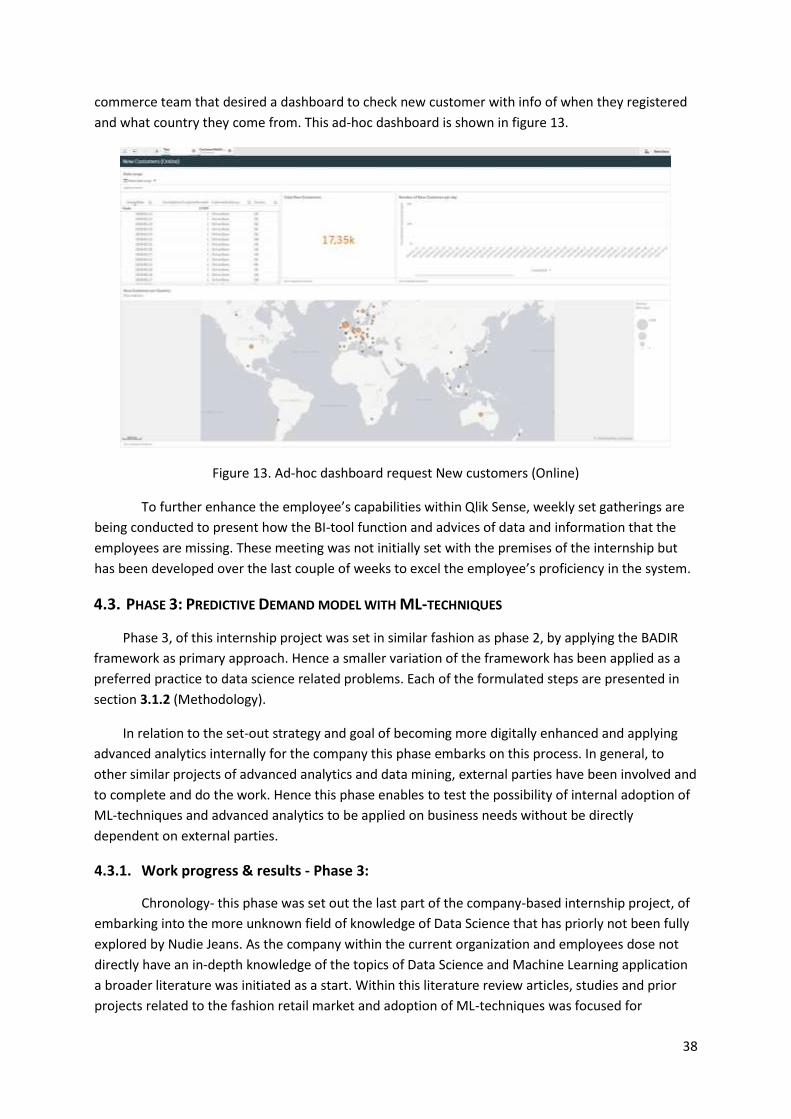
38
commerce team that desired a dashboard to check new customer with info of when they registered
and what country they come from. This ad-hoc dashboard is shown in figure 13.
Figure 13. Ad-hoc dashboard request New customers (Online)
To further enhance the employee’s capabilities within Qlik Sense, weekly set gatherings are
being conducted to present how the BI-tool function and advices of data and information that the
employees are missing. These meeting was not initially set with the premises of the internship but
has been developed over the last couple of weeks to excel the employee’s proficiency in the system.
4.3. PHASE 3: PREDICTIVE DEMAND MODEL WITH ML-TECHNIQUES
Phase 3, of this internship project was set in similar fashion as phase 2, by applying the BADIR
framework as primary approach. Hence a smaller variation of the framework has been applied as a
preferred practice to data science related problems. Each of the formulated steps are presented in
section 3.1.2 (Methodology).
In relation to the set-out strategy and goal of becoming more digitally enhanced and applying
advanced analytics internally for the company this phase embarks on this process. In general, to
other similar projects of advanced analytics and data mining, external parties have been involved and
to complete and do the work. Hence this phase enables to test the possibility of internal adoption of
ML-techniques and advanced analytics to be applied on business needs without be directly
dependent on external parties.
4.3.1. Work progress & results - Phase 3:
Chronology- this phase was set out the last part of the company-based internship project, of
embarking into the more unknown field of knowledge of Data Science that has priorly not been fully
explored by Nudie Jeans. As the company within the current organization and employees dose not
directly have an in-depth knowledge of the topics of Data Science and Machine Learning application
a broader literature was initiated as a start. Within this literature review articles, studies and prior
projects related to the fashion retail market and adoption of ML-techniques was focused for

39
inspiration and knowledge. Concurrently while working on the extensive literature review the
structuring of the phase in accordance with all the steps in the BADIR-framework was built up in the
company’s main communication platform Asana.
Following the five-step framework, the first step was conducted of retrieving the Business
Questions, to fully understand and capture the need of Nudie Jeans and what they were expecting.
A teams-meeting was set and conducted where identified stakeholders from the
departments of Product development, Supply Chain and Management was questioned to define what
the main Business Need and/or Question would be for this phase. Result of these discissions a desire
of two types of predictive demand models was formulated.
1. A model to give estimations on what the future demand will be for new products. Could
this be made?
2. A model to help prediction of demand for existing “carry-over” styles to better place
orders based on demanded sizes. Is this possible?
Within regards to prior studies and work from the extensive literature review, a decision to
focus on the 1st presented model was made to align with inspirations gathered from the study of Sing
et al (2019).
In accordance with the selected purpose of demand planning model comprehended from
discussion with the stakeholders a formulated Hypothesis was also conducted to approach the
problem. The hypothesis was set as “Can a predictive demand model through ML-techniques aid
efficiently in forecasting of new products?”, to be general as this project is a base on how Nudie Jeans
can apply internal ML-techniques to business purposes.
Continuing the second step in the of Analysis Plan was processed in accordance with the
recommendations and requirements by the BADIR-framework. This part consists of building
clarification of five blocks of aspects, as well as a first kick-off meeting with the stakeholders,
(table,4).
Block: Description: Status
1 Analysis Goals To utilize ML-techniques of predicting future demand of new products. Completed
2 Hypothesis “Can a predictive demand model through ML-techniques aid efficiently
in forecasting of new products?”
Completed
3 Methodology Predictive Analytics – (Gradient Boosting) Completed
4 Data Specification Transactional and Production Information Data – Data Source: Infor
M3, retrieved directly from Database or through data warehouse of
Qlik Sense
Completed
5 Project Plan Structured through Asana (SaaS) with deadlines, tasks, subtask and
documentation.
Completed
6 Kick-off meeting Set meeting to confirm structure and procedure of the project. Postponed

40
Table 4. Blocks of Analysis Plan - BADIR
Unfortunately, due to internal prioritization within the company the Kick-off meeting to
commence to the next step of this part of the internship project has yet not occurred. This change of
prioritization postponed the continuous work of this phase as more effort was decided to be put on
BI and the recently acquired BI-tool Qlik Sense.
Even though this phase of the internship came to a halt the full structure following the
BADIR-framework has been set up so it will be more effortless to re-start of the project.
Figure 14. Phase 3 level of completion (BADIR)
Figure 14 visualizes how far of the process phase 3 of this internship got reached, where to
resume the project and what steps in the BADIR-framework that is yet left to complete. For Nudie
Jeans this setup can be followed when the time and prioritization are beneficial to continue to
pursue their vision of adopting advanced analytics and ML-techniques to their business problems.

41
5. CONCLUSION
Concluding on this internship project at Nudie Jeans, of working and assisting with knowledge
through their digital transformation to enable future competitiveness within the fast-paced fashion
industry. The project has given me deeper understanding of the complexity of the system
architecture, importance of data quality and accessibility as well as the importance of structuring
work over conceptual framework to define and reach the intended goals. As the project internship
was divided into three phases, all with different aspect within the scope of DT, the project provided a
diversity if knowledge and experience within each of the domains.
In specification to Phase 1: Lift & Shift to Azure, a broader understanding of the company’s
system architecture became more evident while testing and assisting in getting operational day-to-
day work tasks functional through the new cloud-based server setup (IaaS). The general
understanding of the systems became evidently valuable for the 2nd and 3rd phase of the internship.
Contributing with knowledge of prior studies and understanding of systems, databases, and SQL the
internship work finalized in with a schematic visualization of all Nudie Jeans main systems how the
information flow is organized. This visualization helps other personnel and future consultants to get a
better overview of system and how they respond to each other. Hence the final documentation will
not be available in this report due to confidentiality of the system, but a version with reduced detail
can be found in Appendix B.
Over the course of the internship most time and efforts were put towards Phase 2: Qlik Sense, by
supporting and leading the project to develop new KPI-dashboards and reports for the Supply Chain
Department. Within this part a continuous and more in depth understanding of the procedures of
the Supply Chain department was obtained to capture the needs and pains which could be aided by
functional KPI-dashboard and customs reports for operational tasks. Effort towards data quality, data
accessibility and correct data were key aspects while setting up the projects of developing the Qlik
Sense dashboards and reports. The chosen and presented BADIR-framework used in this phase,
resulted in a new approach with well-defined steps to be applied with Data Science related projects
for Nudie Jeans, which can help them in their goal towards more data driven decision making.
Tapping into the prior knowledge of other BI tools, understanding of data warehousing and data
visualization the specifications and supportive role of this phase was broadened. With additional
weekly checkup and meetings of how to use Qlik Sense was appointed as well as custom report
building though Qlik to other departments.
In consequence to more effort of this internship being shifted towards Qlik and Bi-related tasks
less time were available for Phase 3: Predictive Demand Planning. Hence with the satisfactorily
adoption of BADIR for the 2nd phase of the internship, a similar setup of project was designed for this
part. Identification and discussion with stakeholder’s clear business needs for a desired usage of an
ML demand planning model was formed as well as a hypothesis for testing. Though this part was not
completed as intended a contribution of structured approach to the formulated business need has
been set and a possible path of continuing the project.

42
Overall, the internship has provided a lot of real-life experience of struggles and possibilities
within the digital framework of both services of systems, reliable and functional dashboards as well
as the effort of time that lays behind a properly setup predictive data mining project. To the
company over cause of this internship contributions of structure, work efforts and topic specific
knowledge has been contributed. Nudie Jeans Co. provided the opportunity to learn more about
their business and strategy on how they tend to stay competitive within the future to come. Though
this internship project did not solve all their issues and intended result the project and report will fit
as a comparable, documentative and alternative study for Nudie Jeans and their efforts to become
more digitally enhanced. Through an optimal system architecture, BI and advanced analytics.

43
6. LIMITATIONS AND RECOMMENDATIONS FOR FUTURE WORKS
Since the start of the internship limitations has general been directed by the stipulation of the
internship and the phases within. As the topic of digital transformation is broad and the distinguished
phases set the tone of more specific topics that work tasks and studies focused on. Furthermore, the
internship project was limited to a specific time frame from the 1st of September 2020 to the 31st of
March 2021.
In addition to the pre-set limitation the internship has been carried out under the special
circumstances of a pandemic which has resulted in remote work efforts. In relation to the pandemic
and the special situation for the company re-prioritizations was made and limited the full completion
of result for all the originally set phases.
Clear recommendation for future work of Nudie Jeans is to continue the set structure of
developing a first model for predictive demand planning as well as continue efforts towards more
digitalized systems and integrations to unlock hidden knowledge and market shares.

44
7. REFERENCES
Allabolag.se. (2020, 12 13). allabolag.se "Nudie Jeans Marketing Aktiebolag". Retrieved from
allabolag.se: https://www.allabolag.se/5566289277/bokslut
Askari, S., Montazerin, N., & Fazel Zarandi, M. (2015). A clustering based forecasting algorithm for
multivariable fuzzy time series using linear combinations of independent variables. Applied
Soft Computing, 151-160.
Bulovi, V., & Covic , Z. (2020). The Impact of Digital Transformation on Sustainability in Fashion Retail.
International Symposium on Intelligent Systems and Informatics, 149-154.
Dutta, P., & Dutta, P. (2019). Comperative Study of Cloud Services Offered by Amazon, Microsoft &
Google. International Journal of Trend in Scientific Research and Development (IJTSRD), 981-
985.
Friedman, J. H. (2002). Stochastic gradient boosting. Computational statistics & data analysis,, 367-
378.
Iliashenko, O., Iliashenko, V., & Esser, M. (2019). BI systems implementation for supply chain sector
in retail companies. International Conference on Digital Technologies in Logistics and
Infrastructure, 304-310.
Jain, P., & Sharma, P. (2014). Behind every good decision: How anyone can use business analytics to
turn data into. Amacom.
Lang, S., & Brinkberg, E. (2020). Nudie Jeans Sustainability Report 2019. Gothenburg: Nudie Jeans Co.
.
Matt, C. H. (2015). Digital transformation strategies. Business & Information Systems Engineering,
339-343.
Mell, P., & Grance, T. (2011). The NIST Definition of Cloud Computing - Recommendations of the
National Institute of Standards and Technology. Gaithersburg, MD, USA: National Institute of
Standards and Technology (NIST).
Nenni, M. E., Giustiniano, L., & Pirolo, L. (2013). Demand Forecasting in the Fashion Industry: A
Review. International Journal of Engineering Business Management Special Issue on
Innovations in Fashion Industry, 5, 37.
nudiejeans.com. (2020, 12 13). Nudie Jeans Co Production Guide. Retrieved from nuiejeans.com:
https://www.nudiejeans.com/productionguide/
Qlik. (2020, 12 11). Goodbye SQL limits. Hello limitless insights. Retrieved from Qlik Web site:
https://www.qlik.com/us/products/associative-difference
Rashid, A., & Chaturvedi, A. (2019). Cloud Computing Characteristics and Services: A Brief Review.
International Journal of Computer Sciences and Engineering, 421-426.

45
Richardson, J., Sallam, R., Schlegel, K., Austin, K., & Sun, J. (2020, 12). Magic Quadrant for Analytics
and Business Intelligence Platforms. Retrieved from Gartner:
https://www.gartner.com/doc/reprints?id=1-
3TXXSLV&ct=170221&st=sb&ocid=mkto_eml_EM597235A1LA1
Sarangi, S. (2016). Business Intelligence Systems: A Necessity for Agile Supply Chains. Parikalpana:
KIIT Journal of Management,, 52-65.
scikti.learn. (2020, 12 20). sklearn.ensemble.GradientBoostingRegressor. Retrieved from scikti learn:
https://scikit-
learn.org/stable/modules/generated/sklearn.ensemble.GradientBoostingRegressor.html
Shariat, M., & Hightower, J. R. (2007). CONCEPTUALIZING BUSINESS NTELLIGENCE ARCHITECTURE.
Marketing Management Journal,, 40-46.
Singh, P. K., Gupta, Y., Jha, N., & Rajan, A. (2019). Fashion retail: Forecasting demand for new items.
Bangalore: arXiv preprint.
Stephen Watts, M. R. (2019, June 15). SaaS vs PaaS vs IaaS: What’s The Difference & How To Choose.
Retrieved from bmc.com: https://www.bmc.com/blogs/saas-vs-paas-vs-iaas-whats-the-
difference-and-how-to-choose/
Tabrizi, B., Lam, E., Girard, K., & Irvin, V. (2019). Digital Transformation Is Not About Technology.
Harvard Business Review, 13.
Zhang, Z., Zhao, Y., Canes, A., Steinberg, D., & Lyashevska, O. (2019). Predictive analytics with
gradient boosting in clinical medicine. Annals of translational medicine, 1-7.

46
8. APPENDIX A - ORGANISATIONAL CHART

47
9. APPENDIX B – MAIN SYSTEM FLOW CHART

Page | i


