
September, 2017
Cláudia Sofia Rodrigues Ferreira
[Nome completo do autor]
[Nome completo do autor]
[Nome completo do autor]
[Nome completo do autor]
[Nome completo do autor]
[Nome completo do autor]
[Nome completo do autor]
Bachelor in Micro and Nanotechnologies Engineering
[Habilitações Académicas]
[Habilitações Académicas]
[Habilitações Académicas]
[Habilitações Académicas]
[Habilitações Académicas]
[Habilitações Académicas]
[Habilitações Académicas]
Development of PNA-DNA Field-Effect Transistor-
based biosensors
[Título da Tese]
Dissertation submitted in partial fulfilment of the requirements for the degree of
Master of Science in
Micro and Nanotechnologies Engineering
Dissertação para obtenção do Grau de Mestre em
[Engenharia Informática]
Adviser: Dr. Pedro Estrela, Senior Lecturer, University of Bath
Co-adviser: Dr. Elvira Fortunato, Full Professor, Faculty of Science and
Technology, NOVA University of Lisbon

Development of PNA-DNA field-effect transistor-based biosensors
ii

Development of PNA-DNA field-effect transistor-based biosensors
iii
Development of PNA-DNA field-effect transistor-based biosensors
Copyright © Cláudia Sofia Rodrigues Ferreira, Faculdade de Ciências e Tecnologia, Universidade Nova
de Lisboa.
A Faculdade de Ciências e Tecnologia e a Universidade Nova de Lisboa têm o direito, perpétuo e sem
limites geográficos, de arquivar e publicar esta dissertação através de exemplares impressos reproduzi-
dos em papel ou de forma digital, ou por qualquer outro meio conhecido ou que venha a ser inventado,
e de a divulgar através de repositórios científicos e de admitir a sua cópia e distribuição com objectivos
educacionais ou de investigação, não comerciais, desde que seja dado crédito ao autor e editor

Development of PNA-DNA field-effect transistor-based biosensors
iv

Development of PNA-DNA field-effect transistor-based biosensors
v
"Happiness can be found, even in the darkest of times, if only one remembers to turn on the
light." –The Prisoner of Azkaban

Development of PNA-DNA field-effect transistor-based biosensors
vi

Development of PNA-DNA field-effect transistor-based biosensors
vii
Acknowledgments
I would firstly like to thank my supervisor Dr. Pedro Estrela, for allowing me to be a part of his
research group in the University of Bath and for the invaluable guidance and support over these months.
I would also like to thank my co-supervisor Dr. Elvira Fortunato for her knowledge and help over the
years as well as the help in finding this opportunity. To the biosensors group in the University of Bath,
I would like to thank for the open arm welcome I received as well as for all of the help in the lab and
support. Special thanks to Şerife Üstüner for teaching me everything I needed to know to work on my
own as well as for the patience and moral support when all seemed to be failing. To Dr. Pawan Jolly for
using his time helping in my measurements, for the nice chats and lovely meals. To Jahnavi Jha for the
help in the fabrication of electrodes and the motivational talks. To Erasmus plus for supporting me
financially. Ao Prof. Dr. Rodrigo Martins e à Prof. Dra. Elvira Fortunato pela criação e promoção do
curso de Engenharia Micro e Nanotecnologias.
Gostaria desde já agradecer a todas as pessoas que fizeram parte, direta ou indiretamente, do meu
percurso neste curso, quer eu as refira aqui ou não, nada disto seria possível sem o vosso apoio incon-
dicional.
Aos meus amigos da residência, obrigada pelos momentos de descontração na cozinha e sala de
estudo, pelas pré-festas, pela companhia quando tinha de fazer diretas, pelas idas a Lisboa e ao fórum,
agradeço por todo o apoio, ajuda e risadas ao longos destes anos. Um especial agradecimento ao (José)
Miguel e Sabrina por todas as noites de fritanço, por todas as conversas e loucuras e por saber que tinha
sempre um ombro amigo disponível.
À Joana, por sempre me apoiar e aturar mesmo quando estava exausta e continuar do meu lado
mesmo quando não vinha a casa durante meses, pelas idas a Lisboa, pelos pequenos-almoços na Pani-
tejo, pelas longas conversas sobre vida e tretas que mais ninguém percebe, pelas idas ao cinema, por
finalmente ir ao UK só para me ver, amizades assim não se encontram todos os dias e espero que conti-
nuemos assim por muitos anos. A todos os meus amigos pela paciência e apoio demonstrados ao longo
deste período da minha vida.
Por último e de todo o mais importante, gostaria de agradecer á minha família por todo o apoio e
encorajamento, especialmente ao meu pai e avó. Ao meu pai, pela incrível dedicação, amor, carinho e
paciência para me aturar (mesmo quando não paro quieta e calada), pelas doses de motivação diária em
todos os aspetos da minha vida, pelas conversas perlongadas ao telefone ou ao Skype, por me ensinar
que nada na vida se obtém sem esforço e muito trabalho. Basicamente, obrigada por seres o melhor pai
de sempre e por teres estado sempre ao meu lado ao longo da minha vida. À minha avó, por sempre ter
tratado de mim não apenas como uma neta, mas como uma filha, especialmente, mas não apenas quando
o meu pai não podia estar presente, pelo amor, preocupação, carinho e uma dose ainda maior de paci-
ência, pelas tabuadas e por sempre teres feito a comida que mais gosto.


Development of PNA-DNA field-effect transistor-based biosensors
ix
Abstract
The high demand for devices with higher sensitivity as well cost-efficiency has put tremendous
pressure on the biosensors field. The numerous advantages of Field effect transistors (FETs) such as
small size, fast response, label free response, and possibility of on-chip integration of biosensor arrays
with a future prospect of low-cost mass production, make their development highly desirable. An elec-
trochemical deoxyribonucleic acid (DNA) biosensor using a synthesized ferrocene-based DNA interca-
lator as a redox marker was investigated. A peptide nucleic acid (PNA) was employed as a capture probe
and co-immobilized on electrodes with 6-mecarpto-hexanol (MCH) to control the surface density of the
probe, and hybridized with complementary DNA. After hybridization, a ferrocene-based intercalator
was introduced to bind with the PNA-DNA duplex and change the surface potential. Biologically sen-
sitive field-effect transistor (BioFET) was used to monitor the DNA recognition. As confirmation, elec-
trochemical impedance spectroscopy (EIS) was also used to characterize the different modification
steps. Differential pulse voltammetry (DPV) was employed to evaluate the electrochemical signal of the
intercalator, related to its interaction with the PNA-DNA duplex. An optimization of the PNA probe
surface density was also tried, with the density being controlled by the MCH ratio in solution. Hybridi-
zation of PNA-DNA with a PNA/MCH ratio of 1:29 was obtained in BioFET and EIS, the employed
intercalator showed to have poor stability, both in application in BioFET as in DPV. Different ratios
were tried and the use of different electrodes was also exploit.
Keywords: field-effect-based sensors; peptide nucleic acid; ferrocene-based intercalator.

Development of PNA-DNA field-effect transistor-based biosensors
x

Development of PNA-DNA field-effect transistor-based biosensors
xi
Resumo
A elevada procura por dispositivos com maior sensibilidade, bem como eficiência de custos, co-
locou uma tremenda pressão sobre o campo dos biossensores. As inúmeras vantagens dos transístores
de efeito de campo (FETs), tais como o tamanho reduzido, a resposta rápida, a resposta livre de rótulos
e a possibilidade de integração de matrizes de biossensor no chip com uma perspetiva futura de produção
em massa de baixo custo, tornam o seu desenvolvimento altamente desejável. Um biossensor de ácido
desoxirribonucleico (ADN) eletroquímico utilizando um intercalador de ADN sintetizado baseado em
ferrocene, como marcador redox, foi investigado. Ácido peptídonucleico (APN) foi utilizado como
sonda de captura e co-imobilizado em elétrodos com 6-mecarpto-hexanol (MCH) de forma a controlar
a densidade superficial da sonda e hibridizado com ADN complementar. Após hibridação, um interca-
lador à base de ferrocene foi introduzido para se ligar ao duplex APN-ADN e alterar o potencial super-
ficial. O transístor de efeito de campo biologicamente sensível (BioFET) foi utilizado para monitorizar
o reconhecimento do ADN. Como confirmação, espectroscopia eletroquímica de impedância (EEI) tam-
bém foi utilizada para caracterizar as diferentes etapas de modificação. Voltametria de pulso diferencial
(VPD) foi usada de forma a avaliar o sinal eletroquímico do intercalador, relacionado com a interação
com o duplex APN-ADN. Uma otimização da densidade da superfície da sonda APN também foi ten-
tada, sendo a densidade controlada pela relação com o MCH em solução. A hibridação de APN-ADN
com uma relação APN / MCH de 1:29 foi obtida em BioFET e EEI e o intercalador utilizado mostrou
ter baixa estabilidade, tanto na aplicação em BioFET como em VPD. Diferentes índices foram testados
e o uso de diferentes elétrodos também foi explorado.

Development of PNA-DNA field-effect transistor-based biosensors
xii

Development of PNA-DNA field-effect transistor-based biosensors
xiii
Contents
ACKNOWLEDGMENTS ................................................................................................ VII
ABSTRACT ..................................................................................................................... IX
RESUMO ......................................................................................................................... XI
LIST OF FIGURES ......................................................................................................... XV
LIST OF TABLES ......................................................................................................... XVII
ABBREVIATIONS ....................................................................................................... XVIII
SYMBOLS...................................................................................................................... XXI
MOTIVATION AND OBJECTIVES ................................................................................. 1
1 INTRODUCTION ...................................................................................................... 3
BIOSENSORS: HISTORY, DEFINITION AND BASIC COMPONENTS ..................................... 3
CLASSIFICATION............................................................................................................. 3
Biorecognition system ................................................................................................ 4
1.2.1.1 Nucleic Acids Based Biosensors ....................................................................................................... 4
Transducer ................................................................................................................. 5
ELECTROCHEMICAL BIOSENSORS .................................................................................. 5
Impedimetric sensors ................................................................................................. 6
Biologically Sensitive Field Effect Transistor ........................................................... 6
Intercalators .............................................................................................................. 7
2 MATERIALS AND METHODS ................................................................................ 9
BIOFET MEASUREMENTS ............................................................................................... 9
Setup .......................................................................................................................... 9
Fabrication and Hybridization of PNA-based Biosensor .......................................... 9
Investigation of the Intercalator-hybridized Probe Binding .................................... 10
EIS MEASUREMENTS .................................................................................................... 10
Setup ........................................................................................................................ 10
PNA-based Biosensor .............................................................................................. 10
3 RESULTS AND DISCUSSION ................................................................................ 11
BIOFET CHARACTERIZATION OF A PNA-DNA INTERCALATOR .................................. 11
PNA-DNA Hybridization and blocking buffer ......................................................... 11
CHARACTERIZATION OF THE INTERCALATOR-HYBRIDIZED PROBE BINDING .............. 13
EIS Characterization of DNA Hybridization ........................................................... 16
DPV Characterization of Intercalator ..................................................................... 19
BIOFET OPTIMIZATION OF PNA:MCH RATIO ............................................................. 20
PNA-DNA Hybridization with Micrux Technologies Electrodes ............................. 20
PNA-DNA Hybridization with Evaporated Electrodes ............................................ 23

Development of PNA-DNA field-effect transistor-based biosensors
xiv
3.3.2.1 EIS Characterization of PNA-DNA Hybridization ......................................................................... 24
EIS Characterization of PNA-DNA Hybridization with gold working electrodes ... 25
3.3.3.1 EIS Characterization of MCH-DNA Hybridization ........................................................................ 25
4 CONCLUSION AND FUTURE PERSPECTIVES ................................................... 27
5 REFERENCES ......................................................................................................... 29
APPENDICES ................................................................................................................. 31
A. BIOFET ELECTRODES AND SET UP ................................................................................... 31
B. EIS: NYQUIST PLOTS AND CORRESPONDING FITTINGS ..................................................... 32

Development of PNA-DNA field-effect transistor-based biosensors
xv
List of Figures
Figure 1.1 - Schematic chemical model of PNA (red) hybridized with DNA (blue) in antiparallel orien-
tation with the hydrogen bonding between complementary nucleobases depicted by dotted lines.
Adapted from (Mateo-Mart and Pradier, 2010). ………………………………………………………...5
Figure 3.1 - Working principle of the BioFET sensor. A micrux electrode placed in a flow cell is con-
nected to the gate of a MOSFET. ………………………………………………………………………11
Figure 3.2 - BioFET ID/VGS characteristic of a PNA-DNA hybridization for an electrode before (Sta-
bility line) and after (Hybridization line) 20 nM DNA binding. ……………………………………......11
Figure 3.3 – BioFET PNA-DNA hybridization shifts obtained with a 1:29 ratio in different days (a)
without a blocking buffer and (b) with a blocking buffer. …………………………………………….12
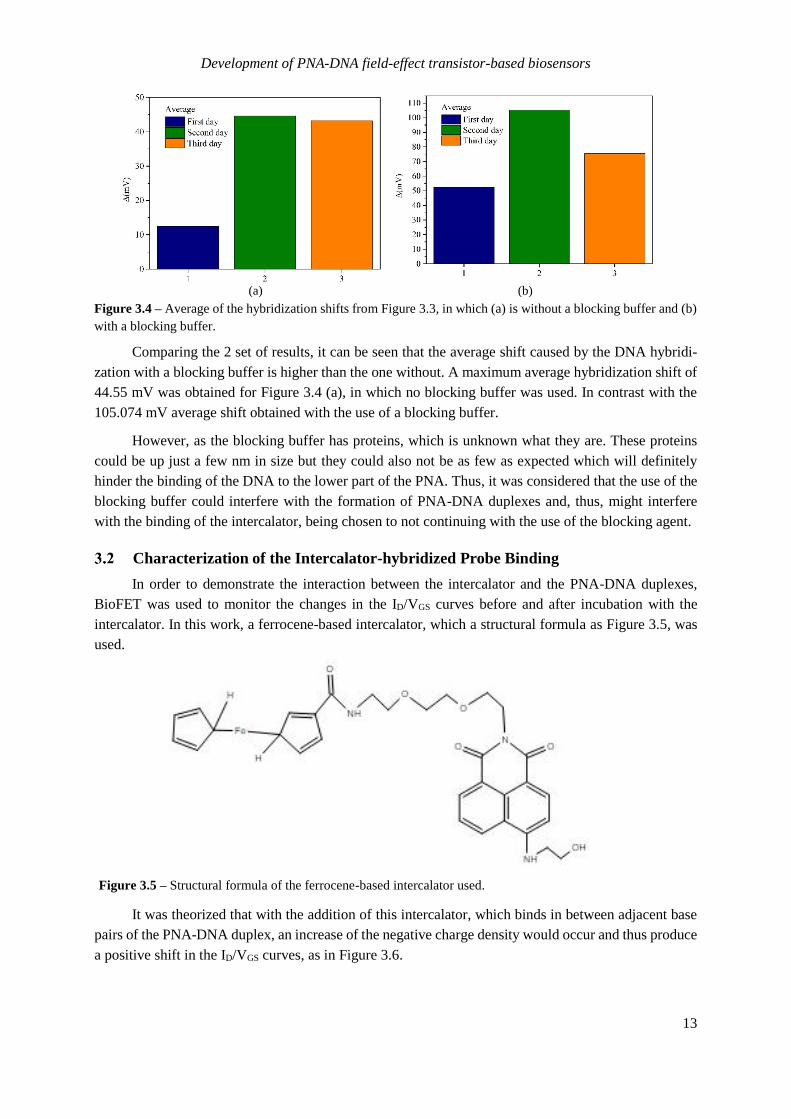
Figure 3.4 – Average of the hybridization shifts from Figure 3.3, in which (a) is without a blocking
buffer and (b) with a blocking buffer. ………………………………………………………………….13
Figure 3.5 – Structural formula of the ferrocene-based intercalator used. ……………………………...13
Figure 3.6 - BioFET ID/VGS characteristic for an electrode before (Stability line), after 20 nM DNA
binding (Hybridization line) and after 55.57 µM of intercalator binding (Intercalator line). ………...14
Figure 3.7 - BioFET PNA-DNA hybridization and intercalator shifts with a PNA:MCH ratio of 1:29
obtained in different days (1 and 2 in one day and 3 in another). ……………………………………….14
Figure 3.8 - Average of shifts from Figure 3.7, in which (a) represents the average of 1 and 2 and (b)
represents 3. ……………………………………………………………………………………………15
Figure 3.9 - BioFET PNA-DNA hybridization and intercalator shifts with a PNA:MCH ratio of 1:19
obtained in one day. ……………………………………………………………………………………15
Figure 3.10 - Average of the hybridization shifts obtained for the PNA:MCH ratios of 1:29 and 1:19.
…………………………………………………………………………………………………………16
Figure 3.11 – Nyquist plots of a 1:29 ratio PNA/MCH immobilized gold electrode, (a) before and after
incubation with 100 nM complementary ssDNA and (b) without hybridization. ………………………17
Figure 3.12 - Equivalent electrical circuit diagram used to fit the impedance spectra. ..………..………17
Figure 3.13 – Obtained fitting values for Rct for before and after incubation (a) three electrodes with
100 nM DNA hybridization and three without DNA (control) and (b) the average for each. …………..18
Figure 3.14 – Calculated variation of Rct where stability is the average difference between stabilities,
hybridization and control are the difference between the stable state and after incubation. ……………18
Figure 3.15 - DPV curve of 55.57 µM intercalator for the detection of PNA/DNA duplexes and the
current as the function of the complementary DNA concentration. ……………………………………19
Figure 3.16 - DPV voltammograms of 55.57 µM intercalator diluted in 10 mM PB with blank electrodes.
…………………………………………………………………………………………………………20
Figure 3.17 - BioFET PNA-DNA hybridization shifts obtained with a 1:29 ratio obtained in different
days (a) and (b) the average for each day. ……………………………………………………………...21
Figure 3.18 - BioFET PNA-DNA hybridization shifts obtained with a 1:19 ratio (a) in different days
and (b) the average for each day. ……………………………………………………………………….21
Figure 3.19 - BioFET PNA-DNA hybridization shifts obtained with a 1:09 ratio (a) in different days
and (b) the average for each day. ……………………………………………………………………….22
Figure 3.20 - Average of the all of the shifts obtained for the 1:29, 1:19 and 1:09 ratios. ………………22

Development of PNA-DNA field-effect transistor-based biosensors
xvi
Figure 3.21 - BioFET PNA-DNA hybridization shifts with the use of evaporated electrodes obtained
with a 1:29 ratio (a) in different days and (b) the average for each day. ………………………………...23
Figure 3.22 – Fabricated evaporated electrode with the manually created flow cell. …………………..23
Figure 3.23 – Nyquist plot of an example of the impendence spectra obtained for the characterization of
the PNA-DNA hybridization with a 1:29 ratio PNA/MCH evaporated gold electrode with 20 nM DNA.
…………………………………………………………………………………………………………24
Figure 3.24 - (a) Fitting values of Rct obtained for an evaporated electrode before and after incubation
with 20 nM DNA and (b) the variation of Rct, where stability is the difference between stabilities and
hybridization, the difference between the stable state and after incubation. ……………………………24
Figure 3.25 - (a) Fitting values of Rct for a gold working electrode and a 1:29 ratio obtained before after
incubation with 2 and 20 nM DNA and (b) the variation of Rct, where stability is the difference between
stabilities and hybridization the difference between the stable state and after incubation. ……………..25
Figure 3.26 - (a) Fitting values of Rct for a gold working electrode, with a 1:29 ratio in which no PNA
is in the immobilization solution, obtained before after incubation with 20 nM DNA and (b) the variation
of Rct, where stability is the difference between stabilities and after incubation the difference between
the stable state and after incubation. …………………………………………………………………...26
Figure A.1 - Micrux Technologies electrode. ………………………………………………………….31
Figure A.2 - Cell used for application of micrux electrodes. ……………………………………….…31
Figure A.5 - Cell used for the application of the evaporated electrodes. ………………………………32
Figure B.1 - Nyquist plots of 1:29 ratio PNA/MCH immobilized gold working electrode, (a),(b) and (c)
before and after incubation with 100 nM complementary ssDNA and (d), (e) and (f) without hybridiza-
tion. ……………………………………………………………………………………………………32
Figure B.2 - Nyquist plots of the impendence spectra obtained for the characterization of the PNA-DNA
hybridization with a 1:29 ratio PNA/MCH evaporated gold electrodes with 20 nM DNA. ……………34
Figure B.3 – Nyquist plots for gold working electrodes and a 1:29 ratio obtained before after incubation
with 2 and 20 nM DNA. ……………………………………………………………………………..…36
Figure B.4– Nyquist plots for gold working electrodes, with a 1:29 ratio in which no PNA is in the
immobilization solution, obtained before after incubation with 20 nM DNA. …………………………38

Development of PNA-DNA field-effect transistor-based biosensors
xvii
List of Tables
Table 1 - Fitting Values of the Equivalent Circuit Elements. ............................................................... 33
Table 2 - Fitting Values of the Equivalent Circuit Elements. ............................................................... 35
Table 3 - Fitting Values of the Equivalent Circuit Elements. ............................................................... 37
Table 4 - Fitting Values of the Equivalent Circuit Elements. ............................................................... 39

Development of PNA-DNA field-effect transistor-based biosensors
xviii
Abbreviations
a.c. Alternating current
BioFET Biologically-sensitive Field Effect Transistors
CPE Constant Phase Element
d.c. Direct current
DMSO Dimethyl Sulfoxide
DNA Deoxyribonucleic Acid
DPV Differential Pulse Voltammetry
EIS Eletrochemical Impendance Spectroscopy
FET Field effect transistor
ISFET Ion Sensitive Field Effect Transistor
MCH 6-mercapto 1-hexanol
PB Phosphate Buffer
PNA Peptide Nucleic Acids
SAM Self Assembled Monolayer
ss-DNA Single Stranded Deoxyribonucleic Acid

Development of PNA-DNA field-effect transistor-based biosensors
xix


Development of PNA-DNA field-effect transistor-based biosensors
xxi
Symbols
A Ampere
CPE Constant Phase Element
h Hour
Hz Hertz
M Molar
min Minute
ɷ Angular frequency
Pt Platinum
Rct Charge transfer resistance
Rs Solution Resistance
t Time
V Volts
VDS Voltage between Source and Drain
VGS Voltage between Source and Gate
Vth Threshold Voltage
W Warburg element
Z Impedance
Δ Variation
ϕ Electrostatic potential
χint Interface Surface Dipole
ψdl Electrochemical double-layer potential

Development of PNA-DNA field-effect transistor-based biosensors
1
Motivation and Objectives
Over the years, biosensors have become a major topic of scientific interest wide ever-growing
potential applications. This growth as given rise to a vast multidisciplinary area of research that com-
bines biology, analytical chemistry, physics and bio-electronics. Nowadays, biosensors have a wide
range of areas of application, such as environmental monitoring, food control, security, forensic science
and other areas. However, special reference as to be given to medical related applications, such as bio-
medical diagnosis, point-of-care monitoring of treatment and disease progression and drug discovery.
In recent years, many new ways of detection, quantification and monitoring of different biological and
chemical compounds have been studied and, in medical related applications, nucleic acids biosensors
are becoming invaluable tools for detecting target genes responsible for diseases, or pollution, in various
fields. Therefore, improvement of the detection of deoxyribonucleic acid (DNA) hybridisation is of
significant scientific and technological importance, as well as the improvement of the sensitive layer
and mechanisms of transduction for detection of bimolecular recognition.
The main goal of this thesis was to develop a biologically sensitive field effect transistor (BioFET)
biosensor with an extended gold working electrode which would be functionalized with a peptide nu-
cleic acid (PNA), employed as a probe and co-immobilized with 6-mecarpto-hexanol (MCH) to control
the surface density of the probe. Following immobilization, incubation with the complementary DNA
to allow hybridization was done and the addition of a ferrocene-based intercalator introduced to bind
with the hybridized duplex and change the surface potential. Electrochemical impedance spectroscopy
and DPV were used as confirmation steps for the PNA-DNA hybridization and investigation of the
binding of the intercalator, respectively.
In the second part of this thesis, the goal was to perform the optimization of the PNA/MCH ratio
to obtain the highest formation of PNA-DNA possible and, thus, highest change in potential. Addition-
ally, the in-house fabrication and study of evaporated gold electrodes was also done as opposed to in-
dustrial bought electrodes.

Development of PNA-DNA field-effect transistor-based biosensors
2

Development of PNA-DNA field-effect transistor-based biosensors
3
1 Introduction
Biosensors: History, definition and basic components
The biosensor field has grown enormously ever since the first report of the biosensor concept by
Leland C. Clark Jr., in 1962, with the development of the first glucose sensor and the enhancement of
electrochemical sensors with enzyme-based transducers (Clark and Lyons, 1962). They have become a
more attractive tool due to their ability to carry out rapid, direct, accurate analysis in point of care or on-
site, low cost, fast response and ease of miniaturization (Bala and Gorski, 2016). This leads to the de-
velopment of various applications of this type of devices, among them are biomedical, industrial, food
and beverage, agricultural, environmental, forensic, security and defence, and toxicity monitoring.
A biosensor can be defined as a compact analytical device, which converts chemical information,
from the concentration to total composition analysis, of a target substance of interest that needs detec-
tion, the analyte, into proportional electrical signals (Thévenot et al., 2001). They usually are composed
of two basic components connected in series: a bioreceptor and a physicochemical transducer. The bio-
receptor, also designated a recognition element/system, is a molecule that interacts with the target ana-
lyte, selectively recognising and binding to it, which produces a physico-chemical change. The main
purpose of the bioreceptor is to provide specificity and selectivity to minimize interferences from other
sample components, thus the choice of the biological element in the recognition system is of utmost
importance (Schöning and Poghossian, 2002). The nature of the target analyte must be taken into con-
sideration, as well as its concentration in the sample, the presence or absence of interfering substances,
and whether the measurement is discrete, real-time or continuous (Lowe, 2008). In general, the selection
of the recognition element should be made according to the analytical method under development and
intended application. Examples of recognition elements include enzymes, nucleic acids ((DNA, RNA,
PNA, etc.), whole cells, synthetic receptors or binding proteins, such as antibodies, which are immobi-
lized onto the surface of the transducer. The surface where the recognition element is immobilized is
also a sensitive parameter. Depending on the measuring mode in use, a wide range of different materials
can be chosen as surface. Among them are gold, silver, diamond, graphene and carbon nanotubes.
The transducer or detector is the element that detects and converts bio-recognition event, caused
by the interaction between the bioreceptor and the analyte, into a measurable signal. This conversion
process is known as signalisation. Either optical or electrical signals are the most commonly produced
and are usually proportional to the amount of analyte–bioreceptor interactions (Bhalla et al., 2016).
A biosensor can also have a signal processor which collects, amplifies, and displays the signal
produced by the transducer (Ronkainen, Halsallb and Heinemanb, 2010).
The performance of a biosensor is usually evaluated based on its sensitivity, limit of detection
(LOD), linear and dynamic ranges, selectivity and stability during operation and overtime. The response
should be accurate, precise, reproducible and linear over the concentration range of interest, without
dilution or concentration (Grieshaber et al., 2008).
Classification
Biosensors can be distinguished either by their type of biorecognition system, their transducer
mechanism or a combination of these two.

Development of PNA-DNA field-effect transistor-based biosensors
4
Biorecognition system
Biosensors can be divided into two main categories based on the nature of the biorecognition
process: biocatalytic and affinity biosensors. Biocatalytic sensors are based on a reaction catalysed by
macromolecules, which incorporates biological elements such as enzymes, whole cells (micro-organ-
isms, such as bacteria or fungi) or tissue that recognize the target analyte and produce electroactive
species or some other detectable outcome (Thévenot et al., 2001). Affinity sensors are based on specific
chemical binding. They use the selective and strong binding of macromolecules or organized molecular
assemblies that have either been isolated from their original biological environment or engineered such
as antibodies, membrane receptors, or oligonucleotides, with a target analyte to produce a measurable
electrical signal (Ronkainen, Halsallb and Heinemanb, 2010).
1.2.1.1 Nucleic Acids Based Biosensors
The use of nucleic acids recognition layers in biosensor design is gaining increasing attention,
mainly due to their wide field of possible uses and are now recognized as invaluable tools for detecting
target genes responsible for diseases, or pollution, in various fields (DeRisi, Iyer and Brown, 1997; Yang
et al., 2015). A nucleic acid sensor is typically based on the binding ability of an immobilized nucleic
acid layer (the probe) with a complementary DNA sequence (the target). Exposure of the sensor to a
sample containing the target results in the formation of the hybrid on the surface. Electrochemical, op-
tical or frequency monitoring of this duplex formation can thus result in a useful analytical signal
(Joseph Wang, 1998). Several types of nucleic acids have been used as probe, which are grafted to the
substrate surface via physical or electrochemical adsorption, self-assembly immobilization, biotin-avi-
din interactions, entrapment methods or covalent attachment (Gaiji et al., 2017). These probes include
single-stranded DNA (deoxyribonucleic acid) (Gao et al., 2011), locked nucleic acid (LNA) (Wang et
al., 2011) and peptide nucleic acid (PNA) (Keighley et al., 2008), to which a further in-deep look will
follow.
1.2.1.1.1 Peptide nucleic acid
Peptide nucleic acid (PNA) was first described by Nielsen et al. in 1991(Nielsen et al., 1991).
PNA is a DNA analogue, in which the entire negatively-charged sugar-phosphate backbone of DNA has
been replaced by an uncharged backbone consisting of repeated N-(2-aminoethyl) glycine units. The
four natural nucleobases (adenine, cytosine, guanine, and thymine) come off the backbone at equal
spacing to the DNA bases. A methyl carbonyl linker connects natural as well as unusual (in some cases)
bases to the central amine of the backbone (Hyrup and Nielsen, 1996). Despite all these variations from
natural nucleic acids, PNA still binds to its complementary oligonucleotides sequence (Ray and Nordén,
2000). PNA exhibits superior structural properties and hybridization with higher affinity and specificity
making it superior to natural nucleic acids for use as a probe in sequence-specific hybridization, which
open up many important biological and diagnostic applications not achievable otherwise. It has been
shown that the PNA binding to complementary oligonucleotides obeys the Watson-Crick base-pairing
Development of PNA-DNA field-effect transistor-based biosensors
5
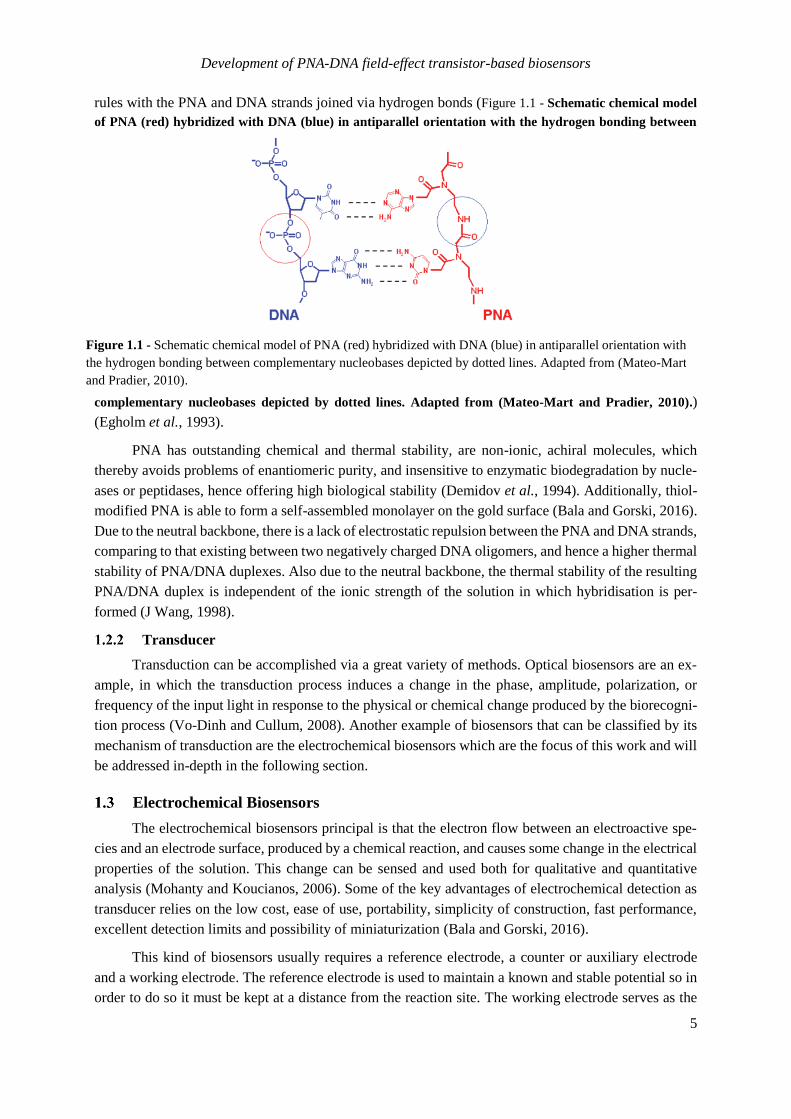
rules with the PNA and DNA strands joined via hydrogen bonds (Figure 1.1 - Schematic chemical model
of PNA (red) hybridized with DNA (blue) in antiparallel orientation with the hydrogen bonding between
complementary nucleobases depicted by dotted lines. Adapted from (Mateo-Mart and Pradier, 2010).)
(Egholm et al., 1993).
PNA has outstanding chemical and thermal stability, are non-ionic, achiral molecules, which
thereby avoids problems of enantiomeric purity, and insensitive to enzymatic biodegradation by nucle-
ases or peptidases, hence offering high biological stability (Demidov et al., 1994). Additionally, thiol-
modified PNA is able to form a self-assembled monolayer on the gold surface (Bala and Gorski, 2016).
Due to the neutral backbone, there is a lack of electrostatic repulsion between the PNA and DNA strands,
comparing to that existing between two negatively charged DNA oligomers, and hence a higher thermal
stability of PNA/DNA duplexes. Also due to the neutral backbone, the thermal stability of the resulting
PNA/DNA duplex is independent of the ionic strength of the solution in which hybridisation is per-
formed (J Wang, 1998).
Transducer
Transduction can be accomplished via a great variety of methods. Optical biosensors are an ex-
ample, in which the transduction process induces a change in the phase, amplitude, polarization, or
frequency of the input light in response to the physical or chemical change produced by the biorecogni-
tion process (Vo-Dinh and Cullum, 2008). Another example of biosensors that can be classified by its
mechanism of transduction are the electrochemical biosensors which are the focus of this work and will
be addressed in-depth in the following section.
Electrochemical Biosensors
The electrochemical biosensors principal is that the electron flow between an electroactive spe-
cies and an electrode surface, produced by a chemical reaction, and causes some change in the electrical
properties of the solution. This change can be sensed and used both for qualitative and quantitative
analysis (Mohanty and Koucianos, 2006). Some of the key advantages of electrochemical detection as
transducer relies on the low cost, ease of use, portability, simplicity of construction, fast performance,
excellent detection limits and possibility of miniaturization (Bala and Gorski, 2016).
This kind of biosensors usually requires a reference electrode, a counter or auxiliary electrode
and a working electrode. The reference electrode is used to maintain a known and stable potential so in
order to do so it must be kept at a distance from the reaction site. The working electrode serves as the
Figure 1.1 - Schematic chemical model of PNA (red) hybridized with DNA (blue) in antiparallel orientation with
the hydrogen bonding between complementary nucleobases depicted by dotted lines. Adapted from (Mateo-Mart
and Pradier, 2010).

Development of PNA-DNA field-effect transistor-based biosensors
6
transduction element in the biochemical reaction. The counter electrode establishes a connection to the
electrolytic solution so that a current can be applied to the working electrode. These electrodes should
be both conductive and chemically stable. Therefore, platinum, gold, carbon and silicon compounds are
commonly used, depending on the analyte (Grieshaber et al., 2008).
Electrochemical sensors can be classified taking into account the electrochemical detection tech-
niques used, in other words, considering the characteristics of the signal obtained by the transducer. If
the reaction generates a measurable current due to the reduction or oxidation of electroactive species
then the technique is amperometric, if it alters the conductive properties of the medium between the
electrodes then the technique is conductometric, if it generates a measurable potential or charge accu-
mulation it is a potenciometric technique. Another detection technique is impedimetric, which measures
impedance (both resistance and reactance) and field-effect which uses transistor technology to measure
current as a result of a potentiometric effect at a gate electrode (Grieshaber et al., 2008). A more detailed
description of the last detection technique will be given in the following sections.
Impedimetric sensors
Electrochemical Impedance Spectroscopy (EIS), ever since it was first described by Lorenz and
Schulze in 1975 (Lorenz and Schulze, 1975), has become the most common technique used to monitor
both resistance and reactance in impedimetric biosensors (Ronkainen, Halsallb and Heinemanb, 2010).
It measures the resistive or capacitive properties of materials after perturbation of the system by
a small amplitude varying sinusoidal potential (Ronkainen, Halsallb and Heinemanb, 2010). The per-
turbation generates a current which is measured. By varying the frequency of the applied potential over
a wide range of frequencies, the complex impedance of the system, which is the sum of the real and
imaginary impedance components, can be calculated as a function of the frequency (Grieshaber et al.,
2008). In simplistic terms the real part is often linked to resistive processes and the imaginary part to
capacitive processes. Therefore, the impedance Z is the quotient of the voltage – time function U(t) and
the resulting current – time function I(t), as shown in Equation 1.
Z(t) =U(t)
I(t) =
U0 sin(ωt)
I0 sin(ωt + ϕ)=
1
Y; ω = 2πf (1)
Where 𝑈0 and 𝐼0 are the maximum voltage and current signals, f is the frequency, t the time, φ
the phase shift between the voltage–time and current–time functions, and Y is the complex conductance
or admittance. The impedance is a complex value, since the current can differ not only in terms of the
amplitude but it can also show a phase shift compared to the voltage – time function. Thus, the value
can be described either by the modulus and the phase shift or by the real part and the imaginary part of
the impedance (Lisdat and Schäfer, 2008). It allows to obtain detailed information about the physico-
chemical changes that take place when an analyte binds to a bioreceptor immobilised on an electrode.
Information such as charge transfer processes from the solution to the electrode surface, conductivity
films, diffusion transport of species to and from the bulk solution and double layer capacitance formation
and modification (Hammond et al., 2016).
Biologically Sensitive Field Effect Transistor
Biologically Sensitive Field Effect Transistor (BioFET) is a field-effect transistor in which the
gate is functionalized with different biological recognition elements. Initially these devices were classi-
fied as potentiometric sensors, since the detection mechanism is based on a potential or charge variation
at the transducer when placed in contact with an electrolyte, these were separated into a new class of

Development of PNA-DNA field-effect transistor-based biosensors
7
electrochemical biosensors (Thévenot et al., 2001). BioFETs can be simply constructed from an Ion-
Sensitive Field Effect Transistor (ISFET) by modifying the gate or coupling it with different biological
recognition elements. The choice of this bio-recognition elements, which are chemically or electrostat-
ically bound to the transducer surface, is critical to the biosensor performance and should provide spe-
cific interaction with target molecules, minimize non-specific binding and, in some cases, facilitate a
charge transfer (Pachauri and Ingebrandt, 2016). Field Effect Transistor (FET) is a type of transistor
which consists of three terminals (electrodes): the source, the gate, and the drain. The device consists of
a channel through which electrons or holes flow from the source to the drain by application of an electric
field in the gate, which controls the conductivity (Hosseini, Tavallaei and Hosseini, 2015). In an n-
channel FETs the carriers are electrons while in a p-channel FETs the carriers are holes. By varying the
voltage applied to the gate, relatively to the source and drain electrode, which generates the electric
field, control of the current between the source and drain conductivity is achieved (Pachauri and
Ingebrandt, 2016).
In the case of a n-type transistor, the turn-on state is achieved when the electron-current (ID) enters
the drain and exits the source. When the potential applied across the gate and the source (VGS) is larger
than the threshold voltage (Vth) of the device (VGS>Vth), a conducting channel is formed between the
source and the drain. The Vth is the minimum voltage that is needed between the gate and source to
create the channel. Additionally, if a voltage is applied between the drain and source (VDS>0) a current
(ID) begins to flow through the channel. The presence of a sufficient positive or negative potential at the
gate would either attract or repel charge carriers in the conduction channel. This would either fill or
empty the depletion region of charge carriers and thus form or deform the effective electrical dimensions
of the conducting channel. So, by changing VGS the conductivity of the channel is modulated and thereby
ID is altered. In linear mode, when VDS< VGS, a FET operates much like a variable resistor to switch
between conductive and non-conductive states. However, in saturation mode, a FET operates as a con-
stant-current source and is often used as a voltage amplifier. In this mode the level of constant current
is determined by the VGS (Grieshaber et al., 2008).
Some of the basic mechanisms of potential generation for BioFETs include catalytic reaction
product (e.g., between an enzyme and its substrate), surface polarisation effects or change of dipole
moments (e.g. DNA hybridisation) and potential changes that are coming from living biological systems
as a result of more sophisticated (bio-)chemical processes (e.g., action potential of nerve cells) (Estrela,
2015)
BioFETs can be classified according to the biorecognition element that is used for detection. They
can be divided in: enzyme-modified FET (EnFET); immunologically modified FET (ImmunoFET);
DNA-modified FET (DNA-FET); cell-based FET (or cell-potential FET (CPFET)); and ‘beetle/chip’
FET (Schöning and Poghossian, 2006).
Intercalators
Various strategies have been suggested for the development of electrochemical sensors. In elec-
trochemical nucleic acids based sensors, label-free methods, which are directly based on the electroac-
tivity inherent to some nucleotides, and indirect label-methods (Wang and Kawde, 2001), which involve
the use of electroactive markers and labels such as enzymes, nanoparticles and redox indicators and
intercalators. The most widely employed are electroactive indicators containing organometallic or or-
ganic moieties, which connect directly and selectively to the nucleic acid sequences by electrostatic
interactions, groove binding or intercalating interaction (Gaiji et al., 2017). Intercalator can be define as

Development of PNA-DNA field-effect transistor-based biosensors
8
an organic small sized DNA binding molecule which present a characteristic structure with a planar
polycyclic ring (Gaiji et al., 2017). This allows them to fit between adjacent base pairs of the double
helix structure without destroying hydrogen bonds. Therefore, such intercalators should be able to dis-
criminate between double- and single-stranded DNA (Takenaka et al., 2000).

Development of PNA-DNA field-effect transistor-based biosensors
9
2 Materials and Methods
BioFET measurements
Two different gold electrodes were used. Thin-film double metal-based electrodes, purchased
from Micrux Technologies (Oviedo, Spain), and evaporated gold electrodes prepared in-house on glass
slides.
Setup
To carry out the Bio-FET measurements, an extended-gate FET sensor was fabricated. To do so,
the gold electrodes, fixed in a flow cell, were connected via a metal wire to the gate of an n-type
MOSFET structure, which transduces the binding events on the electrode into electrical signals. In the
case of the evaporated electrodes, an external reference electrode was used to apply the gate voltage.
The FET readings were taken using an Agilent B1500A HR CMU Semiconductor Device Analyser. The
threshold voltage of the transistor was 0.82 V. The length by width of the transistor was 10 ×2 µm. To
operate the transistor for measurements, a VDS of 50 mV was applied and VGS was swept from 0 to 3 V.
Further detail on the setup and electrodes used can be found in Appendice A.
Fabrication and Hybridization of PNA-based Biosensor
The electrodes were sequentially cleaned by sonication in acetone, 2-Propanol and ultra-pure wa-
ter for 3 min. Finally, thoroughly rinsed with ultra-pure water to remove any remaining particle residues
and dried in a nitrogen stream. Evaporated electrodes were firstly subjected to UV-light for 10 min.
Thereafter, the cleaned electrodes surfaces were exposed to different ratios of thiolated PNA to MCH
immobilization solution. The short-chain thiol spacer, MCH, is commonly adopted to suppressed non-
specific adsorption and to assure a “stand up” position of the PNA sequence, convenient for hybridiza-
tion (Paleček and Bartošík, 2012). The immobilization solution was prepared using a protocol adapted
from (Jolly et al., 2015). The thiol terminated PNA sequence HS-(CH2)6-AEEA-TTT TTT TTA ATA
CTA ACA CTG C (Cambridge Research Biochemical, UK) samples were prepared in a solution con-
taining DMSO (Sigma Aldrich, UK) and ultra-pure water [20% and 80% (v/v)]. AEEA (2-aminoethoxy-
2-ethoxy acetic acid is the short linker molecule used to join PNA strands. Concentrated solution of
MCH was prepared in pure ethanol and further diluted to the desired concentrations in the DMSO-water
mixture. Before immobilization, the PNA-MCH mixture was heated to 50 °C for 10 min, so that the
PNA would be better dissolved in the solution and as described in the literature (Jolly et al., 2015). The
electrodes were then left overnight in a humidity chamber at 4 °C for preparation of the compact SAM
layer. After immobilization, electrodes were rinsed with ultra-pure water to remove any unattached thi-
ols. In order to ensure complete thiol coverage of the gold surface, the electrodes were backfilled for 1
h with 1 mM MCH prepared in 10 mM PB. Rinsing with ultra-pure water was then done, careful drying
with a stream of nitrogen and placement in 10 mM PB for 1 h to stabilize the SAM before binding
studies. Additionally, the micrux electrodes were also immersed in a blocking buffer (Thermo Scientific,
USA) for 30 min. Before incubation of the PNA modified electrodes for 30 min, the 20 nM of the
complementary ss-DNA target solution prepared in 10 mM PB was heated to 90 ºC for 5 min. The ss-
DNA sequence used is as follow 5’-AAA TTA TGA TTG TGA CGT AAT CCC AAT ACA ACG TCA
ATG ACC TAC CGT T-3’ (Sigma-Aldrich, UK). The electrodes were then carefully washed to remove
non-specifically bound DNA and kept in PB for further use.

Development of PNA-DNA field-effect transistor-based biosensors
10
Investigation of the Intercalator-hybridized Probe Binding
To monitor the hybridization event, a ferrocene-based intercalator (University of Cardiff, UK)
was employed and investigated its binding behaviour with the PNA-DNA duplex. To do so, the above
hybridized electrodes were incubated with 55.57 µM intercalator for 30 min at room temperature. The
resulting electrodes were carefully rinsed and measured in BioFET.
EIS measurements
Setup
Electrochemical measurements were performed using a CompactStat potentiostat (Ivium Tech-
nologies, The Netherlands) with a three-electrode cell setup consisting of a Ag/AgCl (saturated KCl)
reference electrode (BASi, USA) connected via a salt bridge filled with 10 mM PB, a Pt counter elec-
trode (ALS, Japan) and gold working electrodes (CH Instruments, USA). All measurements were per-
formed at room temperature. Electrochemical impedance spectroscopy (EIS) was carried out in 10 mM
PB containing 5 mM K4[Fe(CN)6] (Potassium hexacyanoferrate (III)) and 5 mM K3[Fe(CN)6] (Potas-
sium hexacynoferrate(II) trihydrate). The impedance spectrum was measured over the frequency range
100 kHz to 100 MHz, with a 10 mV a.c. voltage superimposed on a d.c. bias of 0.195 V vs. Ag/AgCl,
corresponding to the formal potential of the redox couple. The obtained impedance data was fitted in an
equivalent circuit model using the IviumSoft. Ferrocene peaks were monitored using differential pulse
voltammetry (DPV) in 10 mM PB as supporting electrolyte. DPV scans were monitored between - 0.4
V and 0.7 V or 0.5 vs. Ag/AgCl with a scan rate of 0.05 Vs-1.
PNA-based Biosensor
Gold working electrodes with a diameter of 2.0 mm were cleaned using a protocol adapted from
elsewhere (Jolly et al., 2015; Gaiji et al., 2017). The electrodes were first mechanically polished for 5
minutes with 50 nm alumina oxide particles (Sigma Aldrich, UK) on a polishing pad (Buehler) followed
by rinsing with excess water and sonication in ultra-pure water for 10 minutes to remove any remaining
residues. Chemical cleaning was applied where the electrodes were immersed in a freshly prepared pi-
ranha solution for 10 minutes and then rinsed with ultra-pure water. Thereafter, electrodes were electro-
chemically cleaned in a three-electrode cell configuration by immersing them in a 0.5 M H2SO4 solution
(Sigma Aldrich, UK) and the potential was scanned between the oxidation and reduction potentials of
gold, −0.05 V and +1.5 V vs. Ag/AgCl (concentrated KCl), with a scan rate of 0.2 Vs-1 for 50 cycles
until no further changes in the voltammogram were noticed. Finally, the cleaned electrodes were thor-
oughly rinsed with ultra-pure water, dried and incubated with an immobilization solution for 16 h in a
humidity chamber. The protocol used for the preparation of the immobilization solution was the same
as described in section 2.1.3 as well as the following steps. The ratio between PNA and MCH was 1:29.
Electrodes were also prepared only with MCH. The DNA hybridization study was investigated using
EIS measurements following the same protocol as described in section 2.1.2. The investigation of the
Intercalator-hybridized probe binding was applied as before in section 2.1.3 and analysed using DPV.

Development of PNA-DNA field-effect transistor-based biosensors
11
3 Results and Discussion
BioFET characterization of a PNA-DNA Intercalator
PNA-DNA Hybridization and blocking buffer
The performance of a biosensor is directly related to the success of the different fabrication steps.
One of the most relevant is the immobilization of the PNA probe on the gold electrodes and the hybrid-
ization. Thus, an initial study of the immobilization and following hybridization was done to ensure that
the chosen ratio is able to provide the expected results. For this initial study, Micrux Technologies elec-
trodes (referred to as micrux electrodes) were used and a PNA:MCH ratio of 1:29 was established. A
blocking buffer was also applied to reduce non-specific biding. In the case of the BioFET used, as in
Figure 3.1, a n-type transistor, when the gate-to-source voltage (VGS) is altered, the conductivity of the
channel is modulated and thereby ID is altered.
After DNA incubation and, thus, hybridization of the immobilized neutrally charged PNA probe
with the negative charge target DNA occurs there is an increase in negative charge which causes a
change in the interface surface dipole χint and the electrochemical double-layer potential ψdl. This causes
a shift in the current–voltage (I–V) characteristic of the FET, more specifically a positive shift in the
VGS of the BioFET, as in the example in Figure 3.2.
Figure 3.1 - Working principle of the BioFET sensor. A micrux electrode placed in a flow cell is connected to the
gate of a MOSFET.
Figure 3.2 - BioFET ID/VGS characteristic of a PNA-DNA hybridization for an electrode before (Stability line)
and after (Hybridization line) 20 nM DNA binding.

Development of PNA-DNA field-effect transistor-based biosensors
12
Therefore, based on what was previously described, it is possible to detect the hybridization event
only by recording the shift in the ID/VGS curves. In order to obtain a better comparison between all of
the data, a current of 0.25 µA was chosen to extract the VGS values of all of the measurements.
In this initial study three separated days of measurements were recorded and on each day, results
were obtained with and without the use of a blocking buffer. On each day new electrodes were used.
The recorded shifts are shown in Figure 3.3.
Before the addition of DNA for incubation, the electrode is immersed in 10 mM PB to stabilize
the created SAM. During the stability period, the shifts between the stability curves are also measured
so that a stable state is ensured and the last measurement performed is the one used for the detection of
the hybridization. Typically, the SAM was considered stable when there was less than 10 mV of shift
in between stability curves. Thus, for the purpose of the analyses of the obtained shifts after hybridiza-
tion, 20 mV was established as the minimum shift to be considered as hybridization.
Taking that in consideration, a maximum value of 140.46 mV was obtained for hybridization
without blocking buffer (Figure 3.3 (a)) and 208.63 mV for hybridization with blocking buffer (Figure
3.3 (b)).
It is of note, that in the electrodes where a blocking buffer was used, only positive shifts were
recorded. However, in some results, as the shifts are quite low, no hybridization or almost none occurred.
This might indicate some problems with the thiolation process of the used PNA or even with the DNA,
as it might not have been handled properly, in a clean environment or even affected by desoxirribonu-
clease (DNAse), for example. The average shifts were also calculated and the obtained results can be
seen in Figure 3.4.
Figure 3.3 – BioFET PNA-DNA hybridization shifts obtained with a 1:29 ratio in different days (a) without a
blocking buffer and (b) with a blocking buffer.
(a) (b)
Development of PNA-DNA field-effect transistor-based biosensors
13
Comparing the 2 set of results, it can be seen that the average shift caused by the DNA hybridi-
zation with a blocking buffer is higher than the one without. A maximum average hybridization shift of
44.55 mV was obtained for Figure 3.4 (a), in which no blocking buffer was used. In contrast with the
105.074 mV average shift obtained with the use of a blocking buffer.
However, as the blocking buffer has proteins, which is unknown what they are. These proteins
could be up just a few nm in size but they could also not be as few as expected which will definitely
hinder the binding of the DNA to the lower part of the PNA. Thus, it was considered that the use of the
blocking buffer could interfere with the formation of PNA-DNA duplexes and, thus, might interfere
with the binding of the intercalator, being chosen to not continuing with the use of the blocking agent.
Characterization of the Intercalator-hybridized Probe Binding
In order to demonstrate the interaction between the intercalator and the PNA-DNA duplexes,
BioFET was used to monitor the changes in the ID/VGS curves before and after incubation with the
intercalator. In this work, a ferrocene-based intercalator, which a structural formula as Figure 3.5, was
used.
It was theorized that with the addition of this intercalator, which binds in between adjacent base
pairs of the PNA-DNA duplex, an increase of the negative charge density would occur and thus produce
a positive shift in the ID/VGS curves, as in Figure 3.6.
Figure 3.4 – Average of the hybridization shifts from Figure 3.3, in which (a) is without a blocking buffer and (b)
with a blocking buffer.
(a) (b)
Figure 3.5 – Structural formula of the ferrocene-based intercalator used.

Development of PNA-DNA field-effect transistor-based biosensors
14
Following the hybridization DNA study done before, a PNA:MCH ratio of 1:29 was also used.
In Figure 3.7 the shifts measured in two separated days are shown.
A positive shift of 137.78 mV was achieved in 2 of Figure 3.7. However, all of the other shifts
are smaller than the one measured after hybridization. In the case of the hybridization shift 1, a hybrid-
ization shift of less than 20 mV was obtained but the intercalator was still tested. Yet, the low hybridi-
zation shift might indicate that no hybridization occurred or only a very small percentage of it, so it was
expected that the intercalator wouldn’t cause a positive shift since without PNA-DNA duplexes the
intercalator wouldn’t have a place to bind. Nevertheless, in the case of 3 a large hybridization shift can
be observed and the intercalator shift was smaller.
In Figure 3.8, the average of the shift is calculated for both days.
Figure 3.6 - BioFET ID/VGS characteristic for an electrode before (Stability line), after 20 nM DNA binding (Hy-
bridization line) and after 55.57 µM of intercalator binding (Intercalator line).
Figure 3.7 - BioFET PNA-DNA hybridization and intercalator shifts with a PNA:MCH ratio of 1:29 obtained in
different days (1 and 2 in one day and 3 in another).

Development of PNA-DNA field-effect transistor-based biosensors
15
It can be noticed that even though the hybridization shift in (b) is larger than the one in (a), the
shift caused due to the intercalator is larger in (a). It was argued that the use of a high PNA:MCH ratio
was one of the possible reasons for this occurrence, as such a high ratio would mean that the PNA probe
surface density would be low and it would decrease the hybridization yield and consequently the binding
of the intercalator. For the purpose of exploring this possibility a 1:19 ratio was tried out. The results of
the measurements performed are depicted in Figure 3.9.
As it can be observed in shift 1 of Figure 3.9, a hybridization shift of less than 20 mV was obtained
and as before a negative intercalator shift was measured. In the case of the shift 2 from the same figure,
even though there was a 77.4 mV hybridization shift, no positive shift was gotten after the intercalator.
In Figure 3.10, it is displayed an average of the shifts obtained for both ratios, 1:29 and 1:19.
Figure 3.8 - Average of shifts from Figure 3.7, in which (a) represents the average of 1 and 2 and (b) represents
3.
Figure 3.9 - BioFET PNA-DNA hybridization and intercalator shifts with a PNA:MCH ratio of 1:19 obtained in
one day.

Development of PNA-DNA field-effect transistor-based biosensors
16
In average, in spite of what was theorized, both ratios did not produce a positive shift of the
intercalator, even though both had a high hybridization shift. It can be deduced that either the hypothesis
announced before might not be correct or the intercalator is not providing the proper results, as only one
positive result was achieved and it was not reproducible.
To prove if either of this is true, EIS was used to measure the changes in impedance of the system
as a result of hybridization and DPV to monitor the significance of the intercalator to generate an elec-
trochemical response related to the PNA-DNA hybridization.
EIS Characterization of DNA Hybridization
EIS in Faradaic mode, in which redox probes are used, was applied in this study to analyse the
changes on the charge transfer resistance of the system at the electrode/electrolyte interface as a result
of the binding event. Such technique was chosen since it can provide valuable qualitative and quantita-
tive information about the electrical double layer at the sensor interface and also understanding of the
electrochemical behaviour of the system, even if the changes in impedance depend on many factors.
One of the biggest advantages of EIS is the possibility to differentiate the different phenomena happen-
ing at the electrochemical double layer, for instance the charge transfer, the diffusion transport or the
double layer formation.
For the electrochemical characterization, a ratio of 1:29 was applied, since it was the ratio opti-
mized for this technique in experiments previously performed by the group and the one that was tested
during the initial study. The electrodes were initially stabilized in 10 mM PB before conducting binding
experiments. For binding, a 100 nM DNA concentration was applied so that the modified surface of the
old electrodes is saturated and the maximum PNA-DNA duplexes are formed. Electrodes with no DNA
incubation were also tested, so that control results would be obtained.
Figure 3.10 - Average of the hybridization shifts obtained for the PNA:MCH ratios of 1:29 and 1:19.

Development of PNA-DNA field-effect transistor-based biosensors
17
Figure 3.311 shows a nyquist plot of a typical EIS behaviour of the PNA / MCH immobilized
gold electrode in the presence of ferri/ferrocyanide.
In an impedance measurement, the typical Nyquist plot obtained (Figure 3.11) usually include
a semicircle region lying on the axis followed by a straight line. The semicircle portion (at higher fre-
quencies) corresponds to the electron-transfer-limited process, and the straight line (at low-frequency
range) represents the diffusion-limited electron transfer process (Estrela and Migliorato, 2007).
The charge transfer resistance (Rct) was determined by fitting data to a modified Randles equiva-
lent circuit (Figure 3.12) has been replaced by a constant phase element (CPE) (Keighley et al., 2008).
CPE is used instead of a pure capacity since it takes into account the topological imperfections of the
biolayer on the surface of the electrode and a better fitting is obtained. CP is given by:
Z= A(jω)-n (2)
,where A and n are experimental parameters (0 ≤ n ≤ 1). Depending on n, three special cases can
be considered: if n = 0, Z represents an ideal resistance and A = R; if n = 1, then Z corresponds to an
ideal capacitor where A = 1/C, and if n = 0.5, the circuit element is termed the Warburg impedance,
where A = W (Maalouf et al., 2007).
The equivalent circuit consists of the following elements: the resistance of the solution Rs and the
CPE in parallel with Rct and the Warburg element (W), which models the diffusion of redox couple.
Figure 3.12 - Equivalent electrical circuit diagram used to fit the impedance spectra.
Figure 3.11 – Nyquist plots of a 1:29 ratio PNA/MCH immobilized gold electrode, (a) before and after incubation
with 100 nM complementary ssDNA and (b) without hybridization.
(a)
(b)

Development of PNA-DNA field-effect transistor-based biosensors
18
For the purpose of the analysis of the changes caused by hybridization, only the fitted values ob-
tained for Rct will be presented (Figure 3.13). However, fittings of the other elements were also obtained
and are presented in the Appendice B.
From Figure 3.13 (a), the relatively neutral PNA-MCH monolayer, represented by the stability
column, shows a relatively small Rct for all of the tested electrodes. In the Figure 3.13 (b), the average
Rct before incubation for the three electrodes was 3.789 kΩ and for the control 3.151 kΩ. These values
can be attributed to the neutral PNA molecules demonstrating a physical barrier to the negatively
charged markers. After hybridization with the complementary DNA sequence, an increase of Rct can
be observed in Figure 3.13 (a), where there is a notorious difference between the Rct obtained for hy-
bridization and for control. This augmentation could be associated to an increased electrostatic barrier
to the negatively charged redox couple [Fe(CN)6]3-/4- due to the negatively charged attached DNA
(Mateo-Mart and Pradier, 2010).
To allow a better understanding of the changes during the stability period and after incubation,
the average difference between stabilities and the difference between the last stability and hybridization
was calculated (Figure 3.14).
As it was expected, the variation in between stabilities was quite low and so was the variation for
the control. In average, the enhancement of Rct obtained for the control was 0.043 kΩ. After incubation
Figure 3.14 – Calculated variation of Rct where stability is the average difference between stabilities, hybridiza-
tion and control are the difference between the stable state and after incubation.
Figure 3.13 – Obtained fitting values for Rct for before and after incubation (a) three electrodes with 100 nM
DNA hybridization and three without DNA (control) and (b) the average for each.
(a) (b)

Development of PNA-DNA field-effect transistor-based biosensors
19
with 20 nM DNA there a higher difference was achieved and in average the enhancement was 12.07
kΩ.
DPV Characterization of Intercalator
Following the demonstration that hybridization occurs, the hybridized electrodes were incubated
with the ferrocene-based intercalator and subjected to a DPV measurement. In this technique, the cell
current is measured as a function of time and as a function of potential. The potential is varied using
pulses of increasing amplitude and the current is sampled before and after each application of the pulse.
The difference between current measurements at these points for each pulse is determined. For potentials
much higher than the redox potential, there is no faradaic reaction in response to the pulse, so the dif-
ference current is zero. At potential around the redox potential, the difference current reaches a maxi-
mum, and decreases to zero as the current becomes diffusion controlled.
Therefore, the resulting voltammogram displays the sampled current on the vertical axis and the
potential to which the pulse is stepped on the horizontal axis. In Figure 3.15, it is shown the voltammo-
grams obtained for the electrodes 2 and 5, from the previous hybridization.
Comparing the DPV voltammograms of the intercalator in the presence and the absence of com-
plementary DNA, it confirms that the intercalator is not working as it was expected, since the peak
current is not attributed to the hybridization phenomenon. This also proves a that there is not a significant
interaction between the PNA/DNA duplex and the DNA intercalator. In order to confirm whether the
intercalator is the problem, three bare electrodes, i.e. in which there is no immobilization solution and
no DNA incubation, were used to perform DPV in the intercalator diluted in 10 mM PB (Figure 3.16).
Figure 3.15 - DPV curve of 55.57 µM intercalator for the detection of PNA/DNA duplexes and the current as the
function of the complementary DNA concentration.

Development of PNA-DNA field-effect transistor-based biosensors
20
A well-defined peak was expected to appear which would correspond to the oxidation of the ferro-
cene moieties. In the he voltammogram presented in red the well-defined peak was obtained and appears
at about 0.2 V vs. Ag/AgCl, while in the others that doesn’t happen as clearly. In the case of the volt-
ammogram presented in green, it is quite noticeable that there are two peaks, the first is the same as the
other curves and the second is also presented in the blue curve and there’s a very small contribution in
the red curve as well. Therefore, there are two peaks, one could be for the intercalator by itself and the
other might be due to aggregates of the intercalator. These aggregates could have been formed due to
the insolubility of the intercalator and could have a different oxidation potential. Consequently, the in-
tercalator is not stable and thus will not provide results that are reliable and reproducible.
BioFET Optimization of PNA:MCH ratio
PNA-DNA Hybridization with Micrux Technologies Electrodes
The PNA:MCH ratio of 1:29, widely used throughout the experiments is the optimized ratio for
application EIS but it still has to be optimized for use in BioFET. Ideally the optimized ratio would be
the one with optimal density, corresponding to the biggest shift in the ID/VGS curves upon hybridization
with target DNA. As a starting point for the optimization studies, it was considered that a higher density
of PNA probe on the surface would increase the shift caused by hybridization since there would be more
PNA to hybridize with the DNA and therefore more PNA-DNA duplexes would be created. In order to
increase the density of the probe, the amount of MCH would have to decrease which would correspond
to a decrease in the ratio. However, since the 1:29 ratio was previously optimized for EIS, it will continue
to be used as a comparison term. As such, all shifts recorded for the 1:29 ratio, including all those
obtained in the initial study without the use of a blocking agent and during the application of the inter-
calator, as well as the average obtained on each day of measurements, will be shown in Figure 3.17.
Figure 3.16 - DPV voltammograms of 55.57 µM intercalator diluted in 10 mM PB with blank electrodes.

Development of PNA-DNA field-effect transistor-based biosensors
21
The analysis for the first recorded shifts (first, second and third day in the Figure 3.17 (a)) has
been done previously in the initial study (section 3.11). The fourth, fifth and sixth were also analysed
before during the application of the intercalator in section 0. In the 7th day, no hybridization was ob-
tained and this may have been due to the temperature, since all measurements are done at the temperature
of the room, which is not controlled. It was then stipulated that the next measures to be carried out would
be at a set ambient temperature of 23 ° C. Looking at the average obtained for each day, it was calculated
a maximum of 117.06 mV. As the goal is to decrease the ratio, a ratio of 1:19 was tested, which had
been previously used during the application of the intercalator and was repeated again. The obtained
shifts can be seen in Figure 3.18, as well as the average for both days. A ratio of 1:09 was also tried for
the first time and the resulting shifts and average are shown in Figure 3.19.
(a) (b)
Figure 3.17 - BioFET PNA-DNA hybridization shifts obtained with a 1:29 ratio obtained in different days (a) and
(b) the average for each day.
Figure 3.18 - BioFET PNA-DNA hybridization shifts obtained with a 1:19 ratio (a) in different days and (b) the
average for each day.
(a) (b)

Development of PNA-DNA field-effect transistor-based biosensors
22
Both ratios, above shown, were tried out in 2 days. In the case of 1:19 ratio, the first day corre-
sponds to the hybridization shifts measured before the use of the intercalator (Section 3.2) and was
previously commented. In the second day, it was measured the maximum value obtained for this ratio
of 136.3 mV, yet it was also obtained a shift near 0 which might indicate that such high value might be
due to unspecific binding, which means that more measurements should be done in order to confirm
whether that maximum value can be replicated or it was indeed unspecific binding. The calculated av-
erage for each day of measurements was positive for both days and the maximum calculated was 57.16
mV. For 1:09 ratio, the first day it was tried out it was unsuccessful, not having been obtained a positive
shift. In the second, positive results were obtained but only one was higher than 20 mV.
Until now, whenever BioFET measurements were done Micrux Technologies electrodes were
used. However, due to the finish of the batch of new electrodes that have been used up and in order to
reduce costs, the electrodes previously used were subjected to chemical cleaning. For this, they were
immersed in a piranha solution (3 parts of concentrated H2SO4 with 1 part of H2O2) for 5 min, followed
by UV-light for 10 min and the same cleaning done for new electrodes. The resulting cleaned electrodes
were subjected to an immobilization solution with a ration of 1:29, as it is the one where the must results
were obtained become easier to compare the recorded shifts. However, it was concluded that in elec-
trodes cleaned with piranha solution it was not possible to obtain a stable SAM and so no reasonable
hybridization shifts. As such, evaporated electrodes were suggested as an alternative. As a conclusion
to the use of the Micrux Technologies electrodes, the following figure (Figure 3.20) shows the average
obtained for the ratios 1:29, 1:19 and 1:09.
Figure 3.20 - Average of the all of the shifts obtained for the 1:29, 1:19 and 1:09 ratios.
Figure 3.19 - BioFET PNA-DNA hybridization shifts obtained with a 1:09 ratio (a) in different days and (b) the
average for each day.
(a) (b)

Development of PNA-DNA field-effect transistor-based biosensors
23
The ratio in which was calculated the maximum average hybridization shift was 1:19, in which a
shift of 51.03 mV was achieved. The average shift obtained for the 1:29 ratio was 26.02 mV and 1.51
mV for 1:09. Comparing the shifts, it can be deduced that the ratio 1:19 was the one to achieve a higher
shift but in order to confirm its reproducibility more results would be needed. Also, the use of lower
ratios such as 1:05, previously applied in PNA-DNA hybridizations in EIS, 1:03 and 1:04 should be
tried out.
PNA-DNA Hybridization with Evaporated Electrodes
As said before, the use of the evaporated electrodes came from the need of finding another option
to Micrux Technologies electrodes. These evaporated electrodes are gold array on a glass slide and each
glass slide can have at least 8 gold electrodes. To obtain a mean of comparison between all of the ratios
previously obtained it was planned to begin the optimization study with a 1:29 ratio (Figure 3.21).
Firstly, it is possible to observe that in any of the days it was possible to obtain shifts higher
than 10 mV (Figure 3.21 (a)), most of which were negative shifts as is evident in the calculated average
for each day, in Figure 3.21 (b). It is noteworthy that for each day different electrodes were used, since
as they were electrodes fabricated by evaporation they would not resist chemical cleaning processes,
such as the piranha solution that has been used. Furthermore, the application of UV-light was done after
the first day of measurements as it was thought that the surface was hydrophobic and also would provide
a better cleaning. In the case of the second day, it was thought that the negative results were due to the
use of old electrodes, so before the third day, more electrodes were fabricated. However, a fabrication
error occurred and the electrodes were not evaporated properly, not fitting as they should in the flow
cell. Afterwards, another issue related to the flow cell was found, as the flow cells that have been used
in the previous days was found to be too small and was covering the gold electrodes in the glass surface.
For that reason, in the last day of tests a flow cell was manually created, as in Figure 3.22.
Figure 3.22 - Fabricated evaporated electrode with the manually created flow cell.
(a) (b)
Figure 3.21 - BioFET PNA-DNA hybridization shifts with the use of evaporated electrodes obtained with a 1:29
ratio (a) in different days and (b) the average for each day.

Development of PNA-DNA field-effect transistor-based biosensors
24
Nevertheless, no improvement was seen and thus characterization was performed in EIS to de-
termine if not obtaining positive shifts, and therefore hybridization, is due to the electrodes.
3.3.2.1 EIS Characterization of PNA-DNA Hybridization
As previously stated, EIS was performed with the use of evaporated electrodes and a ratio of 1:29.
After obtaining the impedance spectrum, such as in the example of Figure 3.23, a fitting of the imped-
ance data was done using the equivalent electric circuit (Figure 3.12) and the obtained Rct values as
well as the variation of Rct are shown in Figure 3.24.
As it can be seen from Figure 3.24 (a), hybridization appears to have been achieved. However,
observing 1 in Figure 3.24 (b), it is possible to verify that although Rct increased in this electrode after
hybridization, the difference is smaller than the difference between the stabilities, which leads to believe
that, even though there was an increase in Rct after the incubation period, no hybridization occurred. In
the case of electrode 2, this does not happen but the calculated variation after incubation is only slightly
higher than the one obtained between stabilities, contrary to what has happened before. In electrode 3,
this variation is almost the same and its behaviour resembles the one obtained for the control electrodes
tested in section 3.2.1. Also in the same experiment, as previously mentioned, an average enhancement
of 12.07 kΩ of Rct was obtained, for the same ratio, but with 100 nM ss-DNA and with the use of gold
working electrodes. In this case, an average enhancement of 1,17 kΩ was achieved. Therefore, this
might indicate that evaporated electrodes are unsuitable for this type of application. However, as new
(a) (b)
Figure 3.24 - (a) Fitting values of Rct obtained for an evaporated electrode before and after incubation with 20
nM DNA and (b) the variation of Rct, where stability is the difference between stabilities and hybridization, the
difference between the stable state and after incubation.
Figure 3.23 – Nyquist plot of an example of the impendence spectra obtained for the characterization of the PNA-
DNA hybridization with a 1:29 ratio PNA/MCH evaporated gold electrode with 20 nM DNA.

Development of PNA-DNA field-effect transistor-based biosensors
25
DNA samples were ordered, with the same sequence, and used in this experiment it was necessary to
verify if the ordered samples would provide a higher variation with the use of gold working electrodes
in EIS instead of the evaporated ones.
EIS Characterization of PNA-DNA Hybridization with gold working electrodes
As mentioned before, gold working electrodes were used to verify if the PNA and new DNA
samples would provide higher Rct than the evaporated electrodes. A ratio of 1:29 was again used and 2
nM of ss-DNA followed by 20 nM instead of 100 nM in order to only vary the electrodes used. The Rct
fittings were made using the equivalent electric circuit of Figure 3.12.
The fitting values obtained for Rct are presented in Figure 3.25 (a) and the variation of Rct in
Figure 3.25 (b).
The values obtained are identical with each other, except for electrode 1, as shown Figure 3.25
(a), which demonstrates that obtaining low values will not be due to the electrodes used in these tests.
Regarding the variation of Rct, the values obtained for 2 nM are similar to those obtained for the EIS of
the evaporated electrodes. The average calculated for the variation when using 2 nM was 1.73 kΩ, while
in the case of the evaporated electrodes it was 1.17 kΩ. Although in the case of these gold working
electrodes the value of the Rct variation was higher compared to the difference between stabilities, these
values remain very low. As such, several hypotheses were considered to explain this: the PNA used for
the immobilization solution would be damaged and therefore would not be conveniently immobilized,
since it is a batch of DNA different from the one previously used and even having the same sequence,
the PNA-DNA combination may not be hybridizing sufficiently or at all, and this case the positive Rct
variations are due to non-specific binding.
3.3.3.1 EIS Characterization of MCH-DNA Hybridization
In order to test if any of the hypotheses announced may be possible, EIS was performed using
gold working electrodes and a 1:29 ratio but with an immobilization solution in which the PNA was
replaced by 10 mM PB. In this way it may be possible to understand the interaction of the MCH with
the incubated ss-DNA.
(a) (b)
Figure 3.25 - (a) Fitting values of Rct for a gold working electrode and a 1:29 ratio obtained before after incubation
with 2 and 20 nM DNA and (b) the variation of Rct, where stability is the difference between stabilities and
hybridization the difference between the stable state and after incubation.

Development of PNA-DNA field-effect transistor-based biosensors
26
The Rct fittings were made using the equivalent electric circuit of Figure 3.12. The fitting values
obtained for Rct are presented in Figure 3.26 (a) and the variation of Rct in Figure 3.26 (b).
By observing Figure 3.26 (a), it can be seen that, after incubation, Rct is lower than the stability
state obtained prior to incubation. The same is confirmed by Figure 3.26 (b), where the variation after
incubation is negative. Once the PNA was withdrawn from the immobilization solution, any positive
variation in Rct would indicate that unspecific binding of the incubated ss-DNA would occur. As such
is not the case, it is possible to exclude this hypothesis. However, this cannot serve as conclusive to
determine that the reason for the low Rct variation comes from the PNA, since, it may be something
related to the formation of SAM or to the formation of PNA-DNA duplexes or to the process which may
be pulling out the hybridized ss-DNA.
Figure 3.26 - (a) Fitting values of Rct for a gold working electrode, with a 1:29 ratio in which no PNA is in the
immobilization solution, obtained before after incubation with 20 nM DNA and (b) the variation of Rct, where
stability is the difference between stabilities and after incubation the difference between the stable state and after
incubation.
(a) (b)

Development of PNA-DNA field-effect transistor-based biosensors
27
4 Conclusion and Future Perspectives
The main goal of this thesis was the development of a BioFET biosensor based on the detection
of PNA-DNA hybridization. To do so it was divided in two parts in which the several stages of the
process were analysed:
Part one: Demonstration of BioFET detection of hybridization was achieved as well as a success-
ful application of a blocking buffer. A maximum average hybridization shift of 44,55 mV was obtained
without a blocking buffer in contrast with 105.07 mV obtained with a blocking buffer. Yet, it was con-
cluded that further investigation must be done in order to understand if the results provided after the use
of the blocking buffer are reliable and reproducible. For the application of the intercalator micrux elec-
trodes were used and three PNA:MCH ratios were applied, 1:29, 1:19 and 1:09. However, with the use
of EIS and DPV, the intercalator was proved to be unstable and insoluble and, thus, not reliable for the
purposed application.
Part 2: Optimization of the PNA/MCH ratio and, thus, hybridization was investigated in BioFET.
Again, micrux electrodes were used and ratios of 1:29, 1:19 and 1:09 were tried. For 1:29, an average
shift of 26.02 mV was obtained, 51.03 mV for 1:19 and 1.51 mV for 1:09. In order to reduce costs,
micux electrodes were replaced by evaporated electrodes. For a ratio of 1:29, no positive shifts were
obtained with these type of electrodes, which might be due to temperature, fabrication and/or cleaning
processes or they may not be usable for this application. Characterization of the PNA-DNA hybridiza-
tion with EIS was done to verify if the electrodes were the issue. Additionally, gold working electrodes
were used in EIS to ensure that the PNA-DNA combination was hybridizing. As the Rct values remained
very low, it was necessary to understand if the changes in were caused by unspecific biding. So, EIS
was done, using gold working electrodes and the same ratio, but without addition of PNA to the immo-
bilisation solution. This experiment allowed to conclude that there is no unspecific interaction between
the MCH and ss-DNA incubated.
Future perspectives in regards to this work include the continuation of the PNA/MCH ratio opti-
mization in BioFET, as it has not been reported. Study of the influence of chemical cleaning times in
the stability of the SAM in micrux technologies electrodes to allow reduction of costs. Additionally,
search of new electrodes to allow better coverage and stability of the SAM whilst being cost efficient
and reusable. Relatively to the hybridization process, test out the use of non-complementary DNA and
real samples to study the influence of unspecific binding in the obtained hybridization shifts. Related to
that, further investigation of the use of a blocking buffer should also be done as, although the results of
its use might be a bit unreliable, good positive hybridization shifts were achieved, proving to be a good
possibility for further investigation.
Furthermore, a miniaturization of the whole system could also be tried, by combining the electro-
chemical cell and the FET structure, allowing a smaller and more portable system.

Development of PNA-DNA field-effect transistor-based biosensors
28

Development of PNA-DNA field-effect transistor-based biosensors
29
5 References
Bala, A. and Gorski, L. (2016) ‘Application of nucleic acid analogues as receptor layers for biosensors’, Analytical
Methods, 8(2), pp. 236–244. doi: 10.1039/c5ay02620b.
Bhalla, N. et al. (2016) ‘Introduction to biosensors’, Essays in Biochemistry (2016), (June), pp. 1–8. doi:
10.1042/EBC20150001.
Clark, L. C. and Lyons, C. (1962) ‘Electrode systems for continuous monitoring in cardiovascular surgery.’,
Annals of the New York Academy of Sciences, 102(1), pp. 29–45. doi: 10.1111/j.1749-6632.1962.tb13623.x.
Demidov, V. V et al. (1994) ‘Stability of peptide nucleic acids in human serum and cellular extracts.’, Biochemical
pharmacology, 48(6), pp. 1310–3. Available at: http://www.ncbi.nlm.nih.gov/pubmed/7945427.
DeRisi, J. L., Iyer, V. R. and Brown, P. O. (1997) ‘Exploring the Metabolic and Genetic Control of Gene
Expression on a Genomic Scale’, Science, 278(5338), pp. 680–686. doi: 10.1126/science.278.5338.680.
Egholm, M. et al. (1993) ‘PNA hybridizes to complementary oligonucleotides obeying the Watson–Crick
hydrogen-bonding rules’, Nature, 365(6446), pp. 566–568. doi: 10.1038/365566a0.
Estrela, P. (2015) ‘Molecular Analysis: BioFET Detection Sensors’, in Sawan, M. (ed.) Handbook of Biochips.
New York, NY: Springer New York, pp. 1–19. doi: 10.1007/978-1-4614-6623-9.
Estrela, P. and Migliorato, P. (2007) ‘Chemical and biological sensors using polycrystalline silicon TFTs’, J.
Mater. Chem., 17(3), pp. 219–224. doi: 10.1039/B612469K.
Gaiji, H. et al. (2017) ‘A Peptide Nucleic Acid (PNA)-DNA Ferrocenyl Intercalator for Electrochemical Sensing’,
Electroanalysis, 29(3), pp. 917–922. doi: 10.1002/elan.201600576.
Gao, H. et al. (2011) ‘Electrochemical deoxyribonucleic acid biosensor based on the self-assembly film with
nanogold decorated on ionic liquid modified carbon paste electrode’, Analytica Chimica Acta. Elsevier B.V.,
704(1–2), pp. 133–138. doi: 10.1016/j.aca.2011.07.044.
Grieshaber, D. et al. (2008) ‘Electrochemical Biosensors -Sensor Principles and Architectures’, Sensors,
8(January), pp. 1400–1458. doi: 10.3390/s8031400.
Hammond, J. L. et al. (2016) ‘Electrochemical biosensors and nanobiosensors’, Essays In Biochemistry, 60(1),
pp. 69–80. doi: 10.1042/EBC20150008.
Hosseini, S. M., Tavallaei, M. and Hosseini, E. (2015) ‘A Review of Field-effect Transistors for Nucleic acid-
based Medical Diagnosis’, Advances in Bioresearch, 6(November), pp. 1–8. doi: 10.15515/abr.0976-4585.6.6.18.
Hyrup, B. and Nielsen, P. E. (1996) ‘Peptide Nucleic Acids (PNA): Synthesis, Properties and Potential
Applications’, Bioorganic & medicinal chemistry letters, 4(1), pp. 5–23. doi: 10.1016/0968-0896(95)00171-9.
Jolly, P. et al. (2015) ‘A simple and highly sensitive electrochemical platform for detection of MicroRNAs’, 2015
IEEE SENSORS - Proceedings, pp. 8–11. doi: 10.1109/ICSENS.2015.7370378.
Keighley, S. D. et al. (2008) ‘Optimization of label-free DNA detection with electrochemical impedance
spectroscopy using PNA probes’, Biosensors and Bioelectronics, 24(4), pp. 906–911. doi:
10.1016/j.bios.2008.07.041.
Lisdat, F. and Schäfer, D. (2008) ‘The use of electrochemical impedance spectroscopy for biosensing’, Analytical
and Bioanalytical Chemistry, 391(5), pp. 1555–1567. doi: 10.1007/s00216-008-1970-7.
Lorenz, W. and Schulze, K. D. (1975) ‘Application of transform-impedance spectrometry.’, Journal of
Electroanalytical Chemistry, 65(1), pp. 141–153.
Lowe, C. R. (2008) ‘Overview of Biosensor and Bioarray Technologies’, Handbook of Biosensors and Biochips,
p. 16. doi: 10.1002/9780470061565.hbb003.
Maalouf, R. et al. (2007) ‘Label-Free Detection of Bacteria by Electrochemical Impedance Spectroscopy:
Comparison to Surface Plasmon Resonance’, Analytical Chemistry, 79(13), pp. 4879–4886. doi:
10.1021/ac070085n.
Mateo-Mart, E. and Pradier, C.-M. (2010) ‘A Novel Type of Nucleic Acid-based Biosensors: the Use of PNA

Development of PNA-DNA field-effect transistor-based biosensors
30
Probes, Associated with Surface Science and Electrochemical Detection Techniques’, in Intelligent and
Biosensors. InTech, pp. 323–344. doi: 10.5772/7160.
Mohanty, S. P. and Koucianos, E. (2006) ‘Biosensors: A tutorial review’, IEEE Potentials, 25(2), pp. 35–40. doi:
10.1109/MP.2006.1649009.
Nielsen, P. E. et al. (1991) ‘Sequence-selective recognition of DNA by strand displacement with a thymine-
substituted polyamide.’, Science (New York, N.Y.), 254(5037), pp. 1497–1500. doi: 10.1126/science.1962210.
Pachauri, V. and Ingebrandt, S. (2016) ‘Biologically sensitive field-effect transistors: from ISFETs to NanoFETs’,
Essays In Biochemistry, 60(1), pp. 81–90. doi: 10.1042/EBC20150009.
Paleček, E. and Bartošík, M. (2012) ‘Electrochemistry of nucleic acids’, Chemical Reviews, 112(6), pp. 3427–
3481. doi: 10.1021/cr200303p.
Ray, A. and Nordén, B. (2000) ‘Peptide nucleic acid (PNA): its medical and biotechnical applications and promise
for the future.’, FASEB journal : official publication of the Federation of American Societies for Experimental
Biology, 14(9), pp. 1041–60. doi: 14(9),1041-1060.
Ronkainen, N. J., Halsallb, H. B. and Heinemanb, W. R. (2010) ‘Electrochemical biosensors’, Chemical Society
Reviews, 39, pp. 1747–1763. doi: 10.1039/b714449k.
Schöning, M. J. and Poghossian, A. (2002) ‘Recent advances in biologically sensitive field-effect transistors
(BioFETs).’, The Analyst, 127(9), pp. 1137–1151. doi: 10.1039/b204444g.
Schöning, M. J. and Poghossian, A. (2006) ‘Bio FEDs (Field-Effect Devices): State-of-the-art and new directions’,
Electroanalysis, 18(19–20), pp. 1893–1900. doi: 10.1002/elan.200603609.
Takenaka, S. et al. (2000) ‘DNA sensing on a DNA probe-modified electrode using ferrocenylnaphthalene diimide
as the electrochemically active ligand’, Analytical Chemistry, 72(6), pp. 1334–1341. doi: 10.1021/ac991031j.
Thévenot, D. R. et al. (2001) ‘Electrochemical biosensors: Recommended definitions and classification’,
Biosensors and Bioelectronics, 16(1–2), pp. 121–131. doi: 10.1016/S0956-5663(01)00115-4.
Vo-Dinh, T. and Cullum, B. (2008) ‘Biosensors and biochips: advances in biological and medical diagnostics.’,
Fresenius’ journal of analytical chemistry, 366(6–7), pp. 540–551. doi: 10.1007/s002160051549.
Wang, J. (1998) ‘DNA biosensors based on peptide nucleic acid (PNA) recognition layers. A review’, Biosensors
and Bioelectronics, 13(7–8), pp. 757–762. doi: 10.1016/S0956-5663(98)00039-6.
Wang, J. (1998) ‘PNA biosensors for PNA Acid detection’, Current Issues Molec. Biol, 1(2), pp. 117–122.
Wang, J. and Kawde, A. N. (2001) ‘Pencil-based renewable biosensor for label-free electrochemical detection of
DNA hybridization’, Analytica Chimica Acta, 431(2), pp. 219–224. doi: 10.1016/S0003-2670(00)01318-0.
Wang, K. et al. (2011) ‘Design of a sandwich-mode amperometric biosensor for detection of PML/RARα fusion
gene using locked nucleic acids on gold electrode’, Biosensors and Bioelectronics. Elsevier B.V., 26(6), pp. 2870–
2876. doi: 10.1016/j.bios.2010.11.030.
Yang, Z. et al. (2015) ‘A novel DNA biosensor using a ferrocenyl intercalator applied to the potential detection of
human population biomarkers in wastewater’, Environmental Science and Technology, 49(9), pp. 5609–5617. doi:
10.1021/acs.est.5b00637.

Development of PNA-DNA field-effect transistor-based biosensors
31
Appendices
A. BioFET electrodes and set up
1. Electrodes
Thin-film double metal-based single electrodes with 10×6×0.75 mm in dimensions. Three-elec-
trodes approach: gold working electrode (1 mm of diameter), platinum reference and platinum counter
electrode.
Evaporated gold electrodes with arrays of gold electrodes with 2 mm in diameter. Prepared in-
house on glass slides, with 75×26×1 mm in dimensions, using a thermal evaporator (BOC Edwards,
UK). The glass slides were firstly exposed to chemical cleaning using piranha solution (H2SO4/ H2O2,
v/v 3/1) for 10 minutes. The process, performed under fine vacuum (2.0×10⁻⁶ mbar), consists of an initial
evaporation of 10 nm of chromium through a shadow mask followed by 150 nm of gold. Chromium
was used as an intermediate layer since gold does not naturally adhere to glass.
2. Set up
• Flow cells
In order to connect the electrodes to the FET structure and the semiconductor device analyser, two
flow cells, correspondent to the two types of electrodes, had to be used.
In the case of the micrux electrodes an all-in-one cell (Figure A.2) had to be purchased from Micrux
Technologies (Oviedo, Spain).
In order to use the evaporated electrodes, a cell had to be fabricated in-house in order to fix the glass
slides, the gold electrodes could be exposed, as well as the pads (Figure A.3).
Figure A.1 - Micrux Technologies electrode.
Figure A.2 - Cell used for application of micrux electrodes.

Development of PNA-DNA field-effect transistor-based biosensors
32
B. EIS: nyquist plots and corresponding fittings
Figure B.1 - Nyquist plots of 1:29 ratio PNA/MCH immobilized gold working electrode, (a),(b) and (c) before
and after incubation with 100 nM complementary ssDNA and (d), (e) and (f) without hybridization.
(a)
(b)
(c)
(d)
(e)
(f)
Figure A.3 - Cell used for the application of the evaporated electrodes.

Development of PNA-DNA field-effect transistor-based biosensors
33
Parameters Rs (kΩ) Rct (kΩ) W (Ωs-1/2) Q (Ω-1s-n) n
Electrode Measurement Value Error (%) Value Error (%) Value Error (%) Value Error (%) Value Error (%)
(a)
Stability 1 675.0 5.8 4071.0 1.5 3.20×10⁻⁴ 1.94 8.17×10⁻⁷ 10.53 0.88 1.94
Stability 2 708.1 4.43 4930.0 0.85 3.09×10⁻⁴ 0.96 7.66×10⁻⁷ 4.53 0.88 0.93
Stability 3 710.7 4.83 5125.0 0.88 3.07×10⁻⁴ 0.98 7.70×10⁻⁷ 4.48 0.88 0.94
Stability 4 648.0 6.52 5514.0 1.24 3.21×10⁻⁴ 2.23 7.97×10⁻⁷ 8.44 0.88 1.62
Hybridization 542.7 14.54 16330 0.99 2.71×10⁻⁴ 4.36 9.58×10⁻⁷ 5.24 0.84 1.26
(b)
Stability 1 655.6 6.0 4101.0 1.36 3.21×10⁻⁴ 1.51 8.57×10⁻⁷ 8.38 0.87 1.63
Stability 2 706.1 6.99 1935.0 3.08 3.07×10⁻⁴ 1.2 4.84×10⁻⁷ 18.88 0.90 3.15
Stability 3 753.8 5.91 2157.0 2.45 3.11×10⁻⁴ 1.0 4.52×10⁻⁷ 13.71 0.92 2.35
Stability 4 737.1 5.8 2320.0 2.27 3.12×10⁻⁴ 1.19 4.14×10⁻⁷ 14.49 0.92 2.38
Hybridization 369.9 37.28 16320.0 1.42 2.79×10⁻⁴ 5.72 7.34×10⁻⁷ 7.42 0.82 1.77
(c)
Stability 1 536.6 11.33 1828.0 3.75 3.43×10⁻⁴ 1.0 5.90×10⁻⁷ 17.21 0.85 3.28
Stability 2 706.8 4.11 2436.0 1.6 3.27×10⁻⁴ 1.22 4.06×10⁻⁷ 12.55 0.93 1.95
Stability 3 732.6 4.57 2881.0 1.41 3.13×10⁻⁴ 0.89 3.85×10⁻⁷ 8.34 0.93 1.42
Hybridization 640.3 5.64 11490.0 0.45 3.09×10⁻⁴ 1.45 4.06×10⁻⁷ 2.57 0.92 0.52
(d)
Stability 1 676.0 4.23 2755.0 1.24 3.19×10⁻⁴ 0.61 6.10×10⁻⁷ 6.14 0.89 1.18
Stability 2 712.0 3.11 3188.0 0.9 3.17×10⁻⁴ 0.62 5.87×10⁻⁷ 5.21 0.90 0.95
Stability 3 730.4 3.75 3273.0 1.0 3.08×10⁻⁴ 0.79 5.46×10⁻⁷ 6.27 0.91 1.13
Stability 4 651.9 9.05 3579.0 2.41 3.03×10⁻⁴ 2.50 6.50×10⁻⁷ 17.6 0.88 3.09
Control 659.4 3.2 3816.0 0.71 2.95×10⁻⁴ 0.6 5.50×10⁻⁷ 4.2 0.90 0.77
(e)
Stability 1 507.9 14.27 3188.0 2.72 3.08×10⁻⁴ 1.32 8.75×10⁻⁷ 12.24 0.82 2.64
Stability 2 498.6 15.63 3413.0 2.76 3.04×10⁻⁴ 1.46 8.45×10⁻⁷ 12.62 0.82 2.71
Stability 3 581.1 11.71 3739.0 2.34 2.97×10⁻⁴ 1.73 7.65×10⁻⁷ 12.84 0.84 2.55
Stability 4 538.3 13.62 3508.0 2.67 3.01×10⁻⁴ 1.77 8.94×10⁻⁷ 14.15 0.82 2.9
Control 629.8 7.8 4088.0 1.85 2.81×10⁻⁴ 2.0 8.61×10⁻⁷ 13.15 0.83 2.47
(f)
Stability 1 671.5 6.19 1623.0 3.74 3.25×10⁻⁴ 1.67 1.33×10⁻⁶ 27.77 0.82 4.89
Stability 2 703.7 6.56 1958.0 2.98 3.16×10⁻⁴ 1.04 1.28×10⁻⁶ 15.42 0.82 3.1
Stability 3 647.6 7.41 2168.0 2.8 3.21×10⁻⁴ 1.06 1.44×10⁻⁶ 14.04 0.80 2.96
Stability 4 547.4 8.61 2366.0 2.42 3.11×10⁻⁴ 0.8 1.41×10⁻⁶ 10.36 0.79 2.35
Control 673.2 4.79 2348.0 1.84 3.12×10⁻⁴ 0.92 1.25×10⁻⁶ 10.7 0.82 2.1
Table 1 - Fitting Values of the Equivalent Circuit Elements.
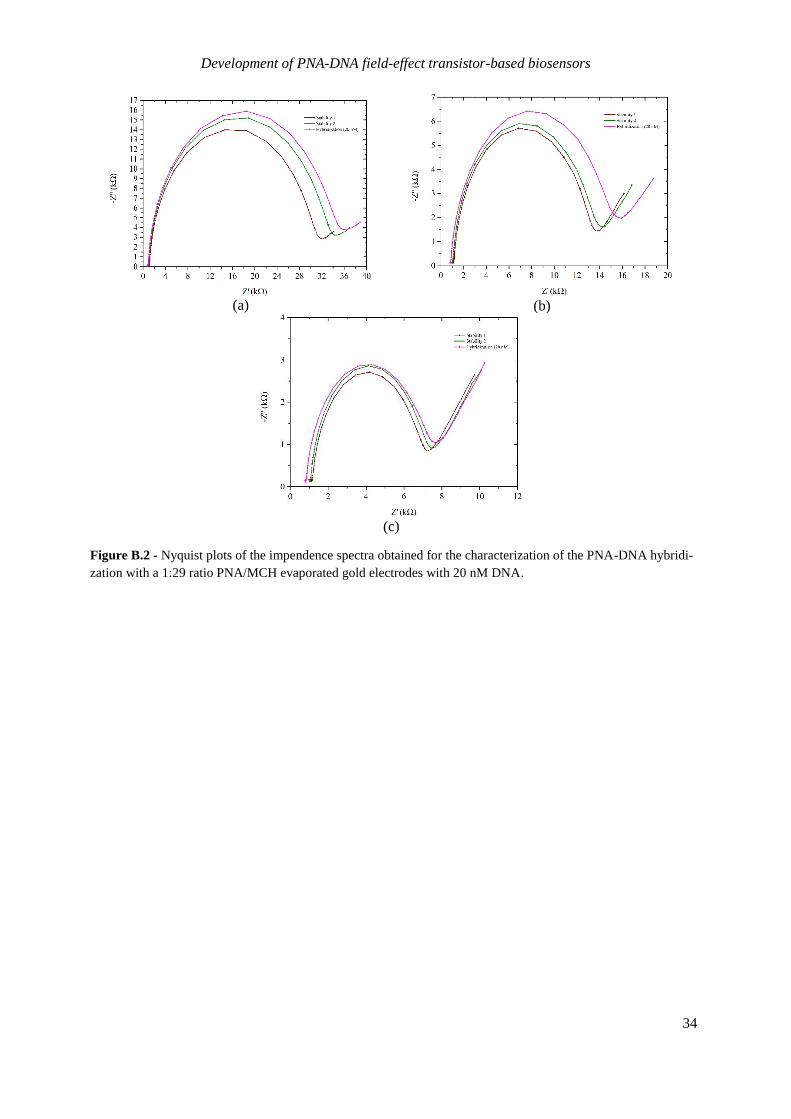
Development of PNA-DNA field-effect transistor-based biosensors
34
Figure B.2 - Nyquist plots of the impendence spectra obtained for the characterization of the PNA-DNA hybridi-
zation with a 1:29 ratio PNA/MCH evaporated gold electrodes with 20 nM DNA.
(a) (b)
(c)

Development of PNA-DNA field-effect transistor-based biosensors
35
Parameters Rs (kΩ) Rct (kΩ) W (Ωs-1/2) Q (Ω-1s-n) n
Electrode Measurement Value Error
(%) Value
Error
(%) Value
Error
(%) Value
Error
(%) Value
Error
(%)
(a)
Stability 1 1115.0 2.35 29300.0 0.19 2.58×10⁻⁴ 1.52 5.05×10⁻⁷
0.91 0.97 0.21
Stability 2 1026.0 2.97 31730.0 0.22 2.34×10⁻⁴ 1.81 5.02×10⁻⁷ 1.08 0.97 0.25
Hybridization 871.7 9.29 33220.0 0.42 1.99×10⁻⁴ 2.4 5.21×10⁻⁷ 1.62 0.96 0.42
(b)
Stability 1 1152.0 1.48 11860.0 0.23 2.95×10⁻⁴ 0.8 5.26×10⁻⁷ 1.27 0.96 0.26
Stability 2 1044.0 1.84 12330.0 0.26 2.62×10⁻⁴ 0.87 5.23×10⁻⁷ 1.5 0.96 0.31
Hybridization 840.6 3.88 14000.0 0.41 2.42×10⁻⁴ 1.38 6.88×10⁻⁷ 2.17 0.93 0.48
(c)
Stability 1 1126.0 1.49 5765.0 0.5 3.29×10⁻⁴ 1.06 6.42×10⁻⁷ 3.51 0.94 0.64
Stability 2 1045.0 1.49 6050.0 0.43 3.16×10⁻⁴ 0.92 6.26×10⁻⁷ 3.0 0.94 0.55
Hybridization 799.4 1.69 6425.0 0.39 3.02×10⁻⁴ 0.86 8.32×10⁻⁷ 2.69 0.92 0.52
Table 2 - Fitting Values of the Equivalent Circuit Elements.

Development of PNA-DNA field-effect transistor-based biosensors
36
Figure B.3 – Nyquist ploys for gold working electrodes and a 1:29 ratio obtained before after incubation with 2
and 20 nM DNA.
(a) (b)
(c) (d)

Development of PNA-DNA field-effect transistor-based biosensors
37
Parameters Rs (kΩ) Rct (kΩ) W (Ωs-1/2) Q (Ω-1s-n) n
Electrode Measurement Value Error
(%) Value
Error
(%) Value
Error
(%) Value
Error
(%) Value
Error
(%)
(a)
Stability 1 594.7 0.0 13280.0 1.13 2.61×10⁻⁴ 5.69 6.13×10⁻⁷ 9.84 0.84 1.9
Stability 2 548.8 0.0 11230.0 0.0 2.01×10⁻⁴ 5.71 4.30×10⁻⁷ 16.43 0.89 2.96
Stability 3 97.1 242.33 15500.0 2.31 2.60×10⁻⁴ 7.0 7.32×10⁻⁷ 11.14 0.80 2.77
Hybridization (2 nM) 1.0×10⁻⁴ 1000 18260.0 2.95 2.49×10⁻⁴ 8.41 7.89×10⁻⁷ 11.75 0.78 3.28
Hybridization (20 nM) 412.0 30.38 15240.0 1.51 2.53×10⁻⁴ 5.88 6.39×10⁻⁷ 9.34 0.82 2.05
(b)
Stability 1 589.0 4.67 3318.0 1.78 3.37×10⁻⁴ 2.09 2.23×10⁻⁶ 12.12 0.83 2.45
Stability 2 603.8 4.12 3496.0 1.56 3.39×10⁻⁴ 1.92 2.39×10⁻⁶ 10.39 0.82 2.15
Stability 3 561.1 9.23 3789.0 2.08 3.36×10⁻⁴ 1.82 2.35×10⁻⁶ 9.74 0.82 2.33
Hybridization (2 nM) 592.1 4.7 5360.0 1.23 3.22×10⁻⁴ 2.2 2.28×10⁻⁶ 7.49 0.82 1.66
Hybridization (20 nM) 599.0 4.5 4635.0 1.32 3.22×10⁻⁴ 2.08 2.07×10⁻⁶ 8.41 0.84 1.78
(c)
Stability 1 586.6 4.13 3520.0 1.07 3.26×10⁻⁴ 1.45 3.64×10⁻⁷ 10.05 0.90 1.55
Stability 2 589.9 4.63 3621.0 1.18 3.27×10⁻⁴ 1.64 3.76×10⁻⁷ 11.01 0.90 1.71
Stability 3 576.9 4.59 3950.0 1.06 3.23×10⁻⁴ 1.61 3.47×10⁻⁷ 9.79 0.91 1.52
Hybridization (2 nM) 580.1 4.59 3941.0 1.08 3.19×10⁻⁴ 1.58 4.15×10⁻⁷ 9.84 0.89 1.57
Hybridization (20 nM) 607.5 5.01 4413.0 1.11 3.16×10⁻⁴ 1.84 3.46×10⁻⁷ 10.07 0.91 1.59
(d)
Stability 1 607.9 2.6 3454.0 0.92 2.55×10⁻⁴ 2.84 4.57×10⁻⁷ 6.7 0.90 1.06
Stability 2 628.6 0.0 3482.0 0.83 2.46×10⁻⁴ 3.7 4.42×10⁻⁷ 7.22 0.91 1.05
Stability 3 628.1 0.0 371.3 0.0 2.75×10⁻⁴ 2.87 3.42×10⁻⁷ 21.14 0.95 3.09
Hybridization (2 nM) 599.0 4.72 6295.0 1.23 1.46×10⁻⁴ 4.29 4.78×10⁻⁷ 7.47 0.90 1.27
Hybridization (20 nM) 662.0 2.46 5351.0 0.75 1.51×10⁻⁴ 2.96 3.89×10⁻⁷ 3.96 0.93 0.65
Table 3 - Fitting Values of the Equivalent Circuit Elements.

Development of PNA-DNA field-effect transistor-based biosensors
38
Figure B.4 – Nyquist plots for gold working electrodes, with a 1:29 ratio in which no PNA is in the
immobilization solution, obtained before after incubation with 20 nM DNA.
(a) (b)
(c) (d)

Development of PNA-DNA field-effect transistor-based biosensors
39
Parameters Rs (kΩ) Rct (kΩ) W (Ωs-1/2) Q (Ω-1s-n) n
Electrode Measurement Value Error
(%) Value
Error
(%) Value
Error
(%) Value
Error
(%) Value
Error
(%)
(a)
Stability 1 593.7 2.05 1237.0 1.3 3.85×10⁻⁴ 0.55 6.75×10⁻⁷ 11.03 0.85 1.69
Stability 2 647.2 2.22 1442.0 1.39 3.82×10⁻⁴ 0.75 6.64×10⁻⁷ 12.45 0.86 1.9
Stability 3 621.9 1.92 1507.0 1.08 3.82×10⁻⁴ 0.58 6.51×10⁻⁷ 9.14 0.86 1.42
Stability 4 621.1 2.36 1572.0 1.25 3.87×10⁻⁴ 0.7 6.02×10⁻⁷ 10.4 0.87 1.61
Hybridization (20 nM) 612.2 3.2 1229.0 2.05 3.81×10⁻⁴ 0.77 7.06×10⁻⁷ 16.08 0.85 2.52
(b)
Stability 1 551.9 2.76 276.9 14.6 3.77×10⁻⁴ 2.09 9.97×10⁻⁶ 92.62 0.70 15.9
Stability 2 620.6 2.6 282.1 11.93 3.78×10⁻⁴ 1.5 9.67×10⁻⁶ 68.5 0.70 12.48
Stability 3 616.0 2.01 295.5 9.35 3.78×10⁻⁴ 1.25 1.05×10⁻⁵ 52.55 0.70 9.66
Stability 4 586.9 11.97 311.2 51.88 3.81×10⁻⁴ 6.71 8.41×10⁻⁶ 354.19 0.70 61.24
Hybridization (20 nM) 603.2 2.12 277.9 10.9 3.73×10⁻⁴ 2.08 1.08×10⁻⁵ 61.39 0.70 11.09
(c)
Stability 1 638.6 5.16 1876.0 2.29 3.17×10⁻⁴ 0.95 1.01 ×10⁻⁶ 14.87 0.81 2.7
Stability 2 597.7 3.71 1893.0 1.88 3.16×10⁻⁴ 1.16 1.09×10⁻⁶ 16.64 0.81 2.79
Stability 3 591.5 4.37 2025.0 1.79 3.07×10⁻⁴ 0.93 9.42×10⁻⁷ 13.16 0.83 2.29
Stability 4 613.5 5.61 2210.0 2.53 3.09×10⁻⁴ 1.89 8.66×10⁻⁷ 22.53 0.84 3.71
Hybridization (20 nM) 550.3 7.45 1592.0 3.4 3.37×10⁻⁴ 1.84 1.43×10⁻⁶ 21.56 0.77 4.06
(d)
Stability 1 644.3 2.73 1698.0 1.31 3.8×10⁻⁴ 0.68 5.29×10⁻⁷ 9.87 0.87 1.56
Stability 2 674.4 3.52 1626.0 1.86 3.78×10⁻⁴ 1.68 2.94×10⁻⁷ 5.51 0.91 0.0
Stability 3 649.0 2.47 1747.0 1.19 3.8×10⁻⁴ 0.68 5.04×10⁻⁷ 9.36 0.95 1.46
Stability 4 641.5 2.35 1833.0 1.07 3.79×10⁻⁴ 0.65 4.88×10⁻⁷ 8.46 0.88 1.32
Hybridization (20 nM) 671.3 2.05 1568.0 0.75 3.78×10⁻⁴ 0.66 5.25×10⁻⁷ 10.15 0.87 1.54
Table 4 - Fitting Values of the Equivalent Circuit Elements.


