DEVELOPMENT OF ACTIVE FLOW CONTROL MIXED-FLOW TURBINE ON EDDY-CURRENT
DYNAMOMETER FOR AUTOMOTIVE TURBOCHARGER APPLICATION
Apostolos Pesiridis, Srithar Rajoo, Shinri Szymko and Ricardo Martinez-Botas*
Department of Mechanical Engineering Imperial College London
SW7 2AZ Exhibition Road, London
ABSTRACT
The increase in particle emissions restrictions in recent years coupled with improvements
in such key automotive engine performance areas as low-end torque, increased boost and
the elimination of turbolag now required, has led to conventional Variable Geometry
Turbochargers (VGTs) to become quite popular in matching turbine inlet geometry to the
characteristics of the exhaust gas stream throughout the engine operating range. However,
over all these years of turbocharger development the fundamental issue of the less than
ideal combination of a reciprocating engine providing energy to drive a rotodynamic
machine such as a turbocharger turbine has not been addressed satisfactorily. This paper,
therefore, introduces a new concept in turbocharger development, namely, that of active
turbocharger flow control. It demonstrates the application of an active flow control device
(nozzle) at the inlet to the turbine rotor to help harness the energy contained as a result of
the pulsating characteristics of the incoming flow. In the Active Control Turbocharger
(ACT), therefore, the nozzle (in this case a sliding vane) is able to alter the inlet area at
the throat of the turbine inlet casing (volute) in phase and at the same frequency as that of
the incoming exhaust stream pulses. Actuated by a high speed electrodynamic shaker the
nozzle can adapt according to the engine exhaust gas pulse pressure variation, thus taking
advantage of the lower energy levels existent before and after each pulse pressure peak,
which the current systems do not take advantage of. Thus, ACT makes better use of the
exhaust gas energy of the engine than a conventional VGT. The experimental work
concentrates on the potential gain in turbine expansion ratio and eventual power output as
well as the corresponding efficiency trace and nozzle area schedule. Exploration of the
full turbine range was made possible by the use of a new eddy-current dynamometer, also,
presented here. Early simulation work has, already, provided encouraging results with a
theoretical potential gain in terms of cycle expansion ratio and actual power output of
approximately 9% and 29%, respectively at typical engine operating points (40Hz or
equivalent to 1600 engine rpm). Direct comparisons between VGT and ACT operation are
also provided, at selected, typical, laboratory-simulated engine operating conditions,
showing the benefits arising from the use of this innovative technology.
NOMENCLATURE
U blade tip speed
m mass flow rate
FGT Fixed Geometry Turbocharger
VGT Variable Geometry Turbocharger
ACT Active Control Turbocharger
Cp specific heat at constant pressure
C gas inlet velocity
ACT Nozzle amplitude in ACT mode
null Normalised open throat area when nozzle is at null point for ACT testing
VGT Normalised open throat area in VGT mode
ER turbine expansion ratio
P pressure
T temperature
Cp specific heat at constant pressure
MFP mass flow parameter 0
0
P
TmMFP
MFT Mixed Flow Turbine
is
inlet
V
U velocity ratio
1
01
201
1
12P
PTC
U
V
U
P
is
inlet
st total to static efficiency
Subscripts
is isentropic
act actual
0 total/stagnation
2 pulse generator
3 turbine inlet
4 turbine exit
1 INTRODUCTION
Automotive turbochargers almost in their entirety are equipped with radial turbines, due
to the efficiency superiority of radial designs when compared to other turbine types
relative to a given, small size. But radial turbines are limited in their potential, due to
their radial leading edge. A mixed flow turbine differs from a radial turbine in that the

leading edge is swept radially downward, as opposed to the zero blade angle of the radial
turbine. Research has shown a substantial amount of exhaust gas energy to be available at
velocity ratios of less than 0.7 (1) – the point of highest energy recovery for a radial
turbine. For a non-zero blade angle the velocity ratio and thus the peak efficiency point
moves to a lower velocity ratio, which means a higher pressure ratio. Shifting the peak
efficiency point to a higher pressure ratio is advantageous in a turbocharger application,
which is subjected to pulsating flows from the reciprocating engine, where the greater
energy of the flow is contained at high pressures (2).
On the other hand, the benefits accrued by the use of variable geometry devices for
exhaust gas flow control to the turbine are well known and include improved transient
response, fuel economy and more importantly reduced emissions in the face of ever
stringent emissions regulations. VGTs are becoming increasing popular in recent years
and are standard production equipment or standard options after several years of
struggling with reliability problems.
Given the extensive research work already carried out by the turbocharger research group
at Imperial College on Mixed Flow Turbines (MFTs) on fixed geometry turbochargers
(FGTs) and the promising results yielded so far it was decided to expand the scope by
studying a novel variable geometry turbocharger capable of actively controlling the flow
into the turbine, in combination with the present MFT installed. This Active (flow)
Control Turbocharger (ACT) can be run in both ACT mode as well as conventional
Variable Geometry Turbocharger (VGT) mode.
A fundamental issue that has so far not been addressed satisfactorily, however, is the less
than ideal combination of a reciprocating engine providing energy to drive a rotodynamic
machine such as a turbocharger turbine. Yet even with the advent of VGTs this mismatch
is not eliminated, since a VGT responds to operating point changes only, i.e., for fixed
operating conditions the nozzle setting on a VGT assumes one non-changing, optimal
condition. However, regardless of the engine operating point, the inlet conditions to the
turbocharger still include a highly pulsating flow field with widely varying pressure and
mass flow rate levels. Hence, the energy levels contained within that flow field can still
effectively be harnessed, by constantly altering the effective throat area to the turbine by
means of a fast-response nozzle.
The aim of this project, therefore, is to introduce the application of an active flow control
device (nozzle) at the inlet to the turbine rotor to help harness the energy contained as a
result of the pulsating characteristics of the incoming flow. The Active Control
Turbocharger (ACT) is a special type of VGT, where the nozzle (in this case a sliding
vane) is able to alter the inlet area at the throat of the turbine inlet casing (volute) in phase
and at the same frequency as that of the incoming exhaust stream pulses. For this purpose
it is actuated by a suitable electrodynamic shaker - in turn supplied by a powerful
amplifier - capable of meeting the frequency and displacement requirements of this
intensive and continuous operation.
2 LITERATURE REVIEW

2.1 Mixed flow turbines
The concept of mixed-turbine was initially studied for the first time in the early 1950s for
aerospace application. By the early 1970’s the possibility of using mixed-flow turbine was
introduced to overcome the problems associated with a radial turbine. For the past three
decades research has concentrated in proving the superiority of the mixed flow turbine in
terms of lower velocity ratio operation and higher mass flow rate (4, 5, 6, 7). Apart from
these, the mixed flow turbine has, also, been developed as part of engine development in
recognition of its advantages (8, 9, 10, 11). Despite some disadvantages such as larger
weight by comparison to a radial turbine, giving rise to dynamic problems as well as a
more complicated to design for stress reduction (12), the mixed flow turbine is possibly
the wisest option to replace a radial turbine with in order to keep up to the ever increasing
engine requirements.
2.2 Variable geometry turbocharging
Although the concept of VGT is not entirely new (the first examples appearing in the
early 1960’s) their development did not gain impetus until fairly recently. Up until the
early 1980’s VGTs were rarely used except on gas turbine plants and experimental
turbochargers. The common problems encountered with VGT were reliability (for long
periods of time while exposed to high temperature and corrosive exhaust gases),
complexity because of the VGT actuation mechanism and control system, and subsequent,
high cost (14). However, recent research has tended to provide acceptable solutions to
most of these problems and today, VGTs have already had a significant impact in the
design of small diesel engines.
Many VGT devices have been tested over the years such as movable volute tongue,
pivoting nozzle vanes, moveable sidewall and sliding nozzle. Comparison of the
performance of the various VGT types has shown that pivoting vanes and sliding nozzles
afford higher performance and better reliability and are the designs of choice for
turbochargers produced today (15, 16, 17). The current project utilised a lightweight
sliding nozzle for VGT and ACT testing (Fig.4).
Most available published work on VGTs is still based on steady-state data. Exceptions
have used averaged pulsating data in combination with VGT, from which empirical
factors are derived to compare steady and unsteady data (18). The present experimental
facility, however, offers the ability for both steady and pulsating flow testing of the VGT,
equipped with a mixed flow turbine for the first time. The scope of steady state testing of
a VGT is to develop ACT operating schedules. From past research, however, it has been
shown that the turbine performance during pulsating flow departs substantially from the
quasi-steady assumption (6, 7). Thus unsteady-state VGT testing is required in order to
define alternate and perhaps more optimal ACT operating schedules and more importantly
to provide a basis to compare against ACT data since unsteady tests provide a closer
match to real life engine operation..
3 EXPERIMENTAL TEST FACILITY

The turbocharger aerodynamic test facility is a simulated reciprocating engine test bed for
turbocharger testing. Engine pulsations are simulated by pulse generator plate cut-outs. As
there is no real engine and warm air not hot exhaust gas is the flowing medium,
equivalent conditions are used, which are summarised in Table 1:
Table 1 – Design Conditions (3)
Parameter Design
Condition
Equivalent Design
Condition
Units
Pressure Ratio 2.91 2.91 --
Inlet Temperature 923 344 K
Mass Flow Rate 0.414 0.678 kg/s
Rotational Speed 98,000 60,000 rpm
Compressors provide compressed air instead of hot exhaust gas to simulate flow into the
turbocharger and heaters warm the air up to the required inlet conditions.
The present facility introduces three new features to advance the research already carried
out by this group previously on MFTs. In addition to new instrumentation, a permanent
magnet, eddy current dynamometer is now used in place of the previous compressor, as
well as a novel Active (flow) Control Turbocharger.
3.1 Instrumentation
The instrumentation for control, monitoring, data logging and data post processing has
been modified and upgraded to an automated system through the use of two computers,
which now undertake the entire experimental task.
One computer handles all normal control functions such as air flow and pulse generator
frequency regulation, as well as steady-state monitoring and data logging through the use
of Fieldpoint distributed, network I/O modules to the static pressure, temperature and
frequency counters. The second computer is used for high speed data acquisition as well
as to control the electrodynamic shaker which actuates the ACT. For this task two high-
speed PCI boards are utilised. In addition, an external function waveform generator is
used as part of the ACT control system.
3.2 Eddy current dynamometer
3.2.1 Introduction
Dynamometers are used to measure the power, from which the efficiency of turbocharger
turbines can be estimated. The dynamometer requirement for small turbomachines such
as turbocharger turbines need to operate at very high speeds, typically 100,000~200,000
rpm. The rotational part of the dynamometer must be light in weight and have a small
polar inertia; otherwise the bearing system on the turbocharger will fail. Because of the
wide operating conditions of the turbocharger turbines, the power range requirement of
the dynamometer is large. When engine simulations are carried out with quasi-steady
methods to model the pulsating flow conditions in the engine manifold and its
turbocharger, a turbine map with very wide operating conditions is required. A possible
method to obtain such a map is by using the compressor of the turbocharger to load the
turbine, unfortunately the range of data using this method would be insufficient given the
surge and choke margins of the compressor. An eddy current dynamometer used as the
loading device thus offers a much broader range of testing without the associated
aerodynamic limitations of the compressor it now replaces.
Due to the pulsating inflow condition in a turbocharger turbine, the instantaneous
performance does not follow the steady characteristic curve (7); but rather a hysteresis
loop that encircles the steady result is obtained. To measure the instantaneous torque or
power of the turbines, it is essential to know the polar inertia of the rotational assembly of
the dynamometer; hence an eddy-current based dynamometer is superior over the
hydraulic dynamometer. Furthermore the light nature of the dynamometer used ensures
that the instantaneous performance of the turbine can be measured without appreciable
damping effects.
In the past, permanent magnet technology could not meet the requirements of turbocharger
dynamometers because of the high demagnetisation field generated by the eddy currents.
With the advent of rare-earth magnets such as Neodymium-iron-boron magnets with their
high resistance to demagnetisation, their use has become practical in dynamometers.
3.2.1 Description
If a conducting disk is exposed to a changing magnetic field caused by the relative motion
of a permanent magnet translating above its surface, eddy-currents are induced within the
conductor. These eddy-currents generate their own magnetic field that will oppose the
source field; the magnet will experience reactionary forces. These forces manifest
themselves as both a repulsion and a retardation force. It is this latter force that is utilized
by the dynamometer; the retardation force multiplied by the relative velocity yields the
power absorbed by the dynamometer. This power is also equal to the heat that must be
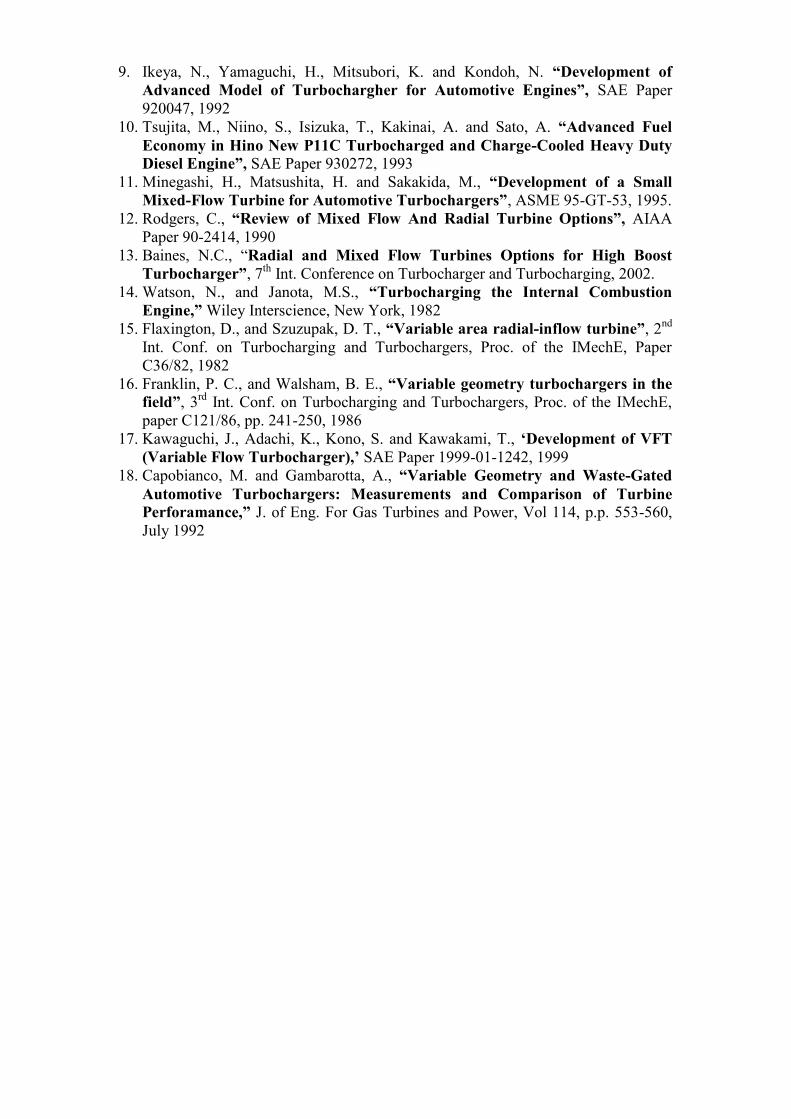
removed from the stators in order to maintain a stable system. Figure 2 shows a simplified
model of the dynamometer principle.
The dynamometer utilises the principle of eddy-current braking by incorporating
Neodymium-Iron-Boron magnets in a spider creating a low inertia axial flux rotor.
The rotor developed incorporates 14 ground Neodymium-Iron-Boron magnets of 10mm
depth. These were positioned with alternate polarity in an aluminium spider to create a 14-
Pole axial flux rotor. This rotor spins co-axially to a set of stationary water-cooled
conducting plates known as the stators, which are located on either side of the rotor (Fig.
3). A carbon-fibre ring was used to externally support the magnets giving an overall
diameter of 80mm, whilst a central steel spigot was used to create the required interference
fit in order to secure the magnets in place. Water-cooled stators were placed on either side
of the rotor. This allows the dissipation of a greater amount of power whilst alleviating the
problem of the axial thrust created by the eddy-currents. The movement of the stators was
remotely controlled in a stepper motor system. By altering the gap between the stators and
the rotor the power that the dynamometer absorbs can also be altered. This type of set-up
requires very few components and gives rise to a mechanically simple, cheap and compact
design.
The stators were cooled with approximately 35 litres a minute of untreated water, which
flows radially against its back surface. To stop interference with the torque measurement
the coolant enters and exits the rig axially and hence does not contribute to the measured
torque. The torque was measured directly by mounting the whole system freely on a pair of
gimble bearings. A lever arm connected to the free-floating components is reacted against a
load transducer and this gives the torque produced by the turbine (minus the resistance
torque of the gimble bearings).
3.2 Active control turbocharger
3.2.1 Design
The main ACT components can be seen in Fig. 4 and 5. A nozzleless Holset H3B
turbocharger turbine was modified to accept a nozzle for VGT testing. Due to the very
small space available a very thin (1.5mm thickness) section, tubular form, sliding nozzle
was designed. Two embedded attachment points towards the back end (away from the
volute) are used to mount the nozzle on to its actuating arm (yoke) via two small bearing
pads, which fit between the nozzle and the actuator arm and assist in translating the
pivoting movement of the yoke into a linear motion by the nozzle. The nozzle itself is
guided towards the throat by an inner guide, which serves both as a bearing surface to the
nozzle as well as the exducer section of the turbine. An outer guide houses the entire
assembly and at its lower end is shaped into a bracket on which the yoke is attached and
can freely pivot about. The entire assembly is held together and attached to the face of the
turbine by six long M5 bolts. The throat width to the turbine is 26mm wide and the nozzle
can block approximately 22mm off that passage width before reaching the stops.
The materials used for the assembly were 6082-T6 aluminium alloy, for the entire
assembly except for the nozzle, providing light weight, with adequate strength to
overcome (in the case of the yoke) fatigue, which was the major issue in its operation. At
the most severe operation the yoke achieved a safety factor of 10 with respect to the
maximum bending stress applied to it at its corners by the bearing pads. The nozzle was
of CFRP construction, providing adequate strength against the high pressure air flow used
during testing for ultra low weight - low nozzle weight being critical for the whole ACT
in achieving good force performance.
A V406 electrodynamic shaker was used to drive the nozzle in ACT mode. The shaker
was chosen so as to be able to provide the required force for the frequencies and
amplitudes expected during testing (60Hz and 20mm, respectively). Direct coupling of the
shaker and nozzle was not possible due to the nozzle being driven from the exhaust side
of turbine, thus forcing the shaker to be offset to the side of the exducer. The simplest way
to drive the nozzle from this position was with a single-piece, pivoting fork-type actuator
arm. This makes the design, simpler, more compact and more importantly allows for far
better fatigue endurance with the added advantage of significant vibration damping due to
the rocker-arm type operation of the yoke used to drive the nozzle, which largely damps
out what would otherwise have been severe vibrations through the turbocharger. The total
mass of all moving parts (Part Nos. 2, 3, 4, 8 and 9 in Fig.4(a)) is only 0.241kg, which
was important in order to be able to achieve the force performance required for testing,
even though it means a penalty in terms of vibration, since at present it is not possible to
balance both sides of the yoke, as the top part (nozzle) is significantly lighter to the
bottom part that also contains approximately 0.2kg of the moving part of the shaker.
3.2.2 Operation
The electrodynamic shaker is connected to the lower part of the yoke through an
adjustable lever (Fig.5) used to set the nozzle restriction ( VGT ) in VGT mode or the null
point ( null ) in ACT mode. The amplitude, frequency and form of the controlling signal is
controlled by a function waveform generator, which sends it to a 100W amplifier as well
as to the controlling computer. From the amplifier the signal is routed to the shaker and
transformed into motion of the nozzle. Two high speed pressure transducers one
immediately downstream of the pulse generator and one immediately upstream on the
turbine inlet are used to measure the inlet pressure level 1P . By timing the two pressure
signals as they arrive at the high speed data acquisition board the time delay measured is
used to trigger the shaker by triggering the waveform generator first. Thus, the shaker is
always in phase with the inlet pressure signal. An LVDT nozzle position transducer is
used for feedback (Fig.8(a)).
For VGT testing VGT can be set by adjusting the lever only. For ACT testing, null is
adjusted manually, while ACT and the shaker frequency are preset on the waveform
generator according to the test parameters required. Typical VGT test points used during
testing have included the following:
Table 2 – Nozzle VGT settings for the 26mm wide throat area
Nozzle
restriction into
throat (mm)
VGT
0 1
4 0.846
8 0.692
12 0.538
16 0.385
20 0.231
4 STEADY STATE TEST RESULTS
4.1 Dynamometer with fixed geometry turbocharger
The final dynamometer results are shown in Fig.6 (a) and (b) in the form of turbine
performance maps and correspond to an equivalent VGT setting of 1, i.e., a fully open
throat area, even though all tests were carried out on the original turbine volute, which is a
fixed geometry turbocharger. Only the 60% equivalent turbine speed data are shown. The
range previously available by using a compressor as the loading device typically lied
between a velocity ratio of 0.6 and 0.8. It can be seen that, the range of the data obtained
with the eddy current dynamometer has been increased by at least three fold, resulting in a
much more complete turbine map. Tests previously impossible to carry out, such as high
velocity ratio (i.e., very low power) tests, are now available. However, at the maximum
velocity ratios, careful and repeated testing is needed as the load cell torque offset error
becomes significant and observing the proper experimental technique in acquiring torque
data is paramount.
One of project goals, namely, expansion of the available turbine test range and particularly
very low power testing, through the development of a new dynamometer has been achieved
with the velocity ratio range now spanning a maximum of between 0.35 to 1.1 – this
maximum range being achieved at a turbine speed of 29400rpm.
4.2 Dynamometer with variable geometry turbocharger
The steady-state VGT results can be seen in Figures 6 and 7. Turbine map plots of
efficiency against velocity ratio and MFP versus ER are presented for the three constant
speed parameters (50%, 60% and 70% equivalent turbine speeds) however the plots focus
on 60%, at which maximum turbocharger efficiency has been reached. The 50% equivalent
turbine speed corresponds to approximately 29400rpm, while 70% to 41400rpm.
From the efficiency plots it immediately becomes apparent that there is a large efficiency
drop as the throat restriction increases. This was expected as with every VGT mechanism
disturbing the flow to the turbine, in the form of stagnating flow on the outside surface of
the sliding nozzle as well as increased turbulence off the sharp edged tip of the nozzle. It is
significant to notice that for relatively small restrictions (down to 0.692 or even 0.538) the
drop in efficiency is typically less than 10%, while it becomes significantly higher at larger
restrictions.
On the other hand, from the mass flow parameter against expansion ratio plots, it can be
seen that even though, the smaller restrictions do not suffer a significant drop in efficiency
they do not produce initially any appreciable increase in expansion ratio, whereas at
approximately the same restrictions where the efficiency drop becomes significant the
expansion ratio gain becomes more pronounced. Therefore, the effect that the throat
restriction has on expansion ratio increase becomes evident.
Unfortunately, due to project constraints it was not possible to match an optimal MFT-
oriented nozzle design to the present MFT. Instead, a straight nozzle was used with the
MFT rotor as opposed to a downwards inclined nozzle in the radial direction to follow the
MFT leading edge angle, thus resulting in interspace diffusion effects causing adverse
VGT performance, since the resulting triangular interspace between nozzle and rotor,
causes flow diffusion and therefore a decrease of the velocity component, C, hence less
actual energy recovered at the turbine itself.
5 ACTIVE FLOW CONTROL TURBOCHARGER
5.1 Numerical Simulation
The main aim of the numerical simulation was to demonstrate the ability of an ACT to
enhance the exhaust gas energy recovery in the turbine, by comparison to a conventional
VGT, since outside of the optimum engine/turbocharger matching point the energy
recovery suffers significantly.
A standard one dimensional matching calculation was used and is based on a procedure
described in literature (14). The main, general assumptions made in this model involve a
quasi-steady approach, a high response actuator, inlet and outlet velocities small enough
to neglect difference between static and total values of pressure and temperature and all
types of losses at the inlet and exhaust manifold have been neglected.
Due to the nature of the engine-turbocharger match (volume machine combined with a
speed machine) the cycle averaged power output of the turbocharger is less than what it
could be if the turbine inlet pressure level could be raised instantaneously to its peak
pressure instead of fluctuating substantially between atmospheric levels and its peak
value. The ideal case, therefore, is for an ACT turbocharger to virtually eliminate exhaust
gas pulsation at entry to the turbine so that the turbine inlet pressure at any instant of time
is equal to the peak pressure of an equivalent pulse in a standard VGT-equipped
turbocharger. This, however, is not possible due to limitations on maximum nozzle
displacement, efficiency drop and the fact that at the end of the pulse period the inlet
pressure levels are near atmospheric and therefore, it is not possible to increase the inlet
pressure significantly at this stage.
An example of the gain afforded by an ACT can be seen in Table 3, where a significant
increase in pressure and power levels can be seen by comparison to a conventional
turbocharger. It may, also, be observed that this power increase comes at the expense of
efficiency, which was expected but this did not have a very detrimental effect on the
power recovered.
Table 3 – Conventional turbocharger comparison with ACT performance (max.
nozzle restriction)
Parameter Cycle-
averaged
VGT data
Equivalent data
for ACT
Inlet pressure (bar) 1.584 1.93
Mass flow rate (kg/s) 0.2531 0.1538 - 0.3498
Turbine speed (rps) 685.9 694.2
Actual Power (W) 17859 26943
Isentropic Power (W) 24770 50471
5.2 Operating Schedule based on stead-state VGT test results
The ACT test phase will use initially, as a baseline the unsteady-state FGT results
although eventually the superiority over equivalent cycle, unsteady-state VGT power
results will need to proven.
The purpose of the steady-state VGT tests carried out, was to develop a realistic nozzle
ACT schedule (in terms of amplitude and null points) for different operating conditions
(turbine speed, dynamometer load and pulse generator frequency). From Fig.6(b) it may
be seen that on the initial steep gradient part of the MFP over ER curves, for a constant
MFP, (which is what quasi-steadily applies to an ACT nozzle, instantaneously) large
nozzle amplitudes are required to achieve modest inlet pressure gains. Above
approximately 1.4bar the slope becomes significantly flatter offering much larger gains in
terms of pressure. However, at the same time there is a corresponding decrease in
efficiency (Fig.6(a)). It is:
]1[
1
4
3
3,
exh
exh
P
PTCpmW exhtist
and isttactt WnW ,,
In the effort to recover more energy out of the exhaust gases, increasing the pressure drop
across the turbine is one way of achieving this aim provided, however, the resultant
efficiency drop can be held within tolerable limits. Therefore, the disparity between the
FGT efficiency and the efficiency at any intermediate nozzle position ( st ) needs to be
minimised. From Fig.6(a), minimum efficiency difference occurs only at the ends of the
velocity ratio range as at between 0.6 to 0.7 the FGT efficiency reaches its peak, whereas
the VGT efficiencies exhibit a flatter curves thus increasing the disparity at the FGT peak
efficiency velocity ratio range.
In Fig.7 it may be seen that only at the higher loads and in any case only at significant
throat area restrictions (below 50% open for the higher loads) does energy become
available for increased recovery. At very low powers (10mm, 7mm and even 5mm
dynamometer gaps) a high percentage of energy may be recovered but it is overall too
small in quantity when compared to the peak energy levels available at other parts of the
pulse. At 5mm gap, some energy may be recovered but in any case at low powers a throat
area of 25% open or less is required for any sort of appreciable effect.
In addition ACT operation is also limited by the frequency of the generated pulse. In
Fig.8(b) it may be seen that due to actuator dynamic performance the maximum
amplitudes are available, only at the lower frequencies (below 30Hz). It, therefore,
becomes apparent that the most beneficial area for ACT energy extraction is at inlet
pressures above 1.4bar and at velocity ratios higher than 0.6 (or at very low velocity
ratios) and at frequencies of less than 30Hz.
A final implication of the present setup is connected to the control schedule that ACT
operates on and in particular, the phasing between the different hardware components and
the impact this has on performance. At present, the assumption is made that the pressure
peaks between an FGT (or VGT) pulse and the ACT pressure trace form need to be in-
phase. Fig.8(a) shows with solid lines the pressure at the pulse generator located way
upstream of the turbine and the pressure at the turbine inlet. The function waveform
generator is activated by the pulse generator pressure and the final waveform is the LVDT
nozzle position trace. For simplicity the FWG provides a sinewave to the shaker as the
controlling signal. A typical pressure waveform is not a sinewave but was considered
similar enough to a sinewave in order for the latter to be selected as the controlling
waveform. The location of a second pressure peak at near the end of the pressure pulse is
encouraging as it means more energy may be recovered throughout the pulse period rather
than at only the higher pressure regions of the pulse.
6 CONCLUSION
The aims of the present work were threefold: to prove the new eddy-current dynamometer,
to demonstrate the performance of an MFT with a VGT device and highlight the
difficulties of matching the two and to present the novel ACT concept and demonstrate its
theoretical potential along with early experimental work aiming at optimising the ACT
operating schedule.
The new dynamometer has proved successful in obtaining experimentally for the first time,
near complete turbine performance maps for engine simulation codes and for CFD
validation purposes.
Some initial conclusions could be drawn from applying a VGT operation to a nozzleless
FGT equipped with an MFT rotor, in that large throat restrictions are required for
appreciable gains in ER but also with significant efficiency losses too. The latter are part of
the non optimal design match between the straight nozzle and the inclined MFT leading
edge causing interspace losses.
In terms of employing the turbocharger for ACT operation, there does seem to be potential,
however, it is hampered by high losses and therefore the energy recovery is not as high as
theoretically possible. By focusing at certain parts of the operating envelope (low pulse
frequency operation, operation at low or very high powers and large area restrictions) the
potential of the present ACT may be demonstrated.
7 ACKNOWLEDGEMENTS
The authors would wish to thank the Engineering and Physical Sciences Research Council
(E.P.S.R.C) for their financial support, Holset Engineering for their technical support, in
particular that provided by N. Sharp, and N. Karamanis for the experimental data.
8 REFERENCES
1. Hakeem, I., 1995, “Steady and unsteady performance of mixed flow turbines
for automotive turbochargers”, Ph.D. Thesis, Imperial College of Science,
Technology and Medicine, London, England.
2. Palfreyman, D., and Martinez-Botas, R. F., “Numerical study of the internal
flow field characteristics in mixed flow turbines”, Proceedings of ASME
TURBO EXPO 2002, ASME GT 2002-30372, 2002.
3. Palfreyman, D., and Martinez-Botas, R. F., “The pulsating flow field in a mixed
flow turbine: An experimental and computational study”, Proceedings of
ASME TURBO EXPO 2004, ASME GT 2004-53143, 2004.
4. Baines, N.C., Wallace, F.J. and Whitfield, A. “Computer Aided Design of
Mixed-Flow Turbines for Turbochargers”, Transc. ASME, Vol 101, July 1979,
p.p. 440-449
5. Abidat, M., Chen, H., Baines, N.C., “Design of a Highly Loaded Mixed Flow
Turbine”, Proc. Instn. Mech. Engrs., Vol 206, 1992.
6. Arcoumanis, C., Hakeem, I., Khezzar, L. and Martinez-Botas, R.F. “Performance
of a Mixed Flow Turbocharger Turbine Under Pulsating Flow Conditions”, ASME 95-GT-210, 1995
7. Karamanis, N., Martinez-Botas, R.F. “Mixed-Flow Turbines for Automotive
Turbochargers : Steady and unsteady Performance” Int. J. Engine Research
Vol 3, No.3, IMechE 2002.
8. Yamaguchi, H., Nishiyama, T., Horiai, K. and Kasuya, T. “High Performance
Komatsu KTR150 Turbocharger”, SAE Paper 840019, 1984
9. Ikeya, N., Yamaguchi, H., Mitsubori, K. and Kondoh, N. “Development of
Advanced Model of Turbochargher for Automotive Engines”, SAE Paper
920047, 1992
10. Tsujita, M., Niino, S., Isizuka, T., Kakinai, A. and Sato, A. “Advanced Fuel
Economy in Hino New P11C Turbocharged and Charge-Cooled Heavy Duty
Diesel Engine”, SAE Paper 930272, 1993
11. Minegashi, H., Matsushita, H. and Sakakida, M., “Development of a Small
Mixed-Flow Turbine for Automotive Turbochargers”, ASME 95-GT-53, 1995.
12. Rodgers, C., “Review of Mixed Flow And Radial Turbine Options”, AIAA
Paper 90-2414, 1990
13. Baines, N.C., “Radial and Mixed Flow Turbines Options for High Boost
Turbocharger”, 7th
Int. Conference on Turbocharger and Turbocharging, 2002.
14. Watson, N., and Janota, M.S., “Turbocharging the Internal Combustion
Engine,” Wiley Interscience, New York, 1982
15. Flaxington, D., and Szuzupak, D. T., “Variable area radial-inflow turbine”, 2nd
Int. Conf. on Turbocharging and Turbochargers, Proc. of the IMechE, Paper
C36/82, 1982
16. Franklin, P. C., and Walsham, B. E., “Variable geometry turbochargers in the
field”, 3rd
Int. Conf. on Turbocharging and Turbochargers, Proc. of the IMechE,
paper C121/86, pp. 241-250, 1986
17. Kawaguchi, J., Adachi, K., Kono, S. and Kawakami, T., ‘Development of VFT
(Variable Flow Turbocharger),’ SAE Paper 1999-01-1242, 1999
18. Capobianco, M. and Gambarotta, A., “Variable Geometry and Waste-Gated
Automotive Turbochargers: Measurements and Comparison of Turbine
Perforamance,” J. of Eng. For Gas Turbines and Power, Vol 114, p.p. 553-560,
July 1992
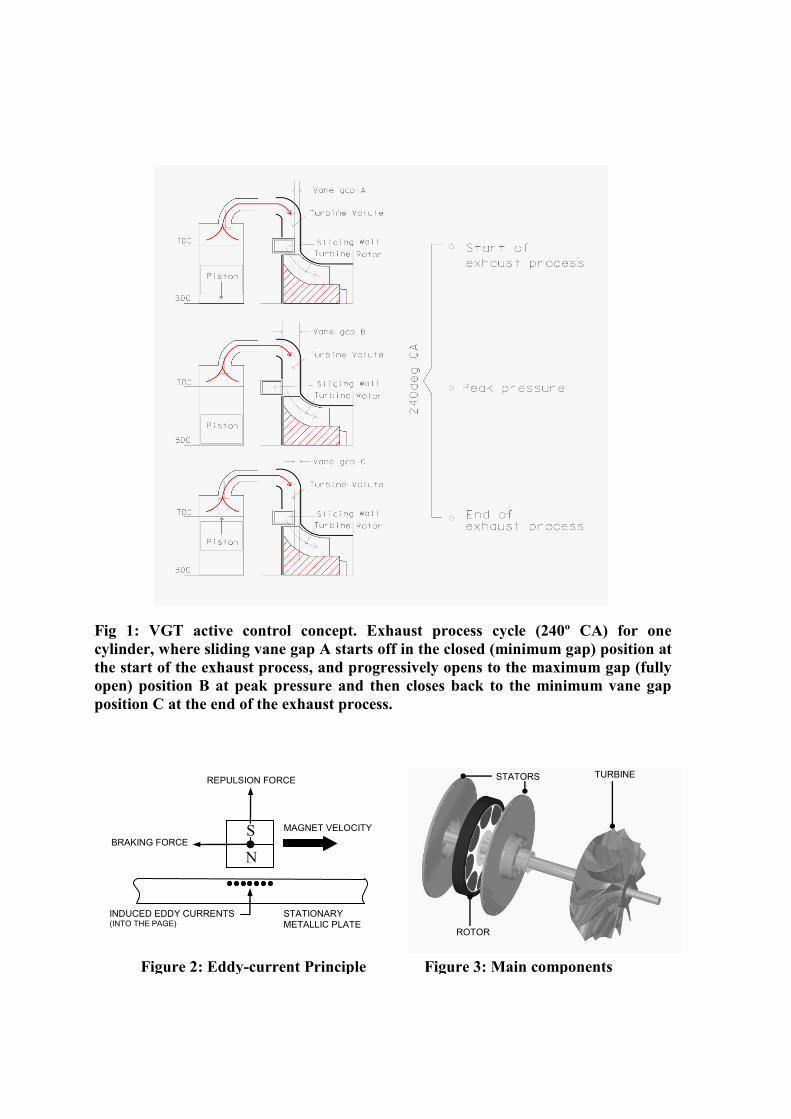
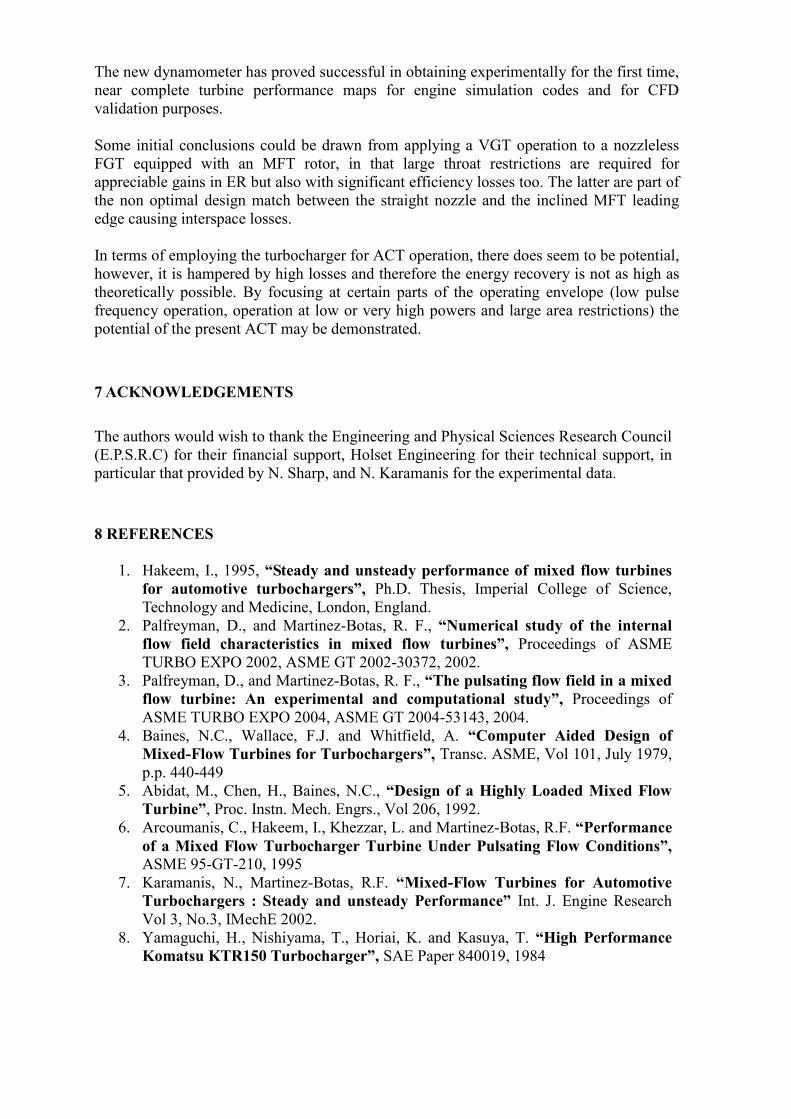
Fig 1: VGT active control concept. Exhaust process cycle (240º CA) for one
cylinder, where sliding vane gap A starts off in the closed (minimum gap) position at
the start of the exhaust process, and progressively opens to the maximum gap (fully
open) position B at peak pressure and then closes back to the minimum vane gap
position C at the end of the exhaust process.
TURBINE STATORS
ROTOR
MAGNET VELOCITY
N
S BRAKING FORCE
INDUCED EDDY CURRENTS (INTO THE PAGE)
STATIONARY METALLIC PLATE
REPULSION FORCE
Figure 2: Eddy-current Principle iple
Figure 3: Main components
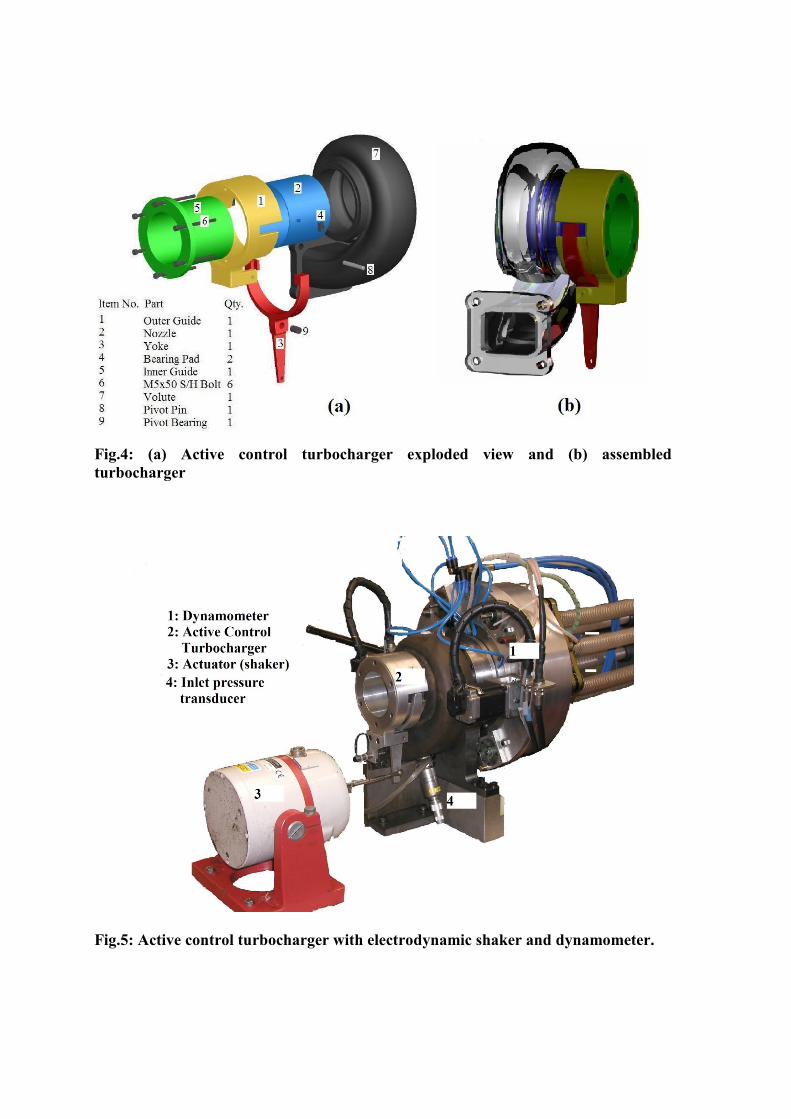
Fig.4: (a) Active control turbocharger exploded view and (b) assembled
turbocharger
Fig.5: Active control turbocharger with electrodynamic shaker and dynamometer.
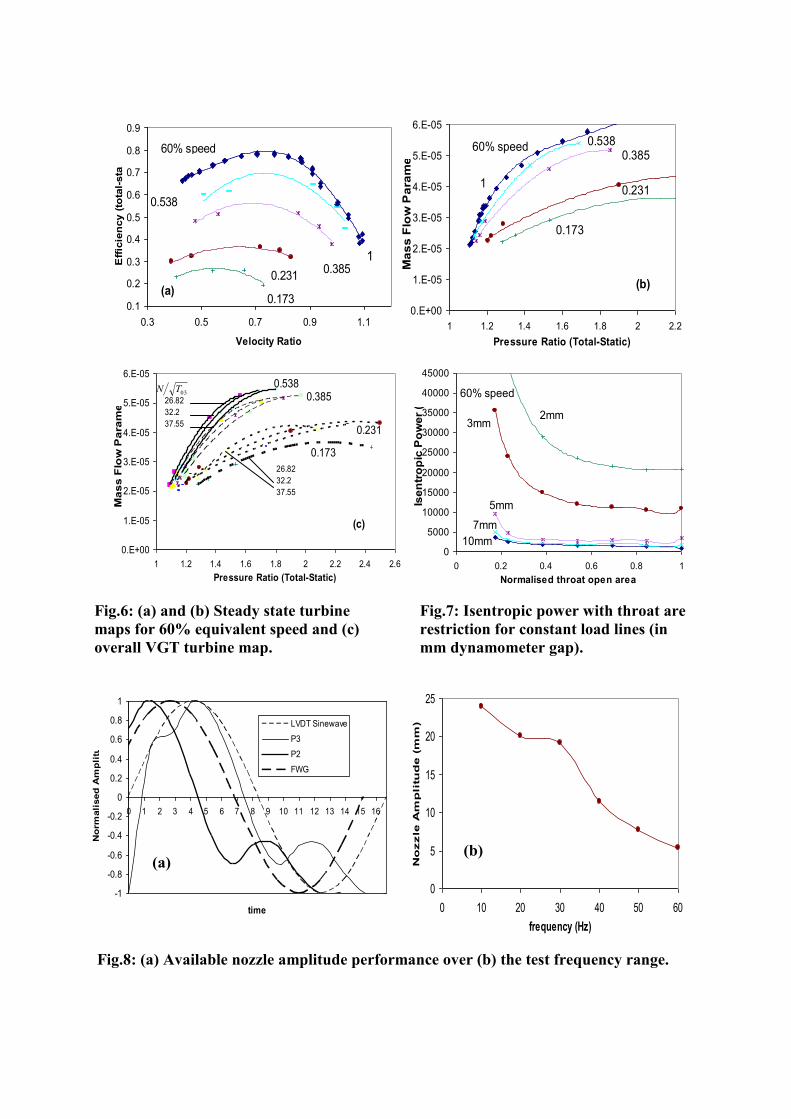
Fig.6: (a) and (b) Steady state turbine
maps for 60% equivalent speed and (c)
overall VGT turbine map.
Fig.7: Isentropic power with throat are
restriction for constant load lines (in
mm dynamometer gap).
Fig.8: (a) Available nozzle amplitude performance over (b) the test frequency range.
0.1
0.2
0.3
0.4
0.5
0.6
0.7
0.8
0.9
0.3 0.5 0.7 0.9 1.1
Velocity Ratio
Eff
icie
ncy (
tota
l-sta
tic)
1
0.538
0.3850.231
60% speed
(a)0.173
0.E+00
1.E-05
2.E-05
3.E-05
4.E-05
5.E-05
6.E-05
1 1.2 1.4 1.6 1.8 2 2.2
Pressure Ratio (Total-Static)
Ma
ss
Flo
w P
ara
me
ter 60% speed
1
0.385
0.231
(b)
0.173
0.538
-1
-0.8
-0.6
-0.4
-0.2
0
0.2
0.4
0.6
0.8
1
0 1 2 3 4 5 6 7 8 9 10 11 12 13 14 15 16
time
No
rmali
sed
Am
pli
tud
e
LVDT Sinewave
P3
P2
FWG
0
5
10
15
20
25
0 10 20 30 40 50 60
frequency (Hz)
No
zzle
Am
pli
tud
e (
mm
)
0
5000
10000
15000
20000
25000
30000
35000
40000
45000
0 0.2 0.4 0.6 0.8 1
Normalised throat open area
Ise
ntr
op
ic P
ow
er
(W) 60% speed
2mm
5mm
7mm
10mm
3mm
0.E+00
1.E-05
2.E-05
3.E-05
4.E-05
5.E-05
6.E-05
1 1.2 1.4 1.6 1.8 2 2.2 2.4 2.6
Pressure Ratio (Total-Static)
Ma
ss
Flo
w P
ara
me
ter
0.385
0.231
(c)
0.173
0.538
26.82
32.2
37.55
26.82
32.2
37.55
03TN
(b) (a)


