International Journal of Research and Development (IJRD), ISSN 1596-969 Volume 2 No 1, Nov 2015 Faculty of Education, Adekunle Ajasin University, Akungba-Akoko, Ondo State, Nigeria. Available online at http://www.aauaeducationfac.org
254
Development and Validation of a Two-Tier Multiple Choice Diagnostic Instrument for Assessing Senior Secondary School Students’ Conceptions
of Selected Mathematical Concepts
Idehen, F.O. and Omoifo, C.N. Department of Curriculum and Instructional Technology, Faculty of Education,
University of Benin,
Abstract The study developed and validated a two – tier multiple-choice diagnostic instrument for assessing Students’ Conceptions of Mathematics Ideas (SCMI). The SCMI was a 30-item instrument specifically designed to identify right conceptions and misconceptions in limited and clearly defined basic concepts in Number and Numeration, Algebra, Measurement, Geometry and Statistics of the Senior Secondary School Mathematics Curriculum. Four research questions guided the study. The sample of the study consisted of 87 male and female students from three senior secondary schools in Oredo Local Government Area of Edo State, Nigeria. Analysis of the students’ response showed a difficulty index ranging from 30 to 70 percent and a discriminating index of between 0.3 and 0.6, and Kuder Richardson formular 20 reliability coefficient of 0.85. The results further shows that at least 50 percent of the students had right conceptions in 12 out of the 30 items. The SCMI instrument diagnosed 29 significant misconceptions in 21 of the items. It is recommended that two-tier instrument should be used to elicit students’ right conceptions and to diagnose their misconceptions.
Introduction
In Nigeria, different mathematics curricula have been developed to cater for the needs and
interest of the various categories of pupils/students in the primary and secondary school
levels of education (Federal Ministry of Education, 1979a, 1979b, 1979c, 2007a, 2007b,
2007c). Unfortunately, these curriculum innovations have not yielded the much expected
improvement in school mathematics learning in terms of students’ knowledge of the basic
concepts and their overall achievement in the subject. Students’ performance in the subject
at both internal and external examinations has not been encouraging (Adedayo, 2004, as
cited in Charles – Ogan, 2014). Analyzing the performances of the students in WASSCE
Mathematics for the years 1991 – 2012, Charles-Organ (2014) reported dismal
performances of the students in the overall twenty-two years period, with failure rate of
over 80% for 11 out of 22 years’ result considered. The analysis revealed further that in 20
out of the 22 years result had below 50% of students who had credit pass in the subject.
International Journal of Research and Development (IJRD), ISSN 1596-969 Volume 2 No 1, Nov 2015 Faculty of Education, Adekunle Ajasin University, Akungba-Akoko, Ondo State, Nigeria. Available online at http://www.aauaeducationfac.org
255
These results show that the failure rate of students in mathematics is very high. Thus,
students, teachers, parents/guardian and the public perceived mathematics as a difficult,
abstract and complex subject to study (Harbor-Peters, 2001; Obodo, 2004). These
conceptions must have led to the general hatred for mathematics as a subject which in turn
has led to the general poor performance of students in mathematics in schools.
Studies and reports (WAEC, 2004a; WAEC, 2004b; WAEC, 2007; Galadima & Yushai, 2007)
have revealed that candidates weaknesses were traceable to lack of or shallow knowledge
of basic concepts, principles and appropriate application of laws and formulae in solving
mathematics problem. These weaknesses must have resulted due to students’ lack of
understanding of basic mathematical concepts which form the basis for solving
mathematics problems. While achievement test, which measures students’ right or wrong
answers, have been used over the years to assess students’ level of performance in
mathematics and to diagnose their learning difficulties, some believed assessing students
and teachers’ conceptions of mathematics would go a long way in helping to understand
students’ problem in learning mathematics in schools (Ivowi, 1988, as cited in Akpan,
1999; Abayomi & Arigbabu, 2007; Nurudeen, 2007; Charles-Organ, 2014). According to
Duit and Treagust (1988), the purposes of such researches on students’ conceptions in
science and mathematics, are to help develop curriculum materials that will enable
students to learn effectively and to develop methods that are in line with two pathways of
learning – the continuous and discontinuous pathways. When the conceptions of students
are identified, efforts are made either to guide the learning of the students continuously
with the existing conceptions or to discontinue the pathway if it in contradiction with the
existing conceptions.
This study is anchored on the constructivist theory that clearly identified individual and
social factors as guide for the conceptions held by students. Constructivist theory states
that knowledge is personally constructed (Ausubel, 1968; Piaget, 1978), but socially
mediated (Vygotsky, 1978, as cited in Cakir, 2008). Knowledge is actively constructed by
International Journal of Research and Development (IJRD), ISSN 1596-969 Volume 2 No 1, Nov 2015 Faculty of Education, Adekunle Ajasin University, Akungba-Akoko, Ondo State, Nigeria. Available online at http://www.aauaeducationfac.org
256
the learners through interaction with the physical and social environments and through the
recognition of their mental structures (Sharwood, Pertrosio, Lin & Cognition and
Technology Group in Vanderbilt, 1988). Therefore, all knowledge is constructed by
maintaining a balance between applying previous knowledge (Preconceptions) and
changing behaviour to account for the new knowledge (conceptions) in mathematics.
Conceptions of mathematics are the knowledge conceived and provided by students that
come as explanation and support for mathematics ideas or concepts (Idehen, 2011).
Assessment of students’ conceptions of mathematics could either focus on the quantitative
increase in the amount of knowledge they have or a change understanding of the concepts.
Methods used to determine students’ understanding or conceptions of mathematics
concepts include concept mapping, interviews and multiple-choice diagnostic instruments
(Treagust, 1995, as cited in Tan, Taber, Goh and Chia, 2005). However, Chen and Lin (n.d)
argued that the common method for assessing students’ conceptions (which include
misconceptions or alternative conceptions) using interview or open ended questionnaires
required too many investigators and which involve a large amount of time to carry out the
interview with so many students. A straight forward method to overcome these difficulties
would be to administer a pencil and paper multiple-choice test. Tamir (1971, as cited in
Chandrasegran, Treagust & Mocerio, 2007) had proposed the use of multiple choice test
items that include responses with known students alternative conceptions
(misconceptions), and that also required students to justify their choice of option by giving
a reason. This is a diagnostic test constructed to reveal weakness of students in their
conceptions of mathematical concepts that help to locate areas and sources of difficulties
from which constructive actions can be taken. This study sought to develop and validate
such test instrument for assessing students’ conceptions of some basic mathematical
concepts in senior secondary school curriculum.
Purpose of the Study
International Journal of Research and Development (IJRD), ISSN 1596-969 Volume 2 No 1, Nov 2015 Faculty of Education, Adekunle Ajasin University, Akungba-Akoko, Ondo State, Nigeria. Available online at http://www.aauaeducationfac.org
257
The purpose of the study was to develop and validate a two-tier diagnostic
instrument for assessing Senior Secondary School Students’ Conceptions of Mathematical
Ideas (SCMI). The specific purposes of the study are to ascertain the validity of the items of
the SCMI, establish the reliability of the SCMI, elicit students’ right conceptions and to
diagnose students’ significant misconceptions.
Research Questions
The following research questions were raised to guide the study:
What is the validity of the SCMI?
What is the reliability of the SCMI?
What percentage of students holds the right conceptions of the mathematics
concepts under study?
What are the significant misconceptions held by students in the mathematics
concepts under study?
Research Method
Based on the procedure described by Treagust (1985) and used by Tan, Taber, Goh and
Chia (2005), and Omoifo and Irogbele (2007), a two-tier multiple choice diagnostic
instrument was developed to measure students’ right answers, right reasons and right
conceptions. The two-tier multiple choice diagnostic instrument were developed in three
phases. The first involved the researcher defining the content framework as contained in
the National Senior Secondary School Mathematics Curricula on some basic mathematics
concepts. In the second phase, a list of 50 propositional knowledge statements based on the
curriculum consisting of questions, answers and reasons were reviewed by three
mathematics educators and two test and measurement experts. The reviewers agreed that
the prepositional knowledge statements met the requirement of the Senior Secondary
Mathematics Curriculum on basic mathematics concepts across five content areas (Number
and Numeration, Algebra, Measurement, Geometry and Statistics). Their scrutiny
introduced some revisions and changes in the original SCMI.
International Journal of Research and Development (IJRD), ISSN 1596-969 Volume 2 No 1, Nov 2015 Faculty of Education, Adekunle Ajasin University, Akungba-Akoko, Ondo State, Nigeria. Available online at http://www.aauaeducationfac.org
258
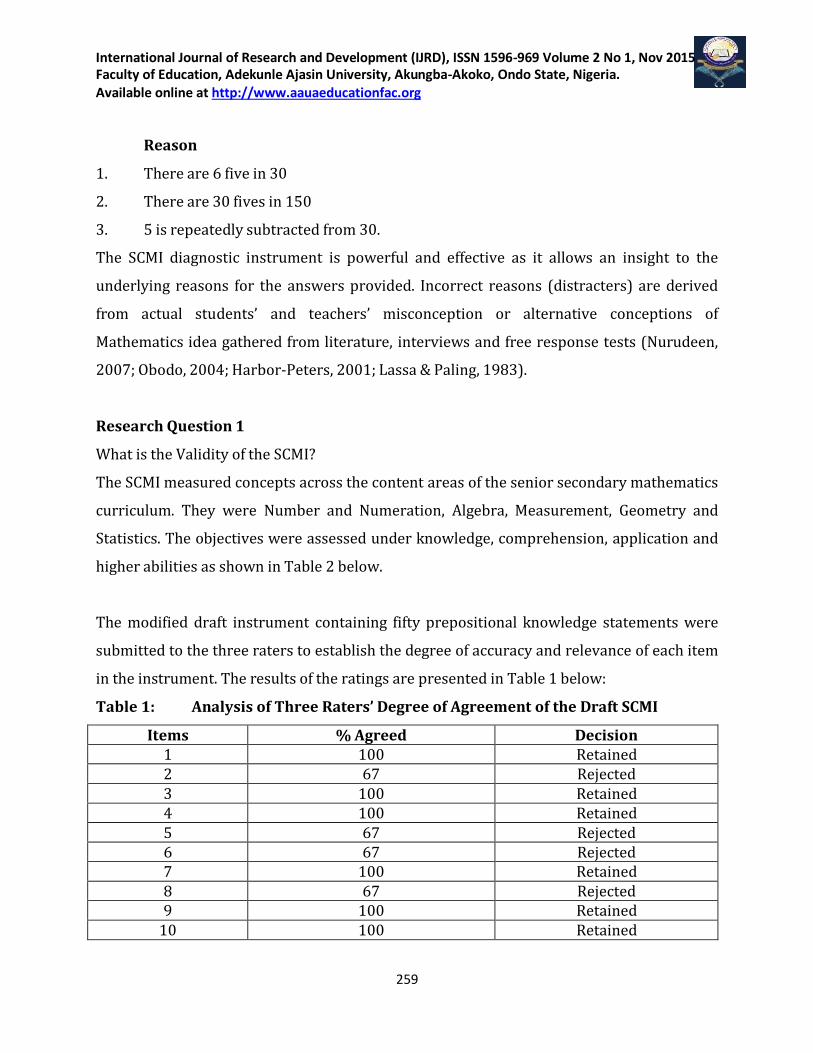
Phase three were carried out by submitting the modified draft instrument to three
raters; one Secondary School Mathematics teacher, one college of Education Mathematics
lecturer and one University Mathematics lecturer to establish the degree of accuracy and
relevance of each item on the instrument. Items with 100 percent of the raters agreement
were retained while items with disagreement were discarded (Table 1). Finally, thirty
items (six items each for the five content areas) were retained for the final SCMI which
were administered for the study.
The final thirty items document is a two-tier multiple choice instrument which is different
from the common objective test. Whereas the objective type is a type in which the
examinee selects answer from answer choices supplied by the examiner, more than this the
two-tier multiple choice instrument used in this study is a type in which the examinee
selects the answer and the reason for the answer. The objectives test instrument therefore
produced either the right or wrong answer, while the two-tier multiple-choice instrument
would produce, more than the right or wrong answer, the reason for the choice made,
which would help elicit the right conception or diagnose the misconception held by the
students in each of the concepts under study.
The Instrument
The SCMI instrument consisted of sections A and B. Section A sought background
information on the students: school location, school type, students’ sex, and school mode.
Section B contains items with three sub-scale designed to check students’ conceptions
(right conceptions and misconceptions) from limited and clearly defined contents areas.
Section B is further divided into three parts; question, answer and reason. Below is an
example of item on the SCMI:
Question
Find the value of 30/5
Answer
(a) 5 (b) 6 (c) 150
International Journal of Research and Development (IJRD), ISSN 1596-969 Volume 2 No 1, Nov 2015 Faculty of Education, Adekunle Ajasin University, Akungba-Akoko, Ondo State, Nigeria. Available online at http://www.aauaeducationfac.org
259
Reason
1. There are 6 five in 30
2. There are 30 fives in 150
3. 5 is repeatedly subtracted from 30.
The SCMI diagnostic instrument is powerful and effective as it allows an insight to the
underlying reasons for the answers provided. Incorrect reasons (distracters) are derived
from actual students’ and teachers’ misconception or alternative conceptions of
Mathematics idea gathered from literature, interviews and free response tests (Nurudeen,
2007; Obodo, 2004; Harbor-Peters, 2001; Lassa & Paling, 1983).
Research Question 1
What is the Validity of the SCMI?
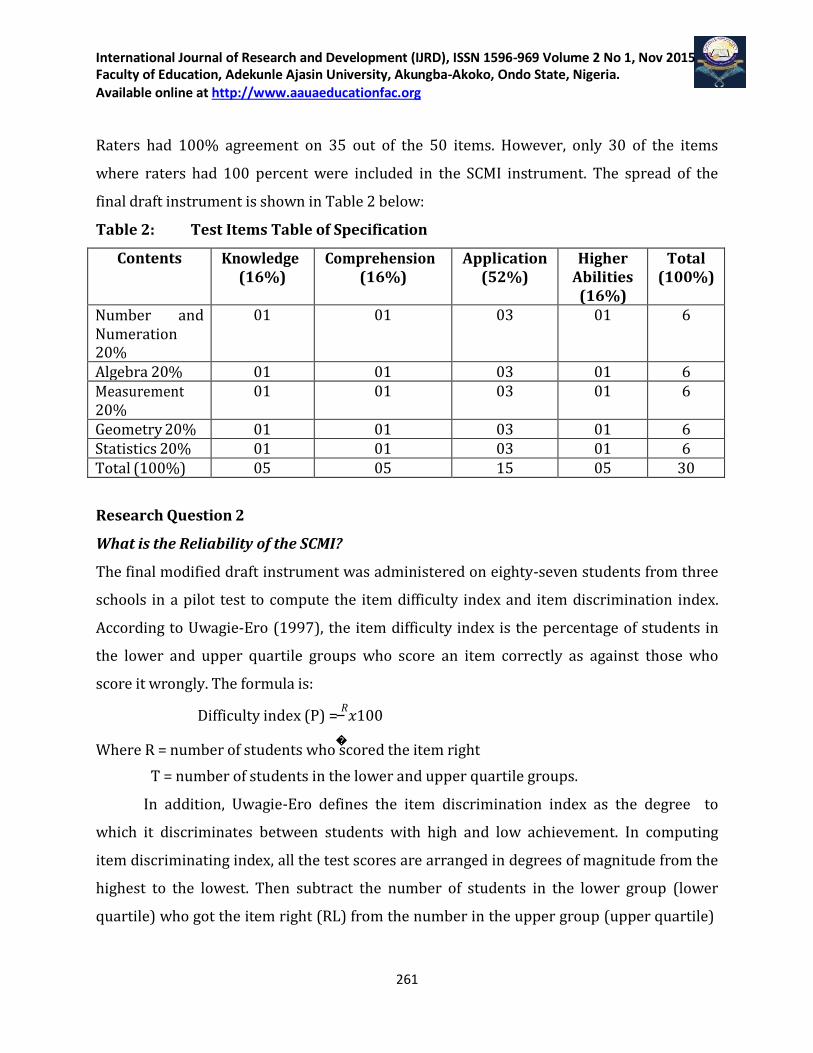
The SCMI measured concepts across the content areas of the senior secondary mathematics
curriculum. They were Number and Numeration, Algebra, Measurement, Geometry and
Statistics. The objectives were assessed under knowledge, comprehension, application and
higher abilities as shown in Table 2 below.
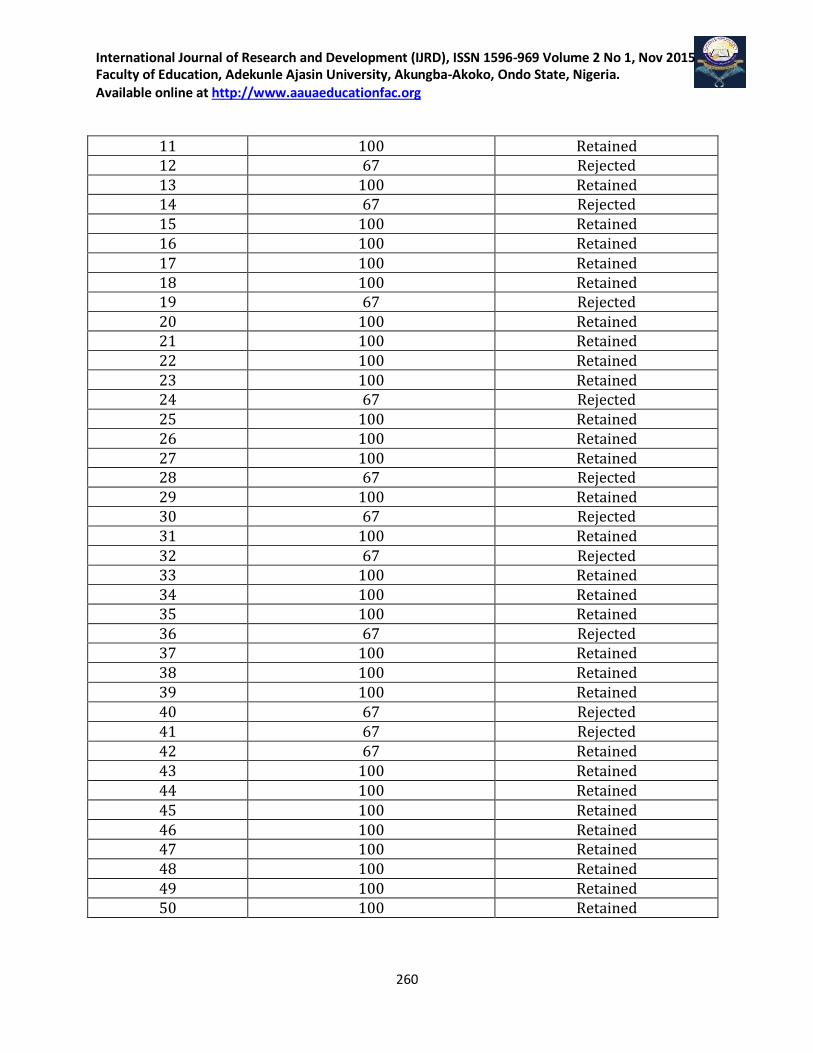
The modified draft instrument containing fifty prepositional knowledge statements were
submitted to the three raters to establish the degree of accuracy and relevance of each item
in the instrument. The results of the ratings are presented in Table 1 below:
Table 1: Analysis of Three Raters’ Degree of Agreement of the Draft SCMI
Items % Agreed Decision 1 100 Retained 2 67 Rejected 3 100 Retained 4 100 Retained 5 67 Rejected 6 67 Rejected 7 100 Retained 8 67 Rejected 9 100 Retained
10 100 Retained
International Journal of Research and Development (IJRD), ISSN 1596-969 Volume 2 No 1, Nov 2015 Faculty of Education, Adekunle Ajasin University, Akungba-Akoko, Ondo State, Nigeria. Available online at http://www.aauaeducationfac.org
260
11 100 Retained 12 67 Rejected 13 100 Retained 14 67 Rejected 15 100 Retained 16 100 Retained 17 100 Retained 18 100 Retained 19 67 Rejected 20 100 Retained 21 100 Retained 22 100 Retained 23 100 Retained 24 67 Rejected 25 100 Retained 26 100 Retained 27 100 Retained 28 67 Rejected 29 100 Retained 30 67 Rejected 31 100 Retained 32 67 Rejected 33 100 Retained 34 100 Retained 35 100 Retained 36 67 Rejected 37 100 Retained 38 100 Retained 39 100 Retained 40 67 Rejected 41 67 Rejected 42 67 Retained 43 100 Retained 44 100 Retained 45 100 Retained 46 100 Retained 47 100 Retained 48 100 Retained 49 100 Retained 50 100 Retained
International Journal of Research and Development (IJRD), ISSN 1596-969 Volume 2 No 1, Nov 2015 Faculty of Education, Adekunle Ajasin University, Akungba-Akoko, Ondo State, Nigeria. Available online at http://www.aauaeducationfac.org
261
Raters had 100% agreement on 35 out of the 50 items. However, only 30 of the items
where raters had 100 percent were included in the SCMI instrument. The spread of the
final draft instrument is shown in Table 2 below:
Table 2: Test Items Table of Specification
Contents Knowledge (16%)
Comprehension (16%)
Application (52%)
Higher Abilities (16%)
Total (100%)
Number and Numeration 20%
01 01 03 01 6
Algebra 20% 01 01 03 01 6 Measurement 20%
01 01 03 01 6
Geometry 20% 01 01 03 01 6 Statistics 20% 01 01 03 01 6 Total (100%) 05 05 15 05 30
Research Question 2
What is the Reliability of the SCMI?
The final modified draft instrument was administered on eighty-seven students from three
schools in a pilot test to compute the item difficulty index and item discrimination index.
According to Uwagie-Ero (1997), the item difficulty index is the percentage of students in
the lower and upper quartile groups who score an item correctly as against those who
score it wrongly. The formula is:
Difficulty index (P) = 𝑅𝑥100
� Where R = number of students who scored the item right
T = number of students in the lower and upper quartile groups.
In addition, Uwagie-Ero defines the item discrimination index as the degree to
which it discriminates between students with high and low achievement. In computing
item discriminating index, all the test scores are arranged in degrees of magnitude from the
highest to the lowest. Then subtract the number of students in the lower group (lower
quartile) who got the item right (RL) from the number in the upper group (upper quartile)
International Journal of Research and Development (IJRD), ISSN 1596-969 Volume 2 No 1, Nov 2015 Faculty of Education, Adekunle Ajasin University, Akungba-Akoko, Ondo State, Nigeria. Available online at http://www.aauaeducationfac.org
262
who got the item right (RU) and divide by one-half of the total number of students in the
item analysis (1 𝑇.)
2 The formula is:
Discriminating index (D) = 𝑅�−𝑅�
1/2� The discriminating index range from 0.0 to 1.0
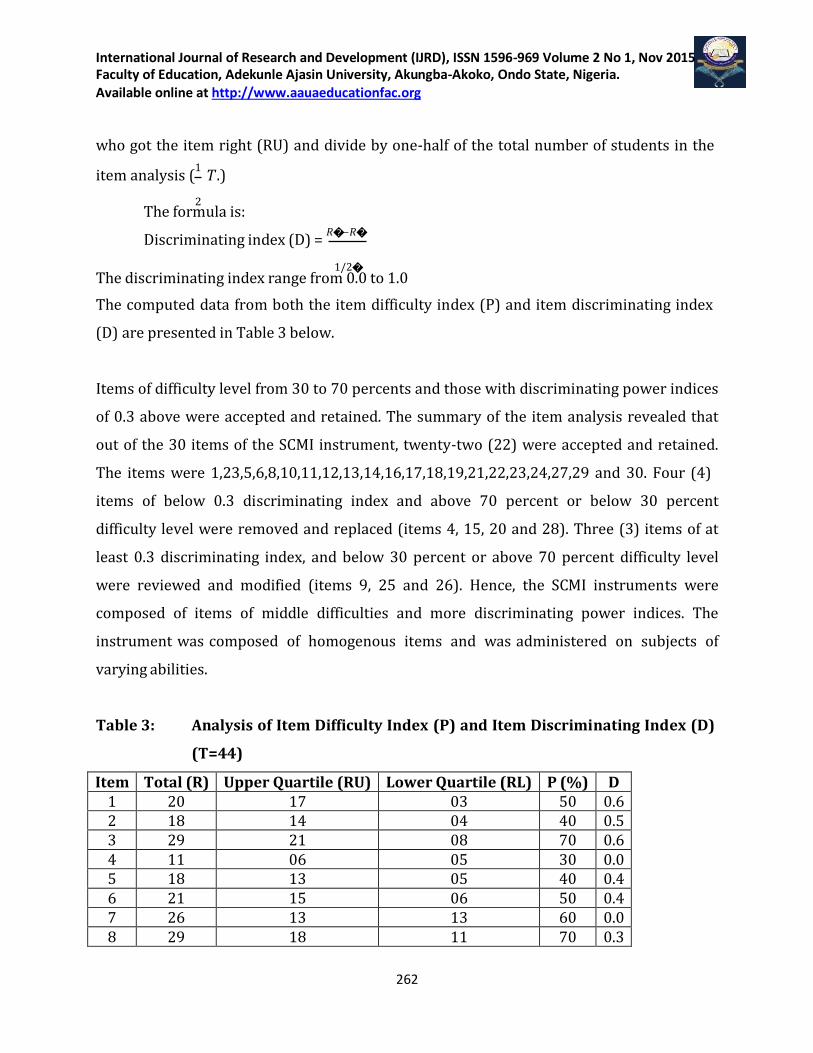
The computed data from both the item difficulty index (P) and item discriminating index
(D) are presented in Table 3 below.
Items of difficulty level from 30 to 70 percents and those with discriminating power indices
of 0.3 above were accepted and retained. The summary of the item analysis revealed that
out of the 30 items of the SCMI instrument, twenty-two (22) were accepted and retained.
The items were 1,23,5,6,8,10,11,12,13,14,16,17,18,19,21,22,23,24,27,29 and 30. Four (4)
items of below 0.3 discriminating index and above 70 percent or below 30 percent
difficulty level were removed and replaced (items 4, 15, 20 and 28). Three (3) items of at
least 0.3 discriminating index, and below 30 percent or above 70 percent difficulty level
were reviewed and modified (items 9, 25 and 26). Hence, the SCMI instruments were
composed of items of middle difficulties and more discriminating power indices. The
instrument was composed of homogenous items and was administered on subjects of
varying abilities.
Table 3: Analysis of Item Difficulty Index (P) and Item Discriminating Index (D)
(T=44)
Item Total (R) Upper Quartile (RU) Lower Quartile (RL) P (%) D 1 20 17 03 50 0.6 2 18 14 04 40 0.5 3 29 21 08 70 0.6 4 11 06 05 30 0.0 5 18 13 05 40 0.4 6 21 15 06 50 0.4 7 26 13 13 60 0.0 8 29 18 11 70 0.3
International Journal of Research and Development (IJRD), ISSN 1596-969 Volume 2 No 1, Nov 2015 Faculty of Education, Adekunle Ajasin University, Akungba-Akoko, Ondo State, Nigeria. Available online at http://www.aauaeducationfac.org
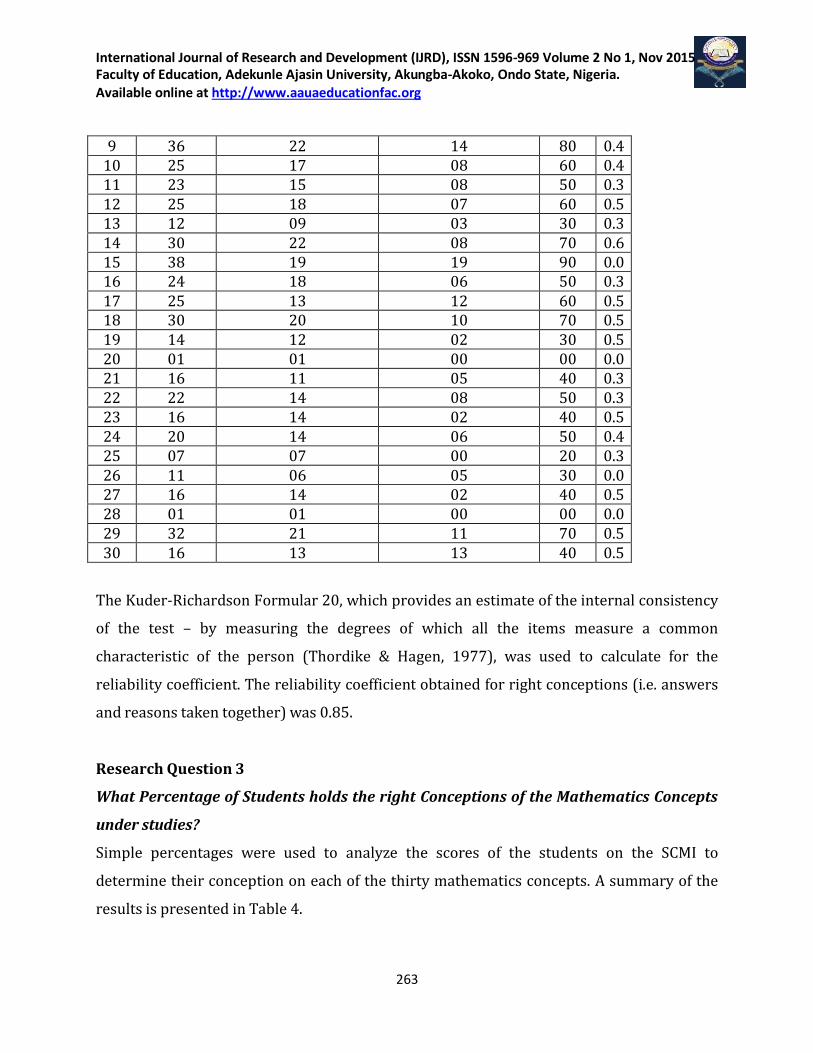
263
9 36 22 14 80 0.4 10 25 17 08 60 0.4 11 23 15 08 50 0.3 12 25 18 07 60 0.5 13 12 09 03 30 0.3 14 30 22 08 70 0.6 15 38 19 19 90 0.0 16 24 18 06 50 0.3 17 25 13 12 60 0.5 18 30 20 10 70 0.5 19 14 12 02 30 0.5 20 01 01 00 00 0.0 21 16 11 05 40 0.3 22 22 14 08 50 0.3 23 16 14 02 40 0.5 24 20 14 06 50 0.4 25 07 07 00 20 0.3 26 11 06 05 30 0.0 27 16 14 02 40 0.5 28 01 01 00 00 0.0 29 32 21 11 70 0.5 30 16 13 13 40 0.5
The Kuder-Richardson Formular 20, which provides an estimate of the internal consistency
of the test – by measuring the degrees of which all the items measure a common
characteristic of the person (Thordike & Hagen, 1977), was used to calculate for the
reliability coefficient. The reliability coefficient obtained for right conceptions (i.e. answers
and reasons taken together) was 0.85.
Research Question 3
What Percentage of Students holds the right Conceptions of the Mathematics Concepts
under studies?
Simple percentages were used to analyze the scores of the students on the SCMI to
determine their conception on each of the thirty mathematics concepts. A summary of the
results is presented in Table 4.
International Journal of Research and Development (IJRD), ISSN 1596-969 Volume 2 No 1, Nov 2015 Faculty of Education, Adekunle Ajasin University, Akungba-Akoko, Ondo State, Nigeria. Available online at http://www.aauaeducationfac.org
264
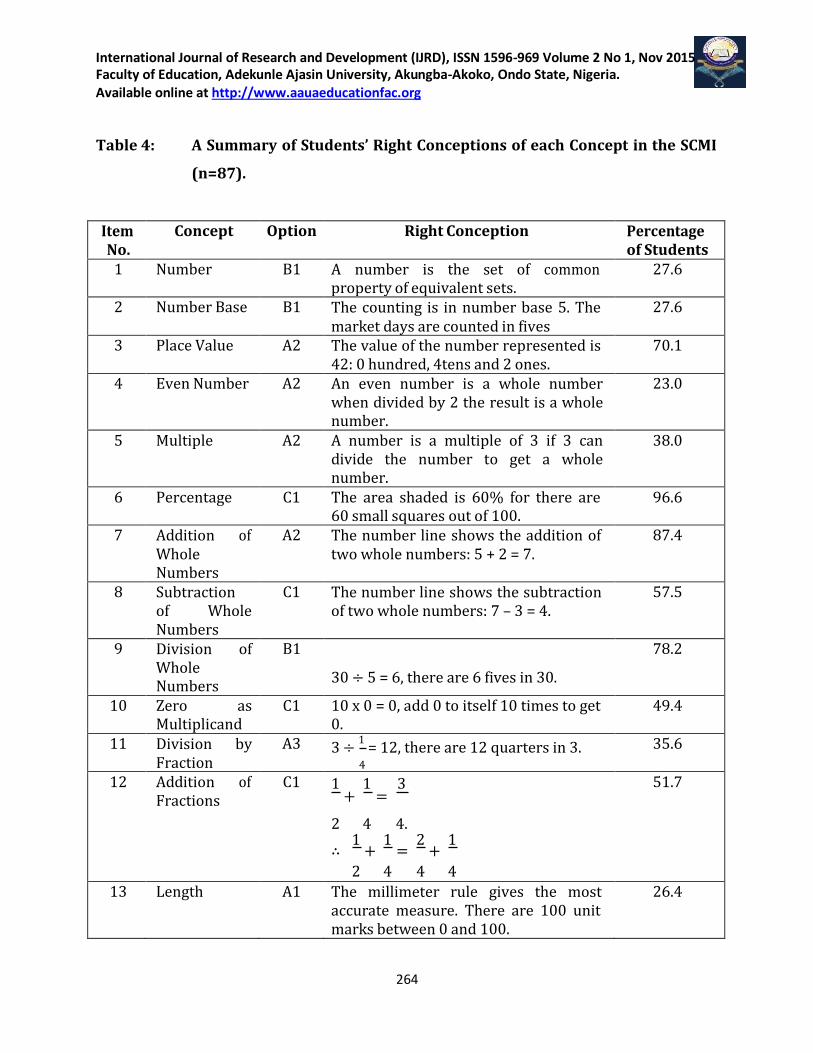
Table 4: A Summary of Students’ Right Conceptions of each Concept in the SCMI
(n=87).
Item No.
Concept Option Right Conception Percentage of Students
1 Number B1 A number is the set of common property of equivalent sets.
27.6
2 Number Base B1 The counting is in number base 5. The market days are counted in fives
27.6
3 Place Value A2 The value of the number represented is 42: 0 hundred, 4tens and 2 ones.
70.1
4 Even Number A2 An even number is a whole number when divided by 2 the result is a whole number.
23.0
5 Multiple A2 A number is a multiple of 3 if 3 can divide the number to get a whole number.
38.0
6 Percentage C1 The area shaded is 60% for there are 60 small squares out of 100.
96.6
7 Addition of Whole Numbers
A2 The number line shows the addition of two whole numbers: 5 + 2 = 7.
87.4
8 Subtraction of Whole Numbers
C1 The number line shows the subtraction of two whole numbers: 7 – 3 = 4.
57.5
9 Division of Whole Numbers
B1
30 ÷ 5 = 6, there are 6 fives in 30.
78.2
10 Zero as Multiplicand
C1 10 x 0 = 0, add 0 to itself 10 times to get 0.
49.4
11 Division by Fraction
A3 3 ÷ 1
= 12, there are 12 quarters in 3. 4
35.6
12 Addition of Fractions
C1 1 1 3 + =
2 4 4. 1 1 2 1
∴ + = +
2 4 4 4
51.7
13 Length A1 The millimeter rule gives the most accurate measure. There are 100 unit marks between 0 and 100.
26.4
International Journal of Research and Development (IJRD), ISSN 1596-969 Volume 2 No 1, Nov 2015 Faculty of Education, Adekunle Ajasin University, Akungba-Akoko, Ondo State, Nigeria. Available online at http://www.aauaeducationfac.org
265
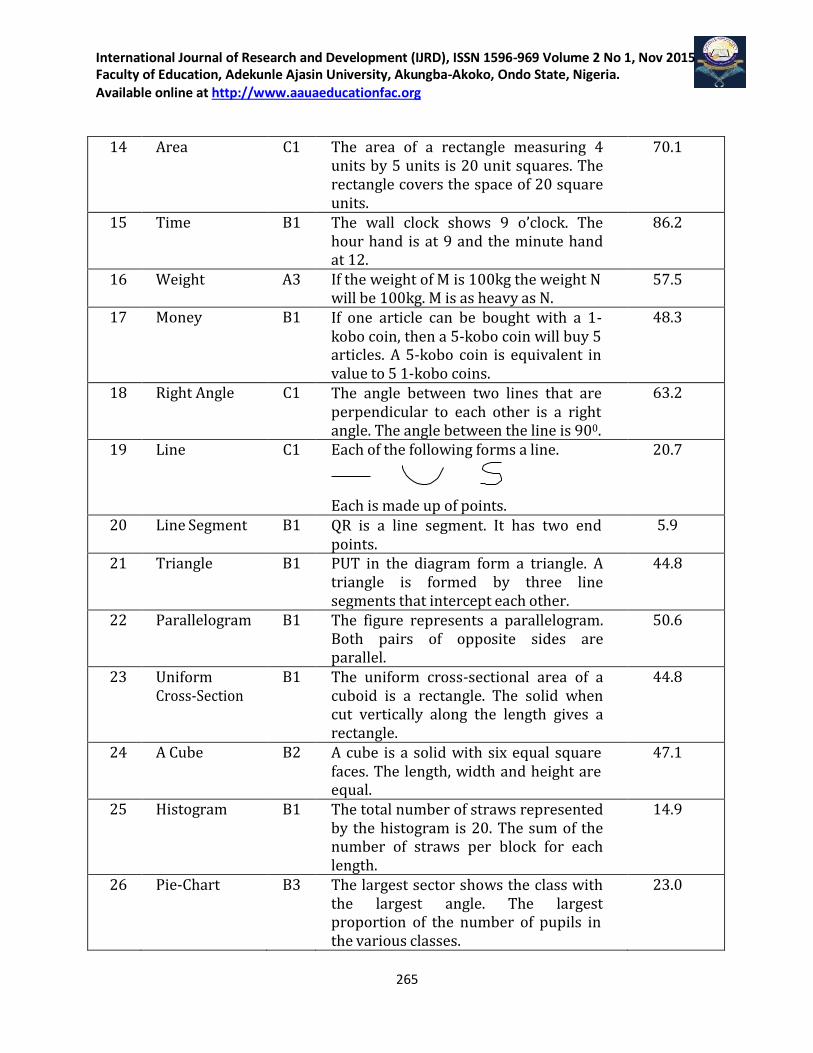
14 Area C1 The area of a rectangle measuring 4 units by 5 units is 20 unit squares. The rectangle covers the space of 20 square units.
70.1
15 Time B1 The wall clock shows 9 o’clock. The hour hand is at 9 and the minute hand at 12.
86.2
16 Weight A3 If the weight of M is 100kg the weight N will be 100kg. M is as heavy as N.
57.5
17 Money B1 If one article can be bought with a 1- kobo coin, then a 5-kobo coin will buy 5 articles. A 5-kobo coin is equivalent in value to 5 1-kobo coins.
48.3
18 Right Angle C1 The angle between two lines that are perpendicular to each other is a right angle. The angle between the line is 900.
63.2
19 Line C1 Each of the following forms a line.
Each is made up of points.
20.7
20 Line Segment B1 QR is a line segment. It has two end points.
5.9
21 Triangle B1 PUT in the diagram form a triangle. A triangle is formed by three line segments that intercept each other.
44.8
22 Parallelogram B1 The figure represents a parallelogram. Both pairs of opposite sides are parallel.
50.6
23 Uniform Cross-Section
B1 The uniform cross-sectional area of a cuboid is a rectangle. The solid when cut vertically along the length gives a rectangle.
44.8
24 A Cube B2 A cube is a solid with six equal square faces. The length, width and height are equal.
47.1
25 Histogram B1 The total number of straws represented by the histogram is 20. The sum of the number of straws per block for each length.
14.9
26 Pie-Chart B3 The largest sector shows the class with the largest angle. The largest proportion of the number of pupils in the various classes.
23.0
International Journal of Research and Development (IJRD), ISSN 1596-969 Volume 2 No 1, Nov 2015 Faculty of Education, Adekunle Ajasin University, Akungba-Akoko, Ondo State, Nigeria. Available online at http://www.aauaeducationfac.org
266
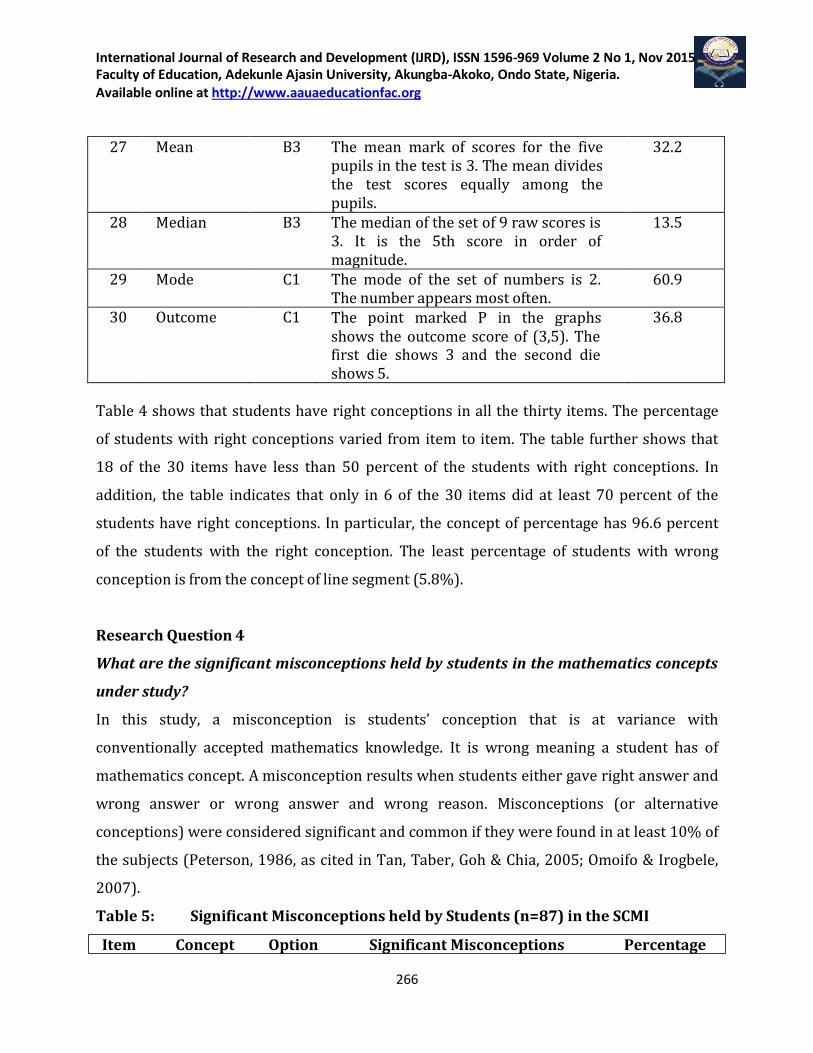
27 Mean B3 The mean mark of scores for the five pupils in the test is 3. The mean divides the test scores equally among the pupils.
32.2
28 Median B3 The median of the set of 9 raw scores is 3. It is the 5th score in order of magnitude.
13.5
29 Mode C1 The mode of the set of numbers is 2. The number appears most often.
60.9
30 Outcome C1 The point marked P in the graphs shows the outcome score of (3,5). The first die shows 3 and the second die shows 5.
36.8
Table 4 shows that students have right conceptions in all the thirty items. The percentage
of students with right conceptions varied from item to item. The table further shows that
18 of the 30 items have less than 50 percent of the students with right conceptions. In
addition, the table indicates that only in 6 of the 30 items did at least 70 percent of the
students have right conceptions. In particular, the concept of percentage has 96.6 percent
of the students with the right conception. The least percentage of students with wrong
conception is from the concept of line segment (5.8%).
Research Question 4
What are the significant misconceptions held by students in the mathematics concepts
under study?
In this study, a misconception is students’ conception that is at variance with
conventionally accepted mathematics knowledge. It is wrong meaning a student has of
mathematics concept. A misconception results when students either gave right answer and
wrong answer or wrong answer and wrong reason. Misconceptions (or alternative
conceptions) were considered significant and common if they were found in at least 10% of
the subjects (Peterson, 1986, as cited in Tan, Taber, Goh & Chia, 2005; Omoifo & Irogbele,
2007).
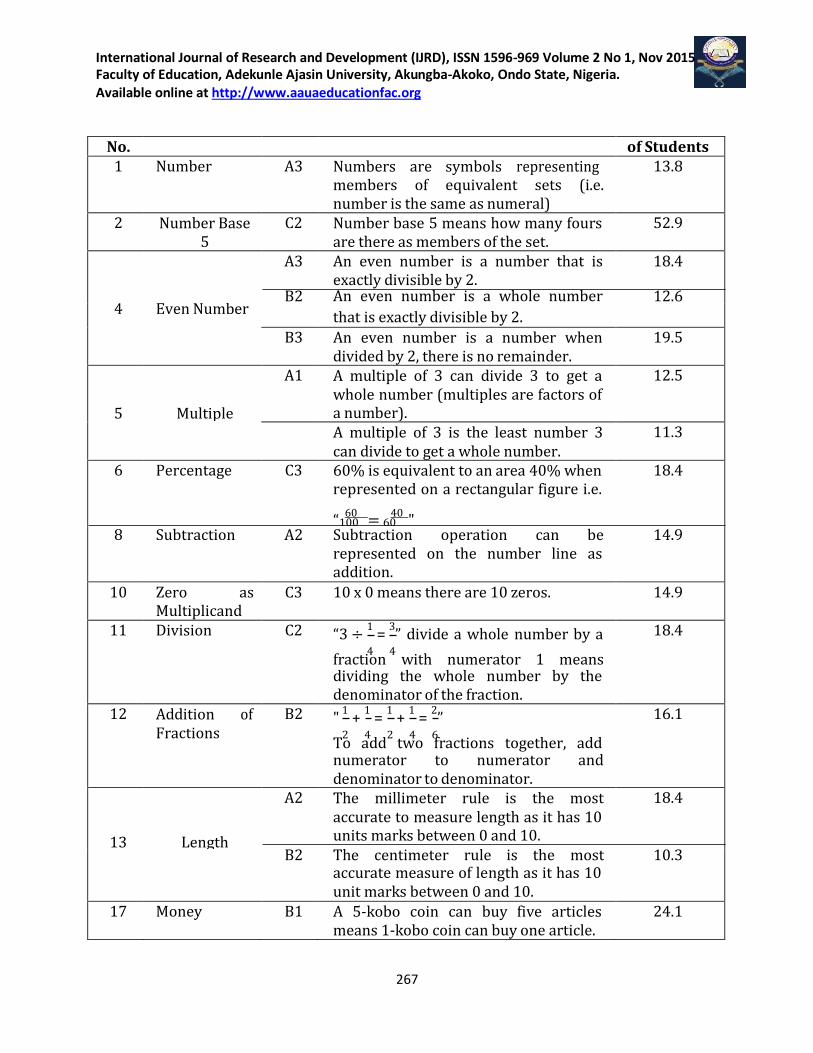
Table 5: Significant Misconceptions held by Students (n=87) in the SCMI
Item Concept Option Significant Misconceptions Percentage
International Journal of Research and Development (IJRD), ISSN 1596-969 Volume 2 No 1, Nov 2015 Faculty of Education, Adekunle Ajasin University, Akungba-Akoko, Ondo State, Nigeria. Available online at http://www.aauaeducationfac.org
267
No. of Students 1 Number A3 Numbers are symbols representing
members of equivalent sets (i.e. number is the same as numeral)
13.8
2 Number Base 5
C2 Number base 5 means how many fours are there as members of the set.
52.9
A3
B2
An even number is a number that is exactly divisible by 2. An even number is a whole number
18.4
12.6 4 Even Number that is exactly divisible by 2.
B3 An even number is a number when divided by 2, there is no remainder.
19.5
5
Multiple
A1 A multiple of 3 can divide 3 to get a whole number (multiples are factors of a number).
12.5
A multiple of 3 is the least number 3 can divide to get a whole number.
11.3
6 Percentage C3 60% is equivalent to an area 40% when represented on a rectangular figure i.e.
“ 60
= 40
"
100 60
18.4
8 Subtraction A2 Subtraction operation can be represented on the number line as addition.
14.9
10 Zero as Multiplicand
C3 10 x 0 means there are 10 zeros. 14.9
11 Division C2 “3 ÷ 1
= 3” divide a whole number by a
4 4 fraction with numerator 1 means dividing the whole number by the denominator of the fraction.
18.4
12 Addition of Fractions
B2 " 1
+ 1
= 1
+ 1
= 2”
2 4 2 4 6 To add two fractions together, add numerator to numerator and denominator to denominator.
16.1
13
Length
A2 The millimeter rule is the most accurate to measure length as it has 10 units marks between 0 and 10.
18.4
B2 The centimeter rule is the most accurate measure of length as it has 10 unit marks between 0 and 10.
10.3
17 Money B1 A 5-kobo coin can buy five articles means 1-kobo coin can buy one article.
24.1
International Journal of Research and Development (IJRD), ISSN 1596-969 Volume 2 No 1, Nov 2015 Faculty of Education, Adekunle Ajasin University, Akungba-Akoko, Ondo State, Nigeria. Available online at http://www.aauaeducationfac.org
268
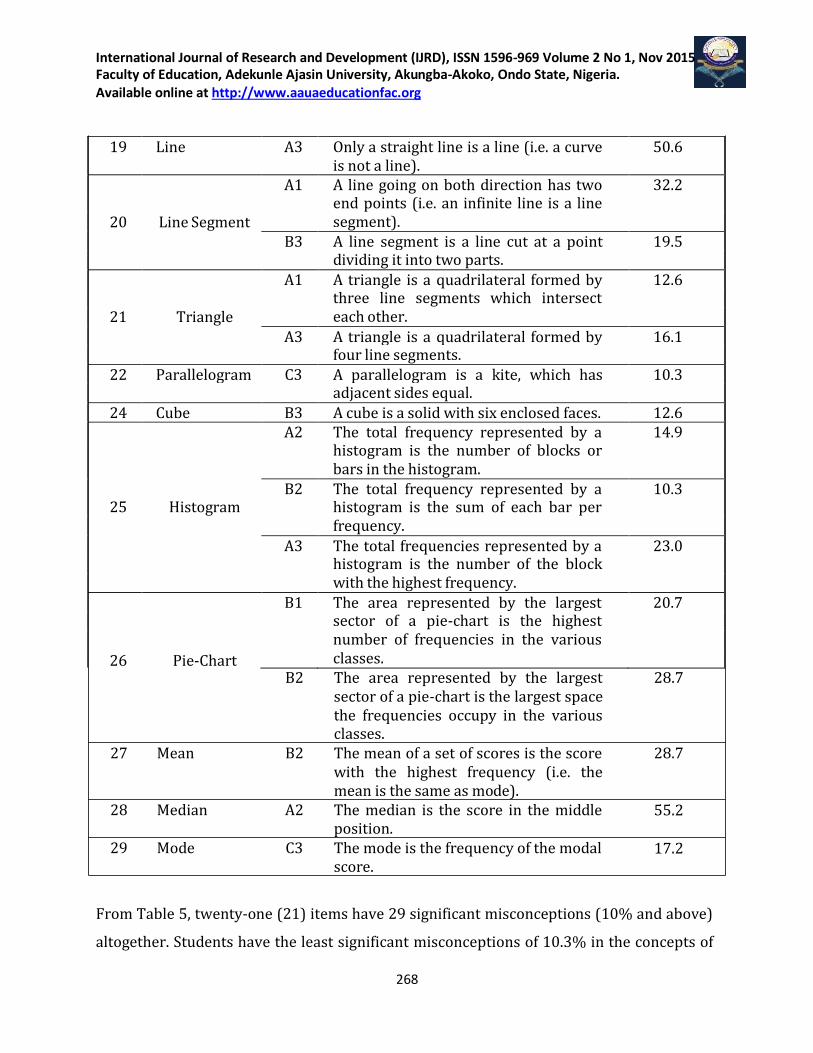
19 Line A3 Only a straight line is a line (i.e. a curve is not a line).
50.6
A1 A line going on both direction has two 32.2 end points (i.e. an infinite line is a line
20 Line Segment segment).
B3 A line segment is a line cut at a point 19.5 dividing it into two parts.
A1 A triangle is a quadrilateral formed by 12.6 three line segments which intersect
21 Triangle each other.
A3 A triangle is a quadrilateral formed by 16.1 four line segments.
22 Parallelogram C3 A parallelogram is a kite, which has 10.3 adjacent sides equal.
24 Cube B3 A cube is a solid with six enclosed faces. 12.6 A2 The total frequency represented by a 14.9 histogram is the number of blocks or
bars in the histogram.
B2 The total frequency represented by a 10.3 25 Histogram histogram is the sum of each bar per
frequency.
A3 The total frequencies represented by a 23.0 histogram is the number of the block
with the highest frequency.
B1 The area represented by the largest 20.7 sector of a pie-chart is the highest
number of frequencies in the various
26
Pie-Chart classes.
B2 The area represented by the largest sector of a pie-chart is the largest space the frequencies occupy in the various classes.
27 Mean B2 The mean of a set of scores is the score with the highest frequency (i.e. the mean is the same as mode).
28 Median A2 The median is the score in the middle position.
29 Mode C3 The mode is the frequency of the modal score.
28.7
28.7
55.2
17.2
From Table 5, twenty-one (21) items have 29 significant misconceptions (10% and above)
altogether. Students have the least significant misconceptions of 10.3% in the concepts of
International Journal of Research and Development (IJRD), ISSN 1596-969 Volume 2 No 1, Nov 2015 Faculty of Education, Adekunle Ajasin University, Akungba-Akoko, Ondo State, Nigeria. Available online at http://www.aauaeducationfac.org
269
length, parallelogram and histograms and the highest in the concepts of median (55.2%).
Students have 7 significant misconceptions in 5 items of the 6 items in Number and
Numeration (item 1-6); 4 in 4 items in Algebra (items 7-12); 3 in 2 items in Measurement
(items 13-18), 7 in 5 items in Geometry (item 19-24), and 8 in 5 items of Statistics (item
25-29). Therefore, most significant misconceptions of students came from Statistics and the
least from Measurement.
Summary of Result
Results revealed that:
Out of the fifty (50) items of the draft instrument, only 30 of the 35 items which had
100 percent agreement of the raters were included in the final SCMI.
The discriminating index of each of the item in the SCMI was at least 0.3.
The SCMI instrument has items of difficulty level ranging from 30 to 70 percent.
The SCMI instrument has a Kuder-Richardson Formular 20 reliability coefficient of
0.85.
The SCMI instrument elicited right conceptions from students in all the 30 items. 12
out of the items have at least 50 percent of the students with right conceptions.
The SCMI instrument diagnosed 29 significant misconceptions from 21 of the 30
items.
Conclusion and Recommendation
The study has developed and validated a two-tier multiple choice diagnostic instrument
that can measure correct answer and correct conception (right answer and right reason)
different from what is common used in achievement or teacher – made test which
measured correct answer only. Therefore, the following recommendations are made:
1. The instrument should be used to elicit students right conceptions and
misconceptions (i.e. alternative conceptions) of basic mathematical concepts).
2. The two-tier instrument should be used to diagnose students’ areas of learning
difficulties in school mathematics.
International Journal of Research and Development (IJRD), ISSN 1596-969 Volume 2 No 1, Nov 2015 Faculty of Education, Adekunle Ajasin University, Akungba-Akoko, Ondo State, Nigeria. Available online at http://www.aauaeducationfac.org
270
3. The two-tier diagnostic instrument should be used for a survey of students and
teachers misconceptions or alternative conceptions and the sources of such
conceptions.
4. Eliciting students’ right conception and diagnosing students’ misconception and
area of learning difficulties in mathematics will help teachers and text book writers
to recognize existing conceptions of students and build on them for students to have
the right conceptions.
5. Hence, strategies for conceptual change instruction in mathematics should be
developed (Posner, Strike, Hewson, Beeth and Thorney, 1998). The key assumption
of conceptual change approaches is that learning has to start from certain already
existing conceptions and that learning path ways (continuous or discontinuous)
have to be designed so that they lead from these preconceptions towards the
mathematics conceptions to be learned (Duit & Treagust, 1998). This would serve as
entry behaviour of students to a class lesson or instruction.
References
Abayomi, A. & Arigbabu, A.A. (2007). Conceptions of Mathematics: The Case of Social and Management Sciences Preservice Teachers. Journal of the Science Teacher Association of Nigeria, 42 (1&2), 11-14.
Akpan, B.B. (1999). Perspectives on Education and Science Teaching:
from the Eyes of Uduogie Ivowi, 570 860-863. Ansubel, D.P. (1968). Educational Psychology; A Cognitive View. New
York: Holt, Rinehart and Winston. Cakir, M. (2008). Constructivist Approaches to Learning in Science
and their Applications for Science Pedagogy: A Literature Review. International Journal of Environmental and Science Education, 3(4), 193-206.
Charles-Organ, G. (2014). Metacognitive Strategies and Senior Secondary
School Mathematics Students’ Misconceptions in River State, Nigeria. Abacus, the Journal of the Mathematical Association of Nigeria, 39(1), 234-246.
Chandrasegran, A.L., Treagust, D.F. & Mocerino, M. (2007). The
International Journal of Research and Development (IJRD), ISSN 1596-969 Volume 2 No 1, Nov 2015 Faculty of Education, Adekunle Ajasin University, Akungba-Akoko, Ondo State, Nigeria. Available online at http://www.aauaeducationfac.org
271
Development of a two-tier Multiple-choice Diagnostic Instrument for Evaluating Secondary School Students’ Ability to Describe and Explain Chemical Reactions using Multiple Levels of Representation. Chemistry Education Research and Practice: 18(3), 293-307.
Chen, C. & Lin, M. (n.d.). Developing a two-tier Multi-choice Instrument to
Assess High School Students’ Understanding – The Formation of Image by Plane Mirror. Department of Physics and Graduate Institute of Science Education, National Kaohsiung Normal University, Taiwan, Retrieved on October, 15, 2010, from http://www/Phs.uu.nl/esera2003/Ptogramme
Duit, R. & Treagust, D.F. (1988). Learning in Science: from Behaviourism
towards Social Constructivism and Beyond. In Barry J. Fraser and Kenneth, G. Tobin (eds), International Handbook of Science Education, Dordrecht: Kliver Academic Publishers, 3-24.
Federal Ministry of Education (1979a). Junior Secondary School
Mathematics Curriculum. Lagos: Federal Ministry of Education. Federal Ministry of Education (1979b). Primary Education Mathematics
Curriculum. Lagos: Federal Ministry of Education. Federal Ministry of Education (1979c) Senior Secondary Secondary School
Mathematics Curriculum. Lagos: Federal Ministry of Education. Federal Ministry of Education (2007a). 9-Year Basic Education
Curriculum: Mathematics for SS 1-3. Abuja: Nigerian Research and Development Council.
Federal Ministry of Education (2007b). Junior Secondary Education
Curriculum: Mathematics for JSS 1-3. Abuja: Nigerian Research and Development Council.
Federal Ministry of Education (2007c). Senior Secondary Education
Curriculum: Mathematics for SS 1-3. Abuja: Nigerian Research and Development Council.
Galadima, I. & Yusha’u, M.A. (2007). An Investigation into Mathematics
Performance of Senior Secondary School Students in Sokoto State. Abacus, the Journal of the Mathematics Association of Nigeria. 32(1), 24-33.
Harbor-Peters, V.F. (2001). Unmasking Some Aversive Aspect of Schools
International Journal of Research and Development (IJRD), ISSN 1596-969 Volume 2 No 1, Nov 2015 Faculty of Education, Adekunle Ajasin University, Akungba-Akoko, Ondo State, Nigeria. Available online at http://www.aauaeducationfac.org
272
Mathematics and Strategies for Averting Them. Inaugural Lectures, University of Nigeria, Nsuka, 1-20.
Idehen, F.O. (2011). An Assessment of Secondary School Students’
Conceptions of Selected Mathematical Concepts in Edo State. A Ph.D Thesis, Faculty of Education, University of Benin, Benin City, Nigeria.
Lassa, P.N. & Paling, D. (1983). Teaching Mathematics in Nigerian
Primary Schools. Ibadan: University Press Limited. 1-200. Nurudeen, J.S. (2007). Secondary School Students’ Misconceptions in
Solving Mathematical Problems. Abacus, the Journal of the Mathematical Association of Nigeria. 32(1), 84-91.
Obodo, G.C. (2004). Principles and Practice of Mathematics Education in
Nigeria. Enugu: Academic Forum, 7-15. Omoifo, C.N. & Irogbele, M.M. (2007). Undergraduates’ Alternative
Conceptions of Chemistry Ideas: A Nigerian Case Study. Proceeding of the NARST 2007 Annual Meeting, New Orlean, L.A. United States.
Tan, K.C.D., Taber, K.S., Goh, N.K. & Chia, L.S. (2005). The Ionization
Energy Diagnostic Instrument: A Two-tier Multiple-choice Instrument to Determine High School Students’ Understanding of Ionizing Energy. Chemistry Education Research and Practice, 6(4), 180-197.
Thorndike, R.L. & Hagen, E.P. (1977). Measurement and Evaluation in
Psychology and Education. New York: John Weley & Sons, 56-83. Uwagie-Ero, A.O. (1997). Test, Measurement and Evaluation. Benin City:
Opp Ltd. WAEC (2004a). The West African Senior School Certificate Examinations,
November/December, 2004, Chief Examiner’s Report (Nigeria). WAEC (2004b). The West African Senior School Certificate Examinations,
November/December, 2004, Chief Examiner’s Report (Nigeria). WAEC (2007). The West African Senior School Certificate Examinations,
May/June, 2007, Chief Examiner’s Report (Nigeria).


