Deutsche Bank
Deutsche Bank1Additional Tier 1 Roadshow
5 – 9 May 2014 These materials and the information contained herein aret b i i d d t b di t ib t d i th U it dy not being issued and may not be distributed in the United
States, Canada, Japan or Australia
These written materials do not constitute an offer to sell securities or a solicitation of an offer to buy securities in the United States of America Securities may not be
DisclaimersThese written materials do not constitute an offer to sell securities, or a solicitation of an offer to buy securities, in the United States of America. Securities may not be offered or sold in the United States of America absent registration or an exemption from registration under the U.S. Securities Act of 1933, as amended ( the “Securities Act”). The securities of Deutsche Bank AG described herein have not been and will not be registered under the Securities Act, or the laws of any State, and may not be offered or sold within the United States, except pursuant to an exemption from, or in transaction not subject to, the registration requirements of the Securities Act and applicable State laws. Deutsche Bank AG does not intend to register any portion of the offering in the United States or conduct a public offering of securities in the United States.
The following is a short summary description of the Additional Tier 1 Notes which Deutsche Bank plans to issue (the “AT1 Notes”). The complete terms and conditions of the AT1 Notes will be included in the respective prospectus (the “Prospectus”) which Deutsche Bank will publish for the AT1 Notes.
Please read the ProspectusThe draft Prospectus can be obtained from Deutsche Bank. This presentation does not constitute an offer to subscribe or purchase AT1 Notes or investment advice in respect thereof; its sole purpose is the description of the AT1 Notes. Any investment decision should be based on the Prospectus. Any views expressed reflect therespect thereof; its sole purpose is the description of the AT1 Notes. Any investment decision should be based on the Prospectus. Any views expressed reflect the current views of Deutsche Bank AG which may change without notice. Past performance is not indicative of future results.
As will be described in the Prospectus, there are restrictions on the distribution of the AT1 Notes in certain jurisdictions. In particular, they may not be offered or sold in the United States, to U.S. persons or U.S. residents.
This document and the information contained therein may only be distributed and published in jurisdictions in which such distribution and publication is permitted.
Forward-Looking Statementsg
This presentation contains forward-looking statements. Forward-looking statements are statements that are not historical facts; they include statements about ourbeliefs and expectations and the assumptions underlying them. These statements are based on plans, estimates and projections as they are currently available to themanagement of Deutsche Bank. Forward-looking statements therefore speak only as of the date they are made, and we undertake no obligation to update publicly anyof them in light of new information or future events.
By their very nature, forward-looking statements involve risks and uncertainties. A number of important factors could therefore cause actual results to differ materiallyfrom those contained in any forward-looking statement. Such factors include the conditions in the financial markets in Germany, in Europe, in the United States andelsewhere from which we derive a substantial portion of our revenues and in which we hold a substantial portion of our assets, the development of asset prices andmarket volatility, potential defaults of borrowers or trading counterparties, the implementation of our strategic initiatives, the reliability of our risk management policies,procedures and methods, and other risks referenced in our filings with the U.S. Securities and Exchange Commission. Such factors are described in detail in our SECForm20-F of 20 March 2014 under the heading “Risk Factors.” Copies of this document are readily available upon request or can be downloaded from www.db.com/ir.
Non-GAAP Financial Measures
AT1 Roadshow, 5 – 9 May 2014Deutsche BankTreasury / Investor Relations
financial transparency.
These materials and the information contained herein are not being issued and may not be distributed in the United States, Canada, Japan or Australia
Non GAAP Financial Measures
This presentation also contains non-IFRS financial measures. For a reconciliation to directly comparable figures reported under IFRS, to the extent such reconciliationis not provided in this presentation, refer to the 1Q2014 Financial Data Supplement, which is available at www.db.com/ir.
2
Agenda
1 AT1 offering
2 FY2013 and 1Q2014 results
Appendix
AT1 Roadshow, 5 – 9 May 2014Deutsche BankTreasury / Investor Relations
financial transparency.
These materials and the information contained herein are not being issued and may not be distributed in the United States, Canada, Japan or Australia
3

Key features
DB's inaugural issuance of CRD4/CRR compliant Additional Tier 1 (“AT1”) capital
Strengthens capital base and supports expected future leverage ratio requirements
CET1 of 13.2% / EUR 50 bn as of 31 March 2014
CET1 capital headroom as of 31 March 2014 of 8.1% / EUR 30 bn vs. trigger of 5.125%
Accelerate transition to CRD4/CRR capital structure; deliver on “new style” AT1 target of EUR 5 b b d f 2015EUR 5 bn by end of 2015
AT1 Roadshow, 5 – 9 May 2014Deutsche BankTreasury / Investor Relations
financial transparency.
These materials and the information contained herein are not being issued and may not be distributed in the United States, Canada, Japan or Australia
4

Additional Tier 1 – offering summary(see prospectus for detailed description)(see prospectus for detailed description)
Issuer — Deutsche Bank Aktiengesellschaft, Frankfurt am Main
Notes — Multi currency issue— CRD4/CRR compliant Additional Tier 1 Notes— Temporary write-down, in whole or part, at 5.125% CET1 ratio (phase-in/group)— Perpetual Non-Call [X] with 5 year call intervals thereafter (unless written-down)Perpetual Non Call [X] with 5 year call intervals thereafter (unless written down)— Fixed rate with reset over 5-year swap rate, payable annually — Non-cumulative discretionary cancellation of coupon payments; mandatory cancellation as
required by the CRR— Insolvency claims pari passu with claims in respect of legacy Tier 1 preferred securities— Extraordinary call rights relating to regulatory and tax (any time, incl. written-down)— German law
Off i EUR 100 000 d i ti d diOffering — EUR 100,000 denomination or more depending on currency— Regulation S — Luxembourg Listing (regulated market)
AT1 Roadshow, 5 – 9 May 2014Deutsche BankTreasury / Investor Relations
financial transparency.
These materials and the information contained herein are not being issued and may not be distributed in the United States, Canada, Japan or Australia
5

Additional Tier 1 – structural features (see prospectus for detailed description)(see prospectus for detailed description)
Feature Mechanism
C ll ti f I t t t ill t b d if th B k l t t l th t i h l i t t it lCancellation of interest payments
Interest payments will not be made, if the Bank elects to cancel the payment, in whole or in part, at its sole discretion. Interest payments will be cancelled:— to the extent such payment of interest, together with any distributions previously made on Tier 1
Instruments in the then current fiscal year, would exceed a sum of Available Distributable Items, increased by the aggregate interest expense relating to Tier 1 Instruments reflected in the financial statements for theby the aggregate interest expense relating to Tier 1 Instruments reflected in the financial statements for the preceding year (see page 9), or
— if and to the extent the competent supervisory authority orders the Bank to cancel an interest payment in whole or in part or another prohibition of interest payments is imposed by law or an authority
Write-down “Trigger Event” will have occurred if the CET1 ratio of the Bank, determined on a consolidated basis, falls mechanism
ggbelow 5.125% (phase-in)The write-down will be effected on a pro-rata basis among all AT1 instruments sharing a trigger-based write-down mechanism in an aggregate amount as required to restore the consolidated CET1 ratio of the Bank to 5.125%
Write up The Bank may at its sole discretion in subsequent fiscal years effect a write up of the AT1 Instruments on a proWrite-up mechanism
The Bank may at its sole discretion in subsequent fiscal years effect a write-up of the AT1 Instruments on a pro rata basisThe amount of such write-up will be limited by the proportion of the annual profit of the Bank which represents the share of the initial nominal amount of an individual AT1 Instrument subject to a write-down in the aggregate Tier 1 capital of the Bank before a write-up taking effect and will be further limited by MDA restrictions (Art. 141 (2) CRD4 as implemented by § 10c et sq German Banking Act (KWG) and § 37 Solvency Regulation (SolvV))
AT1 Roadshow, 5 – 9 May 2014Deutsche BankTreasury / Investor Relations
financial transparency.
These materials and the information contained herein are not being issued and may not be distributed in the United States, Canada, Japan or Australia
6
(2) CRD4 as implemented by § 10c et sq. German Banking Act (KWG) and § 37 Solvency Regulation (SolvV)) applicable to the Bank at the time of such intended write-up

CT1/CET1 ratio development and AT1 headroom above triggerCT1/CET1 ratio (2008 – 1Q2014)(1)
Reported CT1/CET1 ratio, period end
AT1: Headroom above trigger
Basel 2.5Basel 2 Basel 3Trigger level for write-down mechanism
CET1 ratio
9.5%
11.4%12.8% 13.2%
9 5%
13.2% Phase-in CET1 ratio
Estimated headroom to t i l l(2)
> 10%(target)
7.0%
8.7% 8.7%9.5% 9.5%
Fully loaded CET1 ratio
trigger level(2)( g )
5 125% Estimated headroom to trigger level(2) on a fully loaded basis(3)
5.125%
2008 2009 2010 2011 2012 2013 1Q14
(1) Core Tier 1 / Common Equity Tier 1 ratio under relevant regulatory framework for 2008-2014(2) This analysis is presented for illustrative purposes only and is not a forecast of Deutsche Bank’s results of operations or capital position; pro-forma figures based on
CRD4/CRR i it fi l i l t ti RWA d CRD4/CRR ( h i ) t EUR 376 b 31 M h 2014 d k t t bl t 31 M h 2015 li h i f
1Q2014 1Q201531 March 201531 March 2014EUR > 18 bn(2)EUR > 28 bn(2)EUR 30 bn(2)
AT1 Roadshow, 5 – 9 May 2014Deutsche BankTreasury / Investor Relations
financial transparency.
These materials and the information contained herein are not being issued and may not be distributed in the United States, Canada, Japan or Australia
7
CRD4/CRR in its final implementation; RWAs under CRD4/CRR (phase-in) at EUR 376 bn as per 31 March 2014 and kept stable to 31 March 2015; linear phase-in of deductions of 20% p.a. starting in 2014 until 2018
(3) Assuming that the provisions of CRD4/CRR which will apply by 2019 were to apply already in 2015
AT1: Headroom above distribution restrictions
Phase-in CET1 ratio
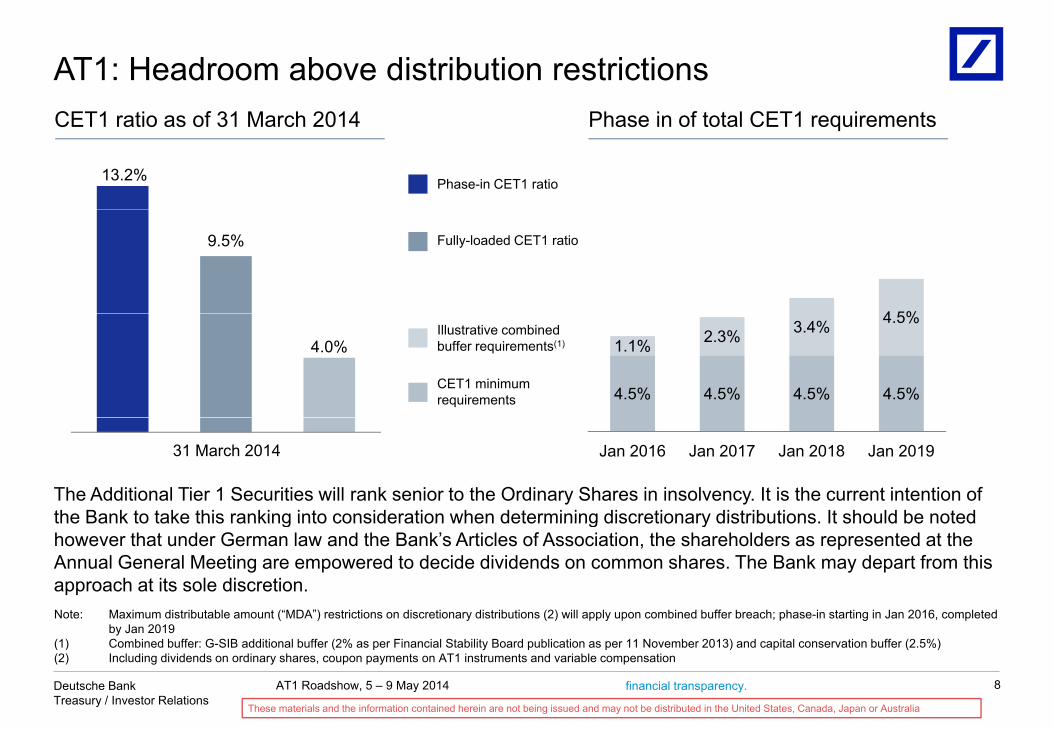
CET1 ratio as of 31 March 2014 Phase in of total CET1 requirements
13.2%
Fully-loaded CET1 ratio
4 5%
9.5%
CET1 minimum requirements
Illustrative combined buffer requirements(1)
4.5% 4.5% 4.5% 4.5%
1.1% 2.3% 3.4% 4.5%
4.0%
The Additional Tier 1 Securities will rank senior to the Ordinary Shares in insolvency. It is the current intention of the Bank to take this ranking into consideration when determining discretionary distributions. It should be noted
Jan 2016 Jan 2017 Jan 2018 Jan 20191Q201431 March 2014
the Bank to take this ranking into consideration when determining discretionary distributions. It should be noted however that under German law and the Bank’s Articles of Association, the shareholders as represented at the Annual General Meeting are empowered to decide dividends on common shares. The Bank may depart from this approach at its sole discretion.Note: Maximum distributable amount (“MDA”) restrictions on discretionary distributions (2) will apply upon combined buffer breach; phase-in starting in Jan 2016, completed
b J 2019
AT1 Roadshow, 5 – 9 May 2014Deutsche BankTreasury / Investor Relations
financial transparency.
These materials and the information contained herein are not being issued and may not be distributed in the United States, Canada, Japan or Australia
8
by Jan 2019 (1) Combined buffer: G-SIB additional buffer (2% as per Financial Stability Board publication as per 11 November 2013) and capital conservation buffer (2.5%)(2) Including dividends on ordinary shares, coupon payments on AT1 instruments and variable compensation
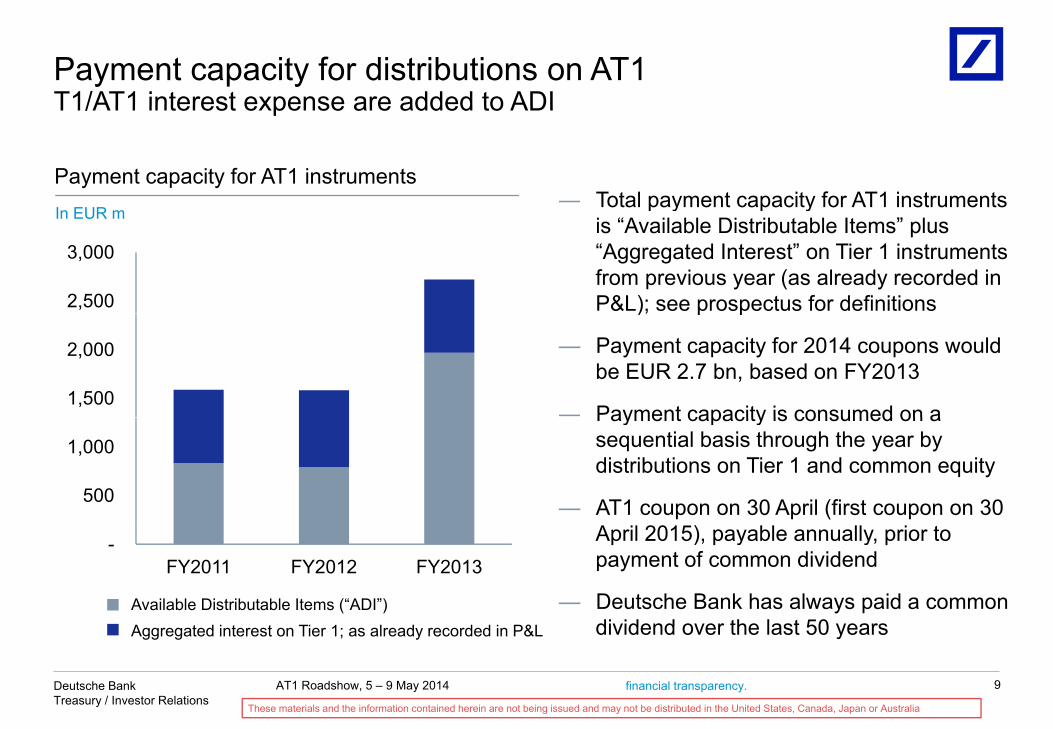
Payment capacity for distributions on AT1T1/AT1 interest expense are added to ADIT1/AT1 interest expense are added to ADI
— Total payment capacity for AT1 instruments Payment capacity for AT1 instrumentsI EUR
2,500
3,000
p y p yis “Available Distributable Items” plus “Aggregated Interest” on Tier 1 instruments from previous year (as already recorded in P&L); see prospectus for definitions
In EUR m
1,500
2,000
); p p
— Payment capacity for 2014 coupons would be EUR 2.7 bn, based on FY2013
— Payment capacity is consumed on a
500
1,000
Payment capacity is consumed on a sequential basis through the year by distributions on Tier 1 and common equity
— AT1 coupon on 30 April (first coupon on 30
A t d i t t Ti 1 l d d d i P&LAvailable Distributable Items (“ADI”)
-FY2011 FY2012 FY2013
April 2015), payable annually, prior to payment of common dividend
— Deutsche Bank has always paid a common dividend over the last 50 years
AT1 Roadshow, 5 – 9 May 2014Deutsche BankTreasury / Investor Relations
financial transparency.
These materials and the information contained herein are not being issued and may not be distributed in the United States, Canada, Japan or Australia
9
Aggregated interest on Tier 1; as already recorded in P&L dividend over the last 50 years

AT1 offeringMitigating the key risksMitigating the key risks
Trigger level: 5.125% CET1 (no super-equivalence)gg ( p q )
Capital buffer: Significant buffer of 8 1% / EUR 30 bn vs trigger of 5 125% (March 2014)Capital buffer: Significant buffer of 8.1% / EUR 30 bn vs. trigger of 5.125% (March 2014)
Di t ib ti ADI i d b i t t f Ti 1 f iDistributions: ADI increased by interest expenses for Tier 1 from previous year
Interest-rate risk: 5-year reset over swap rate limits exposure
AT1 Roadshow, 5 – 9 May 2014Deutsche BankTreasury / Investor Relations
financial transparency.
These materials and the information contained herein are not being issued and may not be distributed in the United States, Canada, Japan or Australia
10

Agenda
1 AT1 offering
2 FY2013 and 1Q2014 results
Appendix
AT1 Roadshow, 5 – 9 May 2014Deutsche BankTreasury / Investor Relations
financial transparency.
These materials and the information contained herein are not being issued and may not be distributed in the United States, Canada, Japan or Australia
11

FY2013 and 1Q2014: Results at a glanceIn EUR bn unless otherwise statedIn EUR bn, unless otherwise stated
FY2012 FY2013 1Q2013 1Q2014
Income before income taxes 0.8 1.5 2.4 1.7Net income 0.3 0.7 1.7 1.1
ProfitabilityDiluted EPS (in EUR) 0.27 0.65 1.71 1.03Post-tax return on average active equity 0.5% 1.2% 12.3% 7.9%Cost / income ratio (reported) 92.5% 89.0% 70.5% 77.0%Cost / income ratio (adjusted)(1) 73.1% 72.5% 64.3% 71.4%
31 Dec 2012 31 Dec 2013 31 Mar 2014
Balance sheet
Total assets IFRS 2,022 1,611 1,637Leverage exposure 1,683 1,445 1,423Risk weighted assets (CRD4 fully loaded) 401 350 373
(2)(2)
sheet Risk-weighted assets (CRD4, fully-loaded) 401 350 373Tangible book value per share (in EUR) 42.26 39.69 40.72
Regulatoryratios
Common Equity Tier 1 ratio (phase-in) 12.4% 14.7% 13.2%Common Equity Tier 1 ratio (fully loaded) 7 8% 9 7% 9 5%
Note: Numbers may not add up due to rounding
ratios (CRD4)
Common Equity Tier 1 ratio (fully loaded) 7.8% 9.7% 9.5%Leverage ratio (adjusted, fully loaded)(3) 2.6% 3.1% 3.2%
AT1 Roadshow, 5 – 9 May 2014Deutsche BankTreasury / Investor Relations
financial transparency.
These materials and the information contained herein are not being issued and may not be distributed in the United States, Canada, Japan or Australia
12
(1) Adjusted cost base (as calculated on page 29) divided by reported revenues(2) All CRD 4 measures as of 31 Dec 2012 and 31 Dec 2013 are shown pro-forma(3) Comprises fully loaded CET 1, plus all current eligible AT1 outstanding (under phase-in)
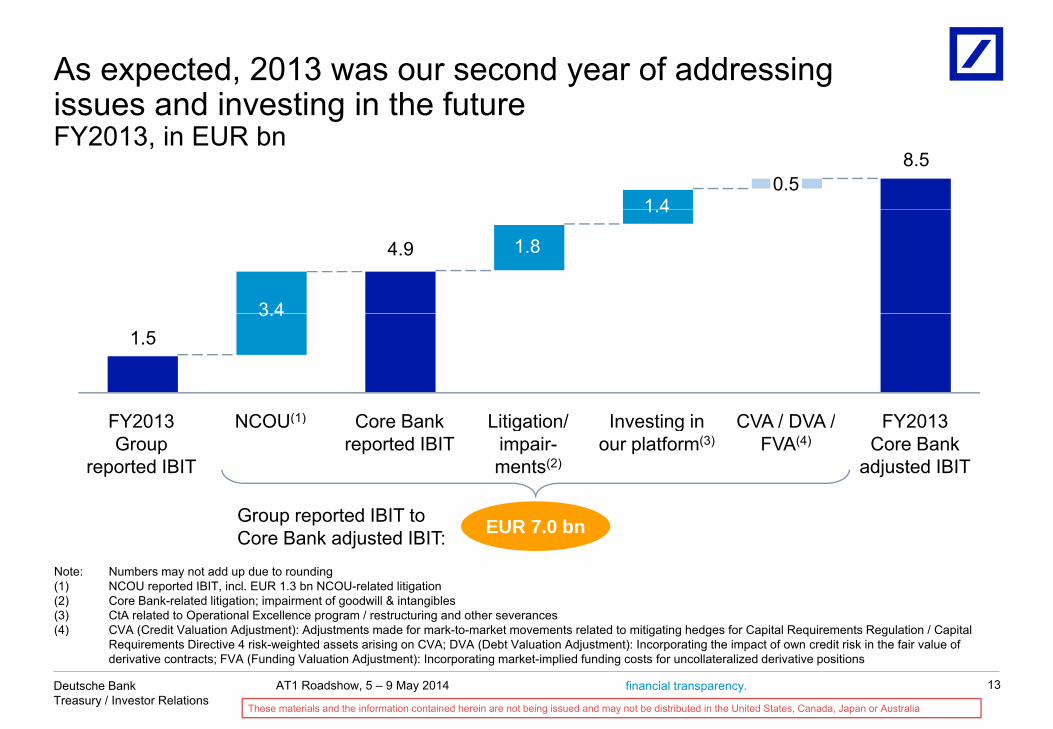
As expected, 2013 was our second year of addressing issues and investing in the future
8.5
issues and investing in the futureFY2013, in EUR bn
1 40.5
1.4
1.8
3 4
4.9
1.5
Core Bank CVA / DVA /In esting in FY2013FY2013
3.4
Litigation/NCOU(1) Core Bank reported IBIT
CVA / DVA /FVA(4)
Investing in our platform(3)
FY2013Core Bank
adjusted IBIT
FY2013 Group
reported IBIT
Litigation/ impair-ments(2)
NCOU(1)
EUR 7 0 bGroup reported IBIT to EUR 7.0 bnG oup epo ted toCore Bank adjusted IBIT:
Note: Numbers may not add up due to rounding (1) NCOU reported IBIT, incl. EUR 1.3 bn NCOU-related litigation(2) Core Bank-related litigation; impairment of goodwill & intangibles(3) CtA related to Operational Excellence program / restructuring and other severances(4) CVA (C dit V l ti Adj t t) Adj t t d f k t k t t l t d t iti ti h d f C it l R i t R l ti / C it l
AT1 Roadshow, 5 – 9 May 2014Deutsche BankTreasury / Investor Relations
financial transparency.
These materials and the information contained herein are not being issued and may not be distributed in the United States, Canada, Japan or Australia
13
(4) CVA (Credit Valuation Adjustment): Adjustments made for mark-to-market movements related to mitigating hedges for Capital Requirements Regulation / Capital Requirements Directive 4 risk-weighted assets arising on CVA; DVA (Debt Valuation Adjustment): Incorporating the impact of own credit risk in the fair value of derivative contracts; FVA (Funding Valuation Adjustment): Incorporating market-implied funding costs for uncollateralized derivative positions

These challenges should not obscure core operating performance which was close to our best year everperformance, which was close to our best year ever ...Adjusted IBIT(1), Core Bank(2), in EUR bn
Growth & Expansion Crisis Recalibration Strategy 2015+
4.86.5
8.4 7.8
5.2
8.3 8.3 7.68.5
(5.6)2012 2013200920082007200620052004 2010 2011
Note: Adjusted IBIT shown based on US GAAP IBIT for 2004 to 2006 and IFRS IBIT for 2007 to 2013
AT1 Roadshow, 5 – 9 May 2014Deutsche BankTreasury / Investor Relations
financial transparency.
These materials and the information contained herein are not being issued and may not be distributed in the United States, Canada, Japan or Australia
14
j(1) Adjusted for litigation, Cost-to-Achieve / restructuring charges, other severances, impairment of goodwill & intangibles, CVA / DVA / FVA(2) Adjusted Group IBIT excludes NCOU in 2012 / 2013; in years prior to 2012 it excludes Corporate Investments and includes commodities businesses transferred to
NCOU in 1Q2014

… achieved with a leaner platform
Total assets (adjusted) RWAAdjusted cost base(2)
Pro forma Basel 2 indexedIn EUR bnIn EUR bn
(30)%1,521 (24)%100(8)%25.1
Pro-forma Basel 2, indexedDec 2010 = 100, in %
In EUR bnIn EUR bn
1,066 7623.1
Current(Dec 2013)
Peak(Dec 2006)(1)
Current(Dec 2013)
Peak(Dec 2010)
Current(FY2013)
Peak(1H2012)(3)
(1) Based on US GAAP total assets(2) FY2012 t d i t t f EUR 31 2 b (d lt f EUR 6 1 b t 1H2012 li d dj t d t b ) FY2013 t d i t t f
AT1 Roadshow, 5 – 9 May 2014Deutsche BankTreasury / Investor Relations
financial transparency.
These materials and the information contained herein are not being issued and may not be distributed in the United States, Canada, Japan or Australia
15
(2) FY2012 reported noninterest expenses of EUR 31.2 bn (delta of EUR 6.1 bn to 1H2012 annualized adjusted cost base); FY2013 reported noninterest expenses of EUR 28.4 bn (delta of EUR 5.2 bn to FY2013 adjusted cost base)
(3) 1H2012 annualized

Today we are a safer bank …
Trading portfolio stressscenario loss(1) Funding compositionLoss absorption capacity
Split of funding liabilitiesCET1 capital(2) as a multiple of stress lossIn EUR bn
1,206
982
5.0Total funding,in EUR bn28x
Split of funding liabilitiesCET1 capital(2) as a multiple of stress lossIn EUR bn
70% 34%Other(3)
1 9Most
stablefunding
sources(4)30%
66%
1.9
6x
Pre-crisis(Dec 2007)
Current(Dec 2013)
Current(Dec 2013)
Crisis (Dec 2008)
Current(Dec 2013)
Crisis(Dec 2008)
(1) Stress loss capturing traded market risk losses; stress scenarios derived using market observed liquidity horizons and the assumption of management action for liquid risks
(2) CRD4 ( h i )
AT1 Roadshow, 5 – 9 May 2014Deutsche BankTreasury / Investor Relations
financial transparency.
These materials and the information contained herein are not being issued and may not be distributed in the United States, Canada, Japan or Australia
16
(2) CRD4 (phase-in)(3) Including Secured Funding & Shorts, Discretionary Wholesale, Financing Vehicles & Other Customers (4) Including capital markets and equity, retail, and transaction banking
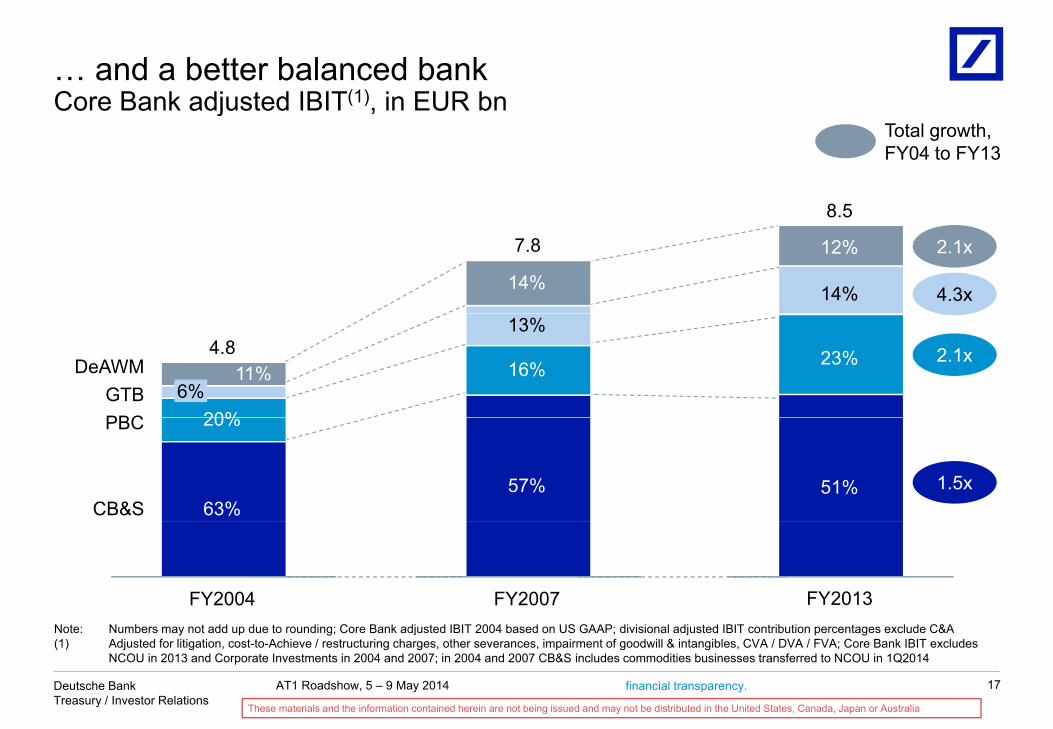
… and a better balanced bankCore Bank adjusted IBIT(1) in EUR bnCore Bank adjusted IBIT( ), in EUR bn
8 5
Total growth,FY04 to FY13
14% 14%
12%
8.5
2.1x
4.3x
7.8
16%
13%
23% 2.1x
PBCGTB
DeAWM
20%6%
11%4.8
57% 51% 1.5xCB&S
PBC 20%
63%
FY2007 FY2013FY2004N t N b t dd d t di C B k dj t d IBIT 2004 b d US GAAP di i i l dj t d IBIT t ib ti t l d C&A
AT1 Roadshow, 5 – 9 May 2014Deutsche BankTreasury / Investor Relations
financial transparency.
These materials and the information contained herein are not being issued and may not be distributed in the United States, Canada, Japan or Australia
17
Note: Numbers may not add up due to rounding; Core Bank adjusted IBIT 2004 based on US GAAP; divisional adjusted IBIT contribution percentages exclude C&A(1) Adjusted for litigation, cost-to-Achieve / restructuring charges, other severances, impairment of goodwill & intangibles, CVA / DVA / FVA; Core Bank IBIT excludes
NCOU in 2013 and Corporate Investments in 2004 and 2007; in 2004 and 2007 CB&S includes commodities businesses transferred to NCOU in 1Q2014

Capital: Key achievements to dateCRD4 Common Equity Tier 1 ratio in%CRD4 Common Equity Tier 1 ratio, in%
Key achievements to dateFully-loaded
<6 0%
9.7% 9.5%
— Capital position significantly strengthened since June 2012 following announcement of Strategy 2015+ priorities— Fully-loaded ratio increased by more than
<6.0%
30 Jun 2012(1) 31 Mar 201431 Dec 2013
50%— More than EUR 100 bn RWA reductions— EUR 3.0 bn capital raise in 2Q2013
Phase-in
13.2%<8.5%
14.6% — Phase-in ratio of 13.2% / 14.6%— March 2014 ratio more than 3 times
current regulatory minimum requirement
30 Jun 2012(1) 31 Mar 201431 Dec 2013
current regulatory minimum requirement— December 2013 ratio represents
significant buffer to 5.5% adverse scenario threshold for ECB stress test
AT1 Roadshow, 5 – 9 May 2014Deutsche BankTreasury / Investor Relations
financial transparency.
These materials and the information contained herein are not being issued and may not be distributed in the United States, Canada, Japan or Australia
18
(1) 30 June 2012 pro-forma

Capital: We are committed to our 10% CET1 ratio target
CET1 ratio and target
CRD4 Common Equity Tier 1ratio, fully-loaded
Outlook
Risks Measuresy
― EBA Regulatory Technical Standards, e.g. ― Prudent Valuation:
Potential EUR 1 5 – 2 0 bn
― Retained earnings
― NCOU de-risking
― Other divisional de-risking
>10%
9.5%
Potential EUR 1.5 2.0 bncapital impact from final EBA draft
― CVA(1) RWA— SSM(2) e g
Other divisional de risking
― Portfolio measures
― Bonus reduction— SSM( ), e.g.
— ECB taking over regulatory supervision for large European banks with potential implications for
― Dividend reduction
― Authorized capital
p pregulatory practice
— Asset Quality Review
31 Mar 2015 31 Mar 2014
AT1 Roadshow, 5 – 9 May 2014Deutsche BankTreasury / Investor Relations
financial transparency.
These materials and the information contained herein are not being issued and may not be distributed in the United States, Canada, Japan or Australia
19
(1) Credit Valuation Adjustment(2) Single Supervisory Mechanism

Leverage: Progress on leverage toolbox
LeverageCRD4 exposure, in EUR bn
Composition of reductionsIn EUR bn Achieved
in AchievedAchieved
Jun 2013 -
NCOU de-risking(2)
Derivatives and Securities Financing Transactions
2H2013(6) in 1Q2014
~16
~59
~14
~12
Mar 2014
~30
~72(~160)
3.0% 3.2%
Leverage ratio, adjusted fully loaded
Jun 2013 to Dec 2015 target reduction Financing Transactions
Off-balance sheetcommitments
Trading inventory
~3
~8
~4
~8
~7
~16
1,5831,423
2015 target reduction of EUR ~250 bn(1)
Total reduction (excl. FX)
Cash, collateral management(3)
and other CRD4 exposure(4)
~93
~8
~23
~(15)(7)
~116
~(8)
46% ofEUR ~250 bn
t t
Note: Numbers may not add up due to rounding(1) Excluding FX(2) Includes exposure reductions related to NCOU across all other categories(3) Comprised of cash and deposits with banks and cash collateral paid/margin receivables(4) Includes selective growth within overall target reduction level as well as regulatory adjustments (e.g., capital deduction items, consolidation circle adjustments)
FX(5) ~46 ~(1) ~44Dec 2015target
Mar 2014Jun 2013 target achieved
AT1 Roadshow, 5 – 9 May 2014Deutsche BankTreasury / Investor Relations
financial transparency.
These materials and the information contained herein are not being issued and may not be distributed in the United States, Canada, Japan or Australia
20
( ) g g g y j ( g , p , j )(5) FX impact calculated quarterly using starting portfolio (e.g. 1Q2014 impact applies 1Q2014 FX rates to 4Q2013 portfolio). Impact is additive across multiple quarters(6) Restated for Core/NCOU split of Commodities business(7) Includes EUR 7 bn underlying reinvestment in GTB and AWM business growth

Leverage: Simulation for 2015CRD4 in EUR bn period end
Leverage exposure Tier 1 capital
Targeted AT1 CRD4 leverage ratio
CRD4, in EUR bn, period end
Eligible AT1(1)
Adjusted fully loaded
issuance3.0% 3.2%
8 1
47.845.4
1,583
~1,290~(130)
1,423
((116))(44)
3.1% >3%Fully loaded
5.0
8.110.0
11.3 40.3
35.336.5 35.3
Retained earnings
Dec 2015
Jun2013
Mar2014
Jun2013
Dec 2015pro-forma
Targeted reduction until Dec
2015
Mar 2014
ReductionFX
AT1 Roadshow, 5 – 9 May 2014Deutsche BankTreasury / Investor Relations
financial transparency.
These materials and the information contained herein are not being issued and may not be distributed in the United States, Canada, Japan or Australia
21
Note: Figures may not add up due to rounding differences(1) Eligible AT1 outstanding under grandfathering rules; including 10% annual phase-out effect for 2013 & 2014

We confirm our aspirations to take advantage of future opportunitiesopportunitiesStrategy 2015+ aspirations
Cost savings of EUR 4.5 bn
Future possibilities?
Fully loaded
Cost savings of EUR 4.5 bn
Accelerated de-risking of NCOU
FY2011 Aspiration 2015
Changed competitive landscape
A leading European consolidator
>10%Fully loaded Core Tier 1
ratio
Cost / income ti <65%
<6%(1)
78%Demographic
shiftsA scaled global asset gatherer
ratio
Post-tax RoEoperating
businesses(2)>15%(4)12%(3)
Emerging A dominant local
Post-tax RoEGroup >12%(4)8%
g gmarket
dynamicsmarkets player in Emerging Markets
(1) Pro-forma(2) I l d C lid ti & Adj t t (C&A)
AT1 Roadshow, 5 – 9 May 2014Deutsche BankTreasury / Investor Relations
financial transparency.
These materials and the information contained herein are not being issued and may not be distributed in the United States, Canada, Japan or Australia
22
(2) Includes Consolidation & Adjustment (C&A)(3) Based on domestic statutory tax rate of 30.8% in FY2011(4) Based on corporate tax rate guidance of 30-35%, Basel 3 (fully loaded) and average active equity

Agenda
1 AT1 offering
2 FY2013 and 1Q2014 results
Appendix
AT1 Roadshow, 5 – 9 May 2014Deutsche BankTreasury / Investor Relations
financial transparency.
These materials and the information contained herein are not being issued and may not be distributed in the United States, Canada, Japan or Australia
23
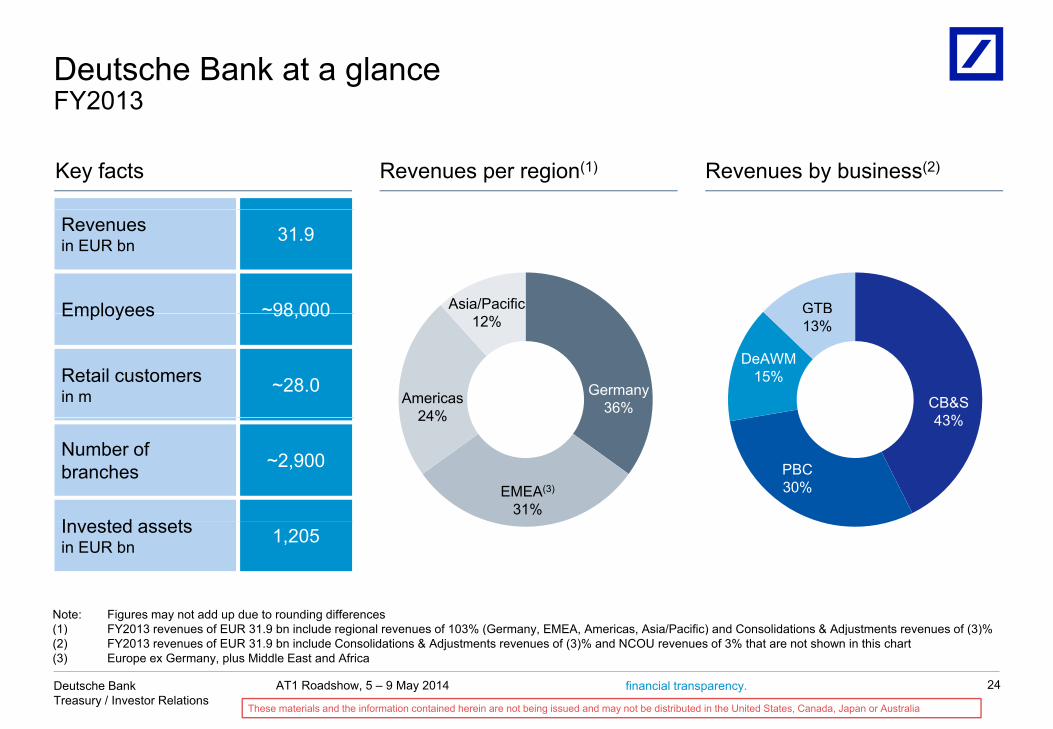
Deutsche Bank at a glanceFY2013FY2013
Key facts Revenues by business(2)Revenues per region(1)
Revenuesin EUR bn 31.9
Employees ~98 000 Asia/Pacific GTBEmployees 98,000
Retail customersin m ~28.0 Germany
36%Americas24%
12%
CB&S43%
13%
DeAWM15%
Number ofbranches ~2,900
I t d t
EMEA(3)
31%
24% 43%
PBC30%
Invested assetsin EUR bn 1,205
Note: Figures may not add up due to rounding differences(1) FY2013 f EUR 31 9 b i l d i l f 103% (G EMEA A i A i /P ifi ) d C lid ti & Adj t t f (3)%
AT1 Roadshow, 5 – 9 May 2014Deutsche BankTreasury / Investor Relations
financial transparency.
These materials and the information contained herein are not being issued and may not be distributed in the United States, Canada, Japan or Australia
24
(1) FY2013 revenues of EUR 31.9 bn include regional revenues of 103% (Germany, EMEA, Americas, Asia/Pacific) and Consolidations & Adjustments revenues of (3)%(2) FY2013 revenues of EUR 31.9 bn include Consolidations & Adjustments revenues of (3)% and NCOU revenues of 3% that are not shown in this chart(3) Europe ex Germany, plus Middle East and Africa

Funding profile
31 December 2007 31 March 2014
30% from most stablefunding sources(1)
Capital Markets and
Equity12%
Financing Vehicles
5%
Capital Marketsand Equity
Secured Fundingand Shorts
Financing Vehicles2%
65% from most stable funding sources
12%Retail11%
Transaction Banking
7%
Secured Funding and
Shorts39%
and Equity19%
RetailOther
C t
Discretionary Wholesale
7%
and Shorts17%
Other Customers
13%Discretionary
Wholesale13%
Retail28%
TransactionBanking
18%
Customers9%
Total: EUR 1,206 bn Total: EUR 969 bn
AT1 Roadshow, 5 – 9 May 2014Deutsche BankTreasury / Investor Relations
financial transparency.
These materials and the information contained herein are not being issued and may not be distributed in the United States, Canada, Japan or Australia
25
(1) Dec 2007 has been rebased to ensure consistency with 31 March 2014 presentation and includes Postbank

Credit ratings overview
Moody´s rating scale Aa3 A1 A2 A3 Baa1 Baa2Notches downgraded since July 2007
(long-term rating only)Fitch and S&P rating scale AA- A+ A A- BBB+ BBB Moody´s Fitch S&P
HSBC(1)(2) (2) 2 1 1
BNP Paribas
Credit Suisse(1)
Deutsche Bank
4 1 2
3 2 3(2)
(2)
3 2 2
4 1 2(3)(2) (2)
(2)
JPMorgan Chase(1)
Société Générale
Barclays(1)
4 1 2
4 3 3
4 4 3
5 4 4
(2)
(2)
(2)(2)
(2)
(2)UBS AG
Goldman Sachs(1)
Morgan Stanley(1)
B k f A i (1)
5 4 4
4 2 3
5 2 3
(2)
(2)
7 3 4(2)(2)
(2)
Bank of America(1)
Citigroup(1)
(1) Ratings shown are for HSBC Bank PLC, Credit Suisse AG, JPMorgan Chase & Co, Barclays Bank PLC, Goldman Sachs Group Inc., Morgan Stanley, Bank of America Corporation and Citigroup Inc as main bond issuing entities
Moody‘s Fitch S&P
7 3 4
7 4 4(2)
AT1 Roadshow, 5 – 9 May 2014Deutsche BankTreasury / Investor Relations
financial transparency.
These materials and the information contained herein are not being issued and may not be distributed in the United States, Canada, Japan or Australia
26
America Corporation, and Citigroup Inc. as main bond issuing entities(2) Long-term rating on negative outlook (3) On review for possible downgradeNote: Shown are unsecured long-term ratings as of 6 May 2014
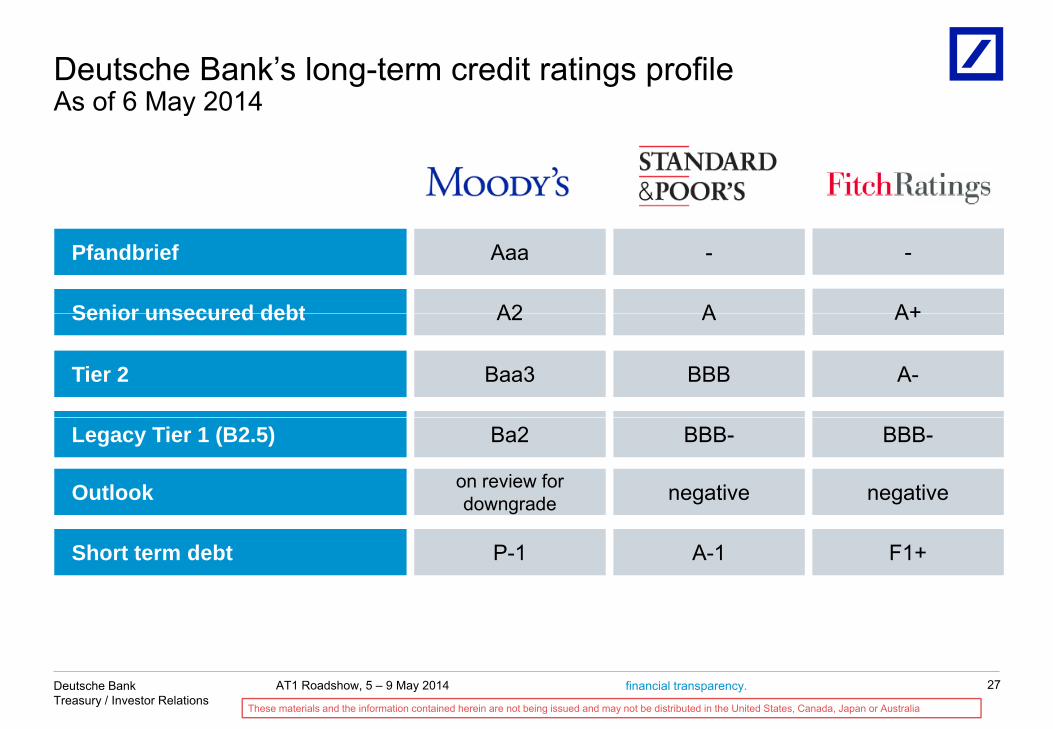
Deutsche Bank’s long-term credit ratings profileAs of 6 May 2014As of 6 May 2014
Senior unsecured debt A A+A2
Pfandbrief - -Aaa
Senior unsecured debt A A+A2
Tier 2 Baa3 BBB A-
Legacy Tier 1 (B2.5) Ba2 BBB- BBB-
Outlook on review for downgrade negative negative
Short term debt P-1 A-1 F1+
AT1 Roadshow, 5 – 9 May 2014Deutsche BankTreasury / Investor Relations
financial transparency.
These materials and the information contained herein are not being issued and may not be distributed in the United States, Canada, Japan or Australia
27
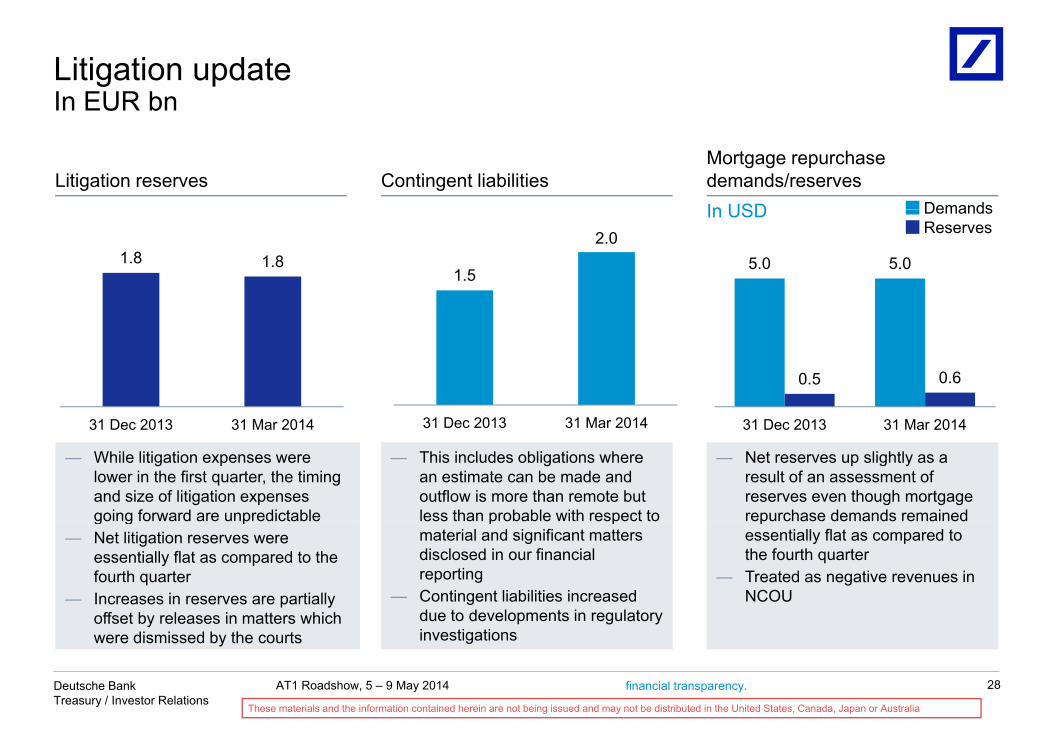
Litigation updateIn EUR bnIn EUR bn
Litigation reserves Contingent liabilitiesMortgage repurchase demands/reserves
DemandsIn USD
1.8 1.8 5.0 5.0
DemandsReserves
In USD
1.5
2.0
0.5 0.6
31 D 2013 31 M 201431 Dec 2013 31 Mar 2014 31 Dec 2013 31 Mar 201431 Dec 2013 31 Mar 2014
— While litigation expenses were lower in the first quarter, the timing and size of litigation expenses going forward are unpredictable
— This includes obligations where an estimate can be made and outflow is more than remote but less than probable with respect to
— Net reserves up slightly as a result of an assessment of reserves even though mortgage repurchase demands remained g g p
— Net litigation reserves were essentially flat as compared to the fourth quarter
— Increases in reserves are partially offset by releases in matters which
p pmaterial and significant matters disclosed in our financial reporting
— Contingent liabilities increased due to developments in regulatory
pessentially flat as compared to the fourth quarter
— Treated as negative revenues in NCOU
AT1 Roadshow, 5 – 9 May 2014Deutsche BankTreasury / Investor Relations
financial transparency.
These materials and the information contained herein are not being issued and may not be distributed in the United States, Canada, Japan or Australia
28
ywere dismissed by the courts investigations

Reported and adjusted costsIn EUR bn
3 1 3 7 4 3 4 9 3 1
6.6 6.9 7.2 7.66.5
In EUR bnNon-CompensationCompensation and benefits
2013 2014
3.5 3.2 2.9 2.7 3.3
3.1 3.7 4.3 4.9 3.1
1Q 2Q 3Q 4Q 1Q
2013 2014
Adj. cost base 6,034 5,910 5,600 5,604 5,992(in EUR m) excludes:
Cost-to-Achieve 224 357 242 509 310Litigation 132 630 1,163 1,111 0
Policyholder benefits and claims 191 (7) 171 104 52
Other severance 10 42 14 2 27Remaining 32 17 24 277 85
(2)
(4)
(3)(1)
CIR (adjusted) 64% 72% 72% 85% 71%
Compensation ratio 38% 39% 38% 41% 40%
(4)
Note: Figures may not add up due to rounding differences(1) Includes smaller specific one-offs and impairments
AT1 Roadshow, 5 – 9 May 2014Deutsche BankTreasury / Investor Relations
financial transparency.
These materials and the information contained herein are not being issued and may not be distributed in the United States, Canada, Japan or Australia
29
(2) Includes impairment of goodwill and intangibles of EUR 79 m and a significant impact from correction of historical internal cost allocation(3) Includes impairment in NCOU(4) Adjusted cost base divided by reported revenues

Operating cost and OpEx development
1Q2014
1Q2014 vs. 1Q2013
In EUR bn
OpEx program to date
In EUR bnKey drivers:— Establishing new control function capabilities
FY2013
2H2012
Invested/achieved
1Q2014
4.5
4.02014 t t6 06 0 0 1
g p— Integrating platforms and enhancing end-to-end
(E2E) processes— Strengthening our regulatory framework— Change in compensation structure in anticipation
of CRD4(1)
2014 target
2014 target
2.32013 target
6.0
0.2
6.0
(0.3)
0.1
0,30.3
1.3
1.7
2.1
2013 target
(0.1)
0.4
Cumulativesavings
CumulativeCtA
0.5Adj. cost
base 1Q2014
Reg. demands and related
platf. improve-ment projects
FXOpExsavings
Adj. cost base
1Q2013
Other
AT1 Roadshow, 5 – 9 May 2014Deutsche BankTreasury / Investor Relations
financial transparency.
These materials and the information contained herein are not being issued and may not be distributed in the United States, Canada, Japan or Australia
savings CtA
30
Note: Figures may not add up due to rounding differences(1) 1Q2014 impact of EUR 50 m; FY2014 impact would be EUR 0.3 bn based on 1:2 ratio. If AGM does not approve 1:2 ratio (fixed compensation : variable), 2014 impact
is estimated to be approx. 650 million

Reconciliation of reported IFRS to adjusted non-GAAP – FY 20132013In EUR m (if not stated otherwise)
CB&S GTB DeAWM PBC C&A Core Bank NCOU Group
Revenues (reported) 13,526 4,069 4,735 9,550 (929) 30,951 964 31,915CVA / DVA / FVA 203 0 0 0 276 479 171 650
Revenues (adjusted) 13,729 4,069 4,735 9,550 (653) 31,430 1,135 32,565
Noninterest expenses (reported) 10 161 2 648 3 929 7 276 830 24 844 3 550 28 394
1
Noninterest expenses (reported) 10,161 2,648 3,929 7,276 830 24,844 3,550 28,394Cost‐to‐Achieve (313) (109) (318) (552) 7 (1,287) (45) (1,331)Litigation (1,142) (11) (50) (1) (536) (1,740) (1,296) (3,036)Policyholder benefits and claims (460) (460) (460)Other severance (26) (6) (5) (8) (20) (64) (5) (69)Remaining 0 (82) (38) (74) (94) (288) (62) (350)
Adjusted cost base 8,680 2,440 3,057 6,641 187 21,005 2,143 23,147
2
3
IBIT reported 3,159 1,107 782 1,555 (1,744) 4,858 (3,402) 1,456CVA / DVA / FVA 203 0 0 0 276 479 171 650Cost‐to‐Achieve 313 109 318 552 (7) 1,287 45 1,331Other severance 26 6 5 8 20 64 5 69Litigation 1,142 11 50 1 536 1,740 1,296 3,036Impairment of goodwill and other intangible assets 0 57 14 7 0 79 0 79
IBIT adjusted 4,843 1,290 1,170 2,123 (919) 8,507 (1,886) 6,621j ( ) ( )51% 14% 12% 23%
Total assets (reported; at period end, in EUR bn) 1,548 1,611Adjustment for additional derivatives netting (451) (458)
Adjustment for additional pending settlements netting and netting of pledged derivatives cash collateral (70) (70)
Adjustment for additional reverse repos netting/other (21) (17)
Total assets (adjusted; at period end in EUR bn) 1 005 1 066
4
5
Total assets (adjusted; at period end, in EUR bn) 1,005 1,066
Average shareholders' equity 56,080Average dividend accruals (646)
Average active equity 20,237 5,082 5,855 13,976 (0) 45,151 10,283 55,434
1 Credit Valuation Adjustments/Debit Valuation Adjustments/Funding Valuation Adjustments2 Includes CtA related to Postbank and OpEx.
AT1 Roadshow, 5 – 9 May 2014Deutsche BankTreasury / Investor Relations
financial transparency.
These materials and the information contained herein are not being issued and may not be distributed in the United States, Canada, Japan or Australia
31
3 Includes impa irment of goodwi l l and other intangible assets and other divis iona l speci fic cost one‐offs .4 Includes netting of cash col latera l received in rela tion to derivative margining.5 Includes netting of cash col latera l pledged in relation to derivative margining.

Reconciliation of reported IFRS to adjusted non-GAAP – FY 20122012In EUR m (if not stated otherwise)
CB&S GTB DeAWM PBC C&A Core Bank NCOU Group
Revenues (reported) 15,073 4,200 4,472 9,540 (975) 32,309 1,427 33,736CVA / DVA / FVA (350) 0 0 0 0 (350) 0 (350)
Revenues (adjusted) 14,723 4,200 4,472 9,540 (975) 31,959 1,427 33,386
Noninterest expenses (reported) 12,070 3,327 4,299 7,224 582 27,503 3,697 31,201
1
Noninterest expenses (reported) , , , , 27,503 , 31,201Cost‐to‐Achieve (304) (41) (105) (440) (1) (892) (13) (905)Litigation (790) (303) (64) (1) (457) (1,615) (992) (2,607)Policyholder benefits and claims (414) (414) (414)Other severance (102) (24) (42) (19) (55) (243) (4) (247)Remaining (1,174) (353) (368) (47) 0 (1,943) (421) (2,364)
Adjusted cost base 9,701 2,605 3,305 6,716 69 22,397 2,267 24,664
2
3
IBIT reported 2,904 665 154 1,519 (1,493) 3,749 (2,935) 814CVA / DVA / FVA (350) 0 0 0 0 (350) 0 (350)Cost‐to‐Achieve 304 41 105 440 1 892 13 905Other severance 102 24 42 19 55 243 4 247Litigation 790 303 64 1 457 1,615 992 2,607Impairment of goodwill and other intangible assets 1,174 73 202 15 (0) 1,465 421 1,886
IBIT adjusted 4,923 1,106 568 1,995 (980) 7,613 (1,505) 6,109
Total assets (reported; at period end, in EUR bn) 1,909 2,022Adjustment for additional derivatives netting (692) (705)
Adjustment for additional pending settlements netting and netting of pledged derivatives cash collateral (82) (82)
Adjustment for additional reverse repos netting/other (31) (26)
Total assets (adjusted; at period end in EUR bn) 1 104 1 209
4
5
Total assets (adjusted; at period end, in EUR bn) 1,104 1,209
Average shareholders' equity 55,597Average dividend accruals (670)
Average active equity 20,283 4,133 5,907 12,177 (0) 42,501 12,426 54,927
1 Credit Valuation Adjustments/Debit Valuation Adjustments/Funding Valuation Adjustments2 Includes CtA related to Postbank and OpEx.
AT1 Roadshow, 5 – 9 May 2014Deutsche BankTreasury / Investor Relations
financial transparency.
These materials and the information contained herein are not being issued and may not be distributed in the United States, Canada, Japan or Australia
32
3 Includes impa irment of goodwi l l and other intangible assets and other divis iona l speci fic cost one‐offs .4 Includes netting of cash col latera l received in rela tion to derivative margining.5 Includes netting of cash col latera l pledged in relation to derivative margining.

Reconciliation of reported IBIT to adjusted IBIT –FY 2004 through 2011FY 2004 through 2011Reconciliation of Corebank IBIT1 2011 2010 2009 2008 2007 2006 2005 2004
In EUR m
Corebank IBIT reported 7,478 7,524 4,746 -6,935 7,449 7,979 5,063 3,844
Cost‐to‐Achieve/Severance/Restructuring2 514 527 629 555 212 344 815 678
Material Litigation 302 183 138 191 75 121 659 275
Impairment of goodwill and other intangible assets 0 29 -285 585 74
Corebank IBIT adjusted 8,294 8,263 5,228 -5,605 7,810 8,444 6,537 4,796
1 Corebank i s Group excluding NCOU for 2011 and Group excluding ex‐CI for 2004‐2010. For 2007‐2011 numbers are based on IFRS, prior periods are based on U.S. GAAP.
2 Includes Cost‐to‐Achieve and Other severance for 2011 and Restructuring activi ties and Severance for 2004‐2011
Full Year 2007 IBIT reconciliation3 CB&S GTB AWM PBC C&A Core Bank ex-CI Group
In EUR m
IBIT reported 4,202 945 913 1,146 243 7,449 1,299 8,749
Severance/Restructuring 96 6 20 26 63 212 0 212Material Litigation 14 0 60 0 0 75 91 166Material Litigation 14 0 60 0 0 75 91 166Impairment of goodwill and other intangible assets 0 0 74 0 0 74 54 128
IBIT adjusted 4,312 952 1,068 1,172 306 7,810 1,445 9,254
3 Based on International Financia l Reporting Standards (IFRS)
Full Year 2004 IBIT reconciliation4 CB&S GTB AWM PBC C&A Core ex CI GroupFull Year 2004 IBIT reconciliation CB&S GTB AWM PBC C&A Bank ex-CI Group
In EUR m
IBIT reported 2,507 254 414 971 -302 3,844 186 4,029
Severance/Restructuring 425 44 138 60 11 678 4 682Material Litigation 275 0 0 0 0 275 101 376Impairment of goodwill and other intangible assets 0 0 0 0 0 0 0 0
AT1 Roadshow, 5 – 9 May 2014Deutsche BankTreasury / Investor Relations
financial transparency.
These materials and the information contained herein are not being issued and may not be distributed in the United States, Canada, Japan or Australia
33
IBIT adjusted 3,207 297 552 1,031 -291 4,796 291 5,087
4 Based on U.S. General Accepted Accounting Principles (U.S. GAAP)


