1
DETERMINATION OF HESPERIDIN IN FOOD BY ULTRA PERFROMANCE
LIQUID CHROMATOGRAPHY
1.1 Introduction
1.1.1 Ultra Performance Liquid Chromatography, UPLC
For the last 30 years of chemical analysis, High Performance Liquid
Chromatography (HPLC) had been considered to be a proven technique which was used
in worldwide laboratories. This technique involved the evolution of packing materials
of stationary phase to effect separation.
The principles of separation involved the relationship between linear velocity (flow
rate) and plate height (HETP or column efficiency). One of the variables would be
particle size of the packed column and the chromatographic performance can be
investigated using established Calibration Plot.
Based on van Deemter equation (Deemter, 1956), when the particle size decreased,
a significant gain was observed in chromatographic performance efficiency. By using
smaller particles in packed column, speed and peak capacity can be increased. With the
application of these principles, Ultra Performance Liquid Chromatography, UPLC is
established.
Chromatographic analysis separation can be performed using smaller particles
packed columns and higher flow rates in Ultra Performance Liquid Chromatography,
UPLC, the effected analysis would had an increased in speed and higher sensitivity.
By using the Instrumentation of Acquity, UPLC, H-Class from Waters (Waters,
2010); this instrument used sub 2 µm particle columns (Acquity UPLC HSS T3, 1.8
micron, 2.1 x 100 mm) in a system that is designed to maximum the advantages of this
column.

2
The UPLC was designed to sustain a pressure tolerant sub 2 µm particle column
which was stabled in a wide pH and temperature range. This made the UPLC system
more flexible for high efficiency of separations with reduced cycle times and improved
resolution and sensitivity.
The UPLC column, Acquity UPLC HSS T3, 1.8 micron, 2.1 x 100 mm featured an
eCord Technology that electronically stored all experiments information which include
certificate of analysis, dates of installation and usage, number of injections, number of
sample sets, maximum temperature and pressure which was very useful for analysis
traceability purpose.
The solvent utilization in UPLC application was considered very less compared with
HPLC. The solvent consumption for this analysis consumed less 95% than HPLC
which was considered more efficient and environment friendly.
The UPLC instrument also equipped with column management with lowest
dispersion performance and precise temperature management. This was considered as a
critical factor especially for Hesperidin analysis that involved a stable column
temperature of 40oC. An active solvent pre-heaters is equipped in this system that
ensured effective consistent thermal performance from system to system without
additional volume and dispersion that were typical of passive style heat exchangers.
These pre-heaters were integrated to the column compartment with robust and pressure-
tolerant fittings.
The stacked multi-position Column Manager in this system provided good thermal
flexibility, fast heating and cool down times. Column can be switched automatically
among multiple columns with a column bypass and waste channel for simple, fast
solvent changeover and rapid equilibrium.
3
1.1.2 Hesperidin
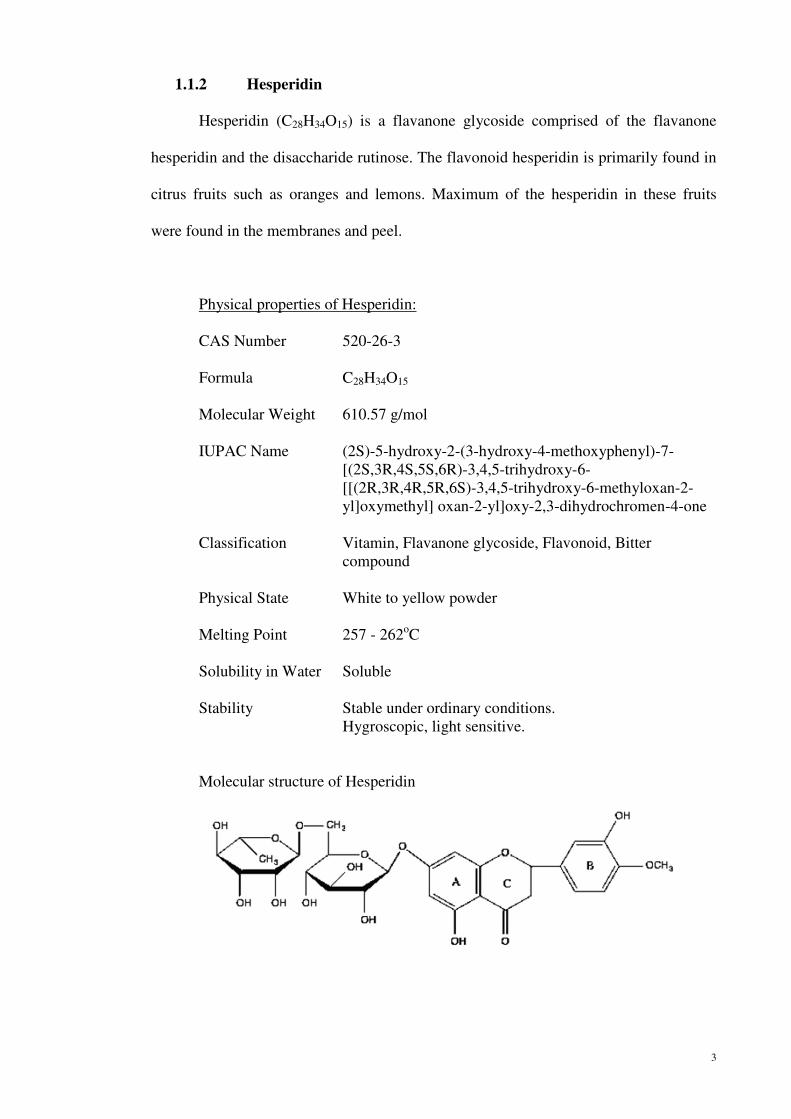
Hesperidin (C28H34O15) is a flavanone glycoside comprised of the flavanone
hesperidin and the disaccharide rutinose. The flavonoid hesperidin is primarily found in
citrus fruits such as oranges and lemons. Maximum of the hesperidin in these fruits
were found in the membranes and peel.
Physical properties of Hesperidin:
CAS Number 520-26-3
Formula C28H34O15
Molecular Weight 610.57 g/mol
IUPAC Name (2S)-5-hydroxy-2-(3-hydroxy-4-methoxyphenyl)-7-
[(2S,3R,4S,5S,6R)-3,4,5-trihydroxy-6-
[[(2R,3R,4R,5R,6S)-3,4,5-trihydroxy-6-methyloxan-2-
yl]oxymethyl] oxan-2-yl]oxy-2,3-dihydrochromen-4-one
Classification Vitamin, Flavanone glycoside, Flavonoid, Bitter
compound
Physical State White to yellow powder
Melting Point 257 - 262oC
Solubility in Water Soluble
Stability Stable under ordinary conditions.
Hygroscopic, light sensitive.
Molecular structure of Hesperidin
4
Hesperidin was the most important flavanone of Citrus sp. It had been found
that Hesperidin significantly increased high density lipoprotein (HDL) and lowered
cholesterol low density lipoprotein (LDL), total lipid and triglyceride levels in
normolipidemic rats and in rats with diet- and triton-induced hyperlipidemia (Monforte,
et al., 1995).
Hesperidin was evaluated for in its administration and effects on
antihypertensive effect on spontaneously hypertensive rats found that Hesperidin
improved serum cholesterol composition (Ohtsuki, et al., 2003).
It was found that Hesperidin also featured anti-infection property that it
suppressed plasma levels of tumor necrosis factor alpha (TNF-alpha) and high mobility
group box chromosomal protein 1 (HMGB-1), decreased the number of apoptotic cells
in livers and normalized the activated states of blood coagulation factors such as
prothrombin time and platelet numbers caused by infection (Kawaguchi, et al., 2004)
Hesperidin level of 50 and 100 ppm was found to have anti-inflammatory
activity and can be a potential therapeutically used as a mild anti-inflammatory agent
(Emim, et al., 1994).
Hesperidin was observed with its sedative activity with a possible beneficial use
of Hesperidin with benzodiazepines and pain management (Loscalzo, et al., 2008).
Hesperidin displayed nutrigenomic effect on altered leukocyte gene expression
to an anti-inflammatory and anti-atherogenic profile after 4 weeks of orange juice
consumption. (Deval, et al., 2011).
It is also observed that Hesperidin reduced high glucose-induced intracellular
adhesion molecule-1 (HG-ICAM-1) expression via the p38 mitogen-activated protein
kinases (MAPK) signaling pathway, contributing to the inhibition of monocyte adhesion
to endothelial cells (Kim, et al., 2011).

5
In the examination of Hesperidin effect in regulating bone metabolism,
Hesperidin was found with higher efficacy at a lower plasma concentration (Habauzit,
et al., 2011).
It was observed that Hesperidin consumption resulted in a significant increase in
bone mineral density (BMD) according to the study of “Hesperidin inhibits
ovariectomized-induced osteopenia and shown differential effects on bone mass and
strength in young and adult intact rats” (Horcajada, et al., 2008).
With the amount of 50 and 100 ppm of Hesperidin treatment, it significantly
attenuated histopathological alterations on the ischemic reperfusion cerebral injury-
induced memory dysfunction (Gaur & Kumar, 2010).
Study had been conducted by using Hesperidin 150 mg twice or three times
daily for 30 days found that bleeding bladder varicose veins that bled the haematuria
disappeared (Loarca, 2003).
Hesperidin had been confirmed to have hypoglycemic and hypolipidemic effects
by altering the activities of glucose-regulating enzymes and reducing the levels of lipids
in the serum and liver of the GK rats, according to “Hypoglycemic and hypolipidemic
effects of hesperidin and cyclodextrin-clathrated hesperidin in Goto-Kakizaki rats with
type 2 diabetes” (Akiyama, et al., 2009).
Based on the published studies, it was found that Hesperidin is essential to aide
in human health maintenance. These benefits included cholesterol lowering, anti-
hypertension, anti-infection, anti-inflammatory activity, sedative and antinociceptive
effects, nutrigenomic effect, endothelial cells effect, plasma concentration efficacy,
bone mineral density increased and treatment cure of memory dysfunction, bleeding
bladder varices and diabetes.

6
1.1.3 Introduction to samples subject
1.1.3.1 Calamansi
Scientific Classification
Kingdom : Plantae
Order : Sapindales
Family : Rutaceae
Genus : Citrofortunella
Species : C. mitis
Citrofortunella mitis is a shrub or small tree growing to 3 – 6 metres. The fruit
of the Calamansi was resembled by a small, round lime, usually 25-35 mm in diameter.
The center pulp and juice was the orange color of a tangerine with a very thin green
(unripe form) or orange (fully ripe) colored peel.
Calamansi, was under fruit tree in the family Rutaceae native to the Philippine
Islands. Calamansi was originated from China and speeded throughout Southeast Asia,
India, Hawaii, the West Indies, Central and North America (Morton, 1987).
The plant is characterized by wing-like appendages on the leaf stalks and white
or purplish flowers. Its fruit had a spongy or leathery rind with juicy pulp that is divided
into sections.
The fruit was indigenous and widely cultivated in the Philippines. Calamansi
was available year round in the Philippines and usually appeared in unripened state as a
dark green fruit and it turned into tangerine orange color when it ripen.

7
1.1.3.2 Honey Murcott Tangerine/Thai Honey Tangerine
Scientific Classification
Kingdom : Plantae
Order : Sapindales
Family : Rutaceae
Genus : Citrus
Species : C. tangerine
Tangerine (Citrus tangerina) appeared as an orange-colored citrus fruit which
was closely related to mandarin orange (Citrus reticulata). Tangerines were smaller
than common oranges, and were usually easier to peel and split into segments. The taste
was considered less sour, but sweeter and stronger, than that of an orange (Pittman &
Davis, 1999).
Honey tangerines (murcotts as it is called in the industry) were the most widely
grown tangerine (Stephen & Larry, 2012). The Ponkan or Chinese honey tangerine was
among the very popular fruit around Melrose, Florida, where it was introduced from
China.
1.1.3.3 Kaffir Lime
Scientific Classification
Kingdom : Plantae
Order : Sapindales
Family : Rutaceae
Genus : Citrus
Species : C. hystrix
8
Citrus hystrix appeared as a thorny bush, 5 - 10m tall, with aromatic and
distinctively shaped "double" leaves. The kaffir lime featured a rough, bumpy green
fruit. The green lime fruit is distinguished by its bumpy exterior and its small size
(approx. 4 cm wide).
Citrus hystrix, commonly known in English as kaffir lime, is a fruit native to
Indochinese and Malesian ecoregions in India, Philippines, Indonesia, Malaysia and
Thailand, and adjacent countries.
1.1.3.4 Key Lime
Scientific Classification
Kingdom : Plantae
Order : Sapindales
Family : Rutaceae
Genus : Citrus
Species : C. aurantiifolia
C. aurantiifolia appeared as a shrubby tree, to 5 m, with many thorns. Its trunk
rarely grew straight, with many branches, often originated far down on the trunk. The
leaves were ovate in shape, 2.5 – 9 cm long, resembled orange leaves.
The flowers were 2.5 cm in diameter and appeared as yellowish white with a
light purple tinge on the margins. Flowers and fruits were appeared throughout the year
and particularly abundant from May to September in the Northern Hemisphere (Golob,
1999) (Morton, 1987).

9
1.1.3.5 Korea Valencia/ South Africa Orange
Scientific Classification
Kingdom : Plantae
Order : Sapindales
Family : Rutaceae
Genus : Citrus
Species : C. sinensis
The orange was the fruit of the citrus species Citrus sinensis in the family
Rutaceae [United States Department of Agriculture. (2013). Citrus sinesis (L) Osbeck
(pro sp.) (maxima and reticulata) sweet orange . Retrieved June 4, 2013 from
http://plants.usda.gov/java/profile?symbol=CISI3]. The fruit of the Citrus sinensis is
called sweet orange. The orange was a hybrid between pomelo (Citrus maxima) and
mandarin (Citrus reticulata), cultivated since ancient times (Nicolosi, et al., 2000).
The orange was originated in Southeast Asia. Orange trees were widely grown
in tropical and subtropical climates for its sweet fruit, which can be eaten fresh or
processed to obtain juice, and for its fragrant peel [United States Department of
Agriculture. (2006). Citrus sinensis information from NPGS/GRIN. Retrieved June 4,
2013 from http://www.ars-grin.gov/cgi-bin/npgs/html/taxon.pl?10782].
There were a few varieties for orange; the Valencia orange is considered a late-
season fruit, and it was a popular variety when navel oranges were out of season.

10
1.1.3.6 Lemon
Scientific Classification
Kingdom : Plantae
Order : Sapindales
Family : Rutaceae
Genus : Citrus
Species : C. limon
The lemon (Citrus limon) appeared as a small evergreen tree native to Asia, and
the tree's ellipsoidal yellow fruit. The juice of the lemon contained about 5% to 6% of
citric acid, which gave lemons a sour taste.
The lemon was a hybrid between sour orange and citron based on a study
conducted on the genetic origin of the lemon (Gulsen & Roose, 2001).
1.1.3.7 Peel Fresh Orange Juice/ Tropicana Twister Orange Juice
Commercial orange juices that were purchased from the market
1.1.3.8 Red Capsicum
Scientific Classification
Kingdom : Plantae
Order : Solanales
Family : Solanales
Genus : Capsicum
Species : Capsicum annuum
11
Capsicum annuum, (Bell pepper) was known as sweet pepper or a pepper (in the
United Kingdom and Ireland) and capsicum (in India, Australia and New Zealand. The
cultivars of the plant produced fruits in different colors, including red, yellow, orange,
green, chocolate/brown, vanilla/white, and purple.
The Peppers was originated in Mexico, Central America and northern South
America.
1.1.3.9 Red Chili
Scientific Classification
Kingdom : Plantae
Order : Solanales
Family : Solanaceae
Genus : Capsicum
Species : Capsicum frutescens
Capsicum frutescens was a species of chili pepper that is considered to be part of
the species Capsicum annuum [Missouri Botanical Garden. (2010). The Plant List.
Retrieved June 4, 2013 from http://www.theplantlist.org/tpl/record/kew-2698415].
Capsicum frutescens can be cultivated annual or short-lived perennial plants.
Its flowers were white with a greenish white or greenish yellow corolla, and
insect- or self-pollinated. The plants' berries typically grew erectly; ellipsoid-conical to
lanceoloid shaped.

12
Capsicum frutescens usually were very small and pungent, 10 – 20 mm long and
3–7 mm in diameter (Solanaceae, 2011). Its fruit typically grew a pale yellow and
matured to a bright red. The Capsicum frutescens species were originated in South or
Central America.
1.1.3.10 Red Onion
Scientific Classification
Kingdom : Plantae
Order : Asparagales
Family : Amaryllidaceae
Genus : Allium
Species : Allium cepa
Red onions (purple onions) were cultivars of the onion with purplish red skin
and white flesh tinged with red. Red onions appeared to be medium to large in size and
have a mild to sweet flavor.
Red onions were available throughout the year. The red color of the red onion
came from anthocyanidins such as cyanidin and it had high flavonoids (Gennaro, et al.,
2002). The onion plant typically grew to a height of 15 to 45 cm. The leaves were
blueish-green and grew alternately in a flattened, fan-shaped swathe. They were fleshy,
hollow and cylindrical, with one flattened side. They were at their broadest about a
quarter of the way up beyond which they tapered towards a blunt tip. The base of each
leaf was a flattened and white sheath that grew out of a basal disc. From the underside
of the disc, a bundle of fibrous roots extended for a short way into the soil. As the

13
onion matured, food reserves began to accumulate in the leaf bases and the bulb of the
onion swells (Brickell & Christopher, 1992).
The red onion flower-head appeared as the form of a globular umbel of white
flowers with parts in sixes. The seeds were glossy black and triangular in cross section
(Brickell & Christopher, 1992).
1.1.4 Objective
The objectives of this study are as follows:
(a) To validate the methods used in term of linearity, accuracy/recovery studies,
precision/repeatability, precision/ intermediate precision, limit of detection and
quantitation before applying for Hesperidin study.
(b) To evaluate Hesperidin level in citrus fruits, vegetables and commercial fruit
juices using Ultra Performance Liquid Chromatography with UV detector at 285
nm
14
2.1 Literature Review
2.1.1 Review of analytical method for “DETERMINATION OF NARINGIN
AND HESPERIDIN IN CITRUS FRUIT BY HIGH-PERFORMANCE
LIQUID CHROMATOGRAPHY. THE ANTIOXIDANT POTENTIAL OF
CITRUS FRUIT”
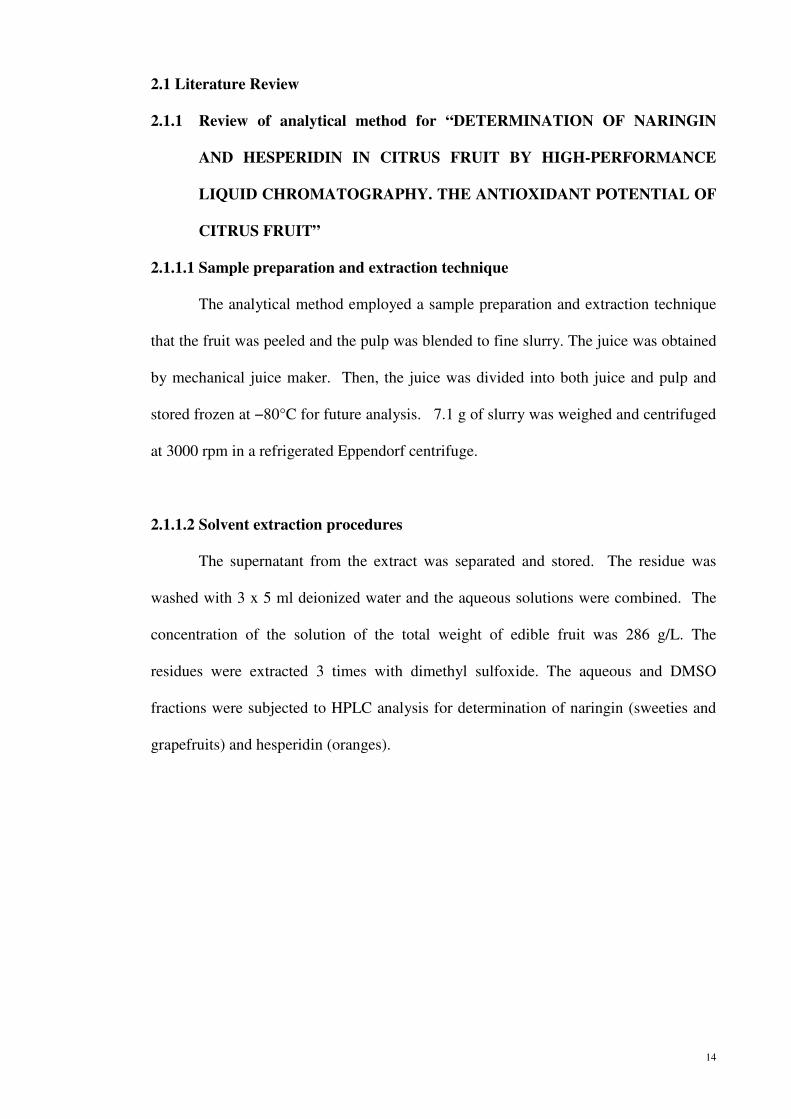
2.1.1.1 Sample preparation and extraction technique
The analytical method employed a sample preparation and extraction technique
that the fruit was peeled and the pulp was blended to fine slurry. The juice was obtained
by mechanical juice maker. Then, the juice was divided into both juice and pulp and
stored frozen at −80°C for future analysis. 7.1 g of slurry was weighed and centrifuged
at 3000 rpm in a refrigerated Eppendorf centrifuge.
2.1.1.2 Solvent extraction procedures
The supernatant from the extract was separated and stored. The residue was
washed with 3 x 5 ml deionized water and the aqueous solutions were combined. The
concentration of the solution of the total weight of edible fruit was 286 g/L. The
residues were extracted 3 times with dimethyl sulfoxide. The aqueous and DMSO
fractions were subjected to HPLC analysis for determination of naringin (sweeties and
grapefruits) and hesperidin (oranges).

15
2.1.1.3 HPLC Instrumentation
The Hesperidin was analyzed using HPLC Shimadzu (Kyoto, Japan) DGU-14A
system equipped with a model LC-10AT-VP liquid chromatography pump, an
autoinjector, and a diode-array detector. The peak areas calculation was performed
using Shimadzu software. Compounds were separated on a Spherisorb ODS1 column
from Waters Instruments (MA, USA).
The analysis was using a gradient prepared from 2% aqueous acetic acid, pH
2.58 (component A) and acetonitrile (component B). The composition of the gradient,
with 100% component A at 0 – 15 minutes. At time 15 minutes, the composition
changed to 70% of component A and 30% of component B. The analysis continued
until 50 minutes. At time 50 minutes, 100% of component B is utilized for another 5
minutes. At time 60 minutes, a 100% switch of component B to component A was
performed and the analysis ended at 90 minutes.
The injection volume utilized for this analysis was 20 µL (Hamilton syringe;
Reno, NV, USA) with the mobile phase flow rate 1 mL/min, the oven temperature was
set at 40°C, and the detection wavelength at 285 nm.
Commercial hesperidin samples were also measured under the same conditions.

16
2.1.1.4 Sample Preparation for Analysis of Polyphenols and Determination of
Antioxidant Potential
The extraction and hydrolysis of total polyphenols was performed using 50 mg
of lyophilizate and were extracted with 5 ml of 1.2 M of hydrochloric acid in 50:50 %
v/v of methanol and water. The samples were vortex mixed for one minute and heated
at 90°C for 3 hours. The vortex mixing was repeated every 30 minutes. The samples
were cooled, diluted to 10 mL with methanol, and centrifuged for 5 minutes at 4000 g
with a bench-top centrifuge, to remove solids (Vinson, et al., 2001). Extraction of
polyphenols for determination of antioxidant potential was also performed with water,
acetone, methanol, and DMSO.
Total polyphenols were analyzed using Folin–Ciocalteu method and measured at
765 nm with gallic acid as standard (Singleton, et al., 1999). The utilization of Trolox-
equivalent antioxidant capacity (TEAC) is based on the ability of antioxidants to
scavenge the blue-green ABTS·+ radical cation (2,2′-azinobis(3-ethylbenzothiazoline-
6-sulfonic acid) compared with the scavenging ability of the water-soluble vitamin E
analogue trolox.
The ABTS·+
radical cation was generated by reaction of 250 µM ABTS with 40
µM K2S2O8. The absorbance was monitored exactly 1 and 6 minutes after addition of
990 µL ABTS·+
solution to 10 µL of fruit extracts or trolox standards with final
concentration of 0 – 20 µM in methanol or phosphate-buffered saline pH 7.4. The
decrease in absorbance at wavelength 734 nm was calculated and plotted as a function
of extract concentration, or of trolox for standard reference data.
For the modified assay, ABTS was dissolved in 20 mM acetate buffer of pH 4.5
and prepared with potassium persulfate. The absorbance was monitored exactly 1 and 6
minutes after addition of 990 µL ABTS·+
solution to 10 µL of fruit extracts or trolox
standards with final concentration of 0 – 20 µM in methanol or phosphate-buffered

17
saline pH 7.4. The decrease in absorbance at wavelength 734 nm was calculated and
plotted as a function of extract concentration, or of trolox for standard reference data.
The ability of the antioxidants in the fruit samples to reduce ferric tripyridyl-
triazine (Fe3+
-TPTZ) to the ferrous form (Fe2+
) which absorbed light at 593 nm was
measured using the ferric-reducing antioxidant power (FRAP) assay. The complexes of
the ferrous and ferric forms of iron with TPTZ were the main products of this reaction.
FRAP was calculated by plotting a standard curve of absorbance against concentration
of Fe2+
standard solution or trolox (Benzie & Strain, 1996)( Szeto, et al., 2002).
In the 1,1-diphenyl-2-picrylhydrazyl radical (DPPH) assay the volume of fruit
extracts in different test tubes was adjusted to 100 µL by addition of Methanol and a
methanolic solution of 5 µL of 0.1 mM 1,1-diphenyl-2-picrylhydrazyl radical was
added to the tubes. The control was prepared in the same way but without extract, and
Methanol was used for baseline correction. Changes in the absorbance of the samples
were measured at 517 nm. Butylated hydroxyanisole was used for comparison (Singh
RP, et al., 2002)( Ozgen, et al., 2006).
Three antioxidant assays (DPPH, ABTS and FRAP) were compared after the
same periods of time at 10, 30, 60, and 120 minutes using methanolic extracts of the
fruit of the same concentration. For each antioxidant assay trolox was used to establish
a standard curve. All data were then were expressed as trolox equivalents (TE).
50 g of pulp was weighed and extracted with water, methanol, acetone, and
dimethyl sulfoxide for the oxygen radical absorbance capacity (ORAC) assay. The
solutions were combined and subjected to ORAC assay (Huang, et al., 2002) with
minor modifications on a fluorescent plate reader (Synergy HT, Bio-Tek Instruments,
Winooski, VT, USA). The results were expressed as µmol trolox equivalent (TE) per
100 g fresh weight (FW).

18
3.1 Sampling, transport, processing and storage of samples
3.1.1 Sampling
Food samples were taken from the food market randomly in regardless of
Origin
3.1.2 Sample Transportation
Samples were packed in original containers or Polythene bags during
transportation to prevent degradation
3.1.3 Sample preparation and processing prior to analysis
The sample subject was identified by product type. Samples from
perishable such as fruits or vegetables were prepared fresh prior analysis.
Commercial fruit juices was stored at refrigerator at temperature below 4oC prior
analysis
3.2 Glassware
All glassware were soaked overnight in 2% Decon 90 (Potassium
Hydroxide) diluted with water. Then it was cleaned thoroughly with brush and
rinsed 3 times with distilled water. The glassware was oven dried at 105oC a
day prior analysis.

19
3.3 Standards, calibration solution, etc.
3.3.1 Identity, purity, and storage of standards
Pure standard of Hesperidin is received from Sigma on 19 November 2012. The
Hesperidin came with a product number of H5254, part code 1001131563 and lot
number 011M1865V.
Hesperidin standard appeared to be a light beige color powder. Hesperidin
appeared as slightly hazy when solubility in 50 mg/L of pyridine was conducted.
It was found that the pure standard was extracted from the peel of Citrus lemon
and Citrus sinesis originated from Spain.
The assayed purity of this Hesperidin standard was 95% with recommended
storage temperature of 2 – 8 oC.
Figure 3.1 illustrated the FTIR spectrum of Hesperidin pure standard. It is
observed that the maximum IR absorption was strong at 1260 cm−1
(methyl group),
750–800 cm−1
(aromatic group), 3000-2900 cm−1
(O-H group), 1680–1690 cm−1
(C=O
group).
Figure 3.1 FTIR Spectrum of Hesperidin Pure Standard

20
3.3.2 Preparation and storage of stock standards
Hesperidin Pure Standard was obtained from Sigma (Spain, Purity 95%).
A low standard stock was prepared by weighing 58.2 mg of Hesperidin Pure
Standard and diluted to 50 ml of 72:28% v/v with 5mM ammonium acetate, pH
4.45 and acetonitrile. The final concentration of this low standard Hesperidin
stock would be 1105.8 ppm.
Another set of high standard stock was prepared by weighing 2637.7 mg
of Hesperidin Pure Standard and diluted to 50 ml of 72:28% v/v with 5mM
ammonium acetate, pH 4.45 and acetonitrile. The final concentration of this
high standard Hesperidin stock would be 50116.3 ppm.
Both low and high Hesperidin stock was kept in an amber glass bottle
and stored at 2 – 8 oC.
3.3.3 Preparation, use and storage of working standards
Hesperidin working standard was prepared by weighing accurate amount
of stock standard and diluted to corresponding concentration level with 72:28%
v/v with 5 mM ammonium acetate, pH 4.45 and acetonitrile as illustrated in
Table 3.1
The low working Hesperidin standard consisted of 4.97 ppm, 62.79 ppm,
108.68 ppm, 190.65 ppm, 326.73 ppm and 1105.80 ppm. The high working
Hesperidin standard consisted of 5610.83 ppm, 10140.08 ppm and 50116.30
ppm.

21
Table 3.1 Low & High Working Standard
No. Working Standard Concentration (ppm)
1 Low 4.97
2 Low 62.79
3 Low 108.68
4 Low 190.65
5 Low 326.73
6 Low 1105.80
7 High 5610.83
8 High 10140.08
9 High 50116.30
All low and high working Hesperidin standards was kept in an amber
glass bottle and stored at 2 – 8 oC.
3.4 Extraction and concentration
3.4.1 Extraction conditions
This study employed a sample preparation and extraction technique that
the whole fruit was extracted using Fruit Juice Extractor at ambient temperature
and the obtained juice was filtered with 0.22 micron filter and stored at 2 – 8 oC
prior analysis as illustrated in Table 3.2.
The Hesperidin evaluation was performed at 3 different group such as
fruits (Citrus origin), vegetables and commercial fruit juice. The fruits (Citrus
origin) under analysis were Calamansi, Honey Murcott Tangerine, Kaffir Lime,

22
Key Lime, Korea Valencia, Lemon, South Africa Orange and Thai Honey
Tangerine.
The vegetables under analysis were Red Capsicum, Red Chili and Red
Onion. As for the analysis of commercial fruit juices, it was randomly picked
from the available market.
Table 3.2 Extraction Condition & Temperature for Sample Subject
No. Product Type Extraction Condition Extraction
Temperature
1 Calamansi Fruit Whole fruit was
extracted using Fruit
Juice Extractor and
filter through 0.22
micron filter
Ambient
2 Honey Murcott
Tangerine
Fruit
3 Kaffir Lime Fruit
4 Key Lime Fruit
5 Korea Valencia Fruit
6 Lemon Fruit
7 Peel Fresh
Orange Juice
Commercial
fruit juice
Directly filter through
0.22 micron filter
Ambient
8 Red Capsicum Vegetable Whole vegetable was
extracted using Fruit
Juice Extractor and
filter through 0.22
micron filter
Ambient
9 Red Chili Vegetable
10 Red Onion Vegetable
11 South Africa
Orange
Fruit Whole fruit was
extracted using Fruit
Juice Extractor and
filter through 0.22
micron filter
Ambient
12 Thai Honey
Tangerine
Fruit
13 Tropicana
Twister Orange
Juice
Commercial
fruit juice
Directly filter through
0.22 micron filter
Ambient
23
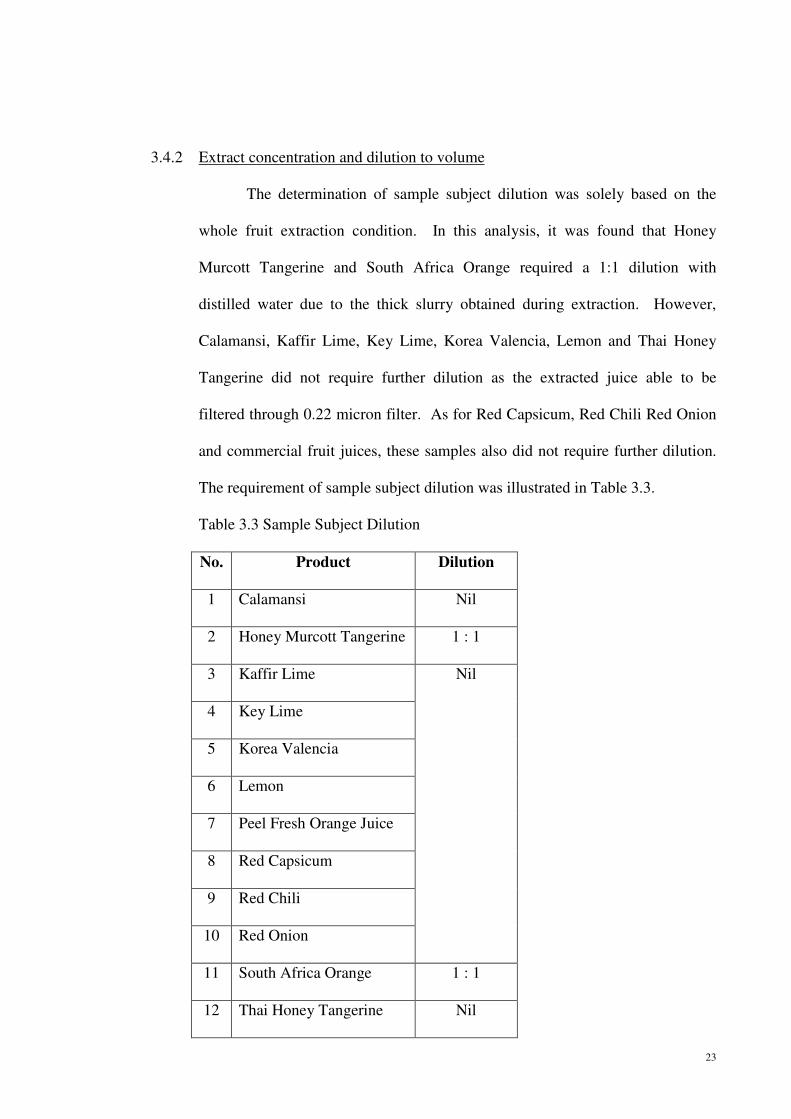
3.4.2 Extract concentration and dilution to volume
The determination of sample subject dilution was solely based on the
whole fruit extraction condition. In this analysis, it was found that Honey
Murcott Tangerine and South Africa Orange required a 1:1 dilution with
distilled water due to the thick slurry obtained during extraction. However,
Calamansi, Kaffir Lime, Key Lime, Korea Valencia, Lemon and Thai Honey
Tangerine did not require further dilution as the extracted juice able to be
filtered through 0.22 micron filter. As for Red Capsicum, Red Chili Red Onion
and commercial fruit juices, these samples also did not require further dilution.
The requirement of sample subject dilution was illustrated in Table 3.3.
Table 3.3 Sample Subject Dilution
No. Product Dilution
1 Calamansi Nil
2 Honey Murcott Tangerine
1 : 1
3 Kaffir Lime Nil
4 Key Lime
5 Korea Valencia
6 Lemon
7 Peel Fresh Orange Juice
8 Red Capsicum
9 Red Chili
10 Red Onion
11 South Africa Orange
1 : 1
12 Thai Honey Tangerine
Nil
24
13 Tropicana Twister Orange
Juice
Nil
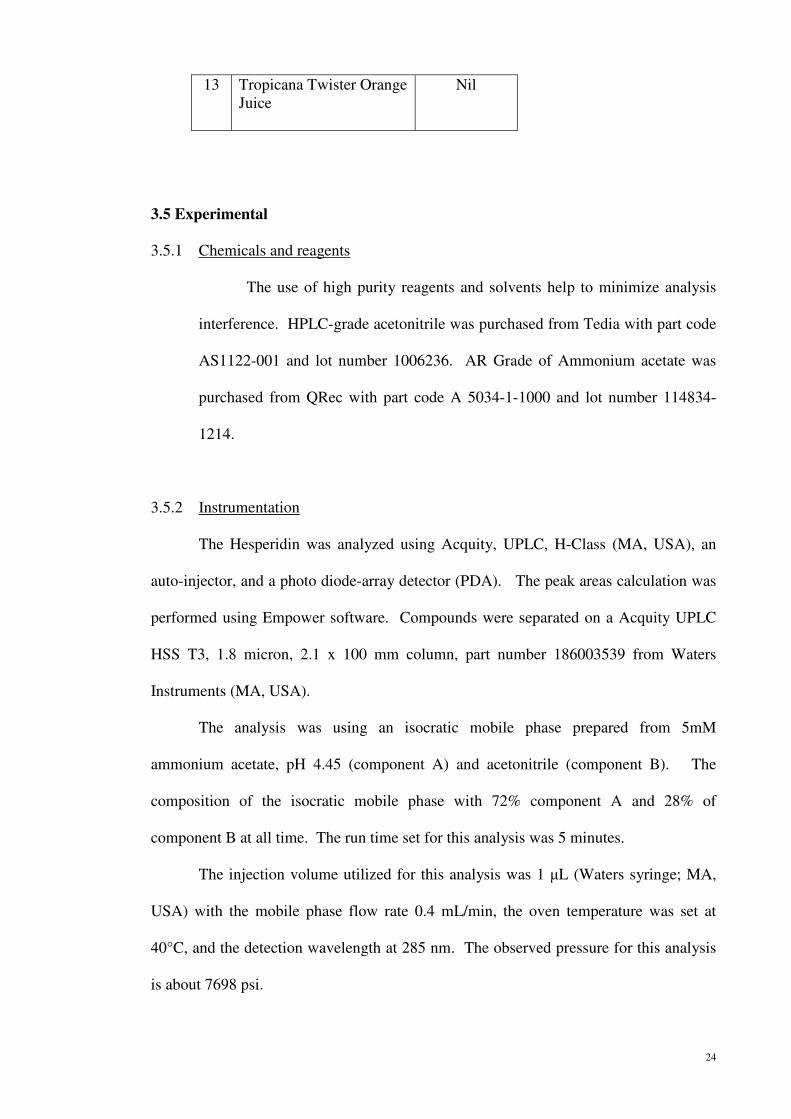
3.5 Experimental
3.5.1 Chemicals and reagents
The use of high purity reagents and solvents help to minimize analysis
interference. HPLC-grade acetonitrile was purchased from Tedia with part code
AS1122-001 and lot number 1006236. AR Grade of Ammonium acetate was
purchased from QRec with part code A 5034-1-1000 and lot number 114834-
1214.
3.5.2 Instrumentation
The Hesperidin was analyzed using Acquity, UPLC, H-Class (MA, USA), an
auto-injector, and a photo diode-array detector (PDA). The peak areas calculation was
performed using Empower software. Compounds were separated on a Acquity UPLC
HSS T3, 1.8 micron, 2.1 x 100 mm column, part number 186003539 from Waters
Instruments (MA, USA).
The analysis was using an isocratic mobile phase prepared from 5mM
ammonium acetate, pH 4.45 (component A) and acetonitrile (component B). The
composition of the isocratic mobile phase with 72% component A and 28% of
component B at all time. The run time set for this analysis was 5 minutes.
The injection volume utilized for this analysis was 1 µL (Waters syringe; MA,
USA) with the mobile phase flow rate 0.4 mL/min, the oven temperature was set at
40°C, and the detection wavelength at 285 nm. The observed pressure for this analysis
is about 7698 psi.
25
Hesperidin samples of fruits, vegetables and commercial fruit juice origin were
also measured under the same conditions.
3.5.3 Preparation of mobile phase
5 mM ammonium acetate, pH 4.45 was prepared by weighing an
accurate amount of 0.3854 g ammonium acetate and diluted to 1L with distilled
water. The buffer was adjusted to pH 4.45 with acetic acid.
The mobile phase that used for this analysis was prepared by adding 280
ml of HPLC-grade acetonitrile in 1000 ml of 5 mM ammonium acetate, pH 4.45
(28:72, %v/v). Then, the mobile phase was filtered under a vacuum through
0.22 micron nylon filters and degassed before use.

26
3.6 Results & Discussion
3.6.1 Validation of the chromatographic method
3.6.1.1 Linearity and range
Linearity was determined by using low and high Hesperidin working
standard at nine different concentrations between 4.97 and 50116.30 ppm. The
slope and intercept values together with relative standard deviations were
determined using the regression analyses. The responses of Hesperidin were
linear in the range of study with regression coefficients of 0.9903. The results
obtained were illustrated in Table 3.4 and Figure 3.2.
Table 3.4 Results of assessment of the linearity of the UPLC method for the assay of
Hesperidin employing the analytical working standard dissolved in mobile phase
Concentration
(ppm)
Peak area as mean of
6 injections (n=6)
Peak area RSD (%)
4.97 3553.4 0.7
62.79 10171.2 0.5
108.68 14043.6 0.2
190.65 20293.6 0.7
326.73 29120.4 0.2
1105.80 124377.5 0.2
5610.83 117918.6 0.7
10140.08 188332.5 0.2
50116.30 1179517.5 0.4
Correlation coefficient: r2 = 0.9903; Equation for regression line: y = 23.392x + 13089
(n = 6)
27
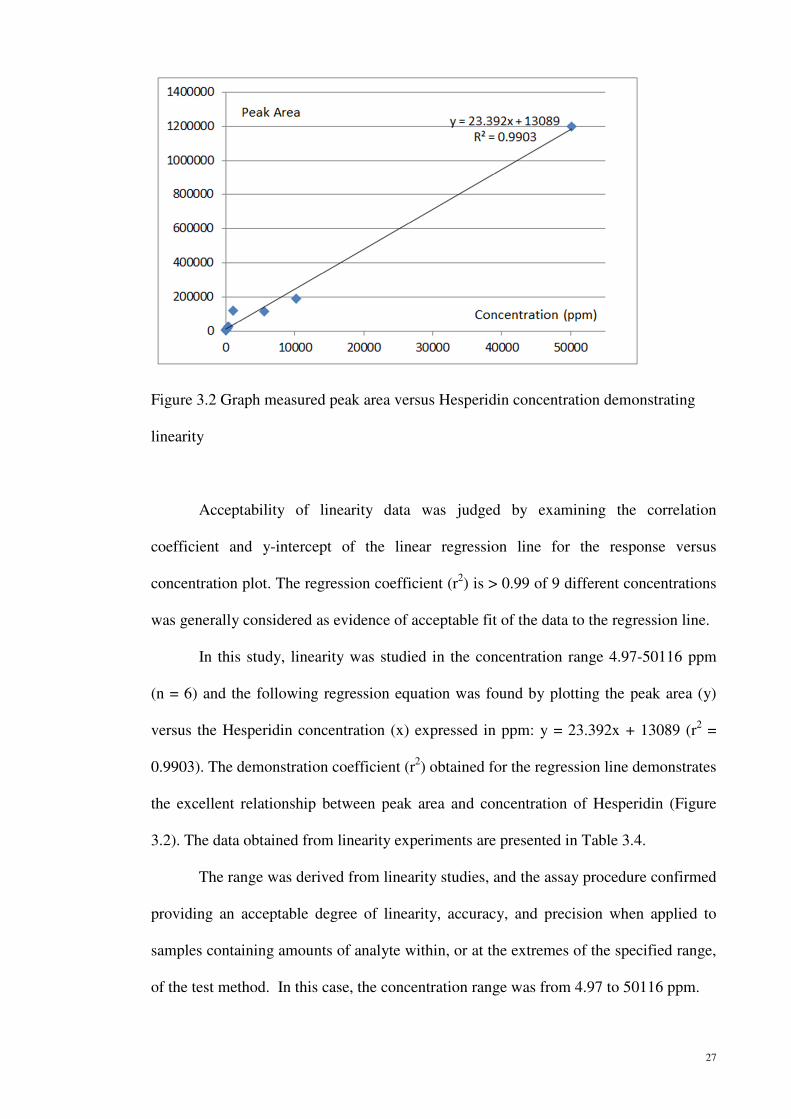
Figure 3.2 Graph measured peak area versus Hesperidin concentration demonstrating
linearity
Acceptability of linearity data was judged by examining the correlation
coefficient and y-intercept of the linear regression line for the response versus
concentration plot. The regression coefficient (r2) is > 0.99 of 9 different concentrations
was generally considered as evidence of acceptable fit of the data to the regression line.
In this study, linearity was studied in the concentration range 4.97-50116 ppm
(n = 6) and the following regression equation was found by plotting the peak area (y)
versus the Hesperidin concentration (x) expressed in ppm: y = 23.392x + 13089 (r2 =
0.9903). The demonstration coefficient (r2) obtained for the regression line demonstrates
the excellent relationship between peak area and concentration of Hesperidin (Figure
3.2). The data obtained from linearity experiments are presented in Table 3.4.
The range was derived from linearity studies, and the assay procedure confirmed
providing an acceptable degree of linearity, accuracy, and precision when applied to
samples containing amounts of analyte within, or at the extremes of the specified range,
of the test method. In this case, the concentration range was from 4.97 to 50116 ppm.

28
3.6.1.2 Accuracy/recovery studies
Accuracy/recovery studies were determined by comparing obtained
concentration from samples and expected concentrations. In this study, QC
samples of known concentration of 1000.85 ppm were performed for 6
replicates. The recoveries were calculated versus expected concentration as
illustrated in Table 3.5.
Table 3.5 Accuracy/recovery of Hesperidin from QC Samples with known
concentration
Sample Number
(n=6)
Nominal (ppm) Recovery Amount
(ppm)
Recovery (%)
1 1000.85 1001.359 100.05%
2 1000.85 1002.134 100.13%
3 1000.85 1003.720 100.29%
4 1000.85 1000.034 99.92%
5 1000.85 1002.161 100.13%
6 1000.85 1002.810 100.20%
Mean recovery: 100.12%; RSD 0.1%
The accuracy of an analytical method was the closeness of test results obtained
by that method to the true value. Accuracy can be assessed by analyzing a sample of
known concentration (reference materials), and comparing the measured value to the
true value. Accuracy criteria were that the mean recovery would be 100 ± 2% of
measured value to the true value.
In this study, known added amounts of Hesperidin QC Samples were injected
and percent recoveries of response factor (concentration) were calculated. The results
29
of accuracy studies are shown in Table 3.5 indicated the mean recovery was 100 ± 2%,
and it was evident that the analytical method was accurate.
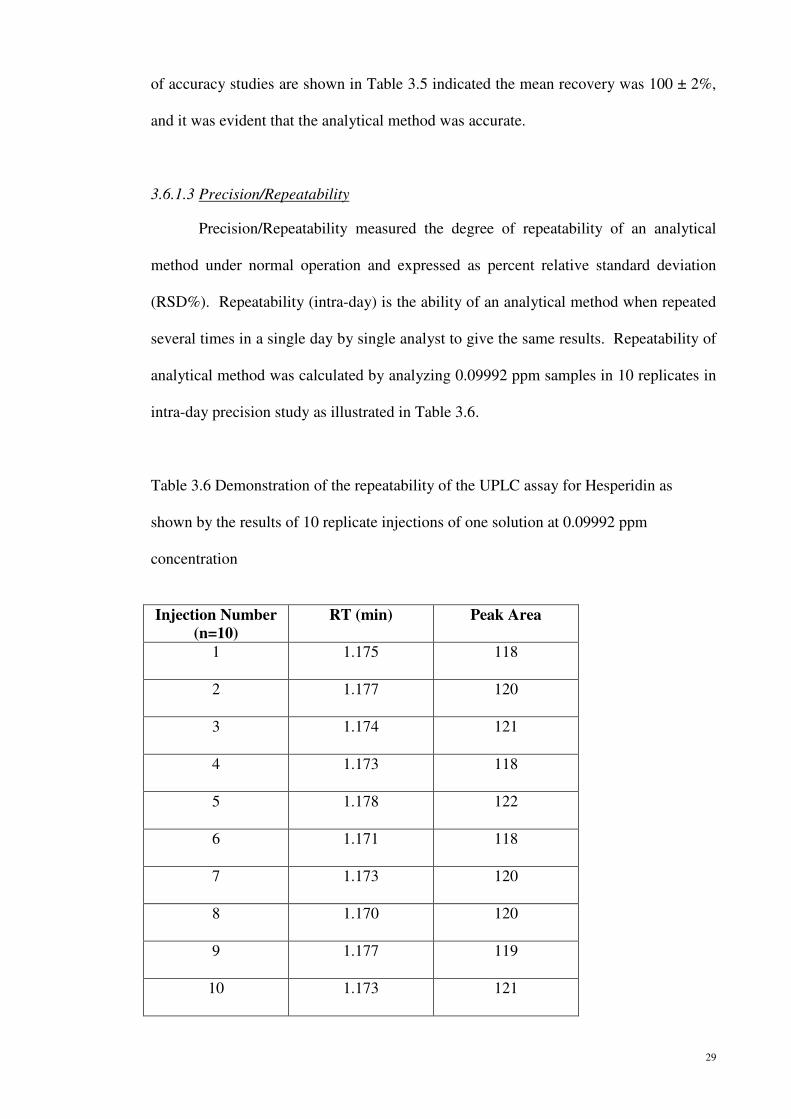
3.6.1.3 Precision/Repeatability
Precision/Repeatability measured the degree of repeatability of an analytical
method under normal operation and expressed as percent relative standard deviation
(RSD%). Repeatability (intra-day) is the ability of an analytical method when repeated
several times in a single day by single analyst to give the same results. Repeatability of
analytical method was calculated by analyzing 0.09992 ppm samples in 10 replicates in
intra-day precision study as illustrated in Table 3.6.
Table 3.6 Demonstration of the repeatability of the UPLC assay for Hesperidin as
shown by the results of 10 replicate injections of one solution at 0.09992 ppm
concentration
Injection Number
(n=10)
RT (min)
Peak Area
1 1.175 118
2 1.177 120
3 1.174 121
4 1.173 118
5 1.178 122
6 1.171 118
7 1.173 120
8 1.170 120
9 1.177 119
10 1.173 121

30
Mean 1.174 120
RSD (%) 0.23% 1.18%
A precision criterion at limit of quantitation in instrument precision
(repeatability) RSD would be ≤ 5%. In this study, precision of the method was
evaluated through the repeatability of the method (intra-assay precision) by assaying ten
replicate injections of Hesperidin at the same concentration (0.09992 ppm), during the
same day, under the same experimental conditions. The RSD values of the retention
time and area of Hesperidin peak were found to be 1.18%, as presented in Table 3.6 and
it was evident that the analytical method was precise.
31
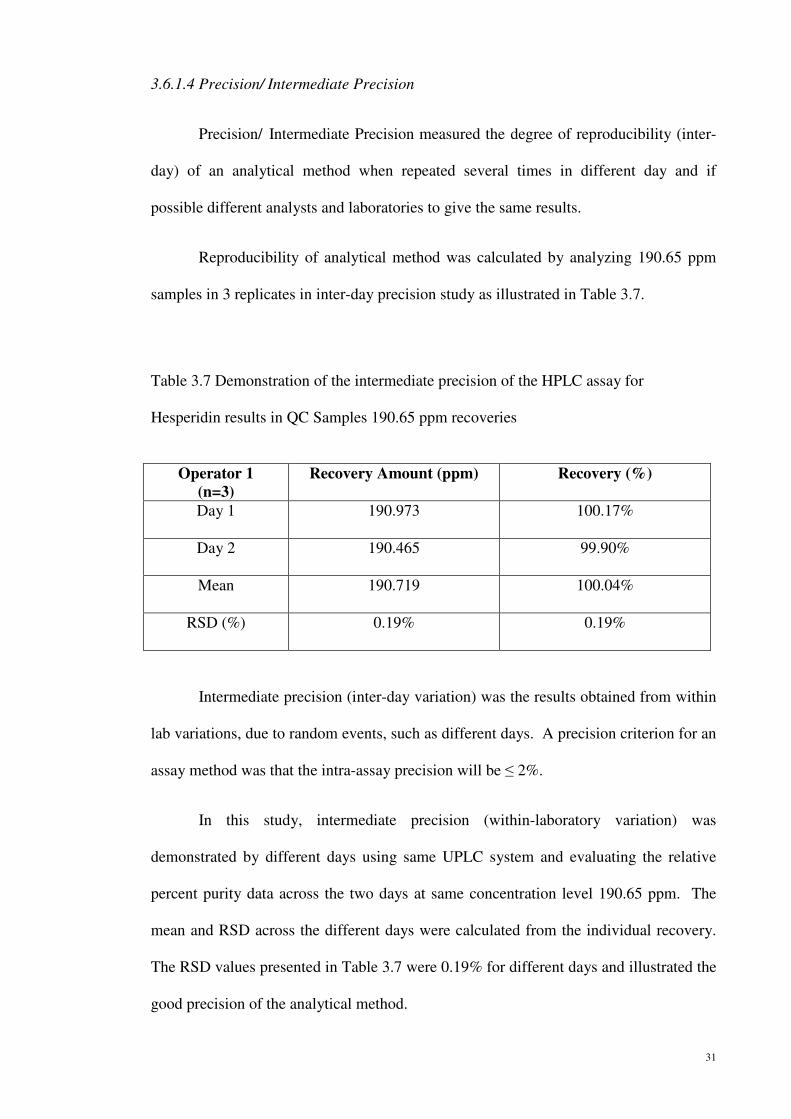
3.6.1.4 Precision/ Intermediate Precision
Precision/ Intermediate Precision measured the degree of reproducibility (inter-
day) of an analytical method when repeated several times in different day and if
possible different analysts and laboratories to give the same results.
Reproducibility of analytical method was calculated by analyzing 190.65 ppm
samples in 3 replicates in inter-day precision study as illustrated in Table 3.7.
Table 3.7 Demonstration of the intermediate precision of the HPLC assay for
Hesperidin results in QC Samples 190.65 ppm recoveries
Operator 1
(n=3)
Recovery Amount (ppm) Recovery (%)
Day 1 190.973 100.17%
Day 2 190.465 99.90%
Mean 190.719 100.04%
RSD (%) 0.19% 0.19%
Intermediate precision (inter-day variation) was the results obtained from within
lab variations, due to random events, such as different days. A precision criterion for an
assay method was that the intra-assay precision will be ≤ 2%.
In this study, intermediate precision (within-laboratory variation) was
demonstrated by different days using same UPLC system and evaluating the relative
percent purity data across the two days at same concentration level 190.65 ppm. The
mean and RSD across the different days were calculated from the individual recovery.
The RSD values presented in Table 3.7 were 0.19% for different days and illustrated the
good precision of the analytical method.

32
3.6.1.5 Limit of Detection and Quantitation
The instrument limit of detection was determined from 10 replicates injection of
standard solution with low concentration that gave peak area detection at the signal-to-
noise of 3 as illustrated in Table 3.8.
Table 3.8 Demonstration of Limit of Detection of the UPLC assay for Hesperidin as
shown by the results of 10 replicate injections of one solution at 0.09992 ppm
concentration
Injection Number
(n=10)
RT (min)
Peak Area
1 1.175 118
2 1.177 120
3 1.174 121
4 1.173 118
5 1.178 122
6 1.171 118
7 1.173 120
8 1.170 120
9 1.177 119
10 1.173 121
Mean 1.174 120
RSD (%) 0.23% 1.18%
The Limit of Detection (LOD) and Limit of Quantitation (LOQ) tests for the
procedure are performed on samples containing very low concentrations of analyte.

33
LOD is defined as the lowest amount of analyte that can be detected above baseline
noise; typically, three times the noise level. In this study, LOD for a 1 µL injection of
Hesperidin standard was 0.09992 ppm.
LOQ is defined as the lowest amount of analyte which can be reproducibly
quantitated above the baseline noise, that gives S/N = 10 which equivalent to 3.333
LOD. In this study, LOQ for a 1 µL injection of Hesperidin standard was 0.333 ppm.
3.6.1.6 Stability of Analytical Solutions
The stability of Analytical Solution was assessed using Samples and standards
that were tested over 24 hours period (for Hesperidin assay) and quantitation of QC
samples was determined by comparison to freshly prepared standards. The stability of
analytical solution was determined from 3 replicates injection of QC Samples 190.65
ppm as illustrated in Table 3.9.
A stability criterion for assay methods was that sample and standard solutions
and the mobile phase were stabled for 24 hours under storage at 2 – 8 oC. Stability is
considered to be acceptable when the change in the standard or QC sample recovery is
within 2% relative to freshly prepared standards.
Table 3.9 Stability of Hesperidin in QC Samples 190.65 ppm
Operator 1
(n=3)
Recovery Amount (ppm) Recovery (%)
Day 1 190.973 100.17%
Day 2 190.465 99.90%
Difference 0.508 0.270%

34
In this study, the stability of Hesperidin solutions was investigated. Hesperidin
was chromatographed at the beginning, and after 24 hours. The stability of Hesperidin
and the mobile phase were calculated by comparing recovery at 190.65 ppm over time.
QC solution was stored in a capped volumetric flask under storage at 2 – 8 oC for 24
hours, and was shown to be stabled with no significant change in Hesperidin
concentrations over this period (Table 3.9). This was indicated by 0.270% changes in
recovery between T = 0 hours and T = 24 hours. Based on analyzed data, the data
shown quantitative recovery through 24 hours, Hesperidin solutions can be assayed
within 24 hours of preparation.

35
3.6.1.7 System Suitability
System suitability tests were an integral part of HPLC methods, and used to
verify that the accuracy and precision of the system were adequate for the analysis to be
performed. Although there was no defined USP guideline for System Suitability of
UPLC methods, parameters, such as repeatability (RSD of retention time and area for
six repetitions) were determined and compared against the specifications set for the
method. The system suitability of analytical solution was determined from 6 replicates
injection of QC Samples 1000.85 ppm as illustrated in Table 3.10.
Table 3.10 Demonstration of the system suitability of the UPLC assay in QC Samples
1000.85 ppm for Hesperidin
Injection Number
(n=6)
RT (min)
Peak Area
1 1.167 74947
2 1.175 74996
3 1.175 75096
4 1.171 74863
5 1.172 74998
6 1.172 75039
Mean 1.172 74989.83
RSD (%) 0.25% 0.11%
System Suitability
Parameter
Acceptance
Criteria
Results
Injection precision
for area (n = 6)
RSD ≤ 1% 0.11%
Injection precision
for retention time
(min)
RSD ≤ 1% 0.25%
36
In this study, the system suitability test was demonstrated with the accuracy and
precision of the system, by injecting six injections of a solution containing 1000.85 ppm
of Hesperidin. The obtained RSD for peak area and retention time was 0.11% and
0.25% respectively as illustrated in Table 3.10 and it was evident that the analytical
method met system suitability criteria.
37
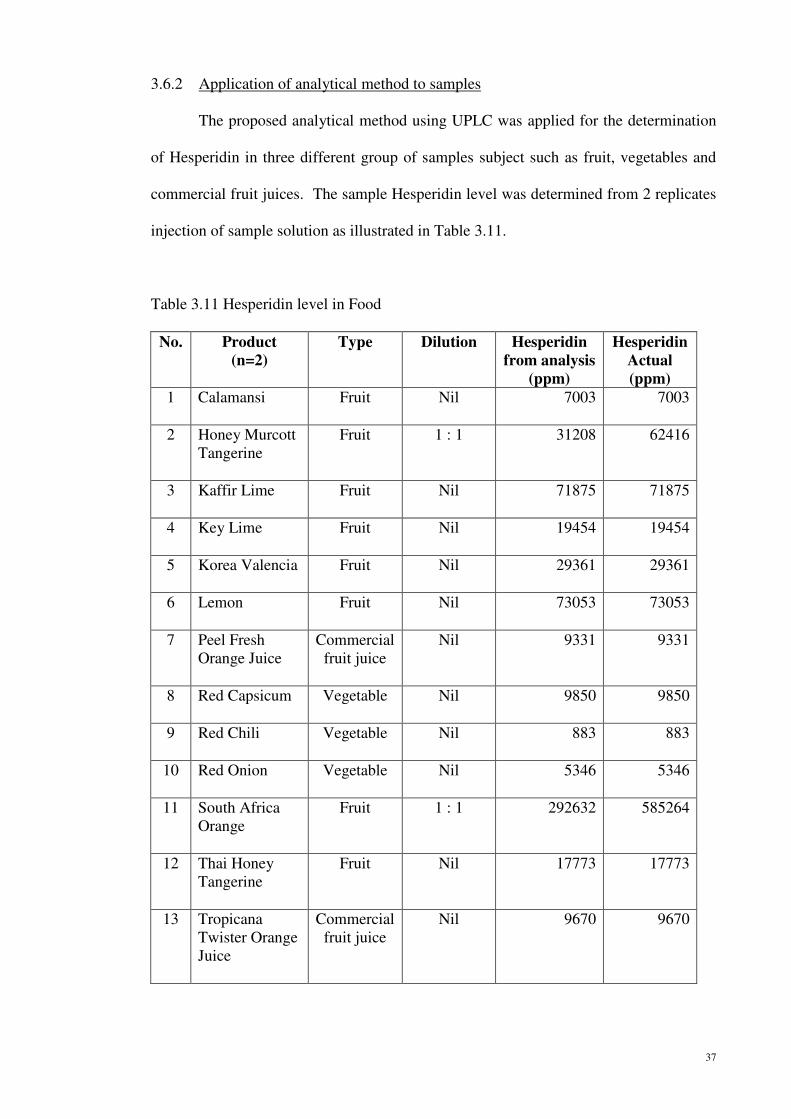
3.6.2 Application of analytical method to samples
The proposed analytical method using UPLC was applied for the determination
of Hesperidin in three different group of samples subject such as fruit, vegetables and
commercial fruit juices. The sample Hesperidin level was determined from 2 replicates
injection of sample solution as illustrated in Table 3.11.
Table 3.11 Hesperidin level in Food
No. Product
(n=2)
Type Dilution Hesperidin
from analysis
(ppm)
Hesperidin
Actual
(ppm)
1 Calamansi Fruit Nil 7003 7003
2 Honey Murcott
Tangerine
Fruit 1 : 1 31208 62416
3 Kaffir Lime Fruit Nil 71875 71875
4 Key Lime Fruit Nil 19454 19454
5 Korea Valencia Fruit Nil 29361 29361
6 Lemon Fruit Nil 73053 73053
7 Peel Fresh
Orange Juice
Commercial
fruit juice
Nil 9331 9331
8 Red Capsicum Vegetable Nil 9850 9850
9 Red Chili Vegetable Nil 883 883
10 Red Onion Vegetable Nil 5346 5346
11 South Africa
Orange
Fruit 1 : 1 292632 585264
12 Thai Honey
Tangerine
Fruit Nil 17773 17773
13 Tropicana
Twister Orange
Juice
Commercial
fruit juice
Nil 9670 9670
38
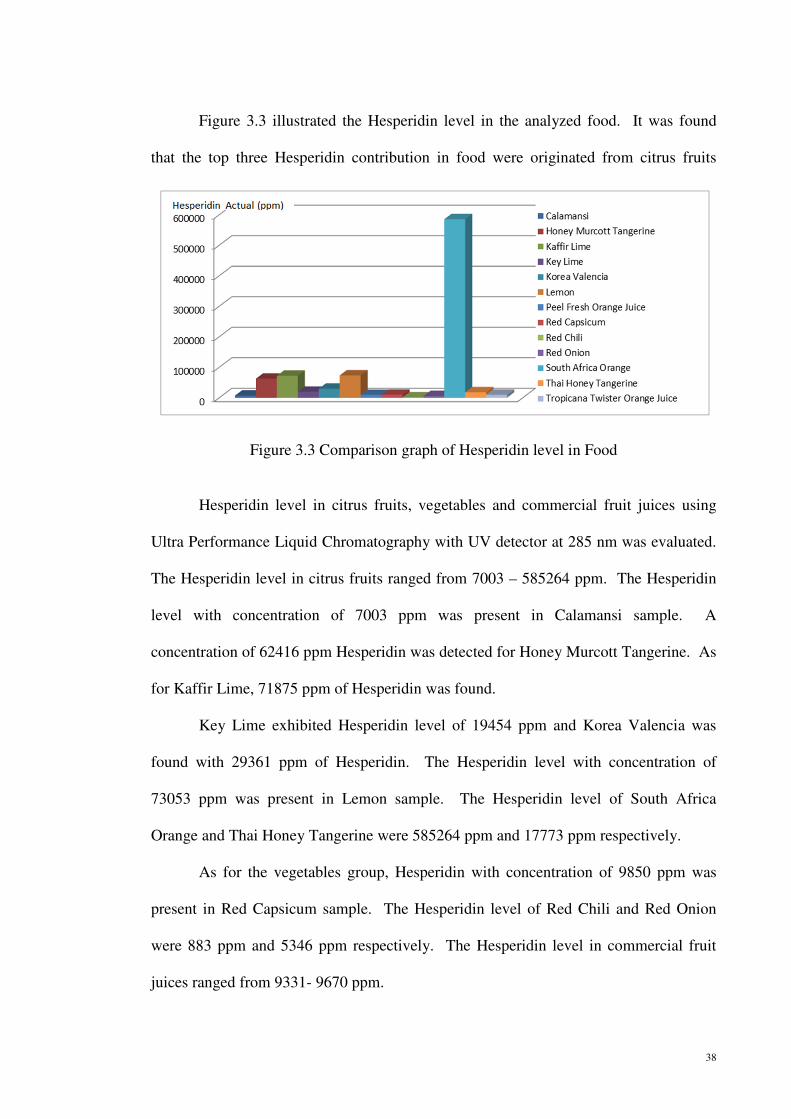
Figure 3.3 illustrated the Hesperidin level in the analyzed food. It was found
that the top three Hesperidin contribution in food were originated from citrus fruits
Figure 3.3 Comparison graph of Hesperidin level in Food
Hesperidin level in citrus fruits, vegetables and commercial fruit juices using
Ultra Performance Liquid Chromatography with UV detector at 285 nm was evaluated.
The Hesperidin level in citrus fruits ranged from 7003 – 585264 ppm. The Hesperidin
level with concentration of 7003 ppm was present in Calamansi sample. A
concentration of 62416 ppm Hesperidin was detected for Honey Murcott Tangerine. As
for Kaffir Lime, 71875 ppm of Hesperidin was found.
Key Lime exhibited Hesperidin level of 19454 ppm and Korea Valencia was
found with 29361 ppm of Hesperidin. The Hesperidin level with concentration of
73053 ppm was present in Lemon sample. The Hesperidin level of South Africa
Orange and Thai Honey Tangerine were 585264 ppm and 17773 ppm respectively.
As for the vegetables group, Hesperidin with concentration of 9850 ppm was
present in Red Capsicum sample. The Hesperidin level of Red Chili and Red Onion
were 883 ppm and 5346 ppm respectively. The Hesperidin level in commercial fruit
juices ranged from 9331- 9670 ppm.

39
It has been shown that citrus fruit is a major Hesperidin contributor in food.
Based on the analysis as per Figure 3.3, the Hesperidin contribution was in the order
South Africa Orange >>> Lemon = Kaffir Lime > Honey Murcott Tangerine > Korea
Valencia > Key Lime > Thai Honey Tangerine.
As for vegetables, the amount of Hesperidin level was quite low compared with
citrus fruits. The Hesperidin contribution was in the order Red Capsicum > Red Onion
> Red Chili. Commercial fruit juices exhibited higher Hesperidin level compared with
vegetables but less with citrus fruits which was in the range of 9000 – 10000 ppm.
UPLC chromatograms obtained from the sample subject extraction shown that
Hesperidin was detected at UV 285 nm and at retention times (RT) of 1.17 minutes.
The linear regression line of the calibration plot was extrapolated for Hesperidin level
determination in Kaffir Lime, Lemon and South Africa Orange due to its high
Hesperidin concentrations.
Based on the food subject under study, it was observed that South Africa Orange
exhibited the highest Hesperidin level in the citrus fruits grouping. Under the analyzed
vegetables groups, it was found that Red Capsicum had the highest Hesperidin level.
Commercial fruit juices Hesperidin levels were in between the citrus fruits and
vegetables group.

40
4.1 Conclusion
Hesperidin analysis in food is a simple application involving chromatographic based
technique. The challenges would be maintaining the stability of Hesperidin during the
duration of the study. This is accomplished by keeping the analyte under controlled
storage condition and faster analysis cycle time to overcome the degradation of this
compound.
The objectives of this study was the method development and validation of the
fast and reliable Ultra Performance Liquid Chromatography technique for the
determination of Hesperidin belong to different group of food including citrus fruits,
vegetables and commercial fruit juices.
In the sample treatment methodology, a direct extraction technique was selected
as the more suitable method for routine analysis of Hesperidin in food sample. This
technique reduced extraction losses and achieved short cycle time to minimize sample
degradation.
This method gave satisfactory analytical performance parameters for most
targeted Hesperidin and analysis of food samples proved its feasibility for the intended
purpose. A satisfactory of achieved linearity was observed based on the calibration
curve plotted in a nine different concentrations with 6 replicates.
The accuracy of the analytical method was proven with achieved mean recovery
of 100 ± 2%, and this method is considered precise as documented in the analysis data
above. The establishment of limit of detection at 0.09992 ppm and limit of quantitation
at 0.333 ppm is applicable to low level of Hesperidin study.
Based on all analyzed data gathered, this analytical method using Ultra
Performance Liquid Chromatography was validated and found to be suitable for the
application of Hesperidin study.
41
In the application of Hesperidin study, it was found that by using
chromatographic technique of Ultra Performance Liquid Chromatography with UV
detector at 285 nm, the obtained Hesperidin level of citrus fruits were among the highest
Hesperidin contributor of the group of fruits, vegetables and commercial fruit juices that
were evaluated.
In the fruit category, the highest contributor of Hesperidin level was found to be
originated from the South Africa Orange. However, with the similar plant species i.e.
Korea Valencia had a lower Hesperidin level compared with South Africa Orange. As
both oranges were planted in different locations e.g. South Africa and Korea, thus it was
deduced that different locations of the plantation give rise to different Hesperidin level
in the fruit. This is further confirmed with different Hesperidin level found in tangerine
species of Honey Murcott Tangerine and Thai Honey Tangerine.
In the vegetable category, Red Capsicum was among the highest Hesperidin
contributor in this group. However, the Hesperidin level in this group had a much lower
Hesperidin level compared with the citrus fruit group. Commercial fruit juices also
shown a lower Hesperidin level compared with the citrus group. Thus, it was deduced
that Hesperidin level is predominant in citrus fruits family.

42
5.1 Supplementary
5.1.1 Appendix A
Refer to Appendix A for data sources and raw data.
5.1.2 Bibliography
Chromatography. USP 34 (621), United States Pharmacopeial Convention,
Rockville, MD, 2011, pp. Physical Tests / Chromatography 245
Validation of Compendial Methods. USP 25-NF 20, (1225), United States
Pharmacopeial Convention, Rockville, MD, 2002, pp. 2256
S. Gorinstein1, D. Huang, H. Leontowicz, M. Leontowicz, K. Yamamoto4, R.
Soliva-Fortuny, O. Martin Belloso, A. L. Martinez Ayala, and S. Trakhtenberg,
(2006) “Determination of Naringin and Hesperidin in citrus fruit by High
Performance Liquid Chromatography. The antioxidant potential of citrus Fruit”,
Acta Chromatographica, No. 17
Mabberley, D.J. (1987). The Plant Book. A portable dictionary of the higher plants.,
pp. 706
Spiegel-Roy, Pinchas; Eliezer E. Goldschmidt (1996). Biology of Citrus., pp. 4
[National Center for Biotechnology Information. (2013). Hesperidin. Retrieved June
11,2013 from http://www.ncbi.nlm.nih.gov/]
Kylenorton, (2011). Phytochemicals – 12 Health Benefits of Hesperidin. Retrieved
from Health Articles
43
Wendy Hutton, Alberto Cassio (2011). Pocket Guide to Asian Herbs & Spices
Morton, J (1987). Mexican Lime in fruits of warm climates, pp. 168–172
Walter Reuther and Harry W. Lawton; Willard Hodgson (1989). The Citrus
Industry, Horticultural Varieties of Citrus. Riverside CA: University of California
Division of Agricultural Sciences
Pittman & Davis (1999). Premium Citrus Fruit Gifts - Why Are Tangerines So
Tangy?
Michael E. Swartz (2005). UPLC : An Introduction and Review. Journal of Liquid
Chromatography & Related Technologies, pp. 1253–1263
Michael E. Swartz, Ph.D. (2005). Ultra Performance Liquid Chromatography
(UPLC): An Introduction.
J.J. van Deemter, F.J Zuiderweg, and A. Klinkenberg, (1956). Chem. Eng. Sci. 5,
pp. 271
N. Wu, J.A. Lippert, and M.L. Lee (2001), J. Chromatography, pp. 911
Unger, K.K.; Kumar, D.; Grun, M.; Buchel, G.; Ludtke, S.; Adam, Th.; Scumacher,
K.; Renker (2000), S. J. Chromatography., pp. 892
44
Penniston KL, Nakada SY, Holmes RP, Assimos DG (2008). "Quantitative
Assessment of Citric Acid in Lemon Juice, Lime Juice, and Commercially-
Available Fruit Juice Products" (PDF). Journal of Endourology 22 (3), pp. 567–570
United States Department of Agriculture. (2009). Capiscum L.". Retrieved June 4,
2013 from Germplasm Resources Information Network .
Ballard, R.E.; McClure, J.W.; Eshbaugh, W.H.; Wilson, K.G. (1970). A
Chemosystematic Study of Selected Taxa of Capsicum. American Journal of Botany
(American Journal of Botany, Vol. 57, No. 2)
Bosland, P.W. (1998). Capsicums: Innovative uses of an ancient crop.
Flavonoid and Carbohydrate Contents in Tropea Red Onions: Effects of Homelike
Peeling and Storage - Journal of Agricultural and Food Chemistry (ACS
Publications) pp. 479–487.
Acquity UPLC System (2003). Retrieved June 4, 2013 from Waters Corporation,
MA, USA
Superfoods (2013). Hesperidin Benefits and Food Sources Files. Retrieved June
4,2013, from http://www.superfoods-scientific-research.com/natural-
remedies/hesperidin-benefits.html
[US National Library of Medicine National Institutes of Health. (1995). Retrieved
June 4, 2013 from http://www.ncbi.nlm.nih.gov/pubmed/7495469]
45
[US National Library of Medicine National Institutes of Health. (2003). Retrieved
June 4, 2013 from http://www.ncbi.nlm.nih.gov/pubmed/14974738]
[US National Library of Medicine National Institutes of Health. (2004). Retrieved
June 4, 2013 from http://www.ncbi.nlm.nih.gov/pubmed/15133244]
[US National Library of Medicine National Institutes of Health. (1994). Retrieved
June 4, 2013 from http://www.ncbi.nlm.nih.gov/pubmed/8021799]
[US National Library of Medicine National Institutes of Health. (2008). Retrieved
June 4, 2013 from http://www.ncbi.nlm.nih.gov/pubmed/18048026]
[US National Library of Medicine National Institutes of Health. (2011). Retrieved
June 4, 2013 from http://www.ncbi.nlm.nih.gov/pubmed/22110589]
[US National Library of Medicine National Institutes of Health. (2011). Retrieved
June 4, 2013 from http://www.ncbi.nlm.nih.gov/pubmed/22074828]
[US National Library of Medicine National Institutes of Health. (2011). Retrieved
June 4, 2013 from http://www.ncbi.nlm.nih.gov/pubmed/21820093]
[US National Library of Medicine National Institutes of Health. (2010). Retrieved
June 4, 2013 from http://www.ncbi.nlm.nih.gov/pubmed/20885004]
[US National Library of Medicine National Institutes of Health. (2003). Retrieved
June 4, 2013 from http://www.ncbi.nlm.nih.gov/pubmed/14626685]

46
[US National Library of Medicine National Institutes of Health. (2009). Retrieved
June 4, 2013 from http://www.ncbi.nlm.nih.gov/pubmed/19966469]


![Hesperidin, A Citrus Bioflavonoid Attnuates Iron-Induced ... · Hesperidin is believed to play a role in plant defence against fungal and bacterial invasions [23]. The sweet oranges](https://cdn.vdocuments.us/doc/165x107/5e87a48055430b40776ed044/hesperidin-a-citrus-bioflavonoid-attnuates-iron-induced-hesperidin-is-believed.jpg)


