1
Abstract
The design and development of both the inlet
and the propulsion system of military aircraft
are often conducted separately. However, by
using this approach the interactions of the
aerodynamic conditions within both systems are
not taken into account and hence an optimal
inlet propulsion system cannot be conceived.
The requirements of modern military
aircraft with a fully integrated propulsion
system increase and thus research regarding
inlet compressor interactions becomes more
important in order to improve future systems.
The Institute of Jet Propulsion hence decided to
design and develop a military engine inlet
system specifically for research purposes.
This paper first summarizes the initially
defined goals and requirements within the
current project. Computational Fluid Dynamics
(CFD) simulations were conducted in order to
assess the influence of certain geometrical
shapes of an s-duct on the aerodynamic
condition at the outlet plane of the inlet system.
The gained knowledge was used during the
design of a designated inlet geometry. Then, the
necessary measurement instrumentation for this
geometry in an experimental setup was defined
with support from CFD simulations. Finally, all
hardware including the duct for experimental
testing in the institute’s Engine Test Facility
(ETF) in combination with a modified Larzac 04
C5 turbofan engine was developed and
manufactured.
1. Introduction
The inlet and the propulsion system of military
aircraft are often designed and developed as
isolated systems since different sectors of the
industry are responsible for the respective
systems. In a late stadium of the development
process both systems are merged for both full-
aircraft ground testing and flight testing.
A similar approach is often used for
general research within this field. In the open
literature it can typically be distinguished
between investigations on:
the aerodynamics within serpentine inlet
systems and
the influence of distorted flow on a
compressor system
The Institute of Jet Propulsion started
research on “aerodynamics within serpentine
inlet systems” with preliminary CFD
simulations regarding the integration of bent
inlet systems within the institute’s ETF [1]. First
experiments with the so-called generic s-duct
geometry were conducted in a scaled version of
this ETF by Rademakers et al. [2]. Brehm et al.
[3] describe the aerodynamic transferability
between both facilities by means of CFD. CFD
simulations were moreover conducted to
analyze varying flow conditions within an s-
duct due to either different inflow conditions at
the intake plane (Brehm et al. [4]) or different
geometrical shapes of the s-duct itself (Kächele
et al. [5], [6]).
Investigations regarding the “influence of
distorted flow on a compressor system” started
in the 1990s (see e.g. Schmid et al. [7]) with
engine tests using a Larzac 04 turbofan engine
and distortion generators installed upstream
from the compressor system to simulate inlet
flow distortion. Scheidler et al. [8] enhanced
these investigations by means of an active
stabilization of a Larzac 04 Low Pressure
DESIGN AND DEVELOPMENT OF A MILITARY ENGINE INLET RESEARCH DUCT
R.P.M. Rademakers*, J.P. Haug*, R. Niehuis*, and M. Stößel**
* Institute of Jet Propulsion, Universität der Bundeswehr München, Neubiberg, Germany
** Wehrtechnische Dienststelle für Luftfahrzeuge und Luftfahrtgerät der Bundeswehr,
Manching, Germany
Keywords: military engine inlet research duct, engine test facility

2
Compressor (LPC) while operating with
distorted inflow conditions. Rademakers et al.
focused on s-duct typical inlet distortions and
accordingly generated a variety pure pressure
distortion patterns [9] as well as combined
pressure-swirl distortion patterns [10]. The
influence of these distortion patterns on the
performance and stability of the entire inlet-
propulsion system was assessed. High fidelity
CFD simulations were conducted by Barthmes
et al. [11] and Haug et al. [12] to assess the
aerodynamic flow condition within a
compressor stage in a setup with an upstream
installed distortion generator.
Interactions between the flow within the
inlet and compressor are neglected if both are
considered as isolated systems. These
interactions hence need to be included to
enlarge knowledge within this field of research
and fulfill the increasing requirements of future
integrated propulsion systems. The Institute of
Jet Propulsion recognized the need of an
experimental setup enabling investigations on a
full-scale inlet-propulsion system as it is typical
for modern Unmanned Combat Aerial Systems
(UCAS).
2. General project definition
2.1 Goals
The main goals of the current project were
defined prior to the selection of a designated
engine inlet system for research. This led to four
main requirements for the design of the inlet.
The geometry of the inlet system for
experimental testing in the ETF should:
1. provide useful data for the validation and
optimization of CFD simulations,
2. enable assessment regarding the
influence of distorted flow provoked in a
UCAS-typical engine inlet system on the
performance and stability of the Larzac
04 test vehicle,
3. perform detailed investigations on inlet
compressor interactions in an
experimental setup with the Larzac 04
test vehicle possible, and
4. be adaptable for future investigations on
e.g. flow control and optimization within
the engine inlet system.
a) bent inlet duct b) generic s-duct
Fig 1. Shaped engine inlet configurations utilized for
research at the Institute of Jet Propulsion
Existing engine inlet configurations, which
are already available at the Institute of Jet
Propulsion for experimental research (i.e.
presented by Rademakers et al. [2], [13]), are
not suitable to fulfill the previously mentioned
project goals as it is explained in the following.
The shape of the “bent inlet duct” (see Fig.
1a and [13]) does not represent an inlet system
typical for military applications (see
requirement 2). The “generic s-duct” (see Fig.
1b and [2]) has a UCAS-typical geometry,
however, only partly covers the compressor
face. Hence, there is no all-encompassing
fulfillment of requirement 2. The fore body
(representing the front part of a UCAS airframe)
and the complex shape of the intake plane (see
Fig. 1b, indicated in blue) make it furthermore
difficult to fulfill requirement 1 because the
CFD setup needs to be validated for the
simulation of both external and internal flow.
It was hence decided to design a Military
Engine Inlet Research Duct (MEIRD)
specifically for the planned experimental and
numerical investigations within the current
research project.
2.2 Project phases
This paper describes the following project phases:
A. Analysis on a baseline s-duct geometry
and the establishment of the MEIRD
geometry (see Chapter 3).
B. Definition of an instrumentation concept
for future research duct with the MEIRD
geometry (see Chapter 4).
C. Development of the hardware for
experimental testing (see Chapter 5).
D. Manufacturing and installation of all
hardware as well as commissioning of
the setup (see Chapter 6).
R.P.M. Rademakers, J.P. Haug, et al.

DESIGN AND DEVELOPMENT OF A MILITARY ENGINE INLET RESEARCH DUCT
3
3. Establishment of the MEIRD geometry
The MEIRD geometry was established after an
iterative design process supported by CFD
simulations. First, a baseline geometry (see
Chapter 3.1) was defined and analyzed. Then,
22 modified versions of the baseline geometry
were established to assess the influence of local
changes of the geometry on the aerodynamics
within the inlet system and the distortion
patterns at the Duct Outlet Plane (DOP). The
flow solver TRACE 8.0 was used for the
presented CFD simulations. This software has
been developed at the Institute of Propulsion
Technology of the German Aerospace Center.
The main specifications of all CFD simulations
are listed in Tab. 1. The specified outlet static
pressure of leads to a mass flow of ca. 26 kg/s.
The enlargement of the general
understanding of flow phenomena in complex
shaped engine inlet systems was the main
objective of these investigations. The results
contributed to the establishment of an
interesting and designated military engine inlet
duct for research purposes. It is noted that an
optimization of the baseline geometry in terms
of flow distortion and total pressure loss was not
a main purpose of the presented CFD
simulations because of two reasons:
The provoked distortions within the
MEIRD geometry need to be distinct
enough to fulfill the project requirements
(see Chapter 2.1).
The shape of the inlet geometry cannot
be too complex in order to facilitate both
CFD simulations and the manufacturing
of the hardware. This improves the
comparability between experimental and
numerical investigations.
The optimization of an engine inlet geometry
can only be conducted sufficiently by using a
fully automated process. Such optimizations
were already presented by Kächele et al. [5], [6]
and will also be part of future research at the
Institute of Jet Propulsion.
It is not within the scope of this paper to
review the results of all 22 geometry variations
in detail. Three main perceptions from these
initial CFD investigations are described in
Chapter 3.2 until 3.4 because of their major
influence on the final shape of the MEIRD
geometry (see Chapter 3.5).
number of nodes ca. 5M
numerical
boundary
conditions
inlet Pt0 = 101,325 Pa
Tt0 = 288.15 K
outlet Ps = 85,000 Pa Tab. 1. Setup of the CFD simulations
dDOP 0.454 m
area ratio (ADOP / ADIP) 1.1739
offset between DIP & DOP 1·d
length (along x-axis) 3·d Tab 2. Baseline s-duct geometry
3.1 Definition of the baseline geometry
The baseline geometry is shown in Fig. 2
and its main geometric properties are listed in
Tab. 2. The flow pattern at the DOP of this
geometry is shown in Fig. 3a. The diameter of
the DOP (dDOP = 0.454 m) enables the junction
of the inlet with a Larzac 04 test vehicle. The
area surface ratio (ADOP / ADIP = 1.1739) is
equal to the surface ratio of the engine inlet duct
installed in the Alpha Jet aircraft. Noted that the
original Alpha Jet power plant consists of two
Larzac 04 engines. Both the offset between the
Duct Intake Plane (DIP) and DOP (1·d) as well
as the length of the duct (3·d) are best practice
values. The properties in Tab. 2 and the position
of the center line are equal for all established
geometries. This makes it easier to correlate a
certain geometry change with a change of the
internal flow. It is moreover noted that all inlet
geometries are symmetric in the xz-plane. In
most cases the geometry was changed in the
cross-sections at s = 0%, 40%, and/ or 66% (see
Fig. 2) where s indicates the position at the
center line of the geometry percentagewise.
3.2 Kidney shape at the DIP
In a first step the shape of the DIP is changed
into a kidney shape (baseline mod1). This shape
transforms between s = 0% and s = 40%
continuously into an elliptical shape. This
modification in the front part of the inlet
geometry influences the aerodynamics within
the entire inlet system. A counter-rotating twin

4
Fig. 2. Baseline s-duct geometry
total pressure [Pa]
Fig. 3. Total pressure and swirl distortion at the DOP of
three different inlet geometries: a) baseline geometry,
b) modified geometry with a kidney shape at the DIP,
and c) modified geometry with a kidney shaped cross-
section between the DIP and s = 66%
swirl occurs immediately downstream from the
DIP, which is recognizable in the lower part of
the distortion patterns at the DOP (see Fig. 3b).
This additional swirl reduces the flow
separation at the bottom side of the geometry to
a minimum and moreover, causes that an
increased part of the mass flow through the inlet
is forced upwards. This slightly suppresses the
flow separation within the upper part of the inlet
geometry downstream from the cross-section at
s = 66%, which is recognizable by a decreased
total pressure distortion in the upper part of the
DOP (see Fig. 3b). Moreover, Tab. 3 depicts
that both the maximum total pressure loss
(1)
and the maximum value of the DC60 coefficient
(2)
at the DOP decrease for the baseline mod1 case.
In a second step, the cross-section at s = 0%
and s = 40% were adapted into a kidney shape
(baseline mod2). The shape transforms
continuously into an elliptical shape at s = 66%.
The positive influence of the provoked counter-
rotating twin swirl is even better recognizable in
this case. This is shown by the distortion pattern
plots (see Fig. 3c) as well as the evaluated
distortion coefficients (see Tab. 3).
It is noted that the surface area of all cross-
sections was kept constant while changing the
shape of the cross-section. The kidney shape in
the front part of the inlet system is thus
advantageous from an aerodynamic point of
view. It was hence decided to include this
feature within the MEIRD geometry. It should,
however, be taken into account that the
coverage of the compressor plane can be
reduced due to this particular shape in the front
part of an inlet system.
Pt,loss,max DC60max
baseline 22.27% 0.433
baseline mod1 21.60% 0.369
baseline mod2 21.18% 0.319
Tab 3. Distortion coefficients for the flow at the
DOP of three inlet geometries
3.3 Rectangular shape at s=66% of the geometry
The shape of the cross-section at s = 66% was
investigated in detail. In the following only two
local modifications are compared. In the first
place this cross-section has sharper edges within
the upper part (baseline mod3, see Fig. 4a) and
secondly, sharper edges within the lower part
a) baseline
b) baseline mod1
c) baseline mod2
R.P.M. Rademakers, J.P. Haug, et al.

DESIGN AND DEVELOPMENT OF A MILITARY ENGINE INLET RESEARCH DUCT
5
a) baseline mod3 b) baseline mod4
Pt,loss,max = 22.72% Pt,loss,max = 24.85%
total pressure [Pa]
Fig 4. Total pressure distortion pattern for a) baseline
mod3 and b) baseline mod4
(baseline mod4, see Fig. 4b). In both cases the
surface area and the position of the cross-section
is equal in such way that the inlet geometry
upstream from s = 66% is similar. Hence, the
changing flow conditions in the duct (e.g. the
flow separation) are provoked solely by the
different shapes at s = 66%.
Figure 4 also shows the pressure distortion
patterns at the DOP for both cases. For baseline
mod3 the larger radii in the lower part of the
cross-section (see Fig. 4a) lead to shift of the
mass flow distribution towards the upper part of
the inlet, which has a stabilizing effect on the
flow separation. A weaker flow separation
occurs, which is identified by a decreased loss
of total pressure at the DOP compared to
baseline mod4 (see Fig. 4b).
It was chosen for the MEIRD geometry to
decrease the radii of the cross-section at ca. s =
72% of the s-duct as much as possible. This
specific cross-section was chosen since it is
parallel to the yz-plane. The extent in vertical
direction was moreover reduced, which leads to
a wider cross-section in order to force the mass
flow towards the region with flow separation.
3.4. Diffusing character of the geometry
For all previously described cases the
cross-sectional area increases constantly from
A = 0.1379 m2 at the DIP up to A = 0.1619 m2 at
Fig 5. Variation of cross-sectional surface along the
center line
the DOP as it is displayed in Fig. 5 (depicted in
green). It was shown by e.g. Kächele et al. [6],
and also by Siller and Voss [14] that a variation
of the cross-sectional area along the centerline
generally has a major influence on the distortion
and pressure loss within an inlet system. It is
advantageous to create a sort of settling
chamber upstream from the DOP, which enables
the distortion to mix out. It was nevertheless
chosen to keep the gradient of the cross-
sectional area along the centerline relatively
simple in order to ease the assessment of
aerodynamic phenomena in relation with the
geometry of the duct by means of experimental
and numerical data.
For the MEIRD geometry the cross-
sectional area along the center line increases
linearly between the DIP and s = 72% from A =
0.1379 m2 up to A = 0.1619 m2 and is then kept
constant between s = 72% and the DOP. This is
depicted in Fig. 5 in blue.
3.5 The MEIRD geometry
Ten cross-sections and a side view of the final
MEIRD geometry are displayed in Fig. 6. The
total pressure and swirl distortion patterns,
which are provoked by this geometry at the
DOP are shown in Fig. 7a and Fig. 7b,
respectively.
A set of additional design criteria was
defined for the final definition of the MEIRD
geometry in comparison to the inlet geometries
for the preliminary CFD simulations presented
in the first part of this chapter. In the following
two subchapters it is distinguished between
aerodynamic and geometric design criteria.
s =
66% s =
66%

6
Fig 6. Ten cross-sections of the MEIRD geometry along
the center line
total pressure [Pa]
Fig 7. Total pressure and swirl distortion pattern at the
DOP of the MEIRD geometry
3.5.1 Aerodynamic design criteria
Four aerodynamic constraints were defined for
the establishment of the MEIRD geometry. The
flow within the entire inlet system should be
subsonic (Ma < 1) and the distortion at the DOP
should be such that DC60max < 0.7 to ensure a
safe operation of the inlet system in a setup with
the modified Larzac 04 C5 test vehicle.
Furthermore, constraints for the flow properties
at the DOP are necessary because of the
intended measurement equipment. The utilized
five-hole probes are designed and calibrated for
a flow with Ma < 0.6 and maximal flow angles
of Θ < 24°.
3.5.2 Geometric design criteria
The experimental setup is schematically shown
in Fig. 8. It is noted that the flow does not enter
the test section horizontally due to the particular
design of the facility. The available space in the
existing setup was taken into account for the
shape of the inlet in such way that it can also be
installed upside-down in front of the test
vehicle. This means that it is rotated with 180°
Fig 8. CFD simulation of the MEIRD geometry
installed in the ETF with the modified Larzac 04 test
vehicle
around its x-axis. This enables experimental
investigations of the duct with different
aerodynamic conditions at the DIP due to the
angled inflow in the test section of the ETF.
A bellmouth-like intake lip was designed
to enable a homogeneous guidance of the flow
from the test section into the MEIRD. The
design of the intake lip was supported with the
help of CFD simulations (see Fig. 9).
Finally, the MEIRD geometry fully covers
the compressor face. It is noted that the shape of
the intake lip was not considered while proving
the coverage of the compressor face since the
intake lip is not directly part of the MEIRD
geometry itself.
4. Definition of instrumentation for
experiments
An instrumentation of the MEIRD for
experimental research is essential for the
fulfillment of the project goals defined in
Chapter 2.1. Three different types of aluminum
adapters (see Chapter 4.1 – 4.3) were integrated
within the carbon fiber structure to enable the
installation of additional hardware (i.e. mainly
sensors and probes). These adapters all have a
flange to enable a secure integration of the
adapters between different layers of carbon
fiber. Additional measurement instrumentation
being installed downstream from the duct,
within the engine, and the rest of the test bed is
DIP
s= 20%
s=30%
s=40%
s=50%
s= 60%
s= 70%
s=80%
s=90%
DOP
R.P.M. Rademakers, J.P. Haug, et al.

DESIGN AND DEVELOPMENT OF A MILITARY ENGINE INLET RESEARCH DUCT
7
Fig 9. CFD simulation of the flow entering the MEIRD
through the intake lip
Fig 10. The MEIRD geometry including the positions of
the foreseen instrumentation
overviewed in Chapter 4.4. A designated system
utilized for data acquisition is described in
Chapter 4.5. ´
4.1 Static pressure taps
Altogether 143 adapters were integrated for the
installation of wall static pressure sensors (see
Fig. 10, Pos. I). In total 24 of those adapters
were positioned along the upper and lower wall
at the symmetry plane of the inlet (ten adapters
at the top side and 14 adapters at the bottom
side). The remaining 119 adapters are spread
over ten different cross sections. The latter
adapters are especially positioned at the bottom
side of the duct within several regions where
flow separation occurs according to CFD
simulations. Figure 11a depicts the region where
the local value of skin friction approaches zero
in blue. This generally is an indicator for flow
separation and thus of particular interest for the
positioning of static pressure taps.
4.2 Boundary layer probes
Two adapters were integrated at the upper side
of the wall at the symmetry plane (see Fig. 10,
Pos. II). These adapters will mainly be used for
the installation of boundary layer probes. The
first adapter is positioned at the DIP and the
second adapter is positioned at s = 40%. These
positions were selected because of two reasons.
First, the boundary layer probes are not
designed to measure flow conditions with large
flow angles. The swirl is expected to be
relatively moderate in the front part of the
MEIRD geometry, especially at the upper side
of the cross-sections due to moderate local
geometry changes. Second, the development of
the boundary layer thickness along the upper
side of the inlet can be determined in this way
since the adapters are positioned at the same
circumferential position. This is interesting for
the validation and optimization of CFD
simulations.
4.3 Opening near flow separation
A large scale flow separation is expected to
occur within the upper part of the geometry. It
was decided to integrate three openings in this
part of the MEIRD to increase the possibilities
for detailed flow measurements. The location of
flow separation was determined with the help of
CFD simulations. The blue region in Fig. 11b
again indicates the region where the skin
friction is extremely low and hence CFD
expects the flow to detach. Both the position
and the extension of this region do not change
significantly over the operating range of the test
vehicle.
4.4 Further engine and test bed measurement
instrumentation
4.4.1 Measurement instrumentation at the AIP
The MEIRD can directly be installed in front of
the test vehicle to provoke the maximal amount
of interaction between the flow in the inlet and
the compressor system. Nevertheless, it is also
of interest to determine the flow condition
between the MEIRD’s outlet plane and the
compressor face for the setup and validation of
CFD simulations. With Aerodynamic Interface
Plane (AIP) it is referred to this measurement

8
Fig 11. Regions with expected flow separation at the a)
bottom side and b) upper side of the MEIRD
plane since it is not necessarily equal to the
DOP. A measurement rake was specifically
designed for this purpose. It is installed in a
housing, which can be displaced in
circumferential direction to measure the
aerodynamic flow condition at a large number
of positions. In total 18 probes are available for
the installation in the measurement rake. Ten
five-hole probes are used to measure three
dimensional flow properties. Furthermore, six
standard pitot probes are available for further
pressure measurements with low sampling rates
(fs ≤ 1kHz) and two pitot probes with an
integrated Kulite®-transducer for pressure
measurements with sampling rates up to (fs =
100kHz).
4.4.2 Engine instrumentation
The available Larzac 04 turbofan engine is
extensively equipped with measurement
instrumentation. Experimentally obtained data
can hence not be compared with original engine
specifications and thus it is simply referred to
this modified Larzac 04 engine as “test vehicle”.
Especially the instrumentation in the LPC is
important for the fulfillment of the current
project goals and thus briefly summarized in the
following.
The unsteady flow behavior at the intake
plane of the engine is assessed with five
dynamic pressure transducers, which are
installed 10 mm upstream from the first fan
stage at equally spaced circumferential positions
in the casing of the LPC. In addition, an array
with nine dynamic pressure transducers is
installed in the casing over the first fan stage.
The development of a flow distortion
through the LPC is determined by using pitot
probes within three vanes of the first stator stage
and pitot probes within two vanes of the first
row of the second tandem stator. A single rake
with six pitot probes is installed behind the
second row of the second tandem stator to
determine the total pressure at the exit of the
LPC.
4.4.3 Test bed instrumentation
Pressure and temperature is measured at several
positions within the ETF to set up the boundary
conditions of CFD simulations. The relative
humidity is measured at a metrological office,
which is located at the same university campus
as the Institute of Jet Propulsion.
4.5 Data acquisition
Two state of the art data acquisition systems are
used in parallel during testing campaigns in the
ETF. Stößel and Niehuis [15] describe the
primary data acquisition system based on
National Instruments (NI) PXIe hardware and
NI LabVIEW software, which was established
for an overall monitoring of the test bed and the
jet engine during operation. This system can be
utilized for different jet engines being operated
in the ETF.
The secondary data acquisition system is
based on NI cRIO (Compact Real-Time In-/
Output Controller) hardware and NI LabVIEW
software. This system can specifically be
programmed according to the goals of a certain
testing campaign as it is described by
Rademakers et al. [16]. The current system is
used for pressure, vibration, strain gauge, and
temperature measurements. The hardware is
also highly adaptable to the experimental setup
due to the usage of multiple NI9144 extension
chassis. These chassis can be installed anywhere
in the ETF and thus also directly next to the
a)
b)
R.P.M. Rademakers, J.P. Haug, et al.

DESIGN AND DEVELOPMENT OF A MILITARY ENGINE INLET RESEARCH DUCT
9
inlet and compressor system such that the length
of the tubes for pressure measurements can be
reduced to a minimum. This also reduces the
pneumatic damping within the tubes allowing
reasonable pressure measurements at high
sampling rates.
The setup for the investigations on the
MEIRD solely consists of almost 300 pressure
probes and taps (standard instrumentation of the
test vehicle not included). It was hence a main
focus during the programming of the secondary
data acquisition system to enable a large amount
of pressure measurements simultaneously.
Currently, the system can simultaneously
sample up to 240 pressure values with a
maximal sampling rate of 1 kHz per channel.
5. Development of the MEIRD
This chapter describes the project phase in
which the MEIRD geometry (see Chapter 3.5)
and the defined measurement instrumentation
(see Chapter 4.1 – 4.3) were developed into a
Computer-Aided Design (CAD) model for the
manufacturing of the actual hardware. The
MEIRD will be utilized for testing in the
institute’s ETF and thus, in addition, four side
mountings for the installation in the ETF and an
adapter for the junction with the test vehicle had
to be integrated within the CAD model of the
MEIRD. With “the duct” it is in the following
referred to the MEIRD as it will be installed in
the ETF. Figure 12 shows a schematic
representation of the applied development
procedure. During the development it was
distinguished between Level-1, Level-2, and
Level-3 requirements.
A safe operation of the engine and the duct
in the ETF is ensured by means of the Level-1
requirements. First, the strength of the duct’s
structure needs to be sufficient for all possible
operating conditions in the ETF. Second, an
excitation of the duct’s eigenmodes during
operation must be avoided.
The Level-2 requirements allow the
feasibility of the duct’s manufacturing within a
certain financial framework. Especially the
choice of the materials and the defined
manufacturing accuracy have a major influence
on both the feasibility and the costs. The
Fig 12. MEIRD development procedure
respective restrictions differ for each component
of the duct and are hence not defined explicitly
for the sake of convenience.
By satisfying all Level-3 requirements it is
ensured that the experimental setup will provide
high quality experimental data for the
fulfillment of the four main project goals as
defined in Chapter 2.1. Main examples of
Level-3 requirements are e.g. the positioning of
measurement instrumentation and once again
the manufacturing accuracy of the duct and all
integrated components. A sufficient stiffness of
the duct should furthermore ensure a minimal
deformation of the structure caused by
aerodynamic forces during operation.
In a first step a CAD model was made by
taking the Level-2 and Level-3 requirements
into account. Then, a Finite Element Method
(FEM) model, including the aerodynamic loads
resulting from CFD simulations, was
established. The results of both static and
dynamic structural analyses were then compared
with the Level-1 requirements. Several
iterations were necessary to develop a duct
model, which fulfilled all Level-1, Level-2, and
Level-3 requirements. Selected results from the
final development iteration are shown in the
following subsections.
5.1 Establishment of a CAD model
In total 152 components were integrated in the
duct’s structure to enable both the installation of

10
Fig 13. Integrated adapter for the installation of wall
static pressure sensors
Fig 14. Aerodynamic loads on the duct’s structure
predicted for the test vehicle at its full thrust setting
measurement equipment within the duct as well
as the installation of the duct in the ETF. This
was a main challenge during the development of
the duct. All components had to be integrated
while ensuring a high manufacturing accuracy
and a high stiffness of the structure at the same
time. It was hence decided to build up the
structure in three layers as it is schematically
shown in Fig. 13.
For the middle layer it was chosen for an
aluminum sandwich structure because of the
following advantages. The stiffness of the entire
structure increases significantly, which leads to
large reduction of local deformations caused by
aerodynamic loads during operation. At the
same time the thickness of both carbon fiber
layer (Skin-1 and Skin-2) can be reduced, which
eases the manufacturing. The conventional wet
layup technique was chosen for the
manufacturing of the main part of the structure.
It is noted that the sandwich structure is not
foreseen within specific parts of the duct. The
complex shape of the intake lip and the side
mountings at both sides of the duct makes the
integration of a sandwich structure almost
impossible. For the intake lip it is sufficient to
solely use two 1.8 mm layers of carbon fibers
since the aerodynamic forces are small and
possible deformations would not influence the
aerodynamic conditions within the duct. The
four side mountings are specifically designed
while considering that a sandwich structure
cannot be integrated. It was hence decided to
manufacture the side mountings with pre-
impregnated composite fibers by using the out
of autoclave manufacturing process, which is
characterized by a high manufacturing precision.
5.2 Aerodynamic loads as input data for
structural analyses
The aerodynamic loads on the duct were
predicted with the help of CFD simulations. It
was found that the patterns of these loads over
the surface of the duct do not change depending
on the operating point of the test vehicle. Only
the load levels decrease for reduced operating
points. It was hence decided to conduct both
static and dynamic numerical structural analyses
while considering the full thrust setting of the
test vehicle (see Fig. 14).
5.3 Static structural analysis
5.3.1 Stiffness
The carbon fiber structure deforms in a certain
extent due to the aerodynamic loads depending
on the operating point of the test vehicle. It is
not reasonable to adapt the mesh for CFD
simulations to such deformations. It was hence
defined as Level-3 requirement that a local
deformation of the structure is limited to 1 mm
in order to ensure the comparability between
experimental and numerical results.
The integration of the aluminum sandwich
structure as described in Chapter 5.1 is the main
reason for a formidable stiffness of the
structure. The maximum locally occurring
absolute deformation of the structure was
predicted by means of an FEM simulation to be
0.81 mm. This deformation occurs within the
intake lip (see Fig. 15) where the aluminum
sandwich structure is not integrated. The
maximal deformation in the main part of the
duct is predicted to be less than 0.70 mm.
R.P.M. Rademakers, J.P. Haug, et al.

DESIGN AND DEVELOPMENT OF A MILITARY ENGINE INLET RESEARCH DUCT
11
Fig 15. Deformation of the structure as it results from a
static FEM simulation
Fig 16. Strain within the structure as it results from a
static FEM simulation
5.3.2 Strength
The maximal tolerable strain within the carbon
fiber structure for static loads was defined to be
εlimit = 0.01. It was not necessary to optimize the
model with respect to strength since the
respective requirements are negligibly minor in
comparison with the stiffness requirements. The
most significant strain occurs in the front side
mountings (see Fig. 16). Nevertheless, a
strength safety margin
(3)
of S > 23 for the entire structure ensures a safe
operation at the ETF.
5.4 Dynamic structural analysis
Dynamic structural analyses were conducted to
determine the eigenmodes of the structure. The
frequencies of the eigenmodes were then
compared with possible sources, which could
excite the respective eigenmodes leading to a
hazardous vibrational response of the structure.
In the following the Blade Passing Frequency
(BPF, i.e. the 23rd engine order) of the LPC’s
first stage was considered.
It is again sufficient to determine the
eigenmodes for a single operating point of the
test vehicle. Geometrical changes of the duct
over the operating range of the test vehicle can
be neglected due to the stringent requirements
on structural stiffness (see Chapter 5.3.1).
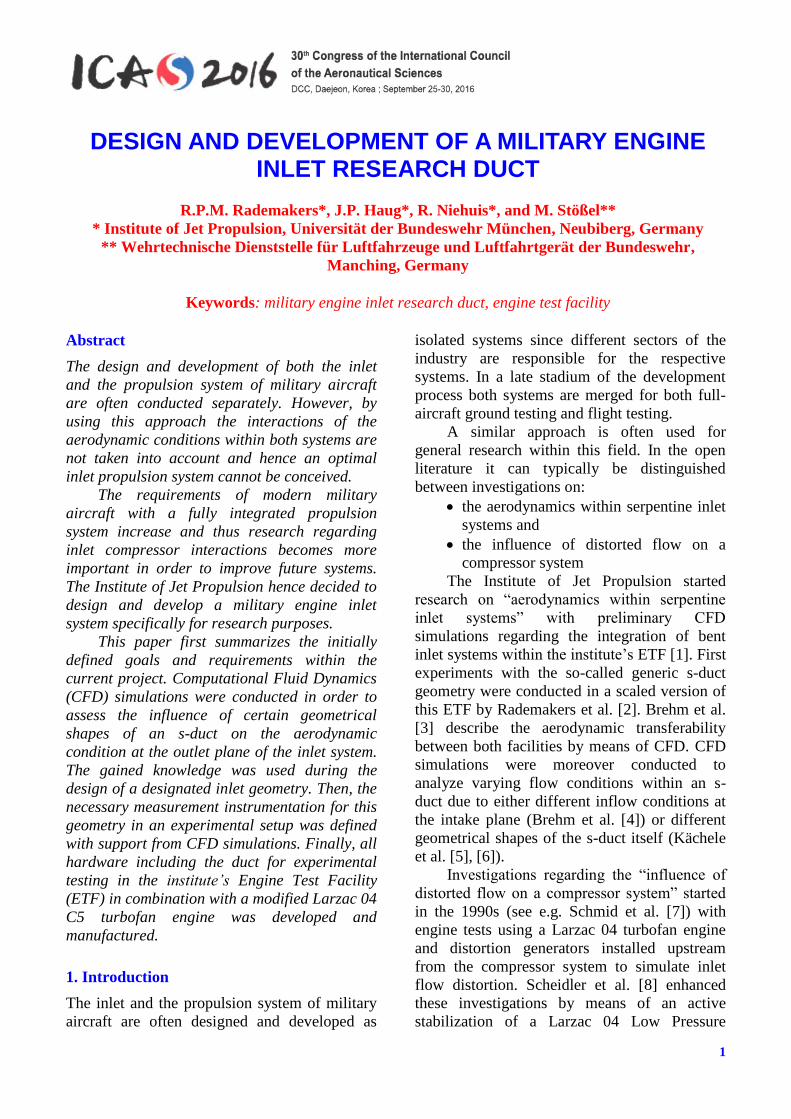
Most distinctive flow phenomena will
propagate upstream from the first stage of the
LPC with its BPF. The eigenmodes of the duct’s
structure are compared with the BPF over the
entire operating range in Fig 17. Rotating stall
can theoretically occur in the entire operating
range of the LPC. Such phenomena typically
occur with a frequency of at least 50% of the
BPF, which is correspondingly indicated with a
red area in Fig. 17. The first 40 eigenmodes of
the duct’s structure vary between 58 Hz and 737
Hz as it is depicted in blue (see Fig. 17). The
eigenmodes do not intersect with the BPF nor
typical unsteady flow phenomena, which can be
provoked due to transonic operating conditions
within the LPC.
The main motion of the structure in the
unlikely event of a modal excitation while
considering the first three eigenmodes would
occur in the front part of the system. It was
hence decided to install a tri-axial accelerometer
to monitor vibrations in this part of the structure
to fully ensure a safe operation during testing
campaigns.
6. Manufacturing and integration
All parts for the experimental setup are
manufactured and currently being integrated
within the ETF. The first experimental
investigations will be conducted by the end of
the year 2016 and results will be presented in
future publications.
12
Fig 17. Comparison of the first 40 eigenfrequencies of
the duct’s structure with the BPF of the LPC’s first stage
7. Conclusion and outlook
The geometry of a typical military engine inlet
system for research purposes was designed with
the help of CFD simulations (Goal 2). The
geometry was designed for both numerical and
experimental investigations. Because of that
reason the geometry does not include complex
shapes such as sharp edges to ensure an optimal
comparability between experimentally and
numerically obtained data. The development
process for the establishment of the actual
hardware for experimental testing was
summarized.
The instrumentation concept for the entire
experimental setup was of particular importance
in order to gain a sufficient dataset for the
validation and optimization of CFD simulations
(Goal 1). The same measurement
instrumentation enables investigations on inlet-
compressor interactions (Goal 3).
Adapters for large exchangeable inserts
were furthermore integrated in the duct’s
structure within the region where a large scale
flow separation is expected to occur. These
exchangeable inserts enables the installation of
extensive measurement instrumentation to
contribute to the fulfillment of both Goal 1 and
Goal 3. Such inserts moreover enable the
installation of devices for investigations on
passive and active flow stabilization in s-duct
engine inlet systems (Goal 4).
Nomenclature
Symbols
A cross-sectional surface [m2]
d diameter [m]
DC60max 60°-segment distortion coefficient [-]
fs sampling rate [kHz]
Ma Mach number [-]
NLc corrected spool speed of the LPC [%]
Ps static pressure [Pa]
Pt0 ambient total pressure [Pa]
Pt,loss,max total pressure loss [%]
s position at the center line [%]
S safety factor [-]
Tt0 ambient total temperature [K]
ε strain [-]
Abbreviations
AIP Aerodynamic Interface Plane
BPF Blade Passing Frequency
CAD Computer-Aided Design
CFD Computational Fluid Dynamics
DIP Duct Intake Plane
DOP Duct Outlet Plane
ETF Engine Test Facility
FEM Finite Element Method
MEIRD Military Engine Inlet Research Duct
NI National Instruments
LPC Low Pressure Compressor
UCAS Unmanned Combat Aerial System
References
[1] Muth, B., Bindl, S., Lehmann, C., Niehuis, R.,
“Numerical Investigation of Inlet Induced
Distortions of a Turbofan Engine Within an Indoor
Test Facility”, AIAA-2009-4826, In Proceedings of
the 45th AIAA/ASME/SAE/ASEE Joint Propulsion
Conference & Exhibit, Denver, Colorado, USA,
August 2009.
[2] Rademakers, R.P.M., Bindl, S., Brehm, S., Muth, B.,
and Niehuis, R., “Investigation of Flow Distortion in
an Integrated Inlet of a Jet Engine”, DLRK2013-
301349, In Proceedings of the 20th German
Aerospace, Stuttgart, Germany, September 2013.
[3] Brehm, S., Kächele, T., and Niehuis, R., “CFD
Based Comparison of the Aerodynamics within S-
Duct Inlet Configurations at Sub- and Full-Scale
Engine Test Facilities", ISABE-2015-20021, In
Proceedings of the 22nd International Symposium
on Air Breathing Engines, Phoenix, AZ, USA,
October 2015.
R.P.M. Rademakers, J.P. Haug, et al.
DESIGN AND DEVELOPMENT OF A MILITARY ENGINE INLET RESEARCH DUCT
13
[4] Brehm, S., Kächele, T., and Niehuis, R., “CFD
Investigations on the Influence of varying Inflow
Conditions on the Aerodynamics in an S-Shaped
Inlet Duct”, AIAA-2014-3595, In Proceedings of the
50th AIAA/ASME/SAE/ASEE Joint Propulsion
Conference & Exhibit, Cleveland, USA, June 2014.
[5] Kächele, T., Brehm, S., and Niehuis, R., “Parametric
CFD Study on Performance of Double-S-Shaped
Ducts with Varying Cross Sectional Shapes”,
ISAIF12-037, In Proceedings of the 12th ISAIF,
Lerici, Italy, July 2015.
[6] Kächele, T., Brehm, S., and Niehuis, R., “Numerical
Parameter Study on Influences of Geometry
Modifications on Performance of Double-S-Shaped
Ducts", ISABE-2015-20022, In Proceedings of the
22nd International Symposium on Air Breathing
Engines, Phoenix, AZ, USA, October 2015.
[7] Schmid, N. R., Leinhos, D. C., and Fottner, L.,
“Steady Performance Measurements of a Turbofan
Engine With Inlet Distortions Containing Co- and
Counter-Rotating Swirl From an Intake Diffuser for
Hypersonic Flight”, In ASME J. Turbomach. 123(2),
pp. 379–385, 2001.
[8] Scheidler, S. and Fottner, L., “Operational
Characteristics of a Twin-spool Turbofan Engine at
Inlet Distortions with Reduced Surge Margin”,
RTO-AVT-2003-029, In Proceedings of the RTO-
AVT-100 Symposium, Warsaw, Poland, October
2003.
[9] Rademakers, R.P.M., Bindl, S., and Niehuis, R.,
“Effects of Flow Distortions as They Occur in S-
duct Inlets on the Performance and Stability of a Jet
Engine”, In ASME J. Eng. Gas Turbines Power
138(2), February 2016.
[10] Rademakers, R.P.M., Bindl, S., and Niehuis, R.,
“Influence of Secondary Flow within Integrated
Engine Inlets on the Performance and Stability of a
Jet Engine”, ISABE-2015-22148, In Proceedings of
the 22nd International Symposium on Air Breathing
Engines, Phoenix, AZ, USA, October 2015.
[11] Barthmes, S., Haug, J.P., Lesser, A., and Niehuis,
R., “Unsteady CFD Simulation of Transonic Axial
Compressor Stages with Distorted Inflow”, In
Advances in Simulation of Wing and Nacelle Stall,
Eds. Radespiel, R. et al., Vol. 131 of Notes on
Numerical Fluid Mechanics and Multidisciplinary
Design, Springer, pp. 303–321, 2015.
[12] Haug, J.P., Barthmes, S., and Niehuis, R., “Full
Annulus Unsteady CFD Simulations on Effects of
Inflow Distortions in a Transonic Axial Compressor
Stage”, IGTC-2015-0090, In Proceedings of the 11th
International Gas Turbine Congress, Tokyo, Japan,
November 2015.
[13] Rademakers, R.P.M., Kächele, T., and Niehuis, R.,
“Integration of a Highly Bent Engine Inlet in an
Engine Test Facility”, ISROMAC-2016-112, In
Proceedings of the 16th International Symposium on
Transport Phenomena and Dynamics of Rotating
Machinery, Honolulu, HI, USA, April 2016.
[14] Siller, U. and Voss, C., “Automated Optimization of
a Double S-Shaped Inlet for Minimum Loss and
Reduced Sight onto the Engine Face”,
ISROMAC13-TS32, In Proceedings of the 13th
International Symposium on Transport Phenomena
and Dynamics of Rotating Machinery, Honolulu, HI,
USA, April 2010.
[15] Stößel, M., Niehuis, R., “Einrichtung einer
Messdatenerfassungsanlage mit Online-
Datenservereigenschaften mittels NI PXI und
LabVIEW Real-Time”, In Virtuelle Instrumente in
der Praxis 2010, Eds. Jamal, R. and Heinze, R.,
VDE Verlag, ISBN 978-3-8007-3235-7, pp. 25-29,
2010.
[16] Rademakers, R.P.M., Pohl, A., Niehuis, R.,
“Hochfrequente Mehrkanal Druckmessungen an
einer Triebwerkversuchsanlage”, In Virtuelle
Instrumente in der Praxis 2015, Eds. Jamal, R. and
Heinze, R., VDE Verlag, ISBN 978-3-8007-3669-0,
pp.75-78, 2015.
Copyright Statement
The authors confirm that they, and/or their company or
organization, hold copyright on all of the original material
included in this paper. The authors also confirm that they
have obtained permission, from the copyright holder of
any third party material included in this paper, to publish
it as part of their paper. The authors confirm that they
give permission, or have obtained permission from the
copyright holder of this paper, for the publication and
distribution of this paper as part of the ICAS 2016
proceedings or as individual off-prints from the
proceedings.


