Mark Wilf Ph. D.
Phone: +1 858 444 7334
RO Technology
E-mail: [email protected]
Webpage:www.rotechnology.net
1
Desalination Process Engineering Part I
Mark Wilf Ph. D. 2018
Mark Wilf Ph. D.
Phone: +1 858 444 7334
RO Technology
E-mail: [email protected]
Webpage:www.rotechnology.net
2
1. RO feed water quality requirements
1.1. Introduction
1.2. Feed water types
1.3. Sparingly soluble constituents
1.4. Particulate matter
1.5. Organic matter
1.6. Biological activity
1.7. Feed water temperature
1.8 Feed water salinity
1.8.1. Feed water pH.
2. Feed water supply alternatives
2.1. Introduction
2.2. Brackish wells
2.3. River bank filtration wells
2.4. Beach wells
2.5.Horizontal wells
2.6.Slant wells
2.7.Seawater infiltration galleries.
2.8. Open surface intake
2.8.1. Configuration of open intakes.
2.9. Estimation of intake cost
2.10. Collocation with power plant
2.11. Design criteria of feed water supply systems and configurations
2.12. Equipment and hydraulic profile
3. Configuration of feed water pretreatment process
3.1. Conventional pretreatment
3.1.1. Configurations and components of conventional pretreatment system
3.2. Membrane pretreatment
3.3. Raw water quality and pretreatment requirements.
4. Pretreatment equipment
4.1. Screening
4.2. Dissolved air flotation (DAF)
4.2.1. Example of calculation of operating cost of the DAF unit.
4.3. Coagulation and flocculation
4.4. Granular media filtration
4.4.1. Pressure filter
4.4.2. Gravity filters
4.4.3. Solids management system
Mark Wilf Ph. D.
Phone: +1 858 444 7334
RO Technology
E-mail: [email protected]
Webpage:www.rotechnology.net
3
4.4.4. Pretreatment system design method
4.5. Cartridge filtration
4.6.Membrane pretreatment
4.6.1. Configurations and components of membrane pretreatment system
4.6.2. Settling and screening
4.7. Filtration membranes and membrane unit configuration
4.7.1. Fundamentals of the membrane filtration water transport process
4.7.2. Membrane material and membrane configurations
4.7.3. Membrane filtration process
4.7.3.1. Pressure driven technology
4.7.3.1.1. Configuration of pressure driven membrane filtration unit
4.7.3.1.2. Sizing of pressure driven membrane filtration unit
4.7.3.1.3. Operating cost of pressurized membrane filtration unit
4.7.3.2. Configuration of immersed, vacuum driven, membrane filtration system
4.7.3.2.1. Sizing of immersed, vacuum driven, membrane filtration unit.
4.7.3.2.2. Operating cost of immersed membrane filtration system
4.7.4. Comparison of conventional and membrane filtration technologies as pretreatment
for seawater RO desalination systems
4.7.5. Offering of commercial membrane filtration technology
5. RO System
5.1.Membrane elements and pressure vessels
5.2.Membrane unit configuration
5.2.1. Single stage and multistage
5.2.2. Sideport, multiport and center port configuration
5.2.3. Two pass, partial two pass, split partial
5.3.Membrane cleaning
5.3.1. Configuration of membrane cleaning unit
5.3.2. Sequence of operation of cleaning unit
5.4.Membrane flushing unit configuration
5.5.RO membranes unit design criteria in accordance with feed water quality.
5.5.1. Feedwater quality parameters
5.5.2. Membrane fouling
5.5.2.1.Oxidative degradation of membrane performance
5.5.2.2.Colloidal fouling
5.5.2.3.Fouling by organic matter
5.5.2.4.Biofouling
5.5.2.5.Inorganic scale and determination of permeate recovery rate
5.6.Average permeate flux
5.7.Membrane unit design procedure
5.7.1.1.Permeate capacity and permeate quality limits
5.7.1.2.Selection of average permeate flux, recovery rate and array
Mark Wilf Ph. D.
Phone: +1 858 444 7334
RO Technology
E-mail: [email protected]
Webpage:www.rotechnology.net
4
5.7.1.3.Selection of membrane type
5.7.1.4.Membrane train size and configuration
5.7.2. Utilizing computer programs in membrane unit design
5.7.2.1.Performance safety margins
5.7.3. Configuration of RO membrane unit for high feed salinity operation – 100,000
m3/day product water capacity.
6.0.Design for RO high pressure pump and ERD
6.1.Raw water supply and transfer pumps
6.2.High pressure pumps
6.3.Optimized control methods for high pressure pump discharge head and capacity
6.3.1. Application of energy recovery devices (ERD) in RO systems
6.3.1.1.Selection of ERD
6.3.1.2.Pelton wheel
6.3.1.3.Turbocharger
6.3.1.4.Pressure exchangers (isobaric devices)
6.3.1.5.Cost and economic benefits of ERD
7.0.Chemical dosing equipment design
7.1.Selection criteria for chemicals used in the RO process
7.2.Procedure for determination of chemicals dosing rate
7.3.Criteria for sizing of chemicals storage equipment
7.4.Selection of chemical dosing pumps capacity and materials of construction
7.5.Example of sizing of chemical dosing system for SWRO plant of permeate ca-
pacity of 100,000 m3/day operating at recovery rate of 45%.
8.0.Instrument and control system
8.1.Process control strategy
8.2.Control loops in RO system
8.3.Process control and performance normalization software
8.4.Instrument selection criteria and their location in the RO system
8.5.Frequency of data collection and representative range of operating parameters.
8.6.Methods of control of operation of chemical dosing systems
8.7.Pumps process control in brackish and nanofiltration applications
8.8.Pumps process control in seawater applications
8.8.1. “Train dedicated” configuration
8.8.2. “Pressure center” configuration
9.0.Selection of materials of construction of equipment and components
10.0. Example of design of 100,000 m3/day brackish RO desalination system
10.1. Raw water source
10.2. Product water quality
10.3. Pretreatment system
10.4. Equipment description
Mark Wilf Ph. D.
Phone: +1 858 444 7334
RO Technology
E-mail: [email protected]
Webpage:www.rotechnology.net
5
10.5. Cleaning in place (CIP) unit
10.6. Post treatment
10.7. Equipment list
10.8. Computer projections for RO membrane unit without blending
10.9. Computer projections for RO unit with blending
11.0. Example of design of 100,000 m3/day seawater RO desalination system
Mark Wilf Ph. D.
Phone: +1 858 444 7334
RO Technology
E-mail: [email protected]
Webpage:www.rotechnology.net
6
Desalination Process Engineering Manual – List of Figures
Figure 1.1. Concentration factor of concentrate stream in RO applications

Mark Wilf Ph. D.
Phone: +1 858 444 7334
RO Technology
E-mail: [email protected]
Webpage:www.rotechnology.net
7
Figure 1.2. Schematics of spiral wound RO membrane element
Figure 1.3. Schematics of configuration feed – concentrate channel in RO membrane
element.
Figure 1.4. Schematic configuration of Silt Density Index (SDI) apparatus.
Figure 1.5. SEM picture of clean filter pad, before SDI memasurement.
Figure 1.6. SEM picture of clean filter pad, after SDI measurement. SDI = 2.2
Figure 1.7. SEM picture of clean filter pad, after SDI measurement. SDI = 4.8
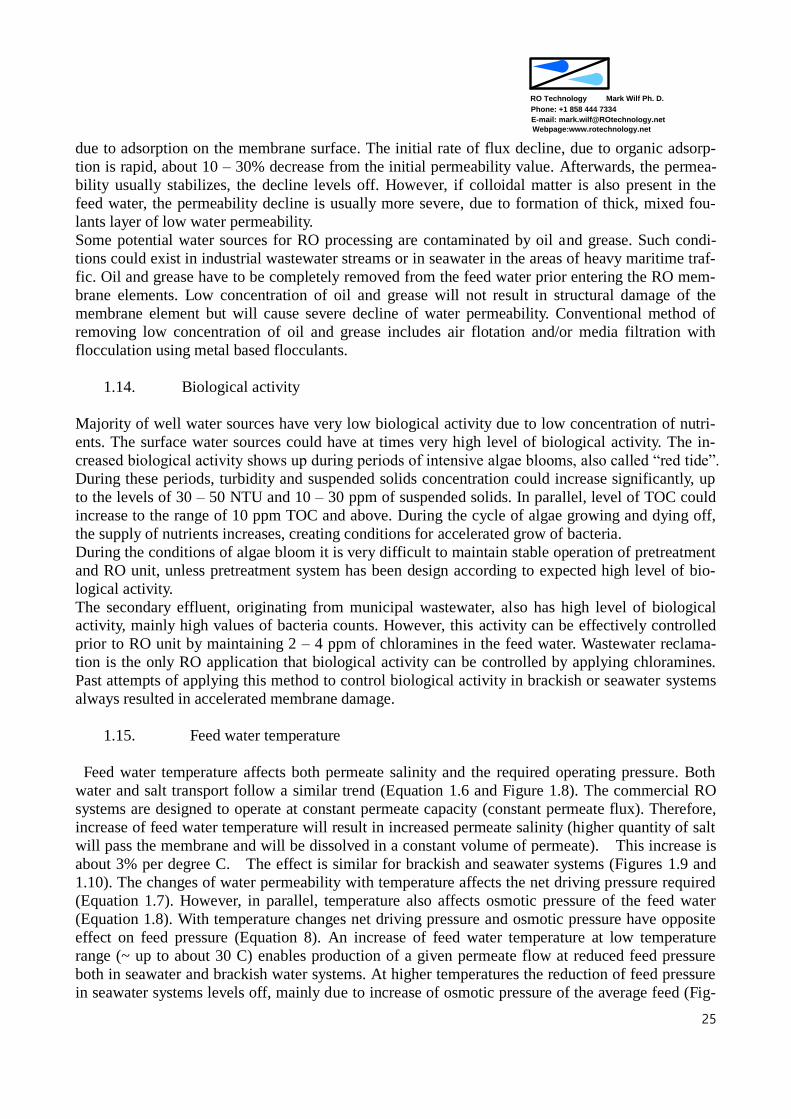
Figure 1.8 Temperature correction factor for polyamide composite membranes.
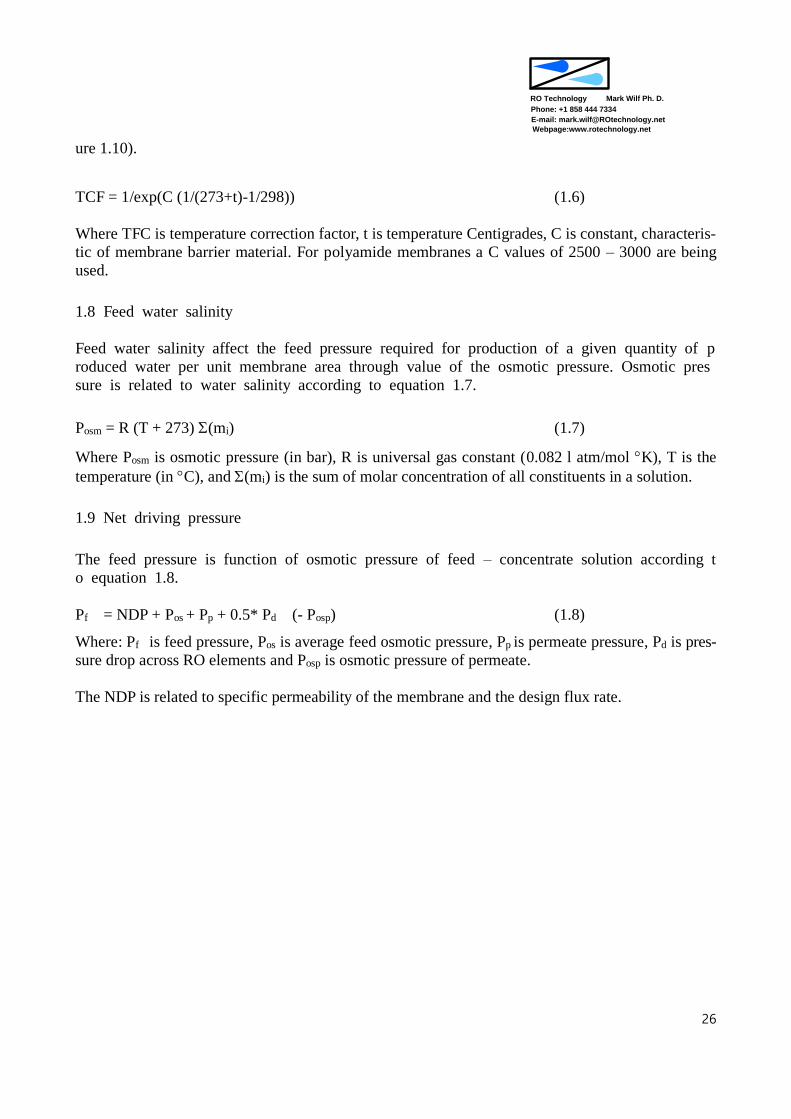
Figure 1.9 Temperature effect on permeate salinity in brackish RO systems
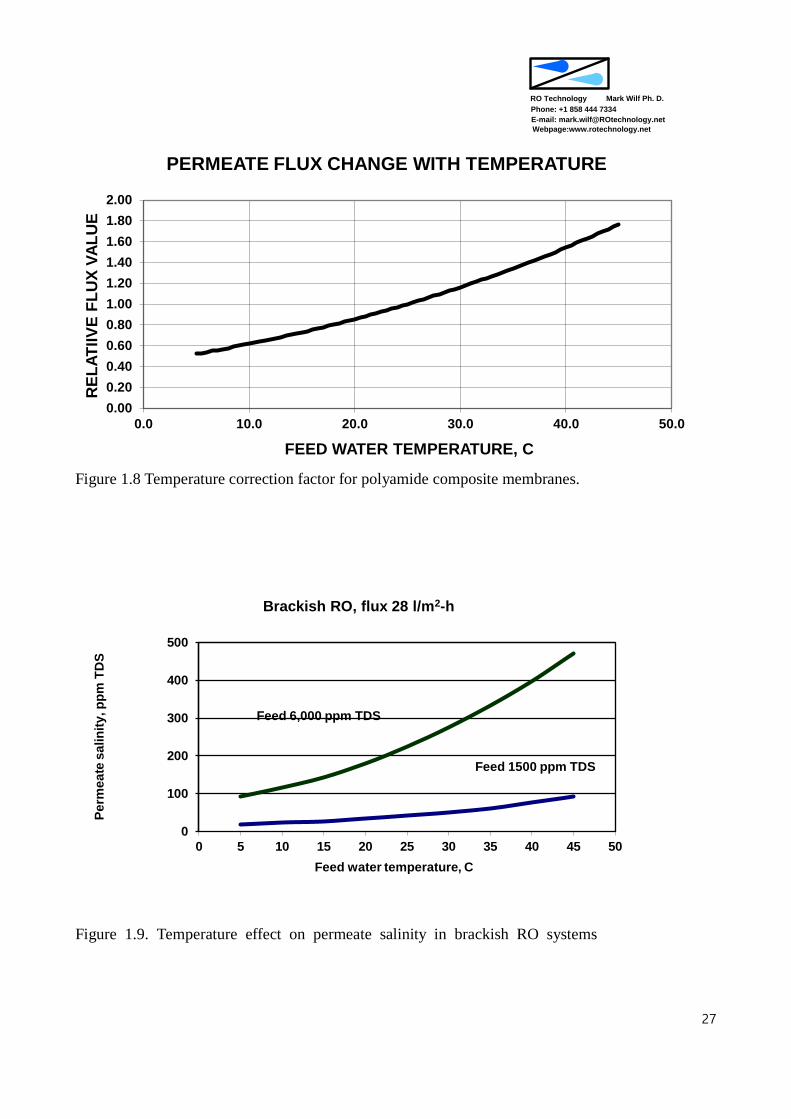
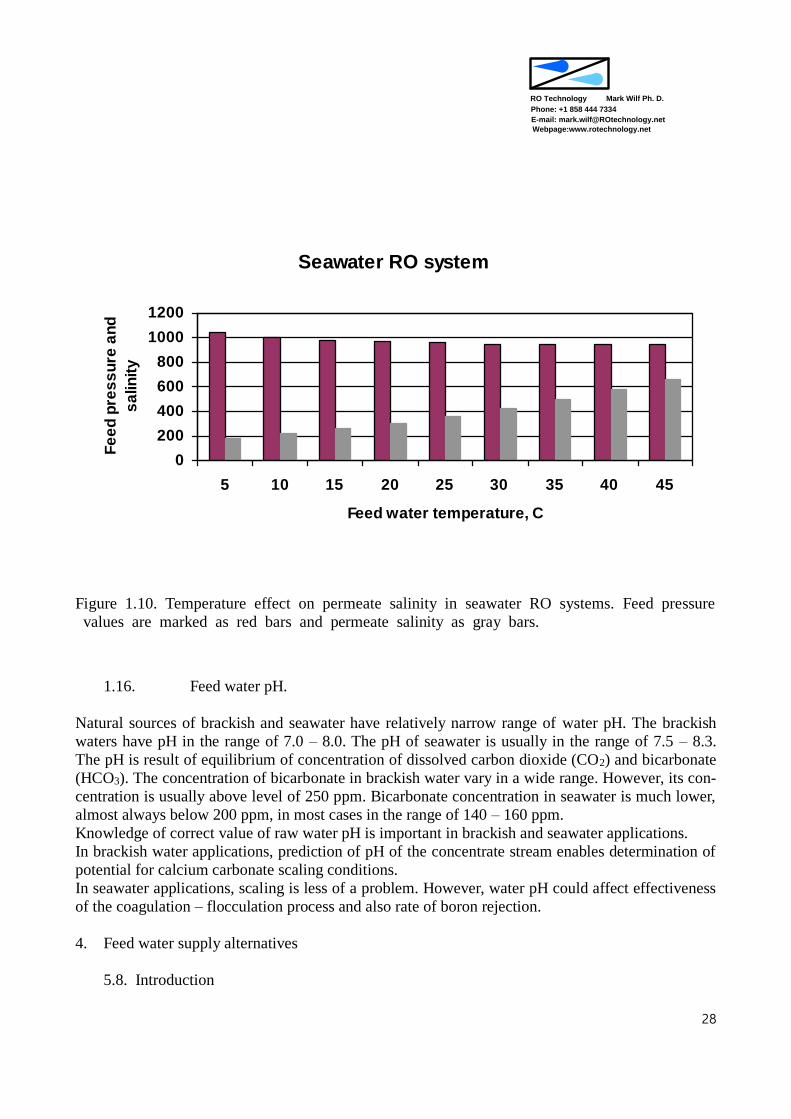
Figure 1.10. Temperature effect on permeate salinity in seawater RO systems. Feed
pressure values are marked as red bars and permeate salinity as gray
bars
Figure 2.1. Schematic configuration of veridical beach well.
Figure 2.2. Schematic diagram of collector well
Figure 2.3. Schematics of horizontal directional drilling (HDD) intake
Figure 2.4. Model of HDD intake system at 82,000 m3/day seawater RO desalination
plant, Alicante, Spain. Courtesy Neodren.
Figure 2.5. Infiltration gallery at sweater RO desalination plant, Fukuoka, Japan.
Figure 2.6. Schematic configuration of open surface off shore seawater intake.
Figure 2.7. Example of off shore intake structure (courtesy Ian Larsen)
Figure 2.8. Alternative configuration of intake structure (courtesy Ian Larsen)
Figure 2.9. Installation of concrete anchors on intake pipe (courtesy Ian Larsen).
Figure 2.10. Delivery of intake pipe with concrete anchors installed to the plant site
(Courtesy Oceana)
Figure 2.11. Intake and discharge system at SWRO desalination plant, Fukuoka, Japan
Figure 2.12. Conveyance of the feed intake and concentrate discharge lines at Fukuoka,
Japan
Figure 2.13. Concentrate discharge structure at the SWRO desalination plant, Fukuoka,
Japan.
Figure 2.14. Flow diagram of SWRO desalination plant collocated with power plant at
Carlsbad, CA.
Figure 3.1. Configuration of RO unit operating with well water.
Figure 3.2. Configuration of pretreatment unit in desalination plant treating well water.
Figure 3.3. RO system treating surface water.
Figure 3.4. Schemat-
ic configuration of seawater desalination system with membrane pretreatme
nt.
Figure 4.1.1. Dual flow intake band screen (web page Horim Industries Inc., Korea)
Figure 4.1.2. Automatic disc strainers. (Arkal Filtration Systems)
Figure 4.2.1. Schemat-
ic diagram of DAF system integrated with multi media filtration unit (courte
sy UnitedKG)
Mark Wilf Ph. D.
Phone: +1 858 444 7334
RO Technology
E-mail: [email protected]
Webpage:www.rotechnology.net
8
Figure 4.2.2. Configuration of DAF air saturator
Figure 4.2. 3. Relation between air pressure and concentration of dissolved air in water.
Figure 4.2.4. Relation between turbidity of DAF effluent and concentration of dissolved
air in water.
Figure 4.2.5. Picture of DAF installation at the Tuas, Singapore, SWRO desalination
plant.
Picture 4.3.1. Transi-
tion of Turbidity and Zeta Potential with increasing dose of coagulant (court
esy Peter Hillis).
Figure 4.3.2. Schematic diagram of configuration of coagulation – flocculation unit
Figure 4.4.1. Drawing of a vertical pressure filter (courtesy of Tonka Company)
Figure 4.4.2. Drawing of horizontal filter (courtesy of Tonka Company)
Figure 4.4.3. Examples of filter nozzles (web page of FTR, Istanbul)
Figure 4.4.4. Configuration of effluent flow control in a pressure filter
Figure 4.4.5. Configuration of vertical pressure filters with valves required for utilization
of internal source backwash water.
Figure 4.4.6. Configuration of horizontal four chambers pressure filter with valves re-
quired for utilization of internal source backwash water.
Figure 4.4.7. Alternative configuration for backwash of pressure filters from the high ser-
vice line.
Figure 4.4.8. Configuration of SWRO desalination plant at Carboneras, Spain
Figure 4.4.9. Schematic configuration of a gravity media filter.
Figure 4.4.10. Configuration of filtration layers in a gravity filter
Figure 4.4.11. Schematics of filtration driving head in the gravity filter.
Figure 4.4.11. Aerial picture of sweater RO desalination plant showing layout of gravity
filters (courtesy GES Engineering).
Figure 4.4.13. Schematic diagram of filtration system including solids management unit.
Figure 4.4.14. Jar test equipment utilized in estimation of the required dosing rate of alum
based coagulant. (Courtesy Peter Hillis).
Figure 4.4.15. Schematic diagram of a pilot unit for testing of a gravity filtration process.
Figure 4.5.1. Schematic configuration of cartridge filtration unit.
Figure 4.5.2. Picture of horizontal housing of cartridge filter.
Figure 4.5.3. Horizontal cartridge filter housing in open position.
Figure 4.6.1. Block diagram of submersible membrane filtration system
Figure 4.6.2. Block diagram of pressure driven membrane filtration system
Figure 4.6.3. Microstrainer configuration offered by Arkal.
Figure 4.6.4. Side view of microstrainer assembly. System width 13.9 m
Figure 4.6.5. Top view of microstrainer assembly. System length 10.1 m
Figure 4.6.6. Wedged screen strainer configuration
Figure 4.7.1. Temperature correction factor vs. water temperature
Mark Wilf Ph. D.
Phone: +1 858 444 7334
RO Technology
E-mail: [email protected]
Webpage:www.rotechnology.net
9
Figure 4.7.2. Separation size range of filtration technologies.
Figure 4.7.3. Filtrate flow direction in pressure drive capillary membranes: a – PDI, b -
PDO.
Figure 4.7.4. . Filtration step – direct flow mode of operation
Figure 4.7.5. Backwash step.
Figure 4.7.6. Integrity test sequence.
Figure 4.7.7. Configuration of pressure driven membrane filtration unit
Figure 4.7.8. Pressure driven membrane filtration system (courtesy Simens Water Tech-
nologies)
Figure 4.7.9. a. Valves position during filtration step
Figure 4.7.9. b. Valves position during backwash step
Figure 4.7.9. c. Valves position during backwash step
Figure 4.7.9. d. Valves position during chemical enhanced backwash step
Figure 4.7.9. e. Valves position during system draining step
Figure 4.7.9. f. Valves position during air pressurizing step
Figure 4.7.10. Configuration of immersed, vacuum driven, membrane filtration unit
Figure 4.7.11. Layout of immersed membrane filtration system (courtesy Siemens Water
Technologies)
Figure 4.7.12. Configuration of conventional pretreatment system for SWRO
Figure 4.7.13. Configuration of immersed membrane pretreatment system for SWRO
Figure 4.7.14. Membrane filtration train with Hydracap modules – Hydranautics
Figure 4.7.15. Membrane filtration train with Xiga modules – Norit
Figure 4.7.16. Membrane products offered by Inge
Figure 4.7.17. Membrane products offered by Pall – Asahi
Figure 4.7.18. Pressurized membrane filtration products (CP) offered by Siemens
Figure 4.7.19. Immersed membrane filtration products (CS) offered by Siemens
Figure 4.7.20. Immersed membrane filtration products (ZW-1000) offered by GE (Zenon)
Figure 5.1.1. 200mm by 1000 mm spiral wound element
Figure 5.1.2. 200mm by 4000 mm spiral wound element
Figure 5.1.3. Configuration of pressure vessel with membrane elements
Figure 5.1.4. Flux distribution along the length of pressure vessel
Figure 5.2.1. Single stage membrane unit configuration
Figure 5.2.2. Schematic diagram of two stage membrane unit
Figure 5.2.3. Mechanical drawings of RO membrane train
Figure 5.2.4. Configuration of a side port pressure vessel
Figure 5.2.5. Single stage membrane unit with side port pressure vessels
Figure 5.2.6. Single stage membrane unit with multiport port pressure vessels
Figure 5.2.7. Two stage membrane unit with multiport port pressure vessels - configura-
tion 1
Mark Wilf Ph. D.
Phone: +1 858 444 7334
RO Technology
E-mail: [email protected]
Webpage:www.rotechnology.net
10
Figure 5.2.8. Two stage membrane unit with multiport port pressure vessels - configura-
tion 2
Figure 5.2.10 Schematic configuration of membrane unit utilizing center port pressure
vessels
Figure 5.2.11 Schematic configuration of a two pass unit
Figure 5.2.12 Two pass system with second pass concentrate recirculation
Figure 5.2.13 Schematic configuration of partial two pass processing
Figure 5.2.14 Permeate salinity distribution along the pressure vessel
Figure 5.2.15 Split partial two pass configuration
Figure 5.2.16. Two pass split partial processing
Figure 5.3.1. Configuration of membrane cleaning unit
Figure 5.71. Alternative configurations of membrane trains in large capacity RO plants
Figure 5.7.2 Computer projections program – water analysis data entry screen
Figure 5.7.3. Computer projections program – process parameters and membrane array
entry screen
Figure 5.7.4. Computer projections program – membrane elements look up table
Figure 5.7.5. Computer projections program – screen display of calculation results
Figure 5.7.6. Printout of calculation results
Figure 5.7.7. Split partial configuration of a 12,500 m3/day SWRO train
Figure 6.1. Energy usage in RO desalination systems
Figure 6.2 Pressure centers configuration of a large capacity SWRO plant.
Figure 6.3. Pelton Wheel
Figure 6.4. Pelton Wheel – electric motor – high pressure pump unit
Figure 6.5 Concentrate foaming at the Pelton Wheel outlet
Figure 6.6 Configuration of Hydraulic Turbocharger
Figure 6.7. Brackish RO train with Hydraulic Turbocharger in the interstage position
Figure 6.8 Hydraulic Turbocharger positioned after high pressure pump in seawater
RO unit
Figure 6.9. Examples of configurations of seawater (left) and brackish (right) RO units
with Hydraulic Turbocharger
Figure 6.10. Example of calculations of pressure boost provided by Hydraulic Turbo-
charger in seawater and brackish RO membrane unit
Figure 6.11. Hydraulic Turbocharger equipped with electric motor.
Figure 6.12. Schematic configuration of RO membrane unit with isobaric energy recov-
ery device.
Figure 6.13 Configuration of DWEER energy recovery device
Figure 6.14 DWEER isobaric EDR assembly operating in 330,000 m3/day SWRO plant,
Ashkelon, Israel.
Figure 6.15 Configuration of PX energy recovery device (ERI)
Figure 6.16 Large assembly of PX ERD’s.
Mark Wilf Ph. D.
Phone: +1 858 444 7334
RO Technology
E-mail: [email protected]
Webpage:www.rotechnology.net
11
Figure 6.17. ISave ERD introduced by Danfoss
Figure 8.1. Basic process control of RO membrane unit
Figure 8.2. Schematic configuration of control system in RO desalination plant
Figure 8.3 Control system configuration – no backup control equipment
Figure 8.4. Control system configuration – ‘hot” backup (PLC only)
Figure 8.5 Control system configuration – complete backup (PLC and IO’s)
Figure 8.6. Pumping units and RO membrane trains in “train dedicated” configuration
Figure 8.7. Pumping units and RO membrane trains in “pressure centers” configuration
Figure 8.8 Pumping unit with Pelton Wheel EFD
Figure 8.9 High pressure pump and hydraulic turbocharger in feed entry position
Figure 8.10 10 Hydraulic turbocharger in the interstage position
Figure 8.11 High pressure pumping unit utilizing isobaric ERD
Mark Wilf Ph. D.
Phone: +1 858 444 7334
RO Technology
E-mail: [email protected]
Webpage:www.rotechnology.net
12
Desalination Process Engineering Manual – List of Tables
Table 1.1. Examples of representative compositions of brackish, sea water and
secondary wastewater effluent.
Table 2.1. Listing of large SWRO desalination facilities that utilize beach wells
Table 2.2. Economic weight of various alternatives of sea water supply to RO de-
salination plants
Table 2.3. Intake – outfall system cost parameters
Table 2.4. Cost components of intake – outfall system. 300,000 m3/day inflow,
150,000 m3/day outfall
Table 2.5 Example of values of constants used in Haze – Williams and Darcy
equations
Table 2.6. Example of pipe friction loses according to pipe diameter.
Table 3.1. Representative raw water quality associated with major types of water
supply sources
Table 3.2. Recommended configuration of pretreatment system according to raw
water quality
Table 4.2.1. Representative design parameters of DAF system
Table 4.2.2. Example of energy usage of air saturation unit for a DAF system for the
raw water flow of 1000 m3/hr.
Table 4.2.3. Design parameters of a DAF unit, 100,000 m3/day effluent capacity
Table 4.3.1. Preliminary specifications of coagulation – flocculation unit. Nominal
flow capacity 100,000 m3/day.
Table 4.4.1. Range of specifications parameters of filtration media.
Table 4.4.2. Recommended values of filtration media parameters
Table 4.4.3. Design parameters of media filtration system utilizing horizontal filters.
System effluent capacity 100,000 m3/day.
Table 4.4.4. Design parameters of media filtration system utilizing gravity filters.
System effluent capacity 100,000 m3/day.
Table 4.4.5. Design parameters of solids management unit for a filtration system.
Filtration system capacity 100,000 m3/day
Table 4.7.1. Example of the permeability results at ex-factory test and during field
operation
Table 4.7.2. Attributes of PDI and PDO membranes configuration
Table 4.7.3. Summary of process parameters of pressure driven and submersible
technologies.
Table 4.7.4. Air assisted backwash of the pressurized (PDI) membrane filtration
system
Table 4.7.5. Sequence of operation of pressure driven membrane filtration unit.
Table 4.7.6. Water quality parameters of surface water source
Mark Wilf Ph. D.
Phone: +1 858 444 7334
RO Technology
E-mail: [email protected]
Webpage:www.rotechnology.net
13
Table 4.7.7. Example of operational parameters and schedule of pressurized mem-
brane filtration system
Table 4.7.8. Example of sizing calculations of 200,000 m3/day pressurized mem-
brane filtration system
Table 4.7.9. Example of sizing of chemicals dosing equipment in pressurized mem-
brane filtration system
Table 4.7.10. Listing of subunits and major equipment in pressurized membrane fil-
tration system
Table 4.7.11. Breakdown of energy usage in pressurized membrane filtration system.
Filtrate capacity 200,000 m3/day
Table 4.7.12. Summary of volumes required for CEB and CIP in pressurized mem-
brane filtration system
Table 4.7.13. Summary of chemicals usage in pressurized membrane filtration sys-
tem. Filtrate capacity 200,000 m3/day.
Table 4.7.14. Summary of operating cost of pressurized membrane filtration system
Table 4.7.15. Sequence of operation of immerse, vacuum driven, membrane filtration
unit.
Table 4.7.16. Example of operational parameters and schedule of immersed mem-
brane filtration system
Table 4.7.17. Example of sizing calculations of 200,000 m3/day immersed membrane
filtration system
Table 4.7.18. Listing of subunits and major equipment, immersed membrane filtra-
tion system
Table 4.7.19. Breakdown of energy usage in immersed membrane filtration system.
Filtrate capacity 200,000 m3/day
Table 4.7.20. Summary of volumes required for CEB and CIP in immersed mem-
brane filtration system
Table 4.7.21. Summary of chemicals usage in immersed membrane filtration system.
Filtrate capacity 200,000 m3/day.
Table 4.7.22. Summary of operating cost in immersed membrane filtration system
Table 4.7.23. Summary of comparison of relative advantages of multimedia and
membrane filtration systems for SWRO applications
Table 4.7.24. Estimated capital cost of multimedia filtration and membrane filtration
units. Filtrate capacity 200,000 m3/day
Table 4.7.25. Listing of established suppliers of commercial membrane filtration
products
Table 5.1.1. Recovery rates of individual elements in pressure vessel according to
number of elements.
Table 5.1.2. Example of representative dimensions of commercial pressure vessels
for RO applications

Mark Wilf Ph. D.
Phone: +1 858 444 7334
RO Technology
E-mail: [email protected]
Webpage:www.rotechnology.net
14
Table 5.2.1. Comparison of side port and center port configurations
Table 5.2.2. Comparison of conventional two pass and split partial two pass config-
uration
Table 5.3.1. General specifications of cleaning equipment
Table 5.5.1. Summary of membrane fouling categories and their symptoms
Table 5.5.2. Summary of membrane fouling processes for various desalination ap-
plications and possible cause of fouling
Table 5.5.3. Controlling phosphate scaling through pH adjustment
Table 5.5.4. Quantity of sulfuric acid required to maintain given pH of the concen-
trate
Table 5.5.5. Ksp and concentration limits for scale forming compounds common to
RO
Table 5.5.6. Practical limits of saturation values in RO applications
Table 5.5.7. Common range of permeate recovery rate in RO applications
Table 5.5.8. Process parameters affected by permeate recovery rate
Table 5.6.1. Common range of average permeate flux in RO applications
Table 5.6.2. Process parameters affected by permeate flux
Table 5.7.1 Range of RO design parameters according to application and feed wa-
ter source
Table 5.7.2. Examples of representative membrane elements models according to
applications
Table 5.7.3. Representative offering of nanofiltration membrane elements
Table 5.7.4. Representative offering of brackish membrane elements
Table 5.7.5. Representative offering of seawater membrane elements
Table 5.7.3.1. Basic process parameters of a 100,000 m3/day SWRO system
Table 6.1. Calculation of energy total energy usage in RO systems of permeate
capacity of 40,000 m3/day
Table 6.2. Comparison of operating parameters of pumping unit in SWRO
100,000 m3/day plant.
Table 6.3. Comparison of cost of pumping – energy recovery equipment alterna-
tives for SWRO 100,000 m3/day plant.
Table 7.1. . Listing of chemicals used in RO and NF applications.
Table 7.2. Procedures for determination of chemicals dosing rate
Table 7.3. Representative materials of construction for chemical dosing systems
Table 7.4. System process information for 100,000 m3/day SWRO system
Table 7.5. Usage of treatment chemicals in 100,000 m3/day SWRO system
Table 7.6. Sizing of chemical dosing pumps
Table 9.1. Selection of piping material according to application
Table 9.2. Relevant composition and PREN values of alloy steels
Table 9.3. Recommended flow velocity range in RO applications

Mark Wilf Ph. D.
Phone: +1 858 444 7334
RO Technology
E-mail: [email protected]
Webpage:www.rotechnology.net
15
Table 10.1. Well water quality
Table 10.2 Permeate and product water quality
Table 10.3. Pretreatment system design data
Table 10.4. System design data
Table 10.5 CIP unit design data
Table 10.6. Post treatment unit design data
Table 10.7. Major equipment list
Guidelines for process development and design of brackish water and seawater membrane desalina-
tion systems. The guidelines will be based on design approach for a 100,000 m3/day seawater and
brackish water desalination units.
3. RO feed water quality requirements
1.9. Introduction
Feed water quality requirements for RO and NF applications are results of unique conditions of the
RO/NF process and configuration and properties of membrane elements.
During the membrane desalination process fraction of feed water is converted to permeate and vol-
ume of feed water is reduced. Concentration of all constituents is increased. The concentration of
constituents in concentrate stream, leaving the membrane unit is higher than concentration in the
feed water according to the concentration factor (CF), which is related to recovery rate (R):
CF = 1/(1 – R) (1.1)
The recovery rate in RO units ranges from 40% - 60% for seawater systems and 75% - 90
% in RO/NF units. As illustrated in Figure 1.1, concentration of all constituents, entering th
e membrane unit with the feed stream will be increased significantly in the concentrate stre
am.

Mark Wilf Ph. D.
Phone: +1 858 444 7334
RO Technology
E-mail: [email protected]
Webpage:www.rotechnology.net
16
Figure 1.1. Concentration factor of concentrate stream in RO applications.
Accordingly, concentration of some soluble constituents of the feed water could exceed their satura-
tion concentration during the desalination process, precipitate from solution and deposit on the
membrane surface.
The other concern is related to presence of suspended and colloidal solids in the feed water. In the
spiral configuration of membrane element, shown schematically on Figure 1.2, feed water flows
through narrow feed channels, shown schematically on Figure 1.3.
0.001.002.003.004.005.006.007.008.009.00
10.00
0% 20% 40% 60% 80% 100%
Co
nce
ntr
atio
n f
acto
r
Recovery rate
Concentration Factor in RO System

Mark Wilf Ph. D.
Phone: +1 858 444 7334
RO Technology
E-mail: [email protected]
Webpage:www.rotechnology.net
17
Feed
Concentrate
Product
Membrane
Permeate
Carrier
Brine Spacer
Figure 1.2. Schematics of spiral wound RO membrane element
Feed channel
Feed spacer
configuration
0.7 mm (0.031”)
Configurations of feed channel and feed spacer net
Figure 1.3. Schematics of configuration feed – concentrate channel in RO membrane element.
The nominal height of the feed channel is about 0.7 mm and the channel is filled with feed spacer
that promotes turbulence. Therefore, the effective channel opening for feed flow is even smaller
than 0.7 mm. Any particulate matter, present in feed water, could be trapped in the feed spacer and
Mark Wilf Ph. D.
Phone: +1 858 444 7334
RO Technology
E-mail: [email protected]
Webpage:www.rotechnology.net
18
block water flow in the feed channels. For this reason, particulate matter has to be removed from
RO feed water in the feed water pretreatment system.
Feed water quality parameters are defined mainly in terms of concentration of constituents that
could exceed saturation limits and precipitate on the membrane surface and particulate matter that
could block passage of the membrane elements feed channels and also deposit on the membrane
surface, increasing resistance to water flow.
1.10. Feed water types
The composition and quality of water, considered for processing by reverse osmosis is influenced
by its origin. For reverse osmosis application water of interest is the one with ions composition that
exceeds potable water limits. In brackish water RO applications the ions that commonly exceed po-
table water limits are calcium, magnesium, sulfates and chlorides. Less common dissolved constitu-
ents of brackish water, that may require reduction of concentration, are fluoride and nitrate. Some
waters may contain also excessive concentrations of iron, manganese, organic matter, color, hydro-
gen sulfite and sometimes even radioactive isotopes.
Potable water limits are specified by World Health Organization (1) and regional Health Authorities.
Accordingly, one may define brackish water as any water of composition of soluble species exceed-
ing potable water limits. The potable water limits, or acceptance of water composition for potable
application can vary from country to country, according to local affordability of treatment methods.
However, it is commonly accepted that water of salinity exceeding 1000 ppm is considered as
brackish and requires treatment for salinity reduction.
The upper limit of water salinity that can be effectively treated with brackish RO membranes, in a
single pass configuration, is about 10,000 ppm. On the low end of salinity spectrum there are some
water sources that have salinity in the potable range but still require membrane treatment. This is usually due to presence of excessive concentration of hardness, iron, organics and/or color. The low
salinity water sources are usually treated with loose RO membranes, commonly called as softening
or nanofiltration membranes.
The composition of brackish water can vary widely. The composition is usually specific for the aq-
uifer it originates from. If brackish water aquifer is very large and/or water is pumped at the rate it
is being replenish by natural infiltration, then the composition remains stable. In case of excessive
pumping the composition may change. In case of utilization of coastal aquifer there is possibility of
seawater intrusion and salinity increase. For other locations there will be influence on composition
from adjacent underground bodies of water due to hydrostatic pressure difference.
Seawater sources are characterized by high salinity, in the range of 30,000 ppm TDS to 47,000 ppm
TDS. The ion composition includes mainly sodium and chloride, about 85% combined. The remain-
ing fraction consists of sulfate (~ 8%), magnesium (~ 4%), calcium, potassium (~1.2% each) and
bicarbonate (~0.6%). Boron is one of low concentration constituents. It is present in seawater at
concentration of about 3 – 5.5 ppm. However, boron concentration is becoming increasingly im-
portant parameter of the process design as its concentration is being specified in RO permeate. Due
to relatively low rejection by RO membranes of boron species existing in seawater, stringent boron
specifications have significant effect on process design and product water cost. At majority of loca-
tions the ions composition of seawater is quite consistent and fluctuates in narrow range. Tempera-
ture of seawater usually reflects the seasonal fluctuations of ambient temperatures but could be af-
fected by temperature of local water currents. At some locations, where rivers discharge or rain sur-

Mark Wilf Ph. D.
Phone: +1 858 444 7334
RO Technology
E-mail: [email protected]
Webpage:www.rotechnology.net
19
face run off is present, the fluctuations of salinity and concentration of suspended matter could vary
in a wide range and require careful consideration during the process design stage.
As a part of the design process of RO plant the feed water sources should be evaluated to determine
the following:
1. How feed water ions composition and temperature will affect quality of permeate and the
required feed pressure?
2. Does water source contain sparingly dissolved species at concentration that could result in
membrane scaling at the design recovery rate?
3. Does water source contain particulate matter that could plug feed channels of membrane el-
ements?
4. Does water source contain organic matter at concentration that could adsorb on membrane
surfaces and result in significant permeability decline?
5. What is the level of biological activity? Can it result in biofouling of membranes?
Preliminary determination of the suitability of given water source for RO processing and require-
ments of the pretreatment process, is conducted based on results of analysis of water samples from
the water source under consideration. During the initial evaluation of water analysis it is important
to check if the water analysis report contains values of important water quality parameters and con-
centration of major ions. The primary group of water composition data includes: pH, temperature,
turbidity, electric conductivity and concentrations of Ca, Mg, Na, K, HCO3, SO4, Cl SiO2, Fe, Mn
and TOC. Additionally, concentration of any species that their maximum concentration had been
defined in permeate, should be also determined in the feed water source, for example concentration
of NO3 or B. The analysis should be balanced, i.e. sum of miliequivalents of positively charged
ions (cations) should be similar to the sum of equivalents of negatively charged ions (anions).
In addition to feed water composition, suitability of raw water for RO processing is defined by the water source. The common sources of feed water for RO/NF applications are:
1. Deep wells. The water originating from deep wells is usually brackish of low or high sa-
linity. In most cases well water from deep wells has very low concentration of suspended
and colloidal particles.
2. Shallow wells. This category includes low salinity brackish wells, drilled in the shallow aquifer, river bank filtration wells and wells supplying seawater: beach or collector wells.
Water from these wells has also low concentration of particulate matter but sometimes
could contain elevated concentration of organics. .
3. Surface water sources usually represent seawater intakes. In majority of cases, concentra-tion of suspended solids fluctuates in a wide range and extensive pretreatment is required
for suspended solids reduction.
4. Wastewater, either secondary or tertiary effluent. This water source is characterized by el-
evated concentration of suspended solids and organics. In cases when wastewater source represents effluent of membrane bioreactor (MBR), then it contains elevated concentra-
tion of organics but concentration of suspended solids is quite low.
Table 1.1. Examples of representative compositions of brackish, sea water and secondary
wastewater effluent.

Mark Wilf Ph. D.
Phone: +1 858 444 7334
RO Technology
E-mail: [email protected]
Webpage:www.rotechnology.net
20
Feed constituent Low salinity brackish High salinity brack-
ish
Medium salinity
seawater
Secondary effluent
Ca 83 254 449 50
Mg 66 120 1387 10
Na 350 1214 12179 350
K 4 12 418 10
HCO3 340 100 158 159
SO4 74 778 3200 100
Cl 600 2034 21555 454
F 0.8 2.4 1 2
NO3 46 1.0 10
B 5 0.6
SiO2 29 16 10
TOC 0.5 0.5 1.0 15
1563.8 4514.4 39347 1215
1.11. Sparingly soluble constituents
During the RO process concentration of all constituents increases due to reduction of the feed water
volume. This increase of concentration is function of permeate recovery (Equation 1.1). Some of
the constituents presented in natural waters can precipitate if the concentration product of salt form-
ing ions exceeds its solubility product: Ksp. For a given salt of composition CmAn in equilibrium of
solid phase salt (S) with dissolved ions, the Ksp is defined as:
CmAn(S) = mC+n + nA-m (1.2)
Ksp = [C+n ]m [A-m]n (1.3)
SI = [C]m [A]n / Ksp (1.4)
Where C stands for cation and A for anion, m and n are valency coefficients. Brackets [ ] indicate
molar concentration of a given ion in solution. SI is the saturation index, indicating excess concen-
tration of a given salt in comparison to its saturation value.
The Ksp is determined through measurement of ions concentrations in solution at saturation condi-
tions (in equilibrium with solid phase). Ksp value is specific for a given salt and it is function of
temperature and ionic strength of the solution. In brackish systems, treating natural waters, the salt
of concern is mainly calcium carbonate. Less frequently calcium sulfate and silica are at concentra-
tions that my result in scale formation. In very rare cases barium sulfate, ferrous sulfide, and ferrous
carbonate could be present at concentrations that may form scale at high recoveries. In RO sys-
tems treating municipal effluents calcium phosphate sometimes forms in the tail elements. Calcium
carbonate is the most common scaling constituent in brackish waters but also the easiest to control
either with pH adjustment or use of scale inhibitor.
Discussion on scaling potential of sparingly soluble salts is included in Chapter 5.4.2
1.12. Particulate matter
RO feed water entering membrane elements, should have low concentration of particulate matter.
The commonly accepted quality indicators of RO feed water in this respect include:
1. Turbidity
Mark Wilf Ph. D.
Phone: +1 858 444 7334
RO Technology
E-mail: [email protected]
Webpage:www.rotechnology.net
21
2. Suspended solids concentration
3. Silt density index (SDI)
Turbidity determination, usually expressed as nephelometric turbidity units (NTU) is determined
through measurements of intensity of light scattered by suspended particles in water samples.
Suspended solids concentration is determined by filtration of measured volume of water sample and
weighting of dry residue on the filter.
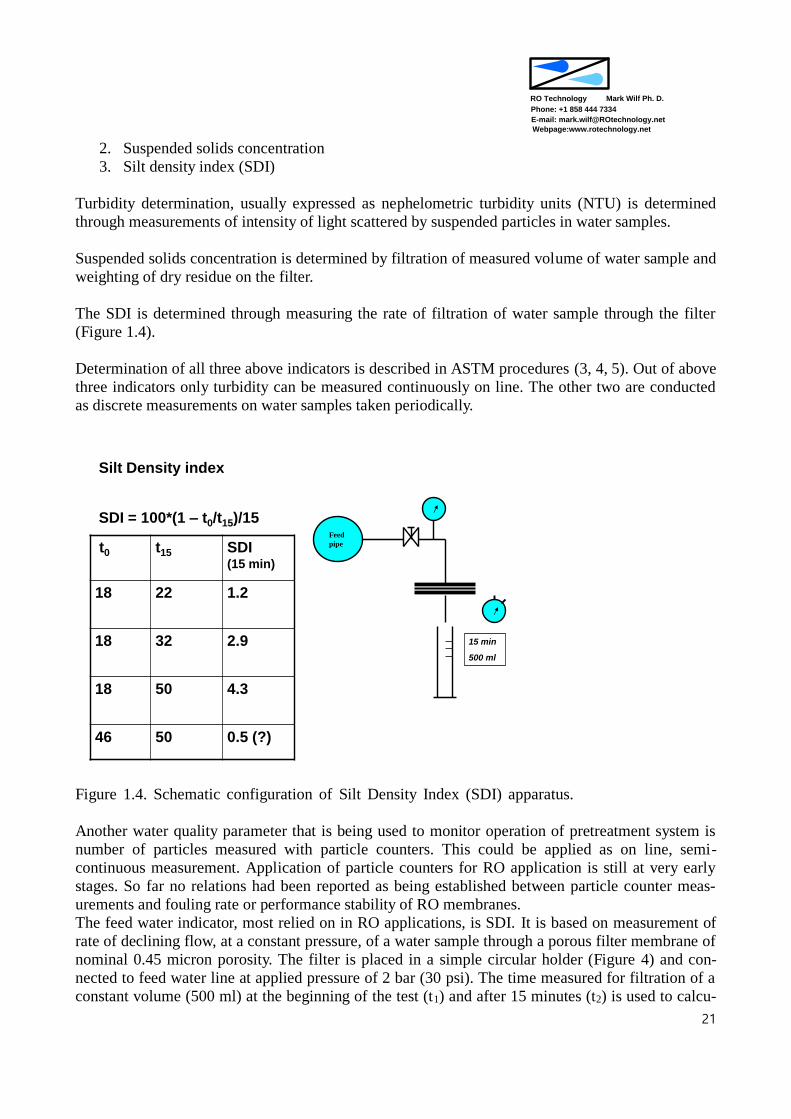
The SDI is determined through measuring the rate of filtration of water sample through the filter
(Figure 1.4).
Determination of all three above indicators is described in ASTM procedures (3, 4, 5). Out of above
three indicators only turbidity can be measured continuously on line. The other two are conducted
as discrete measurements on water samples taken periodically.
Silt Density index
SDI = 100*(1 – t0/t15)/15
t0 t15 SDI (15 min)
18 22 1.2
18 32 2.9
18 50 4.3
46 50 0.5 (?)
15 min
500 ml
Feed
pipe
Figure 1.4. Schematic configuration of Silt Density Index (SDI) apparatus.
Another water quality parameter that is being used to monitor operation of pretreatment system is
number of particles measured with particle counters. This could be applied as on line, semi-
continuous measurement. Application of particle counters for RO application is still at very early
stages. So far no relations had been reported as being established between particle counter meas-
urements and fouling rate or performance stability of RO membranes.
The feed water indicator, most relied on in RO applications, is SDI. It is based on measurement of
rate of declining flow, at a constant pressure, of a water sample through a porous filter membrane of
nominal 0.45 micron porosity. The filter is placed in a simple circular holder (Figure 4) and con-
nected to feed water line at applied pressure of 2 bar (30 psi). The time measured for filtration of a
constant volume (500 ml) at the beginning of the test (t1) and after 15 minutes (t2) is used to calcu-
Mark Wilf Ph. D.
Phone: +1 858 444 7334
RO Technology
E-mail: [email protected]
Webpage:www.rotechnology.net
22
late the SDI according to the following equation:
SDI = 100% (1-t1/t2)/15 (1.5)
If the filter plugs to fast for meaningful determination of the filtration time, the volume of filtrate
being collected or time between measurements can be decreased. However, the SDI values deter-
mined for shorter test time or smaller filtrate volume are only indicative of poor water quality and
not very useful for the pretreatment system design process. As shown in Figure 1.4 (last entry in the
table) it is possible to have long filtration times and still calculate low SDI values. If the reading for
filtration time t1 significant exceeds 30 seconds then most likely there is a problem with equipment
or test conditions. The SDI method is very sensitive to concentration of foulants but it is not very
accurate. No meaningful correlation has been established between values of SDI and turbidity.
Attempts to improve accuracy of this method led to introduction of Modified Fouling Index (MFI).
The test for MFI is based on measurement of pressure increase required for maintaining of constant
filtration rate through well defined membrane filter (6). The MFI results are more reproducible than
SDI but the test is difficult to perform manually and automatic equipment is necessary (7) for a rou-
tine determination in the field conditions.
According to the equation 1.5, the maximum value of SDI (for 15 min measuring interval) can be
only 6.67. The majority of membrane manufacturers specify upper limit for feed water SDI as 5.
However, field results show that for stable, long term performance of RO elements, the SDI of feed
water should be consistently below the value of 4. Some limited research works (X) demonstrated
that in respect of solids concentration the SDI scale is a geometric one. Therefore, for water having
SDI = 3 and another water having SDI = 5 the corresponding suspended solids concentration differ-
ence is about four times higher.
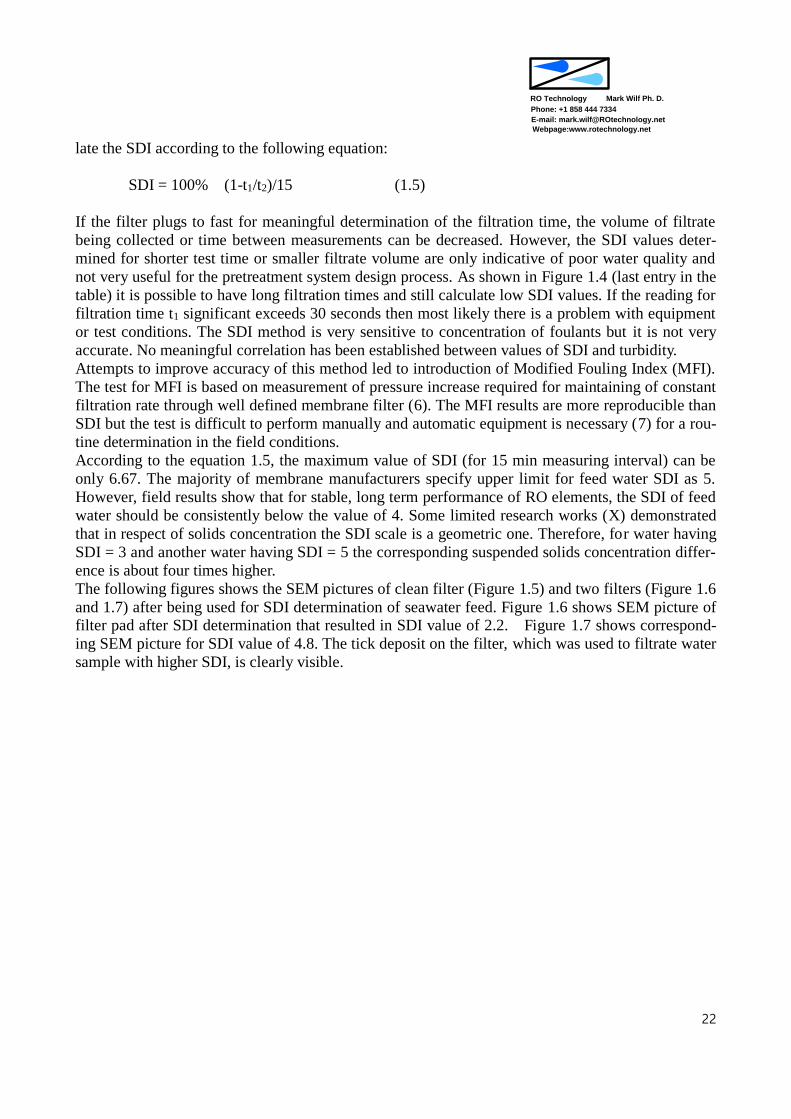
The following figures shows the SEM pictures of clean filter (Figure 1.5) and two filters (Figure 1.6
and 1.7) after being used for SDI determination of seawater feed. Figure 1.6 shows SEM picture of filter pad after SDI determination that resulted in SDI value of 2.2. Figure 1.7 shows correspond-
ing SEM picture for SDI value of 4.8. The tick deposit on the filter, which was used to filtrate water
sample with higher SDI, is clearly visible.

Mark Wilf Ph. D.
Phone: +1 858 444 7334
RO Technology
E-mail: [email protected]
Webpage:www.rotechnology.net
23
Figure 1.5. SEM picture of clean filter pad, before SDI memasurement.
Figure 1.6. SEM picture of clean filter pad, after SDI measurement. SDI = 2.2
Mark Wilf Ph. D.
Phone: +1 858 444 7334
RO Technology
E-mail: [email protected]
Webpage:www.rotechnology.net
24
Figure 1.7. SEM picture of clean filter pad, after SDI measurement. SDI = 4.8
Field results have demonstrated that in majority of cases water from deep wells has very low SDI,
usually less than 1. RO systems, operating with good quality well water feed, practically do not
show any pressure drop increase across the membranes or flux decline. Surface water, after a con-
ventional pretreatment, usually has SDI in the 2 – 4 range. RO system processing feed water with
SDI in the 2 – 3 range shows stable membrane performance. Membrane cleaning frequency for
such feed water does not exceed 1 -2 per year. RO systems processing feed water of higher SDI, in
the 3 - 4 range, usually suffer from some degree of membrane fouling and somewhat higher mem-
brane cleaning frequency may be required. Long term operation of RO system with feed water hav-
ing SDI above 4 is not recommended. As mentioned already, past attempts to correlate turbidity
with SDI values were not successful. These two feed water quality indicators correlates to the num-
ber and size of suspended particles in a different way. However, usually the feed water with SDI in
the 2 – 3 range has corresponding turbidity below 0.1 NTU, usually at 0.05 NTU range.
1.13. Organic matter
Organic matter in RO feed is customary expressed as a total organic carbon (TOC). Surface water,
water from shallow wells and municipal secondary effluent usually contains some concentration of
dissolved organics. In surface waters the organic matter originates from decomposition of humic
substances. In shallow well water the presence of organics could be result of water infiltration
through strata containing natural organic matter. In both cases the TOC concentration is usually in
the range of 0.5 – 3 ppm, most of the time below 1 ppm. This low concentration of TOC in the fed
water has little effect on membrane permeability.
In RO feed originated from secondary effluent, the TOC concentration fluctuates in the wide range
between 2 – 10 ppm. The presence of high concentration of organic matter results in flux decline
Mark Wilf Ph. D.
Phone: +1 858 444 7334
RO Technology
E-mail: [email protected]
Webpage:www.rotechnology.net
25
due to adsorption on the membrane surface. The initial rate of flux decline, due to organic adsorp-
tion is rapid, about 10 – 30% decrease from the initial permeability value. Afterwards, the permea-
bility usually stabilizes, the decline levels off. However, if colloidal matter is also present in the
feed water, the permeability decline is usually more severe, due to formation of thick, mixed fou-
lants layer of low water permeability.
Some potential water sources for RO processing are contaminated by oil and grease. Such condi-
tions could exist in industrial wastewater streams or in seawater in the areas of heavy maritime traf-
fic. Oil and grease have to be completely removed from the feed water prior entering the RO mem-
brane elements. Low concentration of oil and grease will not result in structural damage of the
membrane element but will cause severe decline of water permeability. Conventional method of
removing low concentration of oil and grease includes air flotation and/or media filtration with
flocculation using metal based flocculants.
1.14. Biological activity
Majority of well water sources have very low biological activity due to low concentration of nutri-
ents. The surface water sources could have at times very high level of biological activity. The in-
creased biological activity shows up during periods of intensive algae blooms, also called “red tide”.
During these periods, turbidity and suspended solids concentration could increase significantly, up
to the levels of 30 – 50 NTU and 10 – 30 ppm of suspended solids. In parallel, level of TOC could
increase to the range of 10 ppm TOC and above. During the cycle of algae growing and dying off,
the supply of nutrients increases, creating conditions for accelerated grow of bacteria.
During the conditions of algae bloom it is very difficult to maintain stable operation of pretreatment
and RO unit, unless pretreatment system has been design according to expected high level of bio-
logical activity.
The secondary effluent, originating from municipal wastewater, also has high level of biological activity, mainly high values of bacteria counts. However, this activity can be effectively controlled
prior to RO unit by maintaining 2 – 4 ppm of chloramines in the feed water. Wastewater reclama-
tion is the only RO application that biological activity can be controlled by applying chloramines.
Past attempts of applying this method to control biological activity in brackish or seawater systems
always resulted in accelerated membrane damage.
1.15. Feed water temperature
Feed water temperature affects both permeate salinity and the required operating pressure. Both
water and salt transport follow a similar trend (Equation 1.6 and Figure 1.8). The commercial RO
systems are designed to operate at constant permeate capacity (constant permeate flux). Therefore,
increase of feed water temperature will result in increased permeate salinity (higher quantity of salt
will pass the membrane and will be dissolved in a constant volume of permeate). This increase is
about 3% per degree C. The effect is similar for brackish and seawater systems (Figures 1.9 and
1.10). The changes of water permeability with temperature affects the net driving pressure required
(Equation 1.7). However, in parallel, temperature also affects osmotic pressure of the feed water
(Equation 1.8). With temperature changes net driving pressure and osmotic pressure have opposite
effect on feed pressure (Equation 8). An increase of feed water temperature at low temperature
range (~ up to about 30 C) enables production of a given permeate flow at reduced feed pressure
both in seawater and brackish water systems. At higher temperatures the reduction of feed pressure
in seawater systems levels off, mainly due to increase of osmotic pressure of the average feed (Fig-
Mark Wilf Ph. D.
Phone: +1 858 444 7334
RO Technology
E-mail: [email protected]
Webpage:www.rotechnology.net
26
ure 1.10).
TCF = 1/exp(C (1/(273+t)-1/298)) (1.6)
Where TFC is temperature correction factor, t is temperature Centigrades, C is constant, characteris-
tic of membrane barrier material. For polyamide membranes a C values of 2500 – 3000 are being
used.
1.8 Feed water salinity
Feed water salinity affect the feed pressure required for production of a given quantity of p
roduced water per unit membrane area through value of the osmotic pressure. Osmotic pres
sure is related to water salinity according to equation 1.7.
Posm = R (T + 273) (mi) (1.7)
Where Posm is osmotic pressure (in bar), R is universal gas constant (0.082 l atm/mol K), T is the
temperature (in C), and (mi) is the sum of molar concentration of all constituents in a solution.
1.9 Net driving pressure
The feed pressure is function of osmotic pressure of feed – concentrate solution according t
o equation 1.8.
Pf = NDP + Pos + Pp + 0.5* Pd (- Posp) (1.8)
Where: Pf is feed pressure, Pos is average feed osmotic pressure, Pp is permeate pressure, Pd is pres-
sure drop across RO elements and Posp is osmotic pressure of permeate.
The NDP is related to specific permeability of the membrane and the design flux rate.
Mark Wilf Ph. D.
Phone: +1 858 444 7334
RO Technology
E-mail: [email protected]
Webpage:www.rotechnology.net
27
Figure 1.8 Temperature correction factor for polyamide composite membranes.
Figure 1.9. Temperature effect on permeate salinity in brackish RO systems
0.00
0.20
0.40
0.60
0.80
1.00
1.20
1.40
1.60
1.80
2.00
0.0 10.0 20.0 30.0 40.0 50.0
RE
LA
TII
VE
FL
UX
VA
LU
E
FEED WATER TEMPERATURE, C
PERMEATE FLUX CHANGE WITH TEMPERATURE
0
100
200
300
400
500
0 5 10 15 20 25 30 35 40 45 50
Pe
rme
ate
sa
lin
ity
, p
pm
TD
S
Feed water temperature, C
Brackish RO, flux 28 l/m2-h
Feed 6,000 ppm TDS
Feed 1500 ppm TDS
Mark Wilf Ph. D.
Phone: +1 858 444 7334
RO Technology
E-mail: [email protected]
Webpage:www.rotechnology.net
28
Figure 1.10. Temperature effect on permeate salinity in seawater RO systems. Feed pressure
values are marked as red bars and permeate salinity as gray bars.
1.16. Feed water pH.
Natural sources of brackish and seawater have relatively narrow range of water pH. The brackish
waters have pH in the range of 7.0 – 8.0. The pH of seawater is usually in the range of 7.5 – 8.3.
The pH is result of equilibrium of concentration of dissolved carbon dioxide (CO2) and bicarbonate
(HCO3). The concentration of bicarbonate in brackish water vary in a wide range. However, its con-
centration is usually above level of 250 ppm. Bicarbonate concentration in seawater is much lower,
almost always below 200 ppm, in most cases in the range of 140 – 160 ppm.
Knowledge of correct value of raw water pH is important in brackish and seawater applications.
In brackish water applications, prediction of pH of the concentrate stream enables determination of
potential for calcium carbonate scaling conditions.
In seawater applications, scaling is less of a problem. However, water pH could affect effectiveness
of the coagulation – flocculation process and also rate of boron rejection.
4. Feed water supply alternatives
5.8. Introduction
Seawater RO system
0
200
400
600
800
1000
1200
5 10 15 20 25 30 35 40 45
Feed water temperature, C
Fe
ed
pre
ss
ure
an
d
sa
lin
ity

Mark Wilf Ph. D.
Phone: +1 858 444 7334
RO Technology
E-mail: [email protected]
Webpage:www.rotechnology.net
29
The selection of water source for the desalination system is usually made by the end user according
to professional recommendation provided by a hired consultant. In majority of cases, EPC Contrac-
tor has to adopt system configuration to raw water quality specified in the project specifications. In
isolated cases the EPC contractor has some degree of freedom in selecting location of raw water
extraction point. Therefore, it is responsibility of EPC contractor to collect information about raw
water quality and its seasonal and diurnal fluctuations.
Whenever possible, location of the water source for RO application should be selected to assure
good and stable water quality. Once the raw water source is selected and water quality specified, the
feed water treatment system has to be configured to produce adequate feed water quality also at the
periods of most adverse raw quality.
5.9. Brackish wells
Brackish wells are constructed to pump water from underground aquifers. In most cases, salinity of
water increases with depth of the water producing aquifer. If the aquifer is confined or semiconfined,
then composition of water being pumped will remain stable over time. A confined aquifer is a pre-
ferred water source for desalination applications, due to stability of water composition that trans-
lates to stable performance of the desalination unit.
In majority of cases, water extracted from brackish wells is characterized by low concentration of
suspended solids and organic matter. Water turbidity is below 0.1 NTU and SDI below 1.
However, if aquifer has been contaminated by infiltration of water from agricultural of industrial
activity, it may contain elevated concentrations of fertilizers (high nitrate content), organic matter or
even some concentration of toxic constituents.
The chemistry of water in an aquifer is controlled by chemical composition of formation where aq-
uifer exists and water movements that occurred over time.
The dissolved constituents present in ground water are fairly predictable however, their concentra-
tion is highly variable, between different locations. In most cases, wells, located in the same aquifer
and pumping water from the same levels, will produce water of very similar composition. Therefore,
information of water composition from existing well is a good indicator about water composition
from new wells that will be constructed in the same aquifer.
When new brackish wells are considered for an RO desalination systems, their configuration and
logistic of operation should stability of water quality and supply.
Important issues are:
1. Prevent formation of corrosion products. Wells casing, that will be in contact with brack-
ish water should be made of materials that will not corrode. For shallow wells PVC and
FRP casing could be used. For deep wells, where structural strength is important, stain-
less steel, 316 type, could be used. The maximum depth for use of PVC and FRP is cas-
ing limited by pipe diameter and wall thickness. For PVC casing, the maximum suitable
depth is in the range of 100 – 200 m. FRP can be used for deeper wells if FRP piping has

Mark Wilf Ph. D.
Phone: +1 858 444 7334
RO Technology
E-mail: [email protected]
Webpage:www.rotechnology.net
30
adequate mechanical strength (collapse pressure), defined by pipe manufacturer.
2. Prevent mixing of water from different production zones. Pumping should be conducted
only from the designated layer. Other water bearing zones that well pipe is crossing
should be isolated by proper grouting. Mixing of water from different production zones
could results in precipitation of some constituents. It is specially critical in cases of
pumping water from anaerobic formation.
3. Prevent entrainment of sediments with pumped water. Measures taken to reduce carryo-
ver of solids with pumped water includes installation of proper screen, maintaining low
flow velocity through the screen pump well column. The screen opening should be in the
range of 0.5 – 1.0 mm. The flow rate through the screen should not exceed 0.03 m3/sec.
The flow rate in the well pipe should be below 1.5 m/sec. Wells located in limestone for-
mation may operate without screen with good results. Well pumps motors should have a
soft start to avoid creation of sudden water movements and carryover of solids.
4. Prevent environmental effect on water quality. To maintain consistent quality of well wa-
ter, it should not be exposed to the environment (air). Whenever possible, storage tanks
prior to RO processing should be avoided. Well pumps should have foot valves to main-
tain water level in the pump during system shut down. Decrease of water level will pull in
air, that may introduce air born contaminates or change ORP values (in case of anaerobic
water).
5. Avoid mixing water from different sources. For RO applications only water from the
same aquifer should be combined for use in the given desalination unit. Waters of dissim-
ilar aeration levels, i.e. water from anaerobic and aerobic sources should not be mixed to-
gether. Mixing of such sources could result in oxidation of soluble iron or H2S and pre-
cipitation.
6. Minimize addition of chemicals to well water. Well water should not be treated with
chemicals, prior to RO. Especially, well water of dedicated use for RO unit should not be
chlorinated. In the RO unit acid and/or scale inhibitor is used to prevent formation of
mineral scale during the RO process. Except for these two chemicals, no other chemicals
should be used when treating well water..
5.10. River bank filtration wells
River bank filtration (RBF) is applied for extraction of low salinity brackish water from a surface
source. The shallow RBF wells are located in aquifer that is hydraulically connected to the surface
water body, either river or lake. Because the water flows through aquifer formation it is filtered and
contains much lower concentration of colloidal and suspended solids than the surface source. How-
ever, in majority of cases, the quality of water obtained from RBF is not as good as water pumped
from brackish wells.
Mark Wilf Ph. D.
Phone: +1 858 444 7334
RO Technology
E-mail: [email protected]
Webpage:www.rotechnology.net
31
The major issues with RBF water supply are:
1. Hydraulic conductivity of the aquifer. It applies to body of the water bearing formation and
also to permeability of the bottom of the surface water source. The water from the surface
water source infiltrates through the bottom surface, depositing suspended solids. The RBF
acts as a slow filtration rate filter without backwash. At high concentration of suspended sol-
ids, deposition and clogging of the infiltration surface could be quite rapid. Rivers flow ve-
locity of over 1m/s is usually sufficient to disperse deposits and maintain filtration rate.
2. Fluctuation of water salinity and water temperature. RBF system is hydraulically connected
to the water in the river. Changes of water salinity and water temperature are conveyed to
the underlying aquifer and reflected in the water conditions delivered to the desalination
plant.
3. Fluctuation of water supply. During a periods of severe draught, flow in the river could de-
crease affecting quantity infiltrating to the underlying aquifer and also reducing rate of dis-
persion of deposits on the infiltration surface.
4. Presence of organic matter. The concentration of organic matter in water pumped through
RBF system could be at times much higher than water pumped from brackish aquifers. Sea-
sonally, surface water could develop biological activity (algae bloom) leading to high con-
centration of organics. Also, shallow surface layer could contain high concentration of or-
ganic matter form by vegetation deposits.
The quality of RBF water is much higher than the hydraulically connected surface water source.
However, frequently it is not sufficiently good to send water directly to the RO unit without addi-
tional treatment.
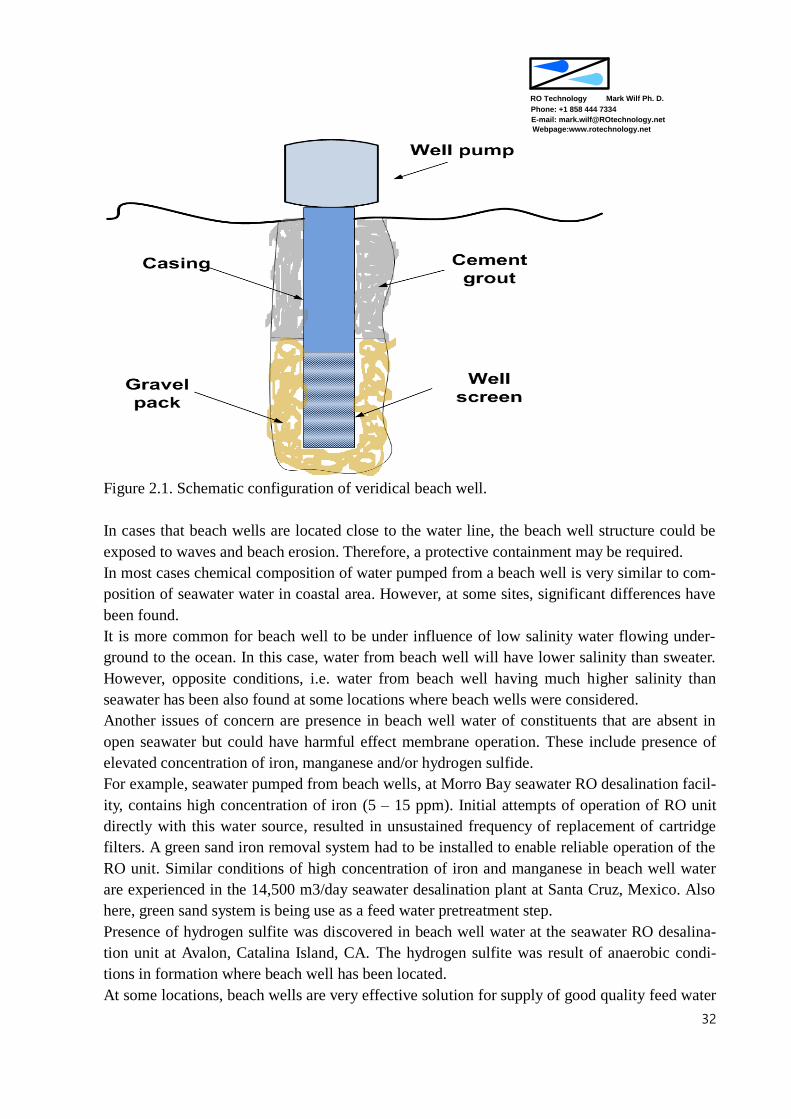
5.11. Beach wells
Vertical beach wells are considered as effective alternative for supply of good quality seawater
to seawater RO desalination plants. The concept and configuration are very similar to the river
bank filtration discussed above and shown schematically on Figure 2.1. The differences be-
tween RBF and beach wells are related to water salinity and environmental conditions of the
body of water connected to the well. Due to high concentration of chlorides in seawater, mate-
rials of construction of the beach well column and the well pump have to be corrosion resistant
in seawater environment. Because vertical beach wells are shallow wells, PVC and FRP can be
used in beach wells casing and screens construction. Pumps have to be made of corrosion re-
sistant alloys (duplexs or equivalent).
Mark Wilf Ph. D.
Phone: +1 858 444 7334
RO Technology
E-mail: [email protected]
Webpage:www.rotechnology.net
32
Figure 2.1. Schematic configuration of veridical beach well.
In cases that beach wells are located close to the water line, the beach well structure could be
exposed to waves and beach erosion. Therefore, a protective containment may be required.
In most cases chemical composition of water pumped from a beach well is very similar to com-
position of seawater water in coastal area. However, at some sites, significant differences have
been found.
It is more common for beach well to be under influence of low salinity water flowing under-
ground to the ocean. In this case, water from beach well will have lower salinity than sweater.
However, opposite conditions, i.e. water from beach well having much higher salinity than
seawater has been also found at some locations where beach wells were considered.
Another issues of concern are presence in beach well water of constituents that are absent in
open seawater but could have harmful effect membrane operation. These include presence of
elevated concentration of iron, manganese and/or hydrogen sulfide.
For example, seawater pumped from beach wells, at Morro Bay seawater RO desalination facil-
ity, contains high concentration of iron (5 – 15 ppm). Initial attempts of operation of RO unit
directly with this water source, resulted in unsustained frequency of replacement of cartridge
filters. A green sand iron removal system had to be installed to enable reliable operation of the
RO unit. Similar conditions of high concentration of iron and manganese in beach well water
are experienced in the 14,500 m3/day seawater desalination plant at Santa Cruz, Mexico. Also
here, green sand system is being use as a feed water pretreatment step.
Presence of hydrogen sulfite was discovered in beach well water at the seawater RO desalina-
tion unit at Avalon, Catalina Island, CA. The hydrogen sulfite was result of anaerobic condi-
tions in formation where beach well has been located.
At some locations, beach wells are very effective solution for supply of good quality feed water
Mark Wilf Ph. D.
Phone: +1 858 444 7334
RO Technology
E-mail: [email protected]
Webpage:www.rotechnology.net
33
to the RO unit. If the costal formation has good water permeability and do not release excessive
quantity of particles during pumping (usual conditions with limestone rock), utilization of
beach wells as feed water supply source will result in very simplified pretreatment and reliable
operation of the RO unit. Large seawater RO plants that successfully utilize beach wells are lo-
cated in Malta, Caribbean and Oman. Some of the facilities utilizing beach wells are listed in
Table 2.1.
Table 2.1. Listing of large SWRO desalination facilities that utilize beach wells
Location Number of wells Capacity, m3/day
Sur, Oman 33 4,000 – 10,000 each
Pembroke, Malta 54,000
Malorca, Spain 16 5,700 each
Ghar Lapsi, Malta 24,000
Pemex, Mexico 3 14,500 each, horizontal wells
Fukuoka, Japan 82,900 infiltration gallery
Morro Bay, California 5 5,000
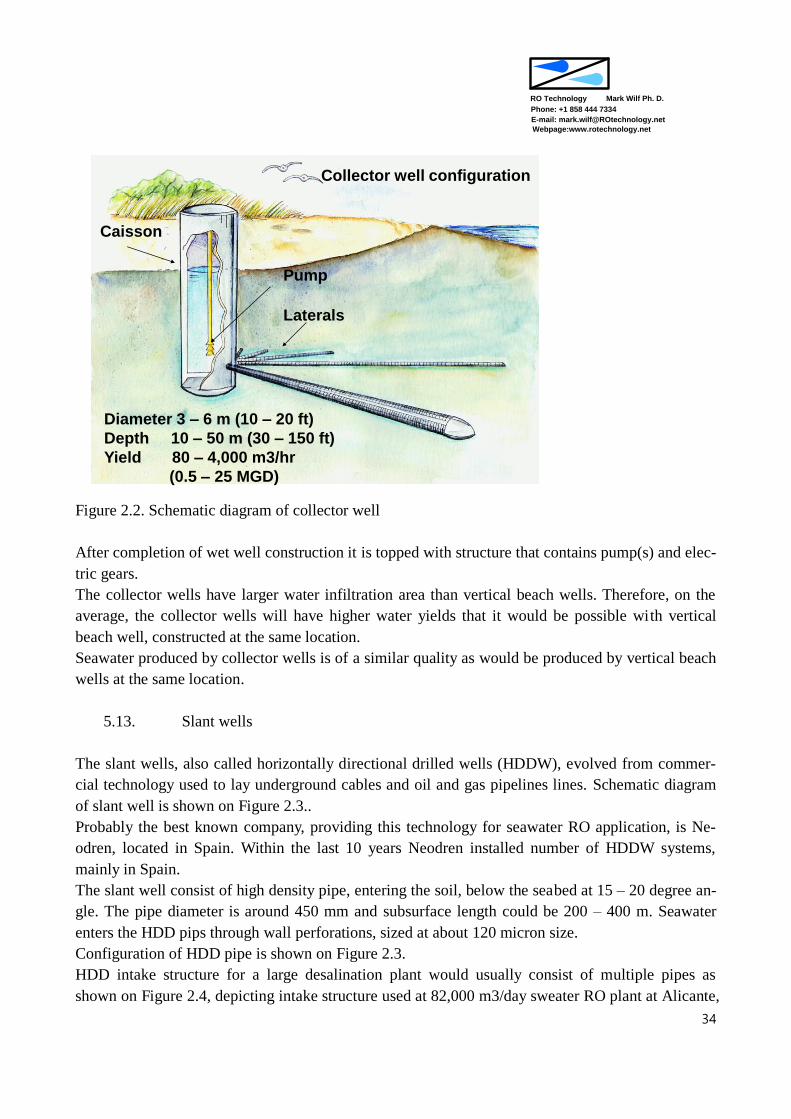
5.12. Horizontal wells
Horizontal wells, also called Ranney type intake wells, are another approach to provide seawater
that is filtrated already by water bearing formation. The collector wells are located on shore, in
coastal area.
\The Ranney wells are constructed by placing large concrete ring segment on shore. The ring seg-
ment has a cutting shoe on the bottom rim. The ring is sunk in place by excavating soil inside the
ring. Once the firs ring is in place, the next one is mounted on top of it forming well caisson. When
the designed depth is reached a concrete plug is placed in the bottom and horizontal laterals are
driven through openings in the bottom segment ring. The laterals have perforations for seawater to
infiltrate to the caisson.
The caisson could have diameter of 3 – 6 m and depth of up to 50 m. The laterals could be 20 – 60
m long. Schematic diagram of horizontal well is shown on Figure2.2.
Mark Wilf Ph. D.
Phone: +1 858 444 7334
RO Technology
E-mail: [email protected]
Webpage:www.rotechnology.net
34
Caisson
Laterals
Pump
Collector well configuration
Diameter 3 – 6 m (10 – 20 ft)
Depth 10 – 50 m (30 – 150 ft)
Yield 80 – 4,000 m3/hr
(0.5 – 25 MGD)
Figure 2.2. Schematic diagram of collector well
After completion of wet well construction it is topped with structure that contains pump(s) and elec-
tric gears.
The collector wells have larger water infiltration area than vertical beach wells. Therefore, on the
average, the collector wells will have higher water yields that it would be possible with vertical
beach well, constructed at the same location.
Seawater produced by collector wells is of a similar quality as would be produced by vertical beach
wells at the same location.
5.13. Slant wells
The slant wells, also called horizontally directional drilled wells (HDDW), evolved from commer-
cial technology used to lay underground cables and oil and gas pipelines lines. Schematic diagram
of slant well is shown on Figure 2.3..
Probably the best known company, providing this technology for seawater RO application, is Ne-
odren, located in Spain. Within the last 10 years Neodren installed number of HDDW systems,
mainly in Spain.
The slant well consist of high density pipe, entering the soil, below the seabed at 15 – 20 degree an-
gle. The pipe diameter is around 450 mm and subsurface length could be 200 – 400 m. Seawater
enters the HDD pips through wall perforations, sized at about 120 micron size.
Configuration of HDD pipe is shown on Figure 2.3.
HDD intake structure for a large desalination plant would usually consist of multiple pipes as
shown on Figure 2.4, depicting intake structure used at 82,000 m3/day sweater RO plant at Alicante,
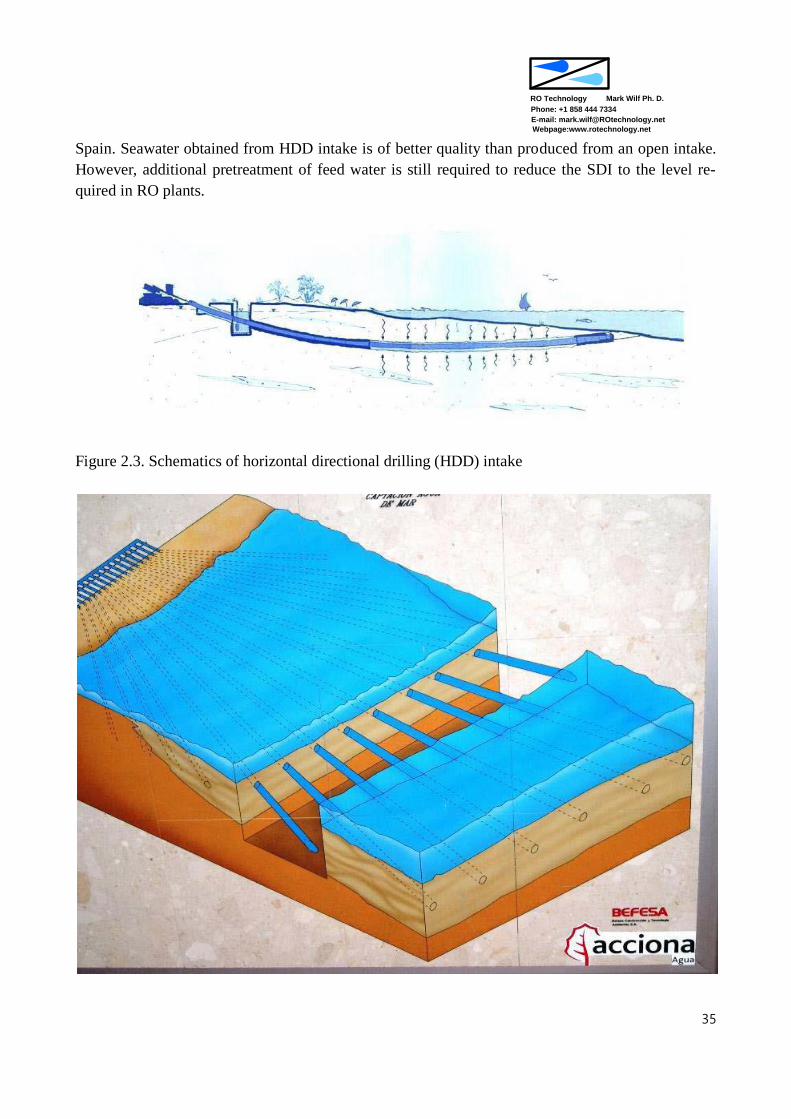
Mark Wilf Ph. D.
Phone: +1 858 444 7334
RO Technology
E-mail: [email protected]
Webpage:www.rotechnology.net
35
Spain. Seawater obtained from HDD intake is of better quality than produced from an open intake.
However, additional pretreatment of feed water is still required to reduce the SDI to the level re-
quired in RO plants.
Figure 2.3. Schematics of horizontal directional drilling (HDD) intake

Mark Wilf Ph. D.
Phone: +1 858 444 7334
RO Technology
E-mail: [email protected]
Webpage:www.rotechnology.net
36
Figure 2.4. Model of HDD intake system at 82,000 m3/day seawater RO desalination plant, Alican-
te, Spain. Courtesy Neodren.
5.14. Seawater infiltration galleries.
Infiltration galleries are similar in operation to HDD intakes. The difference is mainly in method of
construction and use of man made filtration layer rather than existing seabed, as it is in case of
HDD structures. The infiltration galleries are constructed by removing layer of designated seabed
area, placing perforated collector pipes and cover them with a layer of granular filter pack. Sche-
matic diagram of 102,000 m3/day infiltration gallery at the seawater desalination plant at Fukuoka,
Japan, is shown on Figure 2.5.
The infiltration galleries operate as a slow filters with filtration rate in the range of 0.12 – 0.25
m3/m2/hr. Like other slow sand filters, backwash is not used for filterability recovery. The filtera-
bility is restored by periodically scarping few cm of a lop layer. After few years of such operation
the filter bed has to be replaced with new filtration pack.
Fukuoka Infiltration Gallery: 102,000 m3/day (27 mgd)
64X313 m (210’X1027’)
Excavation thickness 3 m (10’)
Figure 2.5. Infiltration gallery at sweater RO desalination plant, Fukuoka, Japan.
At this point the only commercial seawater plant that utilizes infiltration gallery is 50,000 m3/day
RO plant at Fukuoka, Japan.
5.15. Open surface intake

Mark Wilf Ph. D.
Phone: +1 858 444 7334
RO Technology
E-mail: [email protected]
Webpage:www.rotechnology.net
37
The open surface intake is the most common method of supplying seawater to RO desalination
plants. This configuration is usually the lowest cost water supply alternative, as indicated in Table
2.2.
Seawater supplied from an open intake always requires filtration pretreatment prior to entry to
membrane unit. The extend of pretreatment will depend on expected seasonal fluctuations of sea-
water quality. The quality of surface seawater could be affected both by costal discharge, weather
conditions and seasonal biological activity (algae bloom). Once the expected range of seawater
quality has been determined, a proper pretreatment method could be designed.
Table 2.2. Economic weight of various alternatives of sea water supply to RO desalination plants
Well type Capacity Development cost
Vertical well 400 – 2,000 m3/day (0.1 – 0.5 MGD)
$200K - $500K
Slant well 800 – 8,000 m3/day (0.2 – 2.0 MGD)
$1M - $1.5 M
Collector well 2,000 – 100,000 m3/day (0.5 –
25 MGD)
$3M - $5M
Beach filtration galleries Very high output Very high cost
Conventional intakes Very high output Moderate cost
5.15.1. Configuration of open intakes.
Open intakes configuration will depend to some extend on system size. Intakes for small
capacity desalination systems may consist of pump attached to a dock or suspended from a
floating platform and connected by short pipe segment to the on shore raw water storage
tank.
Large desalination system could utilize on shore intake located at the end of a channel pro-
truding into shore. Another, more common configuration is off shore velocity cap structure
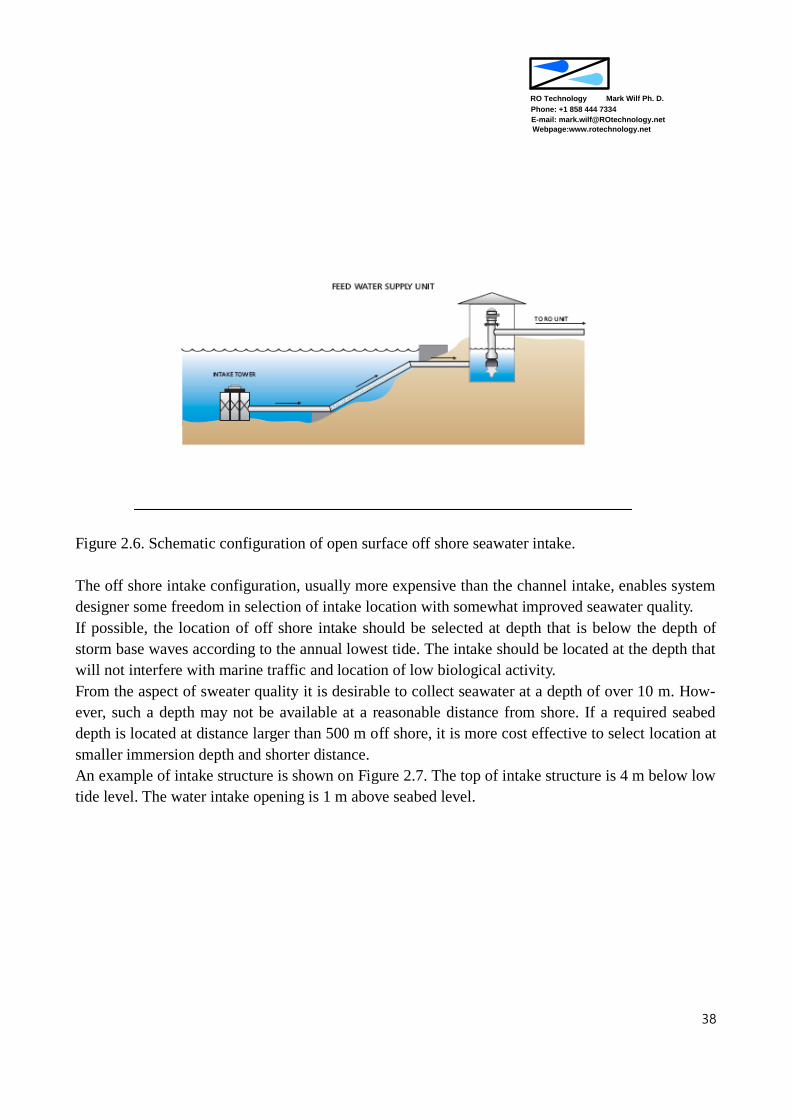
connected by pipe to on shore wet well (Figure 2.6)
Mark Wilf Ph. D.
Phone: +1 858 444 7334
RO Technology
E-mail: [email protected]
Webpage:www.rotechnology.net
38
Figure 2.6. Schematic configuration of open surface off shore seawater intake.
The off shore intake configuration, usually more expensive than the channel intake, enables system
designer some freedom in selection of intake location with somewhat improved seawater quality.
If possible, the location of off shore intake should be selected at depth that is below the depth of
storm base waves according to the annual lowest tide. The intake should be located at the depth that
will not interfere with marine traffic and location of low biological activity.
From the aspect of sweater quality it is desirable to collect seawater at a depth of over 10 m. How-
ever, such a depth may not be available at a reasonable distance from shore. If a required seabed
depth is located at distance larger than 500 m off shore, it is more cost effective to select location at
smaller immersion depth and shorter distance.
An example of intake structure is shown on Figure 2.7. The top of intake structure is 4 m below low
tide level. The water intake opening is 1 m above seabed level.
Mark Wilf Ph. D.
Phone: +1 858 444 7334
RO Technology
E-mail: [email protected]
Webpage:www.rotechnology.net
39
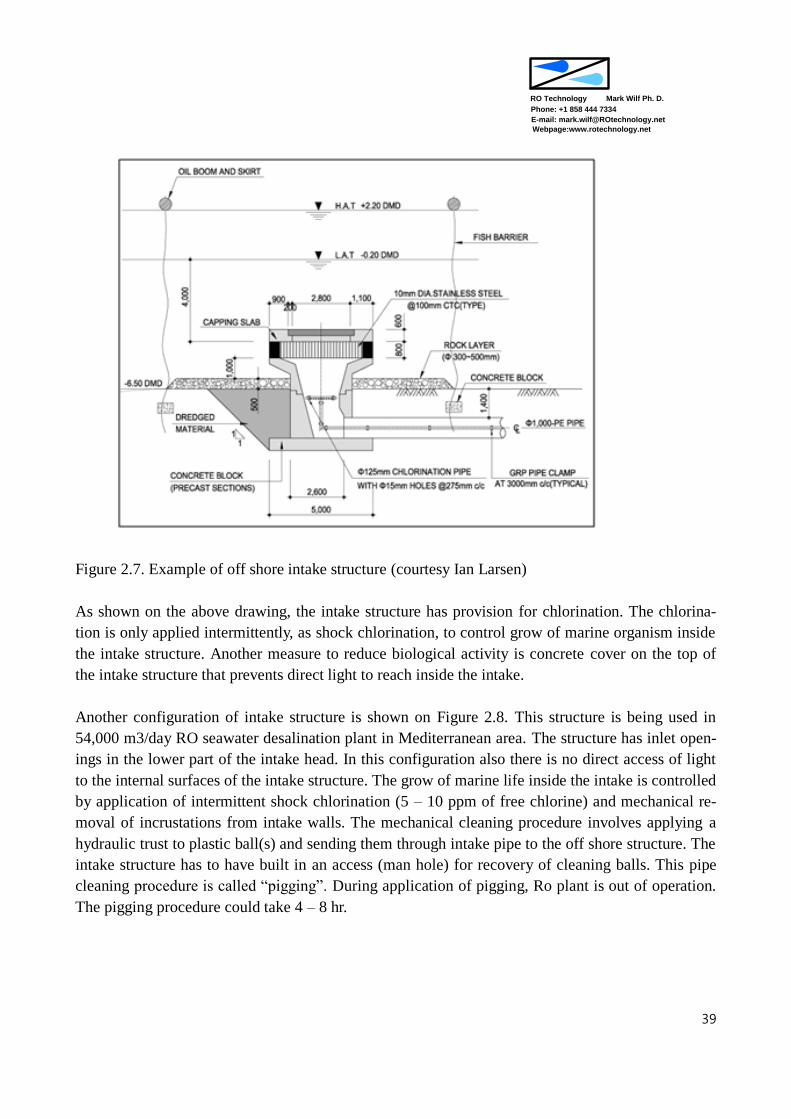
Figure 2.7. Example of off shore intake structure (courtesy Ian Larsen)
As shown on the above drawing, the intake structure has provision for chlorination. The chlorina-
tion is only applied intermittently, as shock chlorination, to control grow of marine organism inside
the intake structure. Another measure to reduce biological activity is concrete cover on the top of
the intake structure that prevents direct light to reach inside the intake.
Another configuration of intake structure is shown on Figure 2.8. This structure is being used in
54,000 m3/day RO seawater desalination plant in Mediterranean area. The structure has inlet open-
ings in the lower part of the intake head. In this configuration also there is no direct access of light
to the internal surfaces of the intake structure. The grow of marine life inside the intake is controlled
by application of intermittent shock chlorination (5 – 10 ppm of free chlorine) and mechanical re-
moval of incrustations from intake walls. The mechanical cleaning procedure involves applying a
hydraulic trust to plastic ball(s) and sending them through intake pipe to the off shore structure. The
intake structure has to have built in an access (man hole) for recovery of cleaning balls. This pipe
cleaning procedure is called “pigging”. During application of pigging, Ro plant is out of operation.
The pigging procedure could take 4 – 8 hr.

Mark Wilf Ph. D.
Phone: +1 858 444 7334
RO Technology
E-mail: [email protected]
Webpage:www.rotechnology.net
40
Figure 2.8. Alternative configuration of intake structure (courtesy Ian Larsen)
The important issues in designing of intake structures are reduction of impingement and entrain-
ment marine life during operation of desalination plant. Low rate of removal of marine life with
seawater is achieved by maintain low inflow velocity of seawater into the intake structure The open
inlet area should be designed to maintain inlet flow below 0.2 m/sec.
The intake structure is connected to the on shore located wet well by a single or multiple pipes. The
connecting pipes are laid in a trench or anchored to the seabed utilizing concrete blocks (shown on
Figure 2.9 and 2.10).
To assure longevity of intake structure and connecting piping, it has to be constructed from materi-
als resistant to seawater corrosion. Usually the intake structure is made of concrete and connecting
piping from high density polyethylene (HDPE) or FRP.

Mark Wilf Ph. D.
Phone: +1 858 444 7334
RO Technology
E-mail: [email protected]
Webpage:www.rotechnology.net
41
Figure 2.9. Installation of concrete anchors on intake pipe (courtesy Ian Larsen).
RO sweater desalination plant converts fraction of seawater into product water and discharges con-
centrate, corresponding to a flow of 40 – 50% of the feed water flow, back to the sea. The concen-
trate outfall line, starting at the discharge of energy recovery devices, extends to the ocean, to the
discharge point. The terminal point of outfall line has to be at location that satisfies the following
conditions:
1. Provides rapid dispersion and salinity reduction.
2. Will not results in short circuit of discharged concentrate with the intake inlet.
3. Will be located at a depth that protect discharge structure from storm waves, marine traffic,
etc.. (similar to considerations for intake structure).
Figures 2.11 and 2.12. show configurations of intake and concentrate discharge arrangements at the
Fukuoka desalination plant.
The drawing shows that the top if intake structure is about 7 m and concentrate structure about 11 m
below the seawater level. Both lines are extending about 200 m into the ocean, with the terminal
points about 60 m apart.
As indicated on Figure 2.12, the diameter of the Intake line is 1.2 m and of concentrate line 0.7 m.
These differences of pipes diameter reflects the difference of flow rates of feed and concentrate dur-
ing normal operation of the plant. Some plants design both feed and concentrate lines of the same
diameter. This is to enable operation of pretreatment system at full capacity, also during the time
when the RO membrane units are not in operation (commissioning period) or when they are operat-
ing at partial capacity.

Mark Wilf Ph. D.
Phone: +1 858 444 7334
RO Technology
E-mail: [email protected]
Webpage:www.rotechnology.net
42
Figure 2.10. Delivery of intake pipe with concrete anchors installed to the plant site (Courtesy
Oceana)
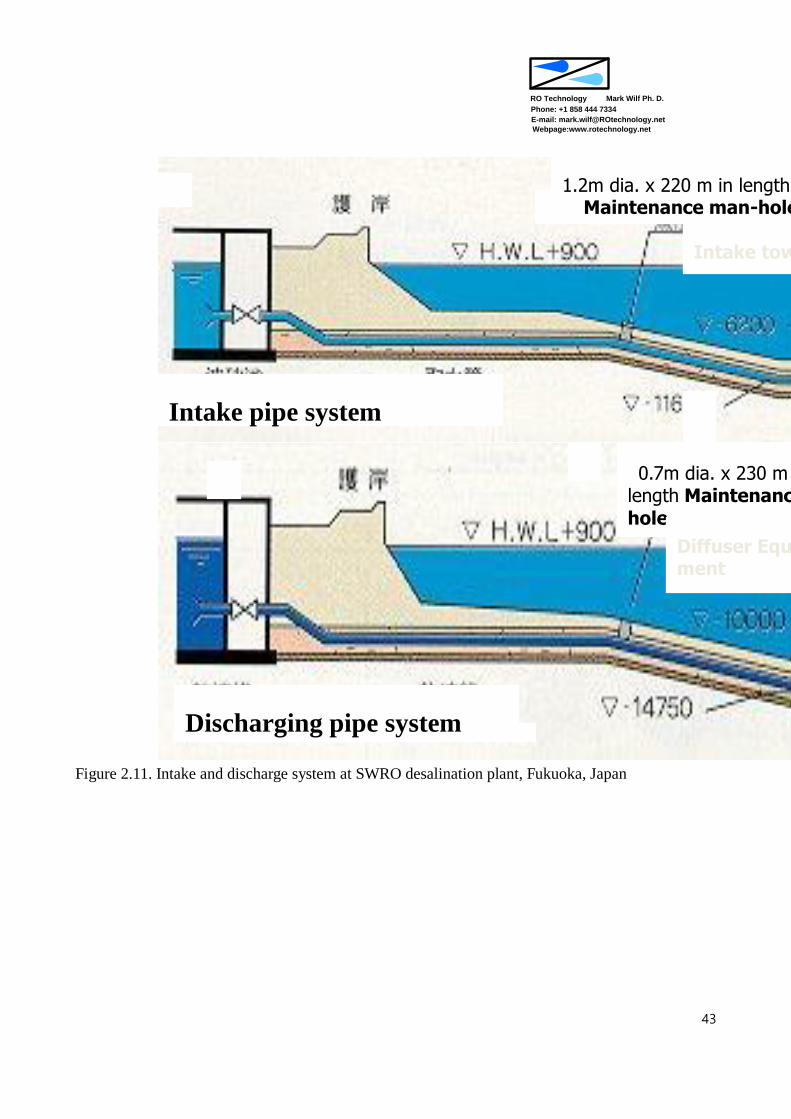
Mark Wilf Ph. D.
Phone: +1 858 444 7334
RO Technology
E-mail: [email protected]
Webpage:www.rotechnology.net
43
Figure 2.11. Intake and discharge system at SWRO desalination plant, Fukuoka, Japan
0.7m dia. x 230 m in length Maintenance man-
hole
Discharging pipe system
Diffuser Equip-ment
1.2m dia. x 220 m in length Maintenance man-hole
Intake pipe system
Intake tower
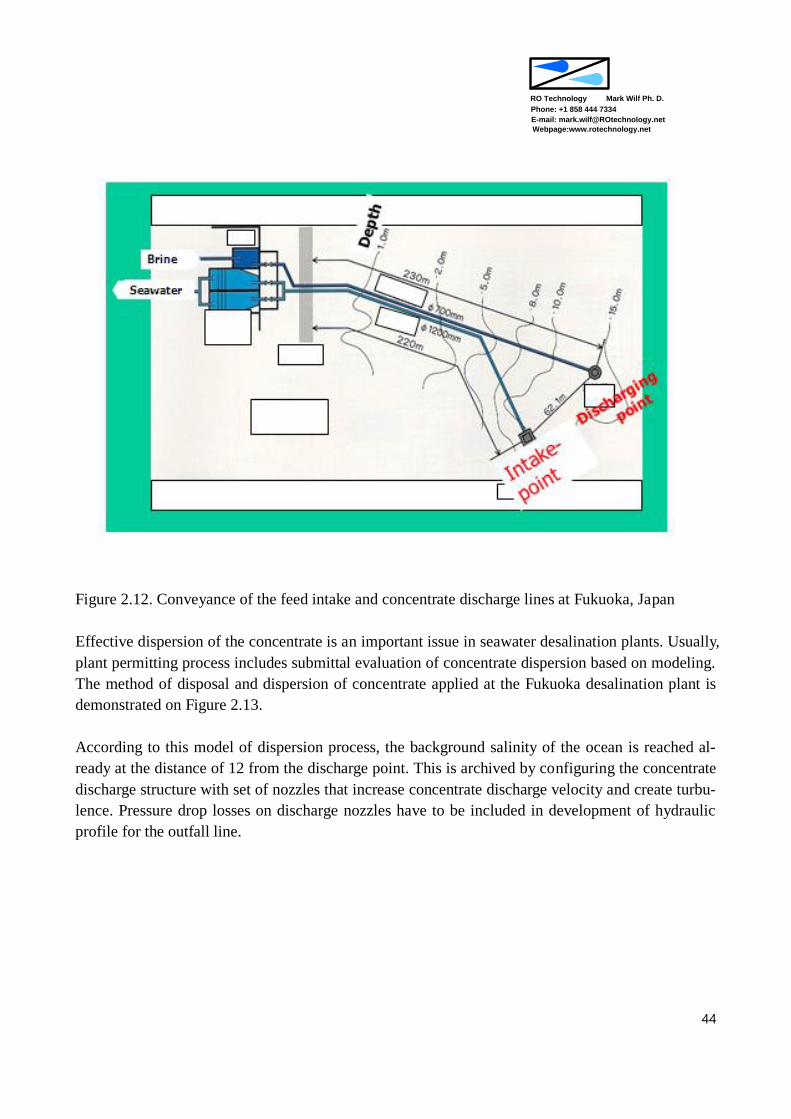
Mark Wilf Ph. D.
Phone: +1 858 444 7334
RO Technology
E-mail: [email protected]
Webpage:www.rotechnology.net
44
Figure 2.12. Conveyance of the feed intake and concentrate discharge lines at Fukuoka, Japan
Effective dispersion of the concentrate is an important issue in seawater desalination plants. Usually,
plant permitting process includes submittal evaluation of concentrate dispersion based on modeling.
The method of disposal and dispersion of concentrate applied at the Fukuoka desalination plant is
demonstrated on Figure 2.13.
According to this model of dispersion process, the background salinity of the ocean is reached al-
ready at the distance of 12 from the discharge point. This is archived by configuring the concentrate
discharge structure with set of nozzles that increase concentrate discharge velocity and create turbu-
lence. Pressure drop losses on discharge nozzles have to be included in development of hydraulic
profile for the outfall line.

Mark Wilf Ph. D.
Phone: +1 858 444 7334
RO Technology
E-mail: [email protected]
Webpage:www.rotechnology.net
45
Effluent volume: 67,000m3/d
Discharging velocity: 6.0m/sec
Concentrated seawater: 5.8%
Raw seawater: 3.5%
l l l
0 8 12
l l l5.8 3.6 3.54 Concentration(%)
Distance (m)
Diffuser Equipment for Discharged of Concentrate,
Figure 2.13. Concentrate discharge structure at the SWRO desalination plant, Fukuoka, Japan.
5.16. Estimation of intake cost
The estimation of cost of intake and outfall system is based on system configuration, local condi-
tions and equipment and material used in intake construction.
It includes the following cost items:
1. Cost of connecting pipe, based on pie weight, material cost and pipe length.
2. Cost of pipe components
3. Cost of pipe placement
4. Other components and equipment, derived based on reference cost and scale up fator.
5. Contingency factor
Example of estimation of intake – outfall system cost
Table 2.3. Intake – outfall system cost parameters
Cost component Parameter and cost
Intake flow 300,000 m3/day
Intake pipe length 1,500 m
Outfall flow 150,000 m3/day
Intake outfall length 1,000 m
Pipe material HDPE
Pipe diameter 1,600 mm

Mark Wilf Ph. D.
Phone: +1 858 444 7334
RO Technology
E-mail: [email protected]
Webpage:www.rotechnology.net
46
Pipe weight 300 kg/m
Pipe and assembly cost $3/kg ($900/m)
Pipe placement cost $1/kg ($300/m)
Table 2.4. Cost components of intake – outfall system. 300,000 m3/day inflow, 150,000 m3/day
outfall
Intake pipe ($1,950/m) $2,925,000
Outfall pipe (1, 950/m) $1,950,000
Subsurface structure $1,000,000
Beach crossing $2,000,000
Siphon structure $200,000
Clearwell pumps $2000,000
Total $10,675,000
Contingency (30%) $3,200,000
Total $13,875,000
5.17. Collocation with power plant
The intake cost could contribute 5 – 20% of the overall cost of the desalination system. At some lo-
cations permitting of intake and concentrate discharge is a very lengthy process, creating significant
delay of implementation of desalination projects.
Collocating of desalination plant at the site of power plant that utilizes significant volume of sea-
water for cooling is economically attractive alternative to stand alone desalination system.
Electric power plants in coastal areas, utilize large volume of seawater for cooling of steam conden-
sers. After the cooling process, seawater is discharged back to the ocean. The temperature of dis-
charged seawater is 5 – 10 C higher than the temperature of inlet water.
RO seawater plant can be incorporated into water circuit of the power plant by taping to the sea-
water line on condenser discharge. After RO processing, the concentrate is return to the same dis-
charge line, downstream of the feed connection point. Schematic diagram of the seawater flow in
RO plant collocated with power plant is shown on Figure 2.14.
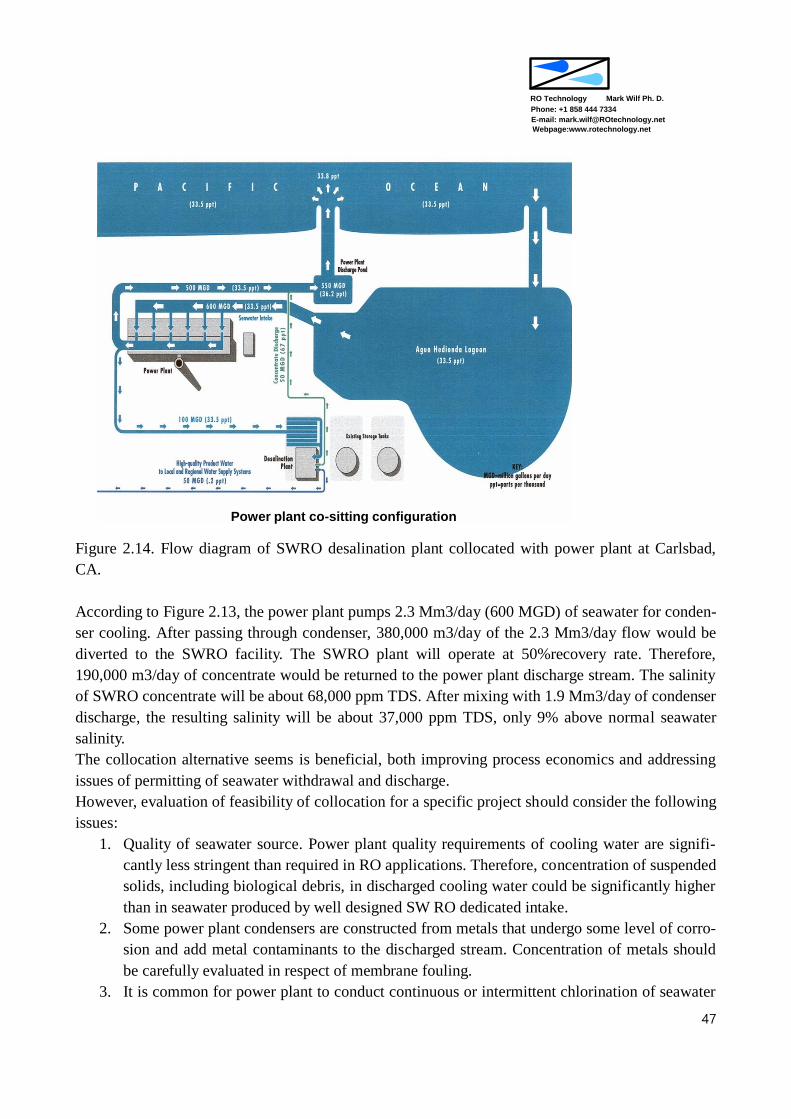
Mark Wilf Ph. D.
Phone: +1 858 444 7334
RO Technology
E-mail: [email protected]
Webpage:www.rotechnology.net
47
Power plant co-sitting configuration
Figure 2.14. Flow diagram of SWRO desalination plant collocated with power plant at Carlsbad,
CA.
According to Figure 2.13, the power plant pumps 2.3 Mm3/day (600 MGD) of seawater for conden-
ser cooling. After passing through condenser, 380,000 m3/day of the 2.3 Mm3/day flow would be
diverted to the SWRO facility. The SWRO plant will operate at 50%recovery rate. Therefore,
190,000 m3/day of concentrate would be returned to the power plant discharge stream. The salinity
of SWRO concentrate will be about 68,000 ppm TDS. After mixing with 1.9 Mm3/day of condenser
discharge, the resulting salinity will be about 37,000 ppm TDS, only 9% above normal seawater
salinity.
The collocation alternative seems is beneficial, both improving process economics and addressing
issues of permitting of seawater withdrawal and discharge.
However, evaluation of feasibility of collocation for a specific project should consider the following
issues:
1. Quality of seawater source. Power plant quality requirements of cooling water are signifi-
cantly less stringent than required in RO applications. Therefore, concentration of suspended
solids, including biological debris, in discharged cooling water could be significantly higher
than in seawater produced by well designed SW RO dedicated intake.
2. Some power plant condensers are constructed from metals that undergo some level of corro-
sion and add metal contaminants to the discharged stream. Concentration of metals should
be carefully evaluated in respect of membrane fouling.
3. It is common for power plant to conduct continuous or intermittent chlorination of seawater
Mark Wilf Ph. D.
Phone: +1 858 444 7334
RO Technology
E-mail: [email protected]
Webpage:www.rotechnology.net
48
inflow. Usually, heat treatment procedure is applied periodically to remove incrustation from
the condenser surfaces. During heat treatment procedure RO plant will have to be shut down
during that time to avoid presence of sharp edged shell fragments in the feed stream.
4. The increase of seawater temperature during the cooling cycle could be beneficial if the
seawater original temperature is low, below 20C. At such conditions, increased seawater
temperature will result in lower feed pressure and lower energy requirement of the SWRO
system. However, during the periods of high seawater temperature (> ~ 25 - 30 C), the addi-
tional temperature increase contributed by the condenser of the power plant, could result in
less beneficial operating conditions of the SWRO system. In the higher temperature range,
above 30 C, the reduction of feed pressure with temperature is marginal. On the other hand
there will be significant increase of permeate salinity at higher temperature. Therefore, to
compensate for permeate salinity increase a larger second pass processing will have to be
included in system configuration. At such conditions, the additional equipment cost and
higher operating cost could be higher that savings realized by not including dedicated intake
and concentrate discharge in scope of the desalination project. The present commercial RO
membrane have maximum temperature limit of 40C. Therefore, the design of using conden-
ser discharge as RO feed water, should have provision not to exceed this maximum feed wa-
ter temperature, otherwise, plant operation will be outside membrane warranty terms set up
by membrane manufacturer.
5.18. Design criteria of feed water supply systems and configurations
The design criteria of feed water supply for RO units have to follow sound engineering principle
and experience gained by the desalination industry in design of similar systems.
Some of the design considerations are listed below:
1. Saline waters and seawater are highly corrosive, therefore, raw water supply systems com-
ponents should be constructed from corrosion resistant materials.
2. Raw water supply system should not introduce additional constituents to the water that may
adversely affect RO membranes or other equipment.
- Exposure of raw water to light should be minimized as light exposure my provide
energy for biological growth.
- Chlorination of raw water should be minimized as presence of oxidants could result
in development of nutrients for biological activity in the RO system.
- Stagnant area in the water supply system should be avoided as stagnant water sup-
ports biological activity.
- Raw water should not be aerated beyond what is required by the treatment process
(DAF, biological filters). Excessive concentration of oxygen could result in elevated
corrosion rate of metal components.
5. Raw water supply lines should be short as possible to reduce system cost and holdup volume
of water in the water supply system.
6. Number of pumping steps in the water delivery and concentrate outfall systems should be
Mark Wilf Ph. D.
Phone: +1 858 444 7334
RO Technology
E-mail: [email protected]
Webpage:www.rotechnology.net
49
reduced to an absolute minimum. Each pumping step increases system cost and energy re-
quirement of the process.
5.19. Equipment and hydraulic profile
As mentioned already above, all components of water supply system should be made from corro-
sion resistant materials. For piping, the materials of choice are high density polyethylene HDPE and
FRP. The HDPE is manufactured according to standardized sizes (diameter and wall thickness).
Dimensions of FRP piping and components could vary between different manufacturers.
For seawater applications, wetted pars of valves should be made of duplex steels (disk) and cast
iron with EPDM liner (valve body).
Seawater storage tanks could be made of concrete with protective coating, FRP or glass lined stain-
less steel.
Transfer pumps should be constructed from duplex steel. Due to high cost of this construction mate-
rial, whenever practical, a horizontal split case pumps, should be specified in place of vertical
pumps.
In the seawater applications the recovery rate is about 50%. Accordingly, any energy expanded in
the water supply system contributes twice its value to the final energy usage per unit of product wa-
ter produced. Therefore, it is important to select intake pumps with high hydraulic efficiency. The
design of raw water supply and outfall system should follow a hydraulic profile developed for spe-
cific site conditions and elevation differences.
As shown schematically in Figure 2.6, the water level in the wet well, located on shore, will dpend
on the level of seawater: the high and low tide. The depth of the wet well and immersion of the
pump has to be designed according to the lowest tide (specified in the project documents or listed in
reference information) and the friction loses in the connecting piping. The friction loses of the pip-
ing connecting off shore intake structure with the wet well are calculated at conditions of maximum
flow.
The friction loses are combined loses of friction head in the pipe and form loses. The pipe friction
head is the pressure loss in straight segments of the connecting pipe. The form loses are friction los-
es in valve and fittings. The form loses are calculated for individual components and are combined
together in one value.
The pipe loses can be calculated using Haze – Williams formula (Equation 2.1)
(𝐻
𝐿) = 10.643 (
𝑄
𝐶)1.852 𝐷−4.87 (2.1)
Where: H is head loss over length L, Q is flow rate, D is pipe diameter and C is a roughness con-
stant. The roughens constant depends on the condition of the internal pipe walls. The rougher the
wall surface, the lower the value of C, resulting in higher head loses.
The form loses, H, can be calculated according to Darcy Formula, listed as equations 2.2 and 2.3.

Mark Wilf Ph. D.
Phone: +1 858 444 7334
RO Technology
E-mail: [email protected]
Webpage:www.rotechnology.net
50
(𝐻
𝐿) =
𝐾
𝐷ℎ 𝑉2/2g (2.2)
𝐻 = 𝐾 𝑉2/2g (2.3)
In the above equations, K is a Darcy constant, V flow velocity and g is the gravity constant.
Examples of C and K values that are applied in the Hazen – Williams and Darcy equations are listed
in Table 2.5
Table 2.5 Example of values of constants used in Haze – Williams and Darcy equations
Component C K
Plastic pipe 140 – 150
Steel pipe 145 – 150
Rounded inlet
0.25
Rounded outlet
1.00
Gate valve
0.20
Butterfly valve
0.20
Globe valve
10.00
Elbow 45 deg
0.30
Elbow 90 deg
1.10
Example of calculation result of friction loses in straight HDPE pipe, applying Hazen Williams
equation, is provided in Table 2.6. It is evident that with small diameter pipe, large friction loses
could be created if pumping over long distances is necessary.
Table 2.6. Example of pipe friction loses according to pipe diameter.
Flow rate: 200,000 m3/day, Q = 2.36 m3/sec. Roughness constant, C = 140
Pipe diameter, m Flow velocity, m/sec Hydraulic gradient, m/100m
2.5 0.5 0.006
1.7 1.0 0.040
1.4 1.5 0.110
1.2 2.0 0.230
Mark Wilf Ph. D.
Phone: +1 858 444 7334
RO Technology
E-mail: [email protected]
Webpage:www.rotechnology.net
51
The hydraulic profile is the basis for selection of proper equipment and process optimization. Based
on hydraulic profile, the designer is able to specify required discharge head of pumping equipment.
Process optimization is conducted to reduce overall energy usage. This is achieved through selec-
tion of pipe diameter, system configuration and elevations for location of equipment and tanks. As
mentioned before, the objective is to reduce number of pumping steps and exposure of water to out-
side environment (air and light).
6. Configuration of feed water pretreatment process
6.1. Conventional pretreatment
The term “conventional pretreatment” usually refers to use of granular media filtration as op-
posed to membrane filtration. However, this differentiation is being blurred today as it is com-
mon to design pretreatment systems that integrate granular media separation or clarification
through settling with the membrane filtration step.
6.1.1. Configurations and components of conventional pretreatment system
The configuration of desalination unit and the pretreatment system depends on source and
quality of the raw water.
In case of desalination system operating with raw water pumped from dedicated brackish
wells or seawater beach wells, the pretreatment is very minimal, as shown on Figure 3.1.

Mark Wilf Ph. D.
Phone: +1 858 444 7334
RO Technology
E-mail: [email protected]
Webpage:www.rotechnology.net
52
Figure 3.1. Configuration of RO unit operating with well water.
The configuration of pretreatment unit is limited to sand separator, addition of acid and/or
scale inhibitor and cartridge filtration, as shown on Figure 3.2.

Mark Wilf Ph. D.
Phone: +1 858 444 7334
RO Technology
E-mail: [email protected]
Webpage:www.rotechnology.net
53
Figure 3.2. Configuration of pretreatment unit in desalination plant treating well water.
Some systems, that operate with shallow wells, that occasionally produce water of elevated
turbidity, utilize high filtration rate pressure filters prior to the cartridge filters. In case of
presence of media filtration, sand separation equipment is not required.
In isolated cases additional pretreatment is applied to the well water to adsorb and remove
organic industrial microcontaminants utilizing activated carbon filters. Some systems uti-
lize green sand filters for removal iron and/or manganese from the feed water if present in
high concentrations.
Desalination systems that treat surface water require some form of filtration prior to car-
tridge filtration.
If the concentration of suspended solids is moderate, than utilizing granular media filtration
could be sufficient.
Granular media filter could be configured as pressure filters, ether vertical or horizontal, as
shown schematically on figure 3.3.
Figure 3.3. RO system treating surface water.
Pretreatment configuration shown on Figure 3.3 includes chlorination, acidification, fol-
lowed by addition of ferric coagulant. The coagulated water is filtrated with vertical pres-
sure filters. The assumption is that effluent from the media filters will have quality suffi-
cient for introduction to membrane unit. The cartridge filter located after the media filtra-
tion step is to protect pumps and membrane elements from sudden influx of particulate mat-
ter, for example due to granular filter media break through.
Mark Wilf Ph. D.
Phone: +1 858 444 7334
RO Technology
E-mail: [email protected]
Webpage:www.rotechnology.net
54
Chlorination of raw water should be only applied as a intermittent measure. Continuous
chlorination could result in conversion of TOC to assimilable organic carbon (AOC). In-
creased AOC could be utilized by bacteria that survived chlorination and promote bacterial
grow in the membrane unit.
Whenever, chlorine is added to the feed water, it has to be reduced, preferably using sodium
bisulfate according to the following reaction:
NaHSO3 + HOCl = NaHSO4 + HCl (3.1)
Three parts of sodium bisulfate are required for one part of free chlorine. The reaction is
very rapid, proceeding to a complete dechlorination in seconds.
ORP analyzer is used to monitor dechlorination reaction. The target ORP value for dechlo-
rination is below 200 mV.
The granular pressure filters, either in vertical or horizontal configurations, are usually used
in small and medium size systems. In very large desalination systems gravity media filters
are being used.
However, in Spain, pressure filters are being used in majority of seawater desalination sys-
tems of all sizes.
Majority of pretreatment systems that utilize granular media filtration, incorporate coagula-
tion and flocculation to improve removal of colloidal particles. Coagulats of choice are iron
based salts. The usual dosing rate of metal coagulants is in the range of 1 – 20 ppm. Some-
times organic polymers are also added in the coagulation process to increase flock strength.
The usual dosing range of filtration polymers is in the range of 0.1 – 1 ppm. Utilization of
coagulants requires incorporation of solids management system to treat backwash stream
produced by granular filters. The objective of solids management system is to concentrate
and dewater backwash effluent to a solids concentration above 20%. At this level of solids
concentration, the backwash residual can be transport off site and dispose to land fill. Gran-
ular media filtration systems that do not utilize coagulants usually are able to discharge
backwash effluent together with concentrate stream back to the ocean.
At some locations surface seawater may seasonally experience high concentration of sus-
pended and colloidal solids. The rough indicator of raw water quality is turbidity. At turbid-
ity levels above 20 – 30 NTU a clarification step could be required prior to media filtration.
The selection of clarification technology will depend on nature of suspended solids. If sol-
ids are manly of inorganic nature (silt) than most likely settling type clarifiers would be
more effective.
However, if suspended solids are of organic nature (algae), which are buoyant and may not
settle well, than dissolved air flotation (DAF), would be more effective technology to apply.
6.2. Membrane pretreatment
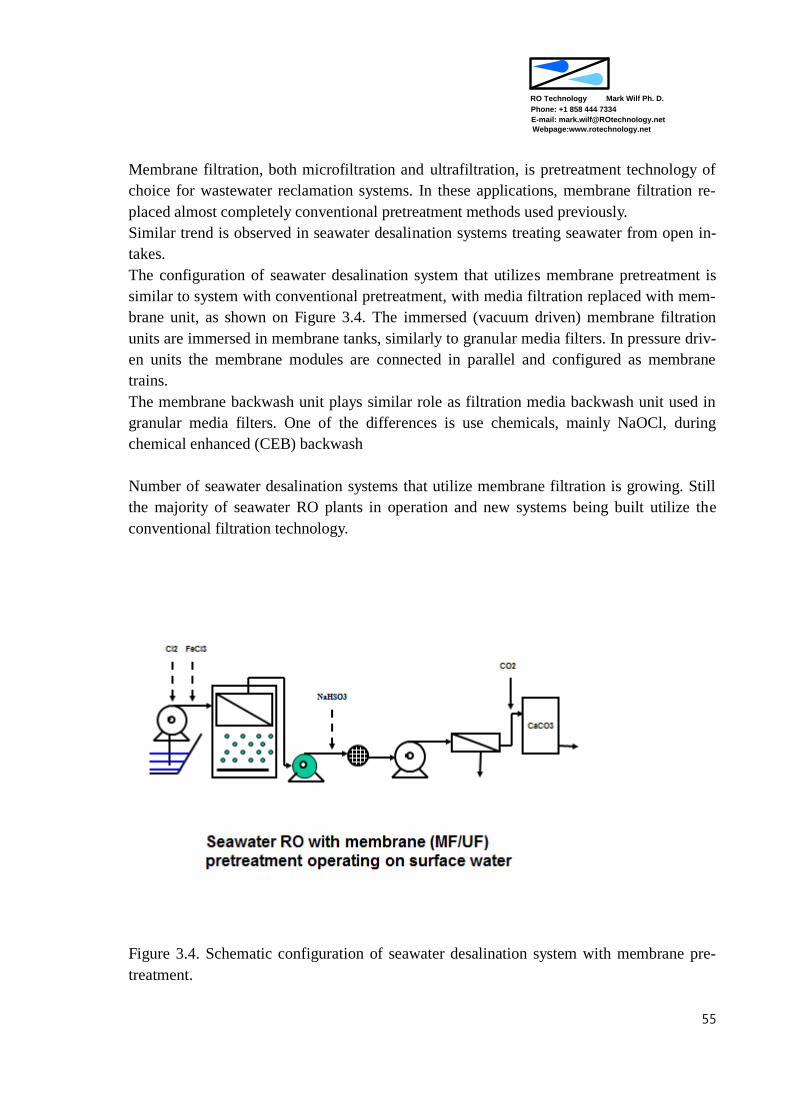
Mark Wilf Ph. D.
Phone: +1 858 444 7334
RO Technology
E-mail: [email protected]
Webpage:www.rotechnology.net
55
Membrane filtration, both microfiltration and ultrafiltration, is pretreatment technology of
choice for wastewater reclamation systems. In these applications, membrane filtration re-
placed almost completely conventional pretreatment methods used previously.
Similar trend is observed in seawater desalination systems treating seawater from open in-
takes.
The configuration of seawater desalination system that utilizes membrane pretreatment is
similar to system with conventional pretreatment, with media filtration replaced with mem-
brane unit, as shown on Figure 3.4. The immersed (vacuum driven) membrane filtration
units are immersed in membrane tanks, similarly to granular media filters. In pressure driv-
en units the membrane modules are connected in parallel and configured as membrane
trains.
The membrane backwash unit plays similar role as filtration media backwash unit used in
granular media filters. One of the differences is use chemicals, mainly NaOCl, during
chemical enhanced (CEB) backwash
Number of seawater desalination systems that utilize membrane filtration is growing. Still
the majority of seawater RO plants in operation and new systems being built utilize the
conventional filtration technology.
Figure 3.4. Schematic configuration of seawater desalination system with membrane pre-
treatment.

Mark Wilf Ph. D.
Phone: +1 858 444 7334
RO Technology
E-mail: [email protected]
Webpage:www.rotechnology.net
56
Compared to the membrane filtration systems, the pretreatment systems based on granular
media filtration are in most cases less expensive to construct and operate. Evaluation of
configuration and economics of pretreatment systems based on membrane filtration and
granual media filtration is provided in Chapter 4.6.
Another disadvantage of membrane filtration pretreatment technology is extended use of
chlorination for membrane performance recovery. As mentioned before, use of chlorine in
the pretreatment process could lead to biofouling of RO membranes. In addition, the hy-
draulic conditions of operation of membrane filtration systems lead to breaking of microor-
ganism present in the seawater and release of cell fluids. This matter could be metabolize
by other bacteria for cell growth and formation of biofilms in membrane unit.
Utilization of coagulation improves stability of operation of membrane filtration systems,
improving stability of membrane permeability. Addition of metal coagulant at the level of
0.1 – 0.5 ppm could result in significant improvement of performance.
However, utilization of coagulat will require inclusion of solids management system as a
part of pretreatment unit. Therefore, the tendency is not to include coagulation in configura-
tion of membrane pretreatment systems and relay of backwash procedures to maintain a
sufficient level of membrane permeability.
The membrane filtration technology consists of wide range of configurations and some
membrane modules configurations are more robust in respect of treatment of streams con-
taining high concentration of suspended solid, for example membrane elements utilized in
membrane bioreactor (MBR) applications.
Usually the MBR membrane modules have low membrane area packing density and would
be quite expensive for use as pretreatment in RO desalination systems.
In most cases, the membrane modules utilized in RO applications are the same as being
used in potable applications.
The tolerance of membrane filtration technology to high concentration of suspended solids
in raw water is similar to granular media filtration. Also here if the raw water turbidity ex-
ceeds 20 – 30 NTU range, an initial clarification step may be necessary to maintain stable
performance of membrane filtration system.
The addition of initial clarification step is necessary if raw water experiences high turbidity
levels for extended periods of time. If the increase of turbidity is only during small fraction
of the annual operating time, maintaining lower output capacity of the pretreatment system
or even temporary discontinue of its operation could be considered as more cost effective
solution rather than addition of clarification equipment that will be idle most of the time.
The schematic diagram on Figure 3.4 shows cartridge filtration as part of the pretreatment
system. The usual approach is to include cartridge filtration if membrane filtrate is store in
an intermittent tank prior to membrane unit. If membrane filtrate flows directly from filtra-
tion system to the suction of RO feed pumps, cartridge filtration equipment could be omit-
ted from the feed water pretreatment process.

Mark Wilf Ph. D.
Phone: +1 858 444 7334
RO Technology
E-mail: [email protected]
Webpage:www.rotechnology.net
57
6.3. Raw water quality and pretreatment requirements.
The quality of raw water is closely related to water source. The configuration of pretreatment sys-
tems for RO applications has evolved around specific water sources. For each RO application:
brackish, seawater and wastewater reclamation pretreatment system configurations have been de-
veloped that can effectively produce feed water of adequate quality.
Table 3.1 includes water quality parameters for the three major water types of water supply sources.
The last row of the table lists configuration of pretreatment systems that in majority of circumstanc-
es will be sufficient to produce feed water of adequate quality.
Table 3.1. Representative raw water quality associated with major types of water supply sources
Quality parameter Well water Surface water Secondary effluent
Turbidity < 1 NTU < 5 NTU 2 - 10 NTU
SDI < 1 < 5 not measurable
Suspended solids < 1 ppm < 5 ppm < 20
TOC < 1 ppm < 5 ppm < 20
SiO2 < 25 ppm n. a. n. a.
Common configura-tion of pretreatment system
Acidification
Scale inhibitor
Cartridge filtration
Acidification
Flocculation
Media filtration
Cartridge filtration
Membrane filtration
Acidification
Scale inhibitor
Cartridge filtration
However, at some locations, quality of raw water could fluctuate outside range listed in Table 3.1.
In such cases the pretreatment system has to be augmented by additional treatment steps. Table 3.2
provides recommended configurations of pretreatment system according to water source and range
of water quality parameters.
Table 3.2. Recommended configuration of pretreatment system according to raw water quality
Water source Water quality parame-
ters
Configuration of pre-
treatment system
Comments
Brackish well water Turbidity < 0.2 NTU
TSS < 2
SDI < 1.0
Acidification
Scale inhibitor
Cartridge filtration
Brackish well water Turbidity > 0.2 NTU
TSS > 2
SDI >1.0
Sand filtration
Acidification
Scale inhibitor
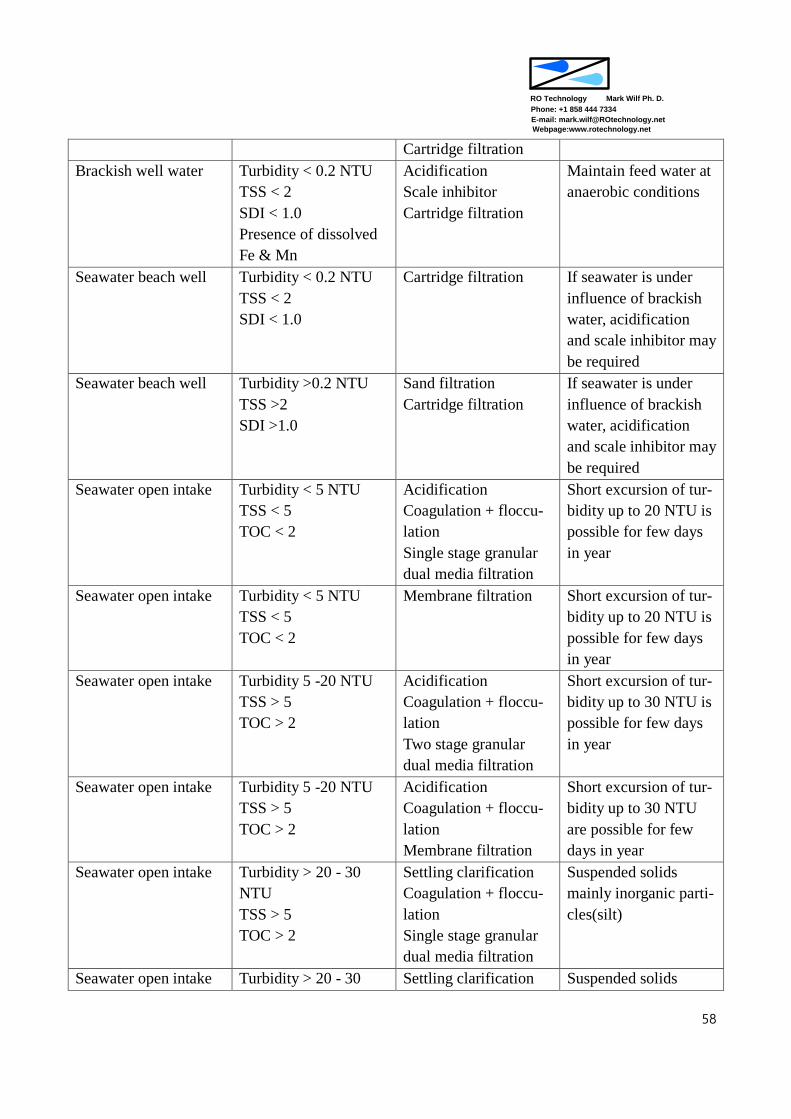
Mark Wilf Ph. D.
Phone: +1 858 444 7334
RO Technology
E-mail: [email protected]
Webpage:www.rotechnology.net
58
Cartridge filtration
Brackish well water Turbidity < 0.2 NTU
TSS < 2
SDI < 1.0
Presence of dissolved
Fe & Mn
Acidification
Scale inhibitor
Cartridge filtration
Maintain feed water at
anaerobic conditions
Seawater beach well Turbidity < 0.2 NTU
TSS < 2
SDI < 1.0
Cartridge filtration If seawater is under
influence of brackish
water, acidification
and scale inhibitor may
be required
Seawater beach well Turbidity >0.2 NTU
TSS >2
SDI >1.0
Sand filtration
Cartridge filtration
If seawater is under
influence of brackish
water, acidification
and scale inhibitor may
be required
Seawater open intake Turbidity < 5 NTU
TSS < 5
TOC < 2
Acidification
Coagulation + floccu-
lation
Single stage granular
dual media filtration
Short excursion of tur-
bidity up to 20 NTU is
possible for few days
in year
Seawater open intake Turbidity < 5 NTU
TSS < 5
TOC < 2
Membrane filtration Short excursion of tur-
bidity up to 20 NTU is
possible for few days
in year
Seawater open intake Turbidity 5 -20 NTU
TSS > 5
TOC > 2
Acidification
Coagulation + floccu-
lation
Two stage granular
dual media filtration
Short excursion of tur-
bidity up to 30 NTU is
possible for few days
in year
Seawater open intake Turbidity 5 -20 NTU
TSS > 5
TOC > 2
Acidification
Coagulation + floccu-
lation
Membrane filtration
Short excursion of tur-
bidity up to 30 NTU
are possible for few
days in year
Seawater open intake Turbidity > 20 - 30
NTU
TSS > 5
TOC > 2
Settling clarification
Coagulation + floccu-
lation
Single stage granular
dual media filtration
Suspended solids
mainly inorganic parti-
cles(silt)
Seawater open intake Turbidity > 20 - 30 Settling clarification Suspended solids

Mark Wilf Ph. D.
Phone: +1 858 444 7334
RO Technology
E-mail: [email protected]
Webpage:www.rotechnology.net
59
NTU
TSS > 5
TOC > 2
Coagulation + floccu-
lation
Membrane filtration
mainly inorganic parti-
cles(silt)
Seawater open intake Turbidity > 20 - 30
NTU
TSS > 5
TOC > 2
DAF
Coagulation + floccu-
lation
Single stage granular
dual media filtration
Suspended solids
mainly organic and
biological parti-
cles(algae)
Seawater open intake Turbidity > 20 - 30
NTU
TSS > 5
TOC > 2
DAF
Coagulation + floccu-
lation
Membrane filtration
Suspended solids
mainly organic and
biological parti-
cles(algae)
Wastewater secondary
effluent
Turbidity 2 – 20 NTU
TSS < 20
TOC < 20
Membrane filtration
Acidification
Scale inhibitor
Cartridge filtration
Chloramine concentra-
tion of 2 – 4 ppm
maintained in the RO
unit
Wastewater MBR ef-
fluent
Turbidity <1 NTU
TSS < 2
TOC < 20
Acidification
Scale inhibitor
Cartridge filtration
Chloramine concentra-
tion of 2 – 4 ppm
maintained in the RO
unit
7. Pretreatment equipment
7.1. Screening
The extend of screening of raw water will depend on application and type of the pretreatment pro-
cess.
For brackish RO system, operating with well water, usually no screening is applied in the pretreat-
ment system. Only in case that well releases sand particles, sand trap screen should be applied. In
majority of cases, the quantity if sand being released from well is very small and manually cleaned
sand screen will be adequate. Usually, the sand screen is configured as a wedge wire type cylindri-
cal shape screen installed in flow through vessel that is part of the raw water supply piping (sche-
matically shown on Figure 3.2).
Raw water coming from an open intake structure could contain large objects that could damage
pumping equipment. The initial screening is conducted by the bar screen installed at the entry open-
ings to the intake structure. In submersed structures the opening bar spacing will be in the range of
3 – 10 mm. This is to maintain entrance form velocity not to exceed 20 cm/sec. In channel configu-
ration intakes the opening bar spacing if the “trash rack” would usually be larger in the range of 50
– 100 mm. The large spacing trash racks would be followed by finer screens.
Large capacity installations could utilize automatically washed traveling band screens as shown on
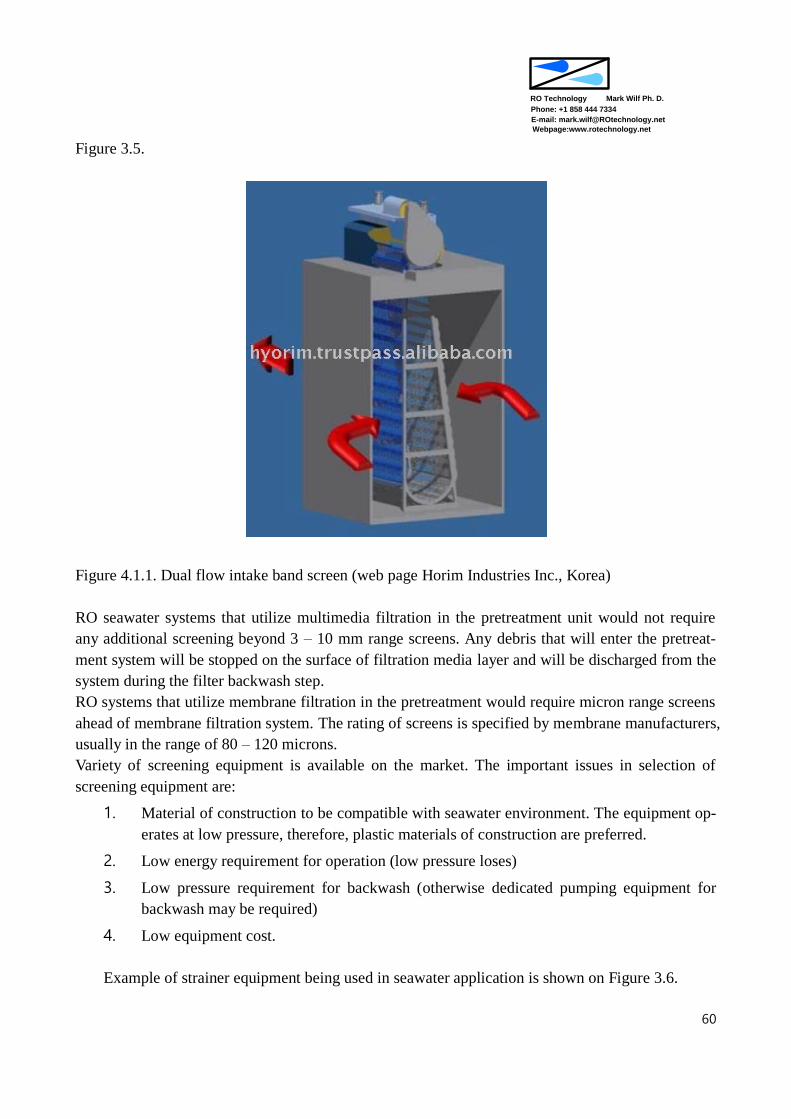
Mark Wilf Ph. D.
Phone: +1 858 444 7334
RO Technology
E-mail: [email protected]
Webpage:www.rotechnology.net
60
Figure 3.5.
Figure 4.1.1. Dual flow intake band screen (web page Horim Industries Inc., Korea)
RO seawater systems that utilize multimedia filtration in the pretreatment unit would not require
any additional screening beyond 3 – 10 mm range screens. Any debris that will enter the pretreat-
ment system will be stopped on the surface of filtration media layer and will be discharged from the
system during the filter backwash step.
RO systems that utilize membrane filtration in the pretreatment would require micron range screens
ahead of membrane filtration system. The rating of screens is specified by membrane manufacturers,
usually in the range of 80 – 120 microns.
Variety of screening equipment is available on the market. The important issues in selection of
screening equipment are:
1. Material of construction to be compatible with seawater environment. The equipment op-
erates at low pressure, therefore, plastic materials of construction are preferred.
2. Low energy requirement for operation (low pressure loses)
3. Low pressure requirement for backwash (otherwise dedicated pumping equipment for
backwash may be required)
4. Low equipment cost.
Example of strainer equipment being used in seawater application is shown on Figure 3.6.
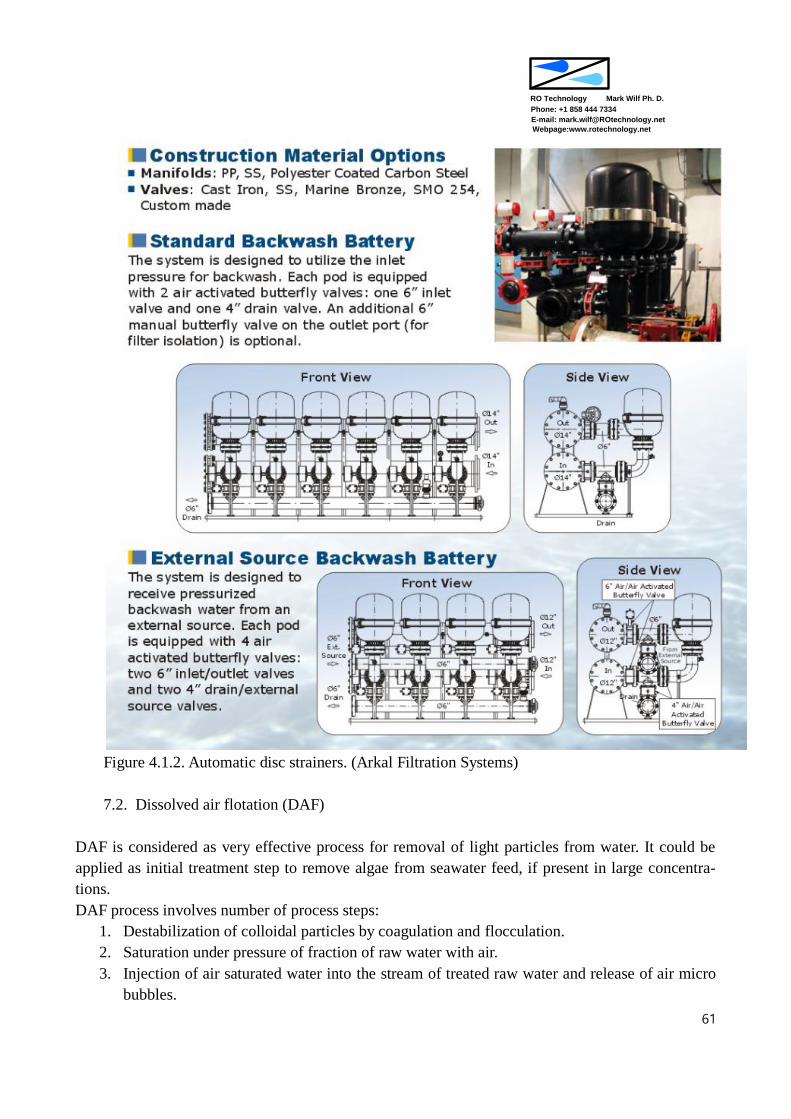
Mark Wilf Ph. D.
Phone: +1 858 444 7334
RO Technology
E-mail: [email protected]
Webpage:www.rotechnology.net
61
Figure 4.1.2. Automatic disc strainers. (Arkal Filtration Systems)
7.2. Dissolved air flotation (DAF)
DAF is considered as very effective process for removal of light particles from water. It could be
applied as initial treatment step to remove algae from seawater feed, if present in large concentra-
tions.
DAF process involves number of process steps:
1. Destabilization of colloidal particles by coagulation and flocculation.
2. Saturation under pressure of fraction of raw water with air.
3. Injection of air saturated water into the stream of treated raw water and release of air micro
bubbles.
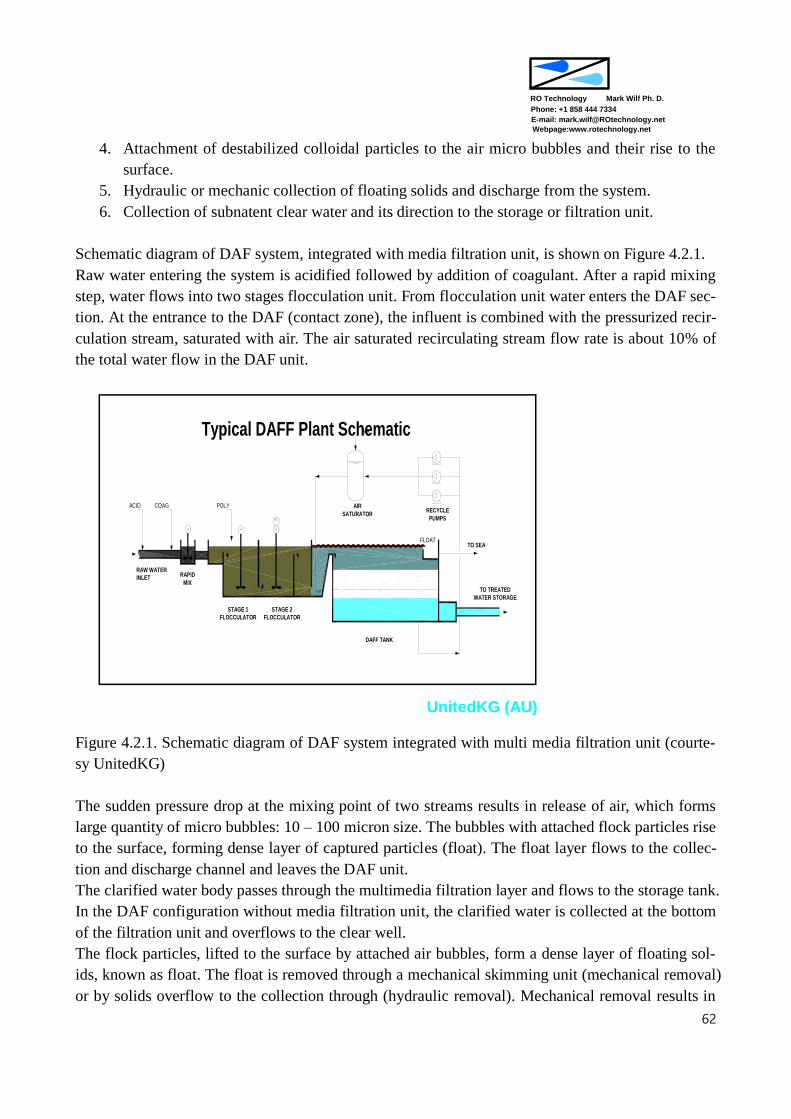
Mark Wilf Ph. D.
Phone: +1 858 444 7334
RO Technology
E-mail: [email protected]
Webpage:www.rotechnology.net
62
4. Attachment of destabilized colloidal particles to the air micro bubbles and their rise to the
surface.
5. Hydraulic or mechanic collection of floating solids and discharge from the system.
6. Collection of subnatent clear water and its direction to the storage or filtration unit.
Schematic diagram of DAF system, integrated with media filtration unit, is shown on Figure 4.2.1.
Raw water entering the system is acidified followed by addition of coagulant. After a rapid mixing
step, water flows into two stages flocculation unit. From flocculation unit water enters the DAF sec-
tion. At the entrance to the DAF (contact zone), the influent is combined with the pressurized recir-
culation stream, saturated with air. The air saturated recirculating stream flow rate is about 10% of
the total water flow in the DAF unit.
AIR
ACID COAG POLY
RAW WATER
INLET RAPID
MIX
STAGE 1
FLOCCULATOR
STAGE 2
FLOCCULATOR
DAFF TANK
TO SEA
TO TREATED
WATER STORAGE
AIR
SATURATOR
FLOAT
RECYCLE
PUMPS
Typical DAFF Plant Schematic
UnitedKG (AU)
Figure 4.2.1. Schematic diagram of DAF system integrated with multi media filtration unit (courte-
sy UnitedKG)
The sudden pressure drop at the mixing point of two streams results in release of air, which forms
large quantity of micro bubbles: 10 – 100 micron size. The bubbles with attached flock particles rise
to the surface, forming dense layer of captured particles (float). The float layer flows to the collec-
tion and discharge channel and leaves the DAF unit.
The clarified water body passes through the multimedia filtration layer and flows to the storage tank.
In the DAF configuration without media filtration unit, the clarified water is collected at the bottom
of the filtration unit and overflows to the clear well.
The flock particles, lifted to the surface by attached air bubbles, form a dense layer of floating sol-
ids, known as float. The float is removed through a mechanical skimming unit (mechanical removal)
or by solids overflow to the collection through (hydraulic removal). Mechanical removal results in
Mark Wilf Ph. D.
Phone: +1 858 444 7334
RO Technology
E-mail: [email protected]
Webpage:www.rotechnology.net
63
waste stream with solids concentration of 2 – 3%. The hydraulic removal produce wastewater with
lower solids concentration in the rate of 0.5 – 1%.
A 10% fraction of the clarified water effluent flow is pumped to the air saturators.
The air saturators are configured as pressure tanks filled with plastic spheres filling, as shown on
Figure 4.2.2.
The saturator vessel is configured based on the water flow rate of 60 – 80 m3/m2/hr and air pressure
of 4.5 – 5.5 bar. The objective of operation of saturator is to achieve dissolved air concentration lev-
el of about 100 ppm.
The representative design parameters of DAF system are listed in Table 4.1.
The solubility of air in water is governed by Henry’s law. The solubility is function of temperature
as shown on Figure 4.2.3.
The target of 100 ppm of air concentration in the recirculation stream is selected to create a dis-
solved air excess concentration of about 10 ppm in DAF influent, after mixing both streams together.
It has been shown that turbidity of DAF effluent reaches plateau at air concentration of about 10
ppm, as shown on Figure 4.2.4. Therefore, concentrations higher than 10 ppm would only increase
energy consumption without additional reduction of concentration of colloidal particles.
The relation between mass concentration of air released at the entry of the DAF cell (CDAF), concen-
tration of air in the recirculating stream (CR) and concentration of dissolved air in the raw water in-
fluent (CIN) is given by equation 4.1.
CDAF = (CR – CIN)*r/(1+ r) (4.1)
Where: r – is recirculation fraction of DAF influent flow
Accordingly, required concentration of air in the recirculation flow is given by equation 4.2.
CR = CIN + CDAF*(1+r)/r (4.2)
CIN of the surface water is usually close to 24 g/m3. Pressure required in the air saturation units is
determined based on target CDAF, recirculation ratio air solubility vs. pressure shown on Figure
4.2.3.
Picture of DAF system operating at Tuas, Singapore, SWRO desalination plant is shown on Figure
4.2.5. The picture shows DAF-multimedia filters basins and air saturator tanks.
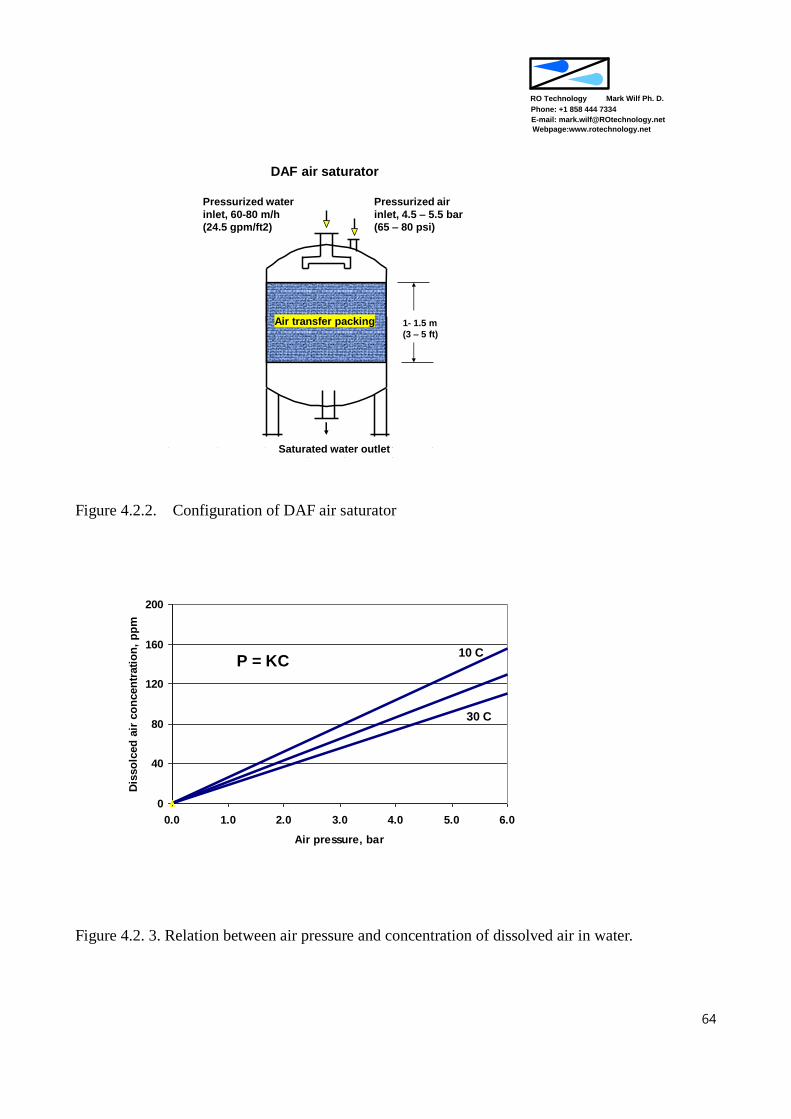
Mark Wilf Ph. D.
Phone: +1 858 444 7334
RO Technology
E-mail: [email protected]
Webpage:www.rotechnology.net
64
DAF air saturator
Saturated water outlet
Pressurized water
inlet, 60-80 m/h
(24.5 gpm/ft2)
Air transfer packing
Pressurized air
inlet, 4.5 – 5.5 bar
(65 – 80 psi)
1- 1.5 m
(3 – 5 ft)
Figure 4.2.2. Configuration of DAF air saturator
0
40
80
120
160
200
0.0 1.0 2.0 3.0 4.0 5.0 6.0
Air pressure, bar
Dis
so
lced
air
co
ncen
trati
on
, p
pm
P = KC10 C
30 C
Figure 4.2. 3. Relation between air pressure and concentration of dissolved air in water.
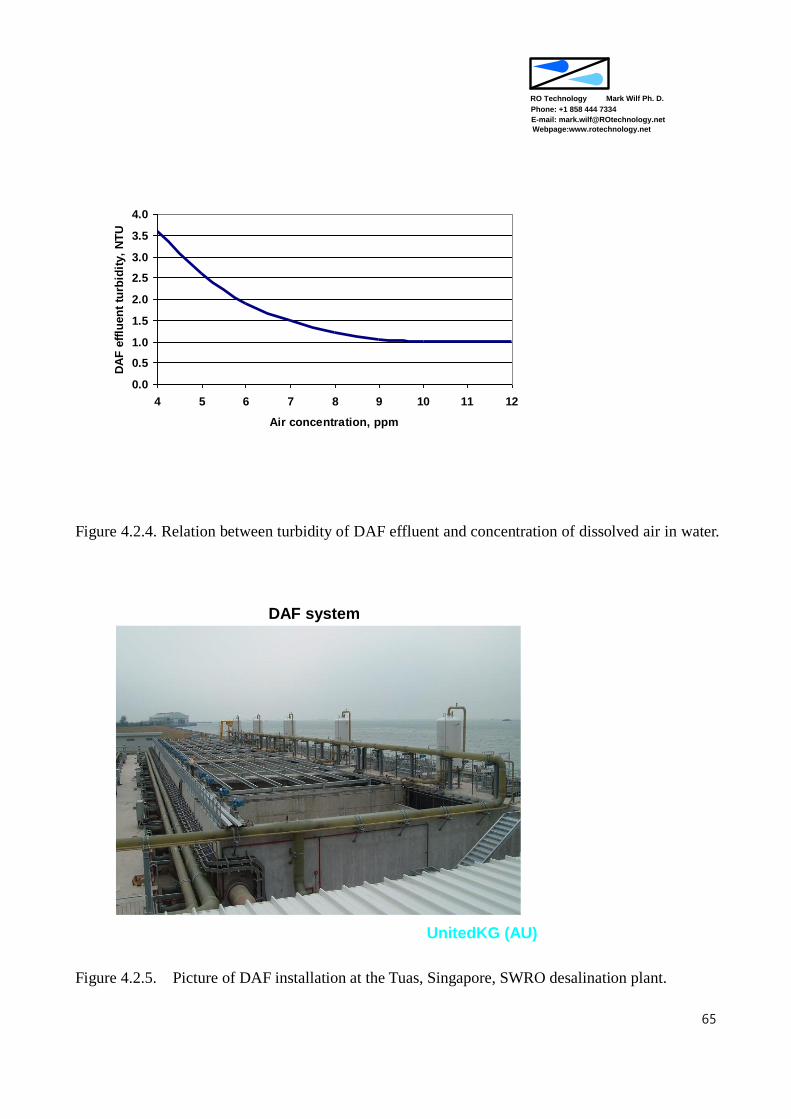
Mark Wilf Ph. D.
Phone: +1 858 444 7334
RO Technology
E-mail: [email protected]
Webpage:www.rotechnology.net
65
0.0
0.5
1.0
1.5
2.0
2.5
3.0
3.5
4.0
4 5 6 7 8 9 10 11 12
Air concentration, ppm
DA
F e
fflu
en
t tu
rbid
ity,
NT
U
Figure 4.2.4. Relation between turbidity of DAF effluent and concentration of dissolved air in water.
DAF system
UnitedKG (AU)
Figure 4.2.5. Picture of DAF installation at the Tuas, Singapore, SWRO desalination plant.
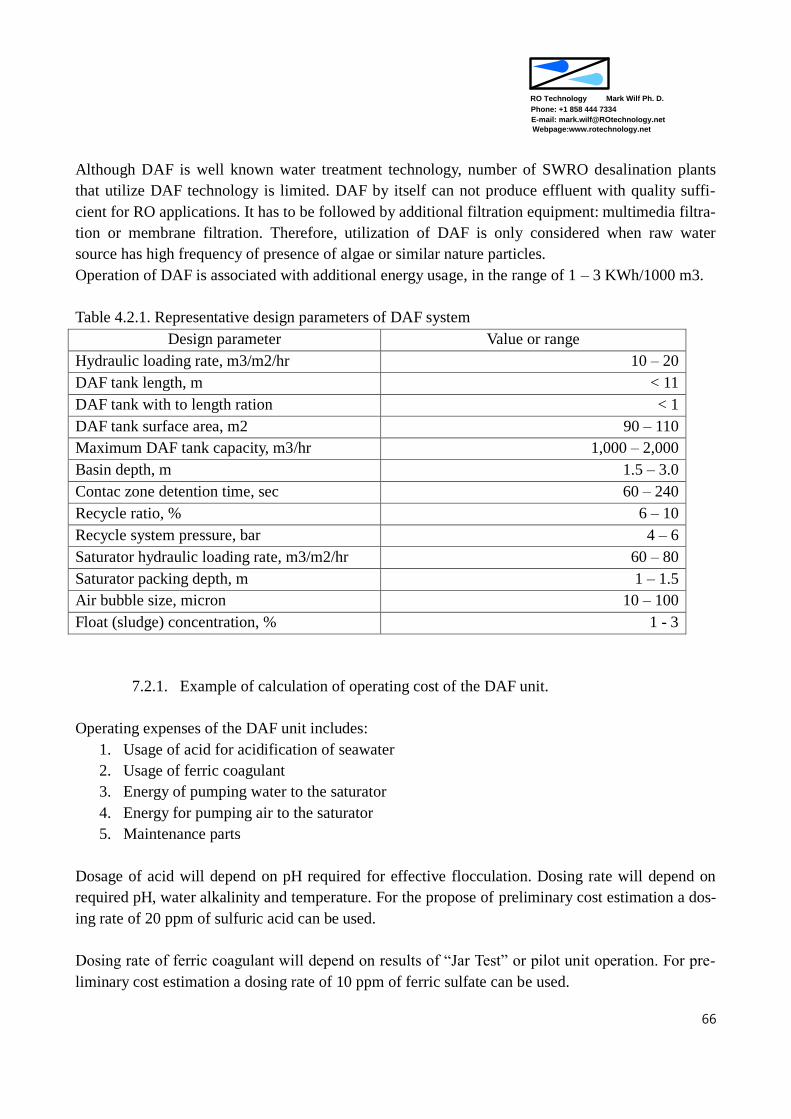
Mark Wilf Ph. D.
Phone: +1 858 444 7334
RO Technology
E-mail: [email protected]
Webpage:www.rotechnology.net
66
Although DAF is well known water treatment technology, number of SWRO desalination plants
that utilize DAF technology is limited. DAF by itself can not produce effluent with quality suffi-
cient for RO applications. It has to be followed by additional filtration equipment: multimedia filtra-
tion or membrane filtration. Therefore, utilization of DAF is only considered when raw water
source has high frequency of presence of algae or similar nature particles.
Operation of DAF is associated with additional energy usage, in the range of 1 – 3 KWh/1000 m3.
Table 4.2.1. Representative design parameters of DAF system
Design parameter Value or range
Hydraulic loading rate, m3/m2/hr 10 – 20
DAF tank length, m < 11
DAF tank with to length ration < 1
DAF tank surface area, m2 90 – 110
Maximum DAF tank capacity, m3/hr 1,000 – 2,000
Basin depth, m 1.5 – 3.0
Contac zone detention time, sec 60 – 240
Recycle ratio, % 6 – 10
Recycle system pressure, bar 4 – 6
Saturator hydraulic loading rate, m3/m2/hr 60 – 80
Saturator packing depth, m 1 – 1.5
Air bubble size, micron 10 – 100
Float (sludge) concentration, % 1 - 3
7.2.1. Example of calculation of operating cost of the DAF unit.
Operating expenses of the DAF unit includes:
1. Usage of acid for acidification of seawater
2. Usage of ferric coagulant
3. Energy of pumping water to the saturator
4. Energy for pumping air to the saturator
5. Maintenance parts
Dosage of acid will depend on pH required for effective flocculation. Dosing rate will depend on
required pH, water alkalinity and temperature. For the propose of preliminary cost estimation a dos-
ing rate of 20 ppm of sulfuric acid can be used.
Dosing rate of ferric coagulant will depend on results of “Jar Test” or pilot unit operation. For pre-
liminary cost estimation a dosing rate of 10 ppm of ferric sulfate can be used.
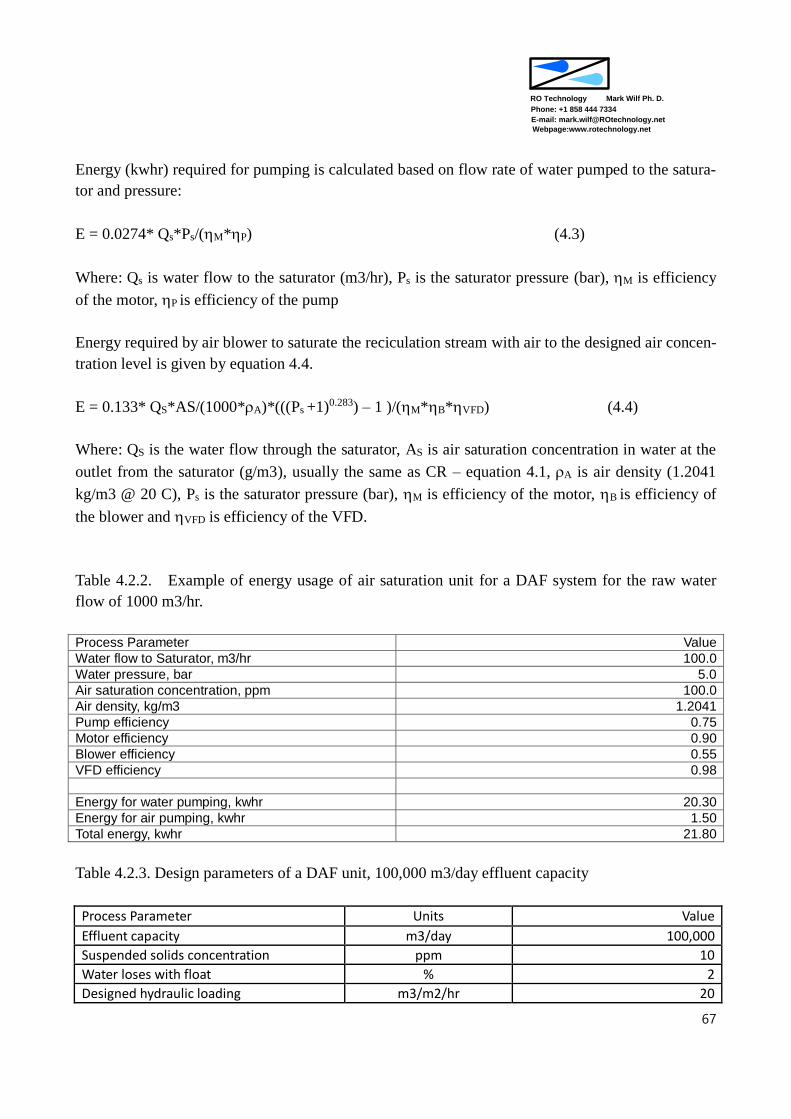
Mark Wilf Ph. D.
Phone: +1 858 444 7334
RO Technology
E-mail: [email protected]
Webpage:www.rotechnology.net
67
Energy (kwhr) required for pumping is calculated based on flow rate of water pumped to the satura-
tor and pressure:
E = 0.0274* Qs*Ps/(M*P) (4.3)
Where: Qs is water flow to the saturator (m3/hr), Ps is the saturator pressure (bar), M is efficiency
of the motor, P is efficiency of the pump
Energy required by air blower to saturate the reciculation stream with air to the designed air concen-
tration level is given by equation 4.4.
E = 0.133* QS*AS/(1000*A)*(((Ps +1)0.283) – 1 )/(M*B*VFD) (4.4)
Where: QS is the water flow through the saturator, AS is air saturation concentration in water at the
outlet from the saturator (g/m3), usually the same as CR – equation 4.1, A is air density (1.2041
kg/m3 @ 20 C), Ps is the saturator pressure (bar), M is efficiency of the motor, B is efficiency of
the blower and VFD is efficiency of the VFD.
Table 4.2.2. Example of energy usage of air saturation unit for a DAF system for the raw water
flow of 1000 m3/hr.
Process Parameter Value
Water flow to Saturator, m3/hr 100.0
Water pressure, bar 5.0
Air saturation concentration, ppm 100.0
Air density, kg/m3 1.2041
Pump efficiency 0.75
Motor efficiency 0.90
Blower efficiency 0.55
VFD efficiency 0.98
Energy for water pumping, kwhr 20.30
Energy for air pumping, kwhr 1.50
Total energy, kwhr 21.80
Table 4.2.3. Design parameters of a DAF unit, 100,000 m3/day effluent capacity
Process Parameter Units Value
Effluent capacity m3/day 100,000
Suspended solids concentration ppm 10
Water loses with float % 2
Designed hydraulic loading m3/m2/hr 20
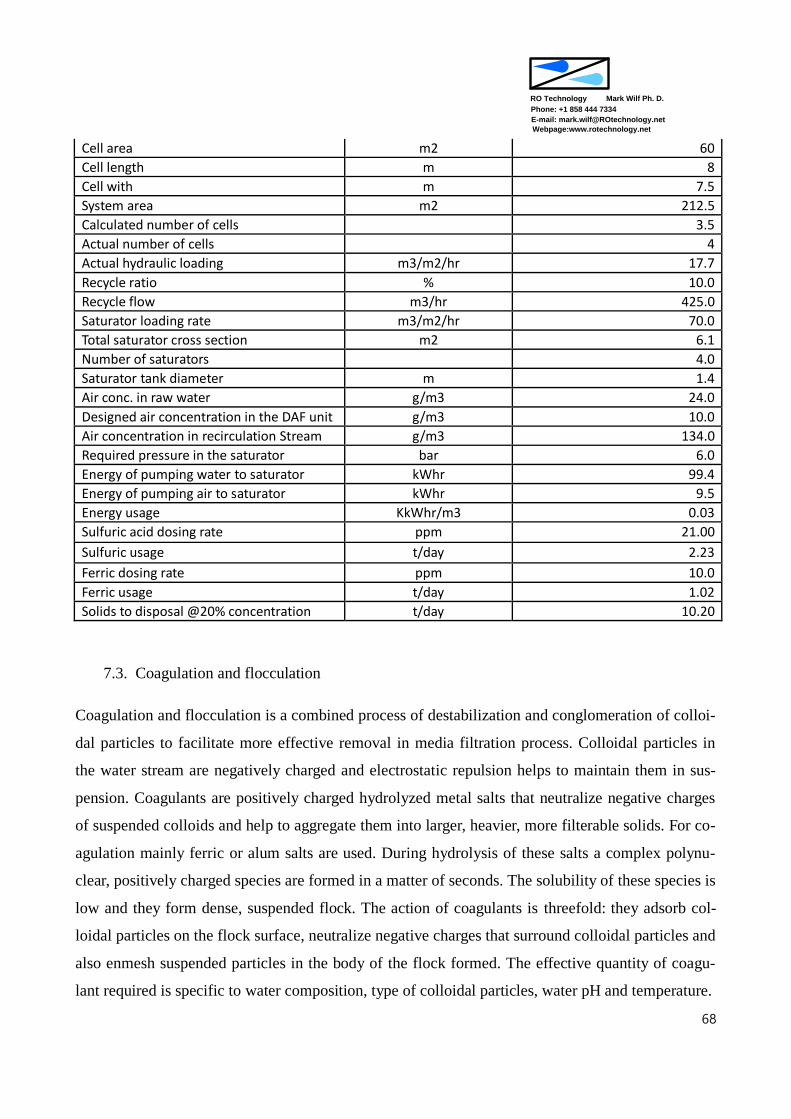
Mark Wilf Ph. D.
Phone: +1 858 444 7334
RO Technology
E-mail: [email protected]
Webpage:www.rotechnology.net
68
Cell area m2 60
Cell length m 8
Cell with m 7.5
System area m2 212.5
Calculated number of cells 3.5
Actual number of cells 4
Actual hydraulic loading m3/m2/hr 17.7
Recycle ratio % 10.0
Recycle flow m3/hr 425.0
Saturator loading rate m3/m2/hr 70.0
Total saturator cross section m2 6.1
Number of saturators 4.0
Saturator tank diameter m 1.4
Air conc. in raw water g/m3 24.0
Designed air concentration in the DAF unit g/m3 10.0
Air concentration in recirculation Stream g/m3 134.0
Required pressure in the saturator bar 6.0
Energy of pumping water to saturator kWhr 99.4
Energy of pumping air to saturator kWhr 9.5
Energy usage KkWhr/m3 0.03
Sulfuric acid dosing rate ppm 21.00
Sulfuric usage t/day 2.23
Ferric dosing rate ppm 10.0
Ferric usage t/day 1.02
Solids to disposal @20% concentration t/day 10.20
7.3. Coagulation and flocculation
Coagulation and flocculation is a combined process of destabilization and conglomeration of colloi-
dal particles to facilitate more effective removal in media filtration process. Colloidal particles in
the water stream are negatively charged and electrostatic repulsion helps to maintain them in sus-
pension. Coagulants are positively charged hydrolyzed metal salts that neutralize negative charges
of suspended colloids and help to aggregate them into larger, heavier, more filterable solids. For co-
agulation mainly ferric or alum salts are used. During hydrolysis of these salts a complex polynu-
clear, positively charged species are formed in a matter of seconds. The solubility of these species is
low and they form dense, suspended flock. The action of coagulants is threefold: they adsorb col-
loidal particles on the flock surface, neutralize negative charges that surround colloidal particles and
also enmesh suspended particles in the body of the flock formed. The effective quantity of coagu-
lant required is specific to water composition, type of colloidal particles, water pH and temperature.

Mark Wilf Ph. D.
Phone: +1 858 444 7334
RO Technology
E-mail: [email protected]
Webpage:www.rotechnology.net
69
An excessive quantity of coagulant could have the undesirable effect of increasing the stability of
colloidal particles. Excessively high concentration of coagulant may increase dispersion of colloids,
due to reversal of surface charges: formation of high density, positive charges on the colloids sur-
face and mutual electrostatic repulsion. The transition of Zeta Potential and Turbidity with increas-
ing dose of coagulant is illustrated on Figure 4.5. As shown on Figure 4.3.1, the preferred range of
zeta potential to achieve low turbidity of the effluent is between 0 to - 20 mV. Zeta Potential values
outside this range will result in increased stability of colloidal matter and higher turbidity.
The initial estimation of the required dosing rate of coagulant and optimum pH range for the pro-
cess is determined by conducting a “jar test” (described in chapter 4.3.3.1). The dosing rate of inor-
ganic coagulant is usually in the range of 1 – 30 ppm and pH in the range of 6 - 8. Following the
results of the jar test the adjustment of coagulation process parameters is conducted during the ini-
tial stages of commercial system operation.
For RO applications ferric salts are preferred over aluminum due to the lower tendency of forming
deposits in membrane elements. The solubility of hydrolyzed species of aluminum and iron depends
Picture 4.3.1.. Transition of Turbidity and Zeta Potential with increasing dose of coagulant (courtesy
Peter Hillis).
on pH. The solubility is at a minimum at about pH 6 for aluminum hydroxide and at about pH 8 for
ferric hydroxide. The solubility of hydrolyzed ferric compounds is much lower than of correspond-
0
4
8
12
16
20
-30 -20 -10 0 10 20 30 40
zeta potential (mV)
turb
idity (
NT
U)
.

Mark Wilf Ph. D.
Phone: +1 858 444 7334
RO Technology
E-mail: [email protected]
Webpage:www.rotechnology.net
70
ing aluminum species. The minimum solubility for Fe is about 10-9 mol/l compared to 10-6 mol/l for
Al. Therefore, if metal salt coagulation is applied, the pretreatment system effluent, and subsequent-
ly RO feed water will have lower concentration of ferric ions then the potential concentration of
aluminum ions at the corresponding conditions. Accordingly, in case of ferric coagulant there will
be lower potential for precipitation as a result of feed water pH changes and/or due to the increase
in concentration of dissolved species that occurs in the RO process.
As mentioned already coagulation is a very rapid process requiring just a few second to complete.
However, effective coagulation required intensive mixing to bring the coagulant in contact with a
large number of colloidal particles. In majority of applications this is usually achieved by incorpo-
rating coagulation tanks with mechanical mixers, either vertical rotating blades or horizontal paddle
mixers. In RO systems in line coagulation, using static mixers positioned downstream of the coagu-
lant injection point, is also being used.
The configuration of the coagulation – flocculation system will depend on configuration of filtration
unit downstream. Systems that utilize pressure filters usually relay on in line coagulation - floccula-
tion, using static mixers. Use of static mixers and in line flocculation, avoids reduction of pressure
of the pumped stream to the atmospheric pressure, which would require repumping.
Static mixers are compact devices that can be incorporated into feed line piping. The mixing effi-
ciency of static mixers is depended on the flow rate through the mixer. Therefore, the dispersion of
coagulant could be lower at partial flow. Use of static mixer introduces head loss of 0.5 – 1m. For
efficient flocculation downstream of static mixer, a straight segment of pipe is required, about 20
pipe diameters long.
The gravity filtration systems are configured to provide gravity flow through the whole system, af-
ter initial pumping boost, through a cascade of overflowing steps. In gravity filtration systems, the
initial coagulation step is accomplished either in static mixers or in tanks equipped with rapid mix-
ers. The flocculation is usually conducted in tanks open to atmosphere with slow mixing.
Mechanical mixing consists of coagulation tank with a mixer that can create velocity gradient (G)
of about 300 sec-1. The tank size is designed for a retention time of 0.5 – 3 min. The power required
for mechanical mixer is in the range of 2 – 2.5 HP/1000 m3/day.
The velocity gradient G, is related to coagulation or flocculation tank volume V, power rating of the
mixer motor P and water viscosity , according to equation 4.5

Mark Wilf Ph. D.
Phone: +1 858 444 7334
RO Technology
E-mail: [email protected]
Webpage:www.rotechnology.net
71
G = [P/( * V)]0.5 (4.5)
For the coagulation process the G value is selected in the range of 300 – 800 s-1. For the flucculation
process the G values are lower, usually below 150 s-1.
During coagulation, metal salts hydrolyze and dissociate. The conversion of metal coagulants to the
hydrolyzed form consumes alkalinity in the water. Therefore, the raw water pH is reduced (0.1 – 0.3
pH units), in proportion to the coagulant dosing and alkalinity present, according to the following
equations:
FeCl3 + 3HCO3- = Fe(OH)3 + 3Cl- +3CO2 (4.6)
Fe2(SO4)3 + 6HCO3- = 2Fe(OH)3 + 3SO4
= +6CO2 (4.7)
AlCl3 + 3HCO3- = Al(OH)3 + 3Cl- + 3CO2 (4.8)
Coagulation can be also conducted using long chain synthetic organic polymers, which could be of
nonionic, anionic or cationic types. The nonionic and anionic polymers destabilize colloids by
bridging particles together. The cationic type polymers have a dual action of bridging and neutrali-
zation the negative surface charges of the colloids. Cationic organic polymers can be used as prima-
ry coagulants. However, in RO pretreatment systems polymers are usually used as additives to en-
hance the effectiveness of metal based coagulants by binding flock particles together. In most cases,
polymers are applied at low dosing rage, below 1 ppm, directly injected to the feed water down-
stream of the dosing point of the metal coagulant, at the location where hydrolyzed metal flock has
been already formed. If polymers are used at a high dosing rate, and a carryover from the sand
filters occurs, cationic polymers may react with anionic scale inhibitors and form a fouling layer on
the membrane surface.
Flocculation, which follows coagulation, is a process of flock formation during gentle mixing. Floc-
culation is a slower process than coagulation and takes number of minutes to complete. During
flocculation, colloidal particles and some fraction of dissolved organics are being attached to the
flock body, and are eventually retained on the filtration layer in the granular media filters.
Flocculation in conducted in tanks equipped with mixers that are able to create velocity gradient of
30 – 120 sec-1. The rotating velocity of the mixers is slow, in the range of 20 – 60 rpm. The depth of
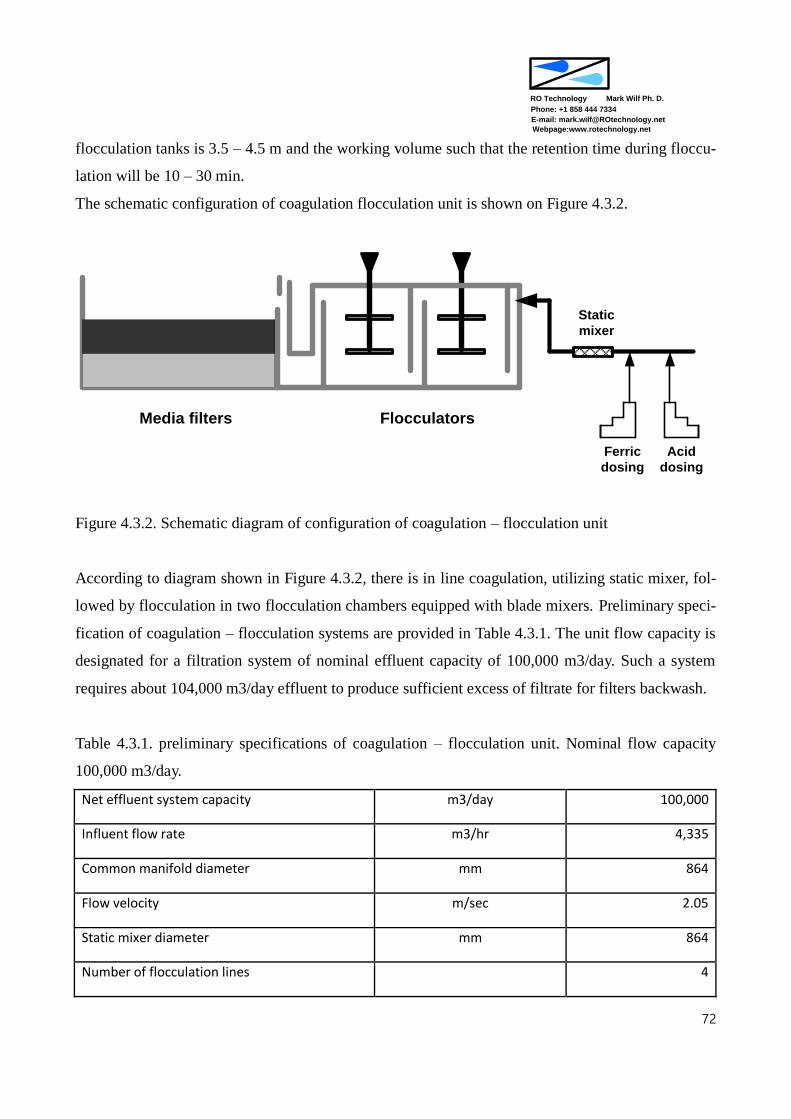
Mark Wilf Ph. D.
Phone: +1 858 444 7334
RO Technology
E-mail: [email protected]
Webpage:www.rotechnology.net
72
flocculation tanks is 3.5 – 4.5 m and the working volume such that the retention time during floccu-
lation will be 10 – 30 min.
The schematic configuration of coagulation flocculation unit is shown on Figure 4.3.2.
Flocculators
Ferric
dosing
Acid
dosing
Media filters
Static
mixer
Figure 4.3.2. Schematic diagram of configuration of coagulation – flocculation unit
According to diagram shown in Figure 4.3.2, there is in line coagulation, utilizing static mixer, fol-
lowed by flocculation in two flocculation chambers equipped with blade mixers. Preliminary speci-
fication of coagulation – flocculation systems are provided in Table 4.3.1. The unit flow capacity is
designated for a filtration system of nominal effluent capacity of 100,000 m3/day. Such a system
requires about 104,000 m3/day effluent to produce sufficient excess of filtrate for filters backwash.
Table 4.3.1. preliminary specifications of coagulation – flocculation unit. Nominal flow capacity
100,000 m3/day.
Net effluent system capacity m3/day 100,000
Influent flow rate m3/hr 4,335
Common manifold diameter mm 864
Flow velocity m/sec 2.05
Static mixer diameter mm 864
Number of flocculation lines 4

Mark Wilf Ph. D.
Phone: +1 858 444 7334
RO Technology
E-mail: [email protected]
Webpage:www.rotechnology.net
73
Number of flocculators in series in each line 2
Floccculator cell length m2 6.0
Flocculator cell with m 4.3
Flocculator cell depth m 6.00
Operational volume of flocculator cell m3 129.0
Lotal volume of flocculators m3 1109.4
Flocculation time min 15.4
Coagulant dosing rate ppm as Fe2(SO4)3 10
Coagualnt usage t/day (100%) 1.04
Accid dosing rate ppm as H2SO4 20.0
Acid usage t/day (96%) 2.17
7.4. Granular media filtration
In the granular media filtration process, suspended solids are removed through attachment to the
filtration media particles and through blockage/capture by the filtration cake. The preferred process
of filtration is capture of suspended solids with significant bed penetration as opposed to surface
filtration, since the latter results in faster increase of pressure loss and therefore shorter filter runs.
In a single medium filtration bed, after number of backwash runs, fine size filtration media particles
are aggregated at the top of the bed. This reduces penetration of suspended solids and therefore,
mainly results in surface bed filtration. A graduation of the filtration bed from coarse to fine parti-
cles of the filtration bed can be achieved in dual media configuration by placing fine, high specific
gravity, filtration media as the lower filtration layer and coarse, low specific gravity, filtration media
as a top layer. Filtration media selection that provides coarse to fine filtration bed configuration, in-

Mark Wilf Ph. D.
Phone: +1 858 444 7334
RO Technology
E-mail: [email protected]
Webpage:www.rotechnology.net
74
cludes anthracite (specific density 1.5 – 1.75 t/m3, effective size around 1.5 mm. as a top layer and
silica sand (specific density: 2.55 – 2.65 t/m3, effective size around 0.6 mm, as a bottom filtration
layer.
The value of effective size (ES) means that size of 90% of filter media particles in the given lot is
larger than the value indicated.
Another important parameter of filtration media is uniformity coefficient (UC). The uniformity co-
efficient is expressed as a ratio of ES value corresponding to 60% passage over ES value corre-
sponding to 10% passage:
UC = ES60/ES10 (4.9)
The lower the values of UC for a given lot, the closer together are sizes of particles forming the lot.
The practical values of UC specifications for filtration media are in the range of 1.3 – 1.5.
Example of filtration media (anthracite and sand) specifications is provided in Table 4.4.1.
Table 4.4.1. Range of specifications parameters of filtration media.
Parameter Designation Anthracite Filtration sand
Effective size ES = D10 1.5 – 1.8 0.5 – 0.7
Uniformity coefficient UC = d60/d10 1.3 – 1.5 1.3 – 1.5
Specific gravity SG 1.6 – 1.8 2.4 – 2.6
Hardness Moh scale 3 – 4 6 – 7
The operation of sequence of operation of media filters is based on capture of suspended solids in
media layer and formation of filtration cake on the surface. Increasing load of solid particles in me-
dia results in increase of pressure drop across the media. At the end of filtration cycle, the flow of
water through the filter is reversed. Usually using filtrate, the flow through the filter is from the out-
let port to the inlet port, expanding the filtration layer and flushing out the solids particles captured.
The duration of filtration cycle is usually determined based on the operating time, the standard
length being 24 hr. The backwash process usually includes sequence of steps, which are finalized
rinsing filter in forward direction to create initial coating on filtration particles and improve solids
capture efficiency of the filter. Once the quality of filter effluent reaches the required level, the filter

Mark Wilf Ph. D.
Phone: +1 858 444 7334
RO Technology
E-mail: [email protected]
Webpage:www.rotechnology.net
75
is connected back to the common effluent piping manifold.
Effective backwash requires that the filter layer will be fluidized, which corresponds to the filtration
bed expansion of about 30%. The bed expansion occurs as the drag forces of backwash flow in-
creases of gravity forces. The backwash flow rate required for bed expansion will depend on water
viscosity. The required flow rate will be higher at increased water temperature (reduced water vis-
cosity and lower drag forces). At the temperature range of 20 C, the backwash flow rate for bed ex-
pansion will be about 40 m/hr for silica sand and about 50 m/hr for anthracite.
The backwash flow rate (VB) required for a given rate of bed expansion can be calculated
according to the equations below:
VB = *Re/(w*d) (4.10)
Where: is dynamic viscosity of water, Re is Reynolds number, w is density of water an
d is representative media particle size.
Re = – V (1 – )/2l + 1/(2l) [2V(1 – )2 + 4l
1/2 (4.11)
Where: V is head loss coefficient due to viscous forces, dimensionless, l is head loss coe
fficient due to inertial forces, dimensionless, is porosity, dimensionless and is backwash
calculation factor, dimensionless.
The recommended range of the above parameters is provided in Table 4.4.2.
Table 4.4.2. Recommended values of filtration media parameters
Filtration medium V l
Sand 110 – 115 2.0 – 2.5 0.40 – 0.43
Anthracite 210 – 245 3.5 – 5.3 0.47 – 0.52
= gw(p – w)d33/2 (4.12)

Mark Wilf Ph. D.
Phone: +1 858 444 7334
RO Technology
E-mail: [email protected]
Webpage:www.rotechnology.net
76
Where: g is gravity acceleration (9.81m/sec) and p – particle density
Example of calculation of required backwash flow rate (VB)
Filter media anthracite
Bed depth 1.0 m
Required expansion 30%
Media particle size 1.5 mm
Media porosity 0.50
Media density 1700 kg/m3
Water temperature 15 C
V 230
l 4.4
expanded bed
(9.81*1000)*(1700 – 1000)*(0.0015)3 *(0.615)3]/(0.001139)2 = 3405
Re = -230(1 – 0.615)/(2*4.4) + 1/(2*4.4)*[(230)2(1 – 0.615)2 + 4*(4.4*3405)]0.5 = 19.3
VB = 0.001139*19.3*3600/(1000*0.0015) = 52 m/hr
7.4.1. Pressure filter
There is a variety of media filtration equipment configurations used in potable and waste water fil-
tration. In RO applications the frequently used filter types are pressure or gravity down-flow fil-
ters in single or two stage configuration.
The pressure filters are cylindrical pressure vessels filled with a layer(s) of filtration media. The fil-
ters could be configured for horizontal or vertical operation (Figure 4.4.1 and 4.4.2). Maximum di-
ameter of filter is limited to about 3 – 4 m, due to logistic of transportation of large pressure vessels
from the manufacturer to the project site. The shell length of horizontal pressure filters usually does
not exceed 12 m.
The important features of the pressure filters configurations are the top distributors for the uniform
entry of influent to the filter and bottom collectors of the filtrate. The influent distributors are usual-
ly configures as a grid of perforated laterals. For the filtrate collection laterals could be used or false

Mark Wilf Ph. D.
Phone: +1 858 444 7334
RO Technology
E-mail: [email protected]
Webpage:www.rotechnology.net
77
bottom with nozzles could be utilized. Examples of filter nozzles are shown on Figure 4.4.3.
Pressure filters are equipped with air relief valves, installed at the highest point of the filter shell. In
horizontal filters, which are divided into chambers, each chamber should be equipped with a sepa-
rate air relief valve.
The filters that utilize air scouring to enhance media backwash, could have separate port and inter-
nal manifold for air distribution for this purpose. In systems utilizing false bottom and nozzles, the
air is injected into the filtration layer through the filtrate collection nozzles.
The filter shell should have man port for loading the media and filter maintenance and a smaller
viewing port to enable observation of the condition of the surface of the media during normal opera-
tion and during the backwash.
Filters that utilize bottom laterals for filtrate collection should have the volume below laterals filled
with concrete. This is to eliminate presence of areas of stagnant water, below the bottom collectors.
In the filtration step, raw water enters the filter shell through the inlet port and, flows through dis-
tributors over the surface of filtration layer. Water infiltrates through the media and is collected as a
filtrate by the bottom laterals or nozzles (in the “false bottom” configuration).
In the backwash mode the flow directions are being reversed. The filtrate collector serves as the en-
try port for the filtrate used as backwash water. The backwash water eventually exits the filter
through the top, influent port, and is directed to the backwash water storage tank or to the outfall.
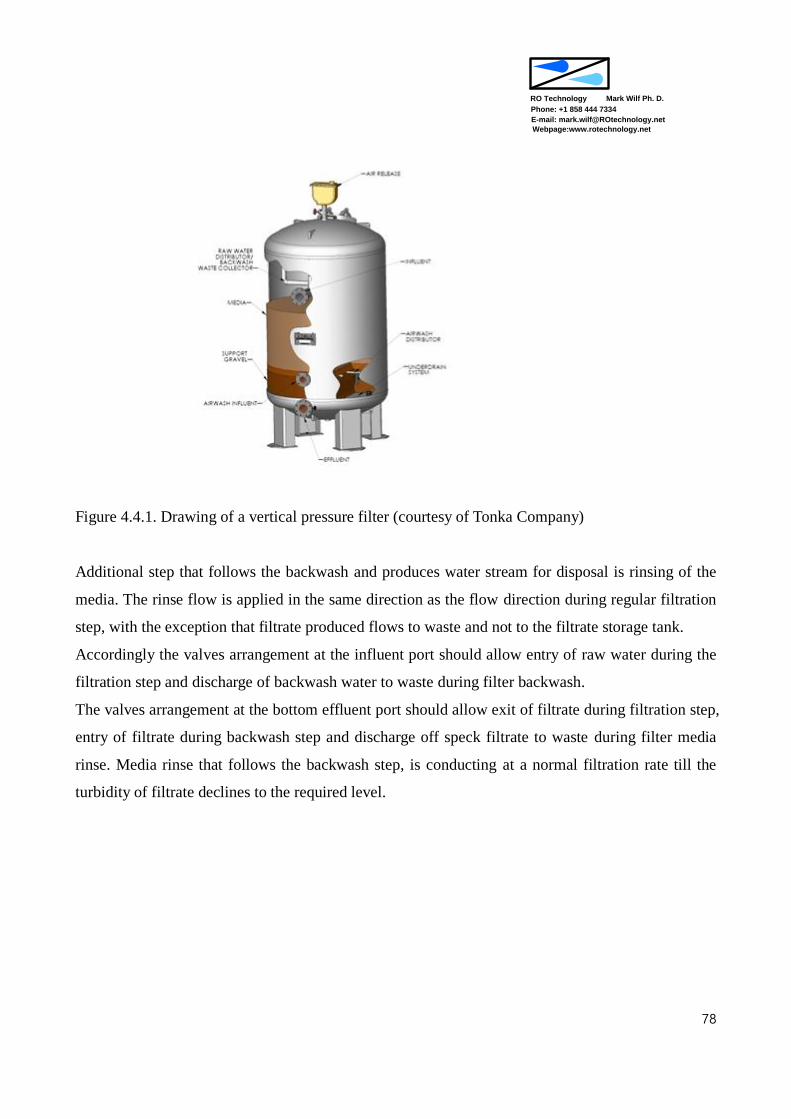
Mark Wilf Ph. D.
Phone: +1 858 444 7334
RO Technology
E-mail: [email protected]
Webpage:www.rotechnology.net
78
Figure 4.4.1. Drawing of a vertical pressure filter (courtesy of Tonka Company)
Additional step that follows the backwash and produces water stream for disposal is rinsing of the
media. The rinse flow is applied in the same direction as the flow direction during regular filtration
step, with the exception that filtrate produced flows to waste and not to the filtrate storage tank.
Accordingly the valves arrangement at the influent port should allow entry of raw water during the
filtration step and discharge of backwash water to waste during filter backwash.
The valves arrangement at the bottom effluent port should allow exit of filtrate during filtration step,
entry of filtrate during backwash step and discharge off speck filtrate to waste during filter media
rinse. Media rinse that follows the backwash step, is conducting at a normal filtration rate till the
turbidity of filtrate declines to the required level.

Mark Wilf Ph. D.
Phone: +1 858 444 7334
RO Technology
E-mail: [email protected]
Webpage:www.rotechnology.net
79
Figure 4.4.2. Drawing of horizontal filter (courtesy of Tonka Company)
Figure 4.4.3. Examples of filter nozzles (web page of FTR, Istanbul)
In RO application the filtration system operates at constant output. The control of the filtration rate
is accomplished by adjusting the throttling of the valve located on the effluent line. As shown on
figure 4.4.4, the differential head (DH) is a sum of head losses (HL) in the filtration bed and flow
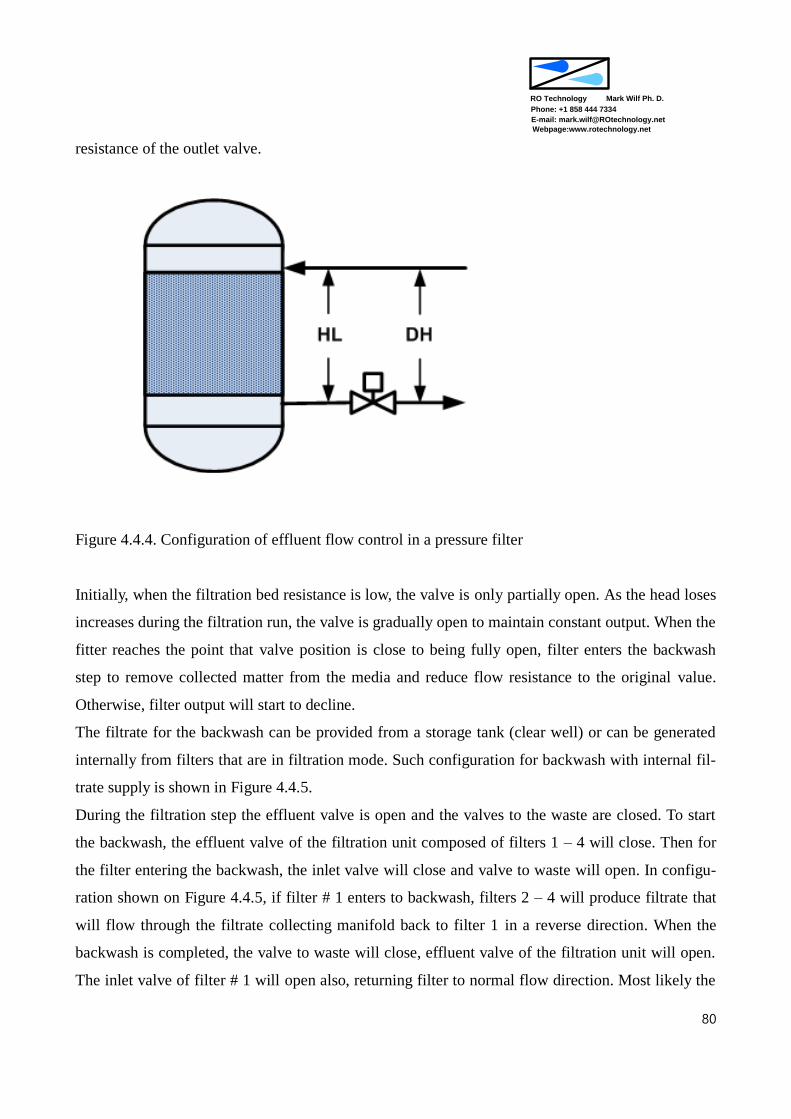
Mark Wilf Ph. D.
Phone: +1 858 444 7334
RO Technology
E-mail: [email protected]
Webpage:www.rotechnology.net
80
resistance of the outlet valve.
Figure 4.4.4. Configuration of effluent flow control in a pressure filter
Initially, when the filtration bed resistance is low, the valve is only partially open. As the head loses
increases during the filtration run, the valve is gradually open to maintain constant output. When the
fitter reaches the point that valve position is close to being fully open, filter enters the backwash
step to remove collected matter from the media and reduce flow resistance to the original value.
Otherwise, filter output will start to decline.
The filtrate for the backwash can be provided from a storage tank (clear well) or can be generated
internally from filters that are in filtration mode. Such configuration for backwash with internal fil-
trate supply is shown in Figure 4.4.5.
During the filtration step the effluent valve is open and the valves to the waste are closed. To start
the backwash, the effluent valve of the filtration unit composed of filters 1 – 4 will close. Then for
the filter entering the backwash, the inlet valve will close and valve to waste will open. In configu-
ration shown on Figure 4.4.5, if filter # 1 enters to backwash, filters 2 – 4 will produce filtrate that
will flow through the filtrate collecting manifold back to filter 1 in a reverse direction. When the
backwash is completed, the valve to waste will close, effluent valve of the filtration unit will open.
The inlet valve of filter # 1 will open also, returning filter to normal flow direction. Most likely the
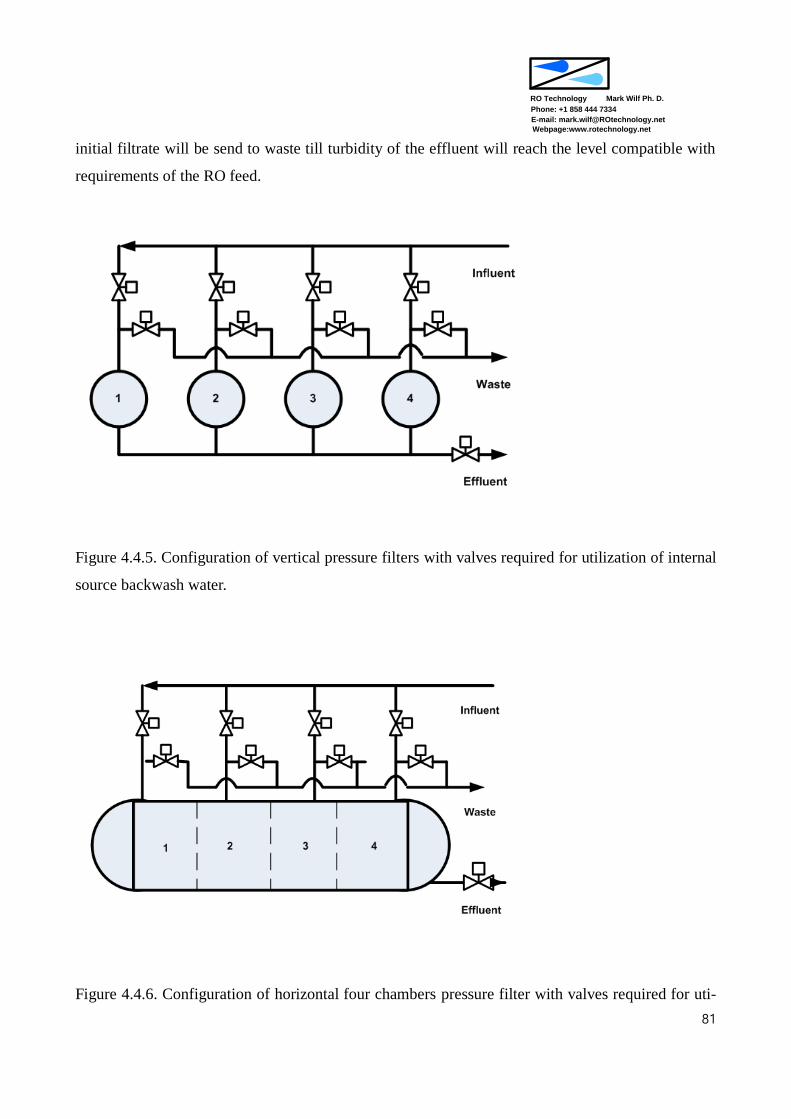
Mark Wilf Ph. D.
Phone: +1 858 444 7334
RO Technology
E-mail: [email protected]
Webpage:www.rotechnology.net
81
initial filtrate will be send to waste till turbidity of the effluent will reach the level compatible with
requirements of the RO feed.
Figure 4.4.5. Configuration of vertical pressure filters with valves required for utilization of internal
source backwash water.
Figure 4.4.6. Configuration of horizontal four chambers pressure filter with valves required for uti-
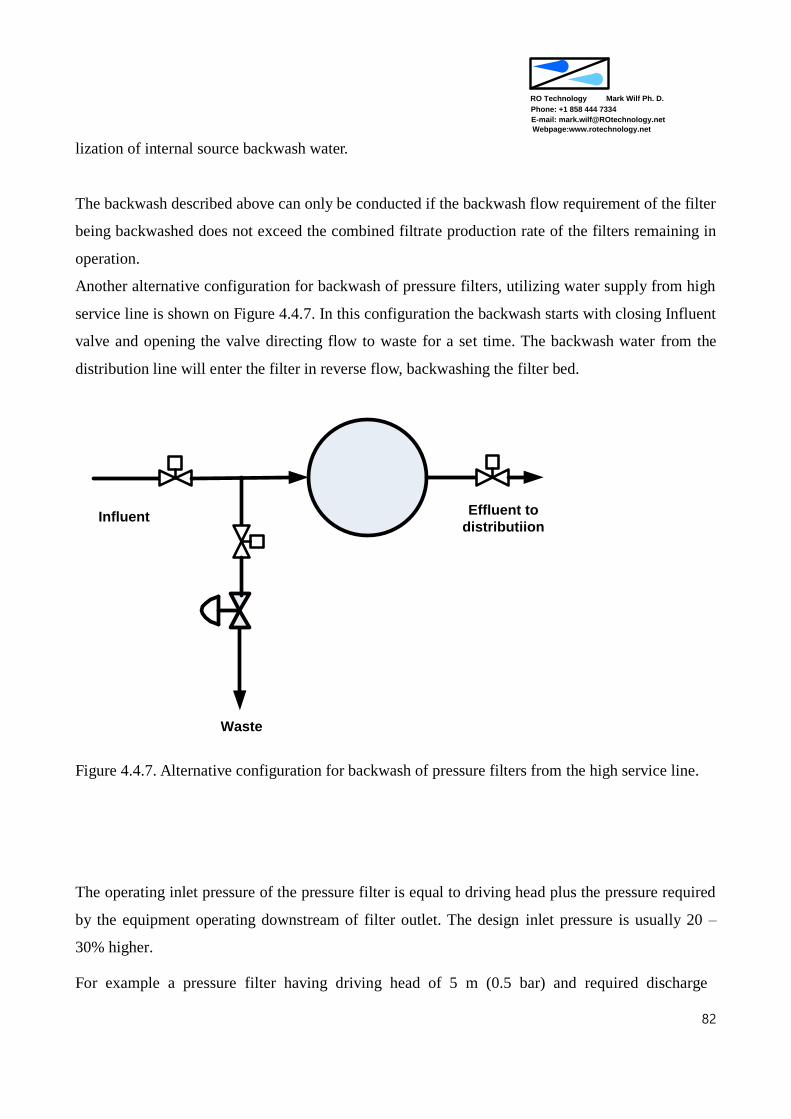
Mark Wilf Ph. D.
Phone: +1 858 444 7334
RO Technology
E-mail: [email protected]
Webpage:www.rotechnology.net
82
lization of internal source backwash water.
The backwash described above can only be conducted if the backwash flow requirement of the filter
being backwashed does not exceed the combined filtrate production rate of the filters remaining in
operation.
Another alternative configuration for backwash of pressure filters, utilizing water supply from high
service line is shown on Figure 4.4.7. In this configuration the backwash starts with closing Influent
valve and opening the valve directing flow to waste for a set time. The backwash water from the
distribution line will enter the filter in reverse flow, backwashing the filter bed.
Waste
Effluent to
distributiion
Influent
Figure 4.4.7. Alternative configuration for backwash of pressure filters from the high service line.
The operating inlet pressure of the pressure filter is equal to driving head plus the pressure required
by the equipment operating downstream of filter outlet. The design inlet pressure is usually 20 –
30% higher.
For example a pressure filter having driving head of 5 m (0.5 bar) and required discharge

Mark Wilf Ph. D.
Phone: +1 858 444 7334
RO Technology
E-mail: [email protected]
Webpage:www.rotechnology.net
83
pressure of 20 m (2 bar), will have designed inlet pressure of 3 bar (2.5 * 1.2).
The design of length of filter shell for vertical filters and shell diameter of horizontal filters is based
on the height of filtration layers in the filter. For vertical filter, starting from the bottom, gravel me-
dia will be loaded to cover the filtrate collection laterals up to the level of about 20 cm above the
laterals. The filtration layer will be about 80 cm to 1 m deep. Above it, there should be allowance
for filtration bed expansion during backwash of about 30% (25 cm), additional 30 cm freeboard. To
this combined length of 160 cm (20 + 80 + 25 + 25) one should add the shell length required for
installation of inlet water distributor, additional 25 cm. The same length of 25 cm will be added for
the bottom collector. This result in a total length of the strait filter shell of 200 cm. Additional
heights will be added to include bottom and top elliptical heads, 40 cm each, making total height of
filter of 280 cm. The actual filter structure will be higher than this due to filter foundations and filter
supporting frame.
The horizontal media filters are sized in a similar way. The sizing of the filtration system is based
on the nominal filtration rate and the backwash rate. The horizontal filters are usually divided into
four compartments, each being backwashed separately. The system is divided into number of filters
that would provide sufficient operational flexibility during filters backwash and filters maintenance.
Example of results of sizing of filtration system utilizing horizontal media filters is included in Ta-
ble 4.4.3.
Table 4.4.3. Design parameters of media filtration system utilizing horizontal filters. System efflu-
ent capacity 100,000 m3/day.
Net effluent system capacity m3/day 100,000
Influent flow rate m3/hr 4,408
Suspended solids concentration ppm 5
Nominal filtration rate m/hr 12.0
Actual filtration rate m/hr 12.4
Required filtration area m2 347
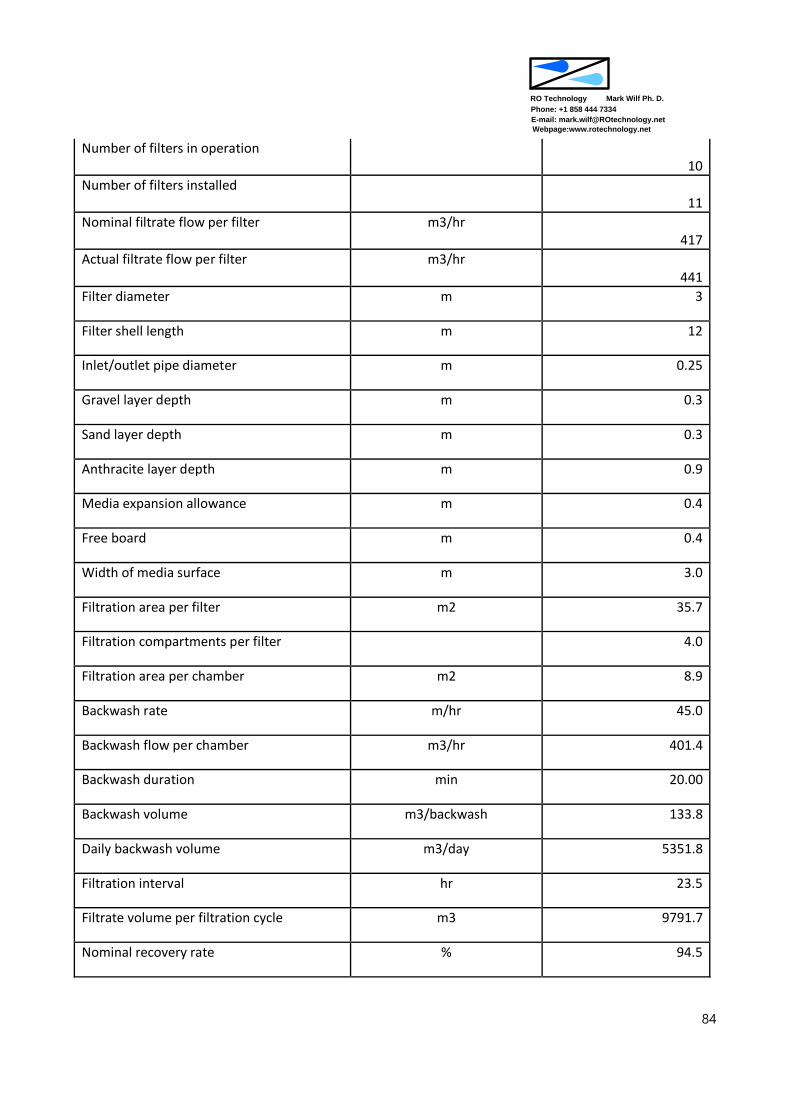
Mark Wilf Ph. D.
Phone: +1 858 444 7334
RO Technology
E-mail: [email protected]
Webpage:www.rotechnology.net
84
Number of filters in operation 10
Number of filters installed 11
Nominal filtrate flow per filter m3/hr 417
Actual filtrate flow per filter m3/hr 441
Filter diameter m 3
Filter shell length m 12
Inlet/outlet pipe diameter m 0.25
Gravel layer depth m 0.3
Sand layer depth m 0.3
Anthracite layer depth m 0.9
Media expansion allowance m 0.4
Free board m 0.4
Width of media surface m 3.0
Filtration area per filter m2 35.7
Filtration compartments per filter 4.0
Filtration area per chamber m2 8.9
Backwash rate m/hr 45.0
Backwash flow per chamber m3/hr 401.4
Backwash duration min 20.00
Backwash volume m3/backwash 133.8
Daily backwash volume m3/day 5351.8
Filtration interval hr 23.5
Filtrate volume per filtration cycle m3 9791.7
Nominal recovery rate % 94.5
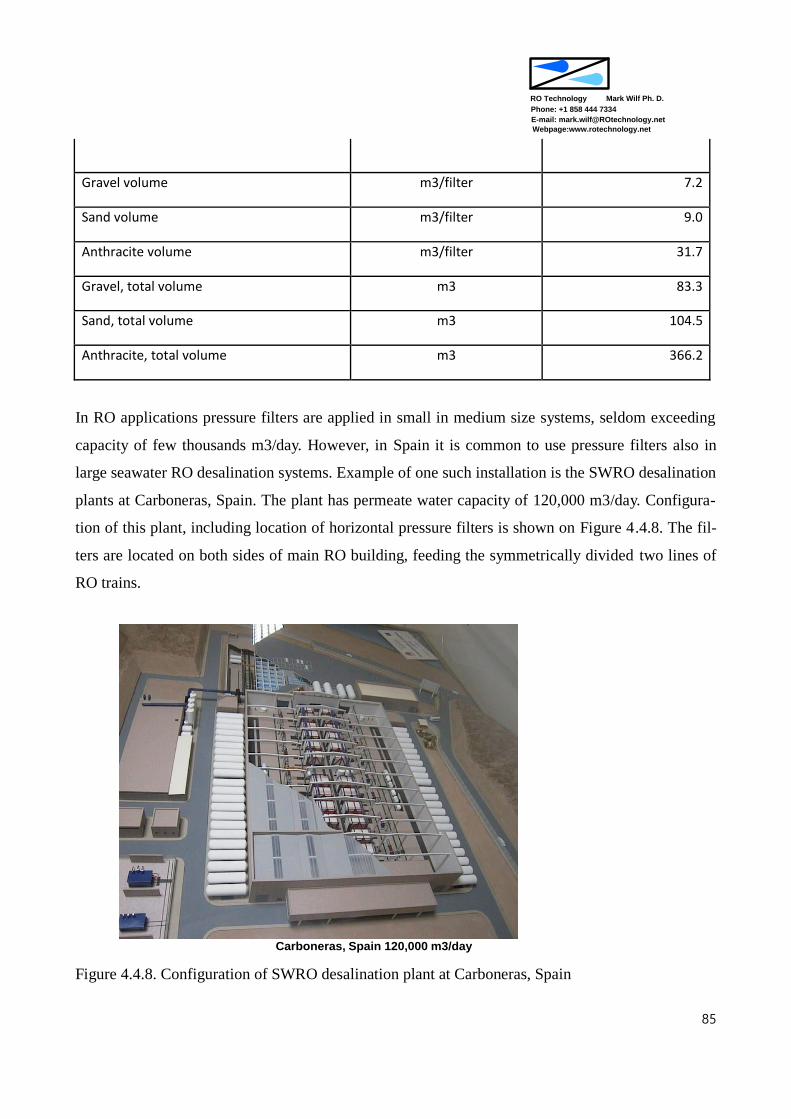
Mark Wilf Ph. D.
Phone: +1 858 444 7334
RO Technology
E-mail: [email protected]
Webpage:www.rotechnology.net
85
Gravel volume m3/filter 7.2
Sand volume m3/filter 9.0
Anthracite volume m3/filter 31.7
Gravel, total volume m3 83.3
Sand, total volume m3 104.5
Anthracite, total volume m3 366.2
In RO applications pressure filters are applied in small in medium size systems, seldom exceeding
capacity of few thousands m3/day. However, in Spain it is common to use pressure filters also in
large seawater RO desalination systems. Example of one such installation is the SWRO desalination
plants at Carboneras, Spain. The plant has permeate water capacity of 120,000 m3/day. Configura-
tion of this plant, including location of horizontal pressure filters is shown on Figure 4.4.8. The fil-
ters are located on both sides of main RO building, feeding the symmetrically divided two lines of
RO trains.
Carboneras, Spain 120,000 m3/day
Figure 4.4.8. Configuration of SWRO desalination plant at Carboneras, Spain

Mark Wilf Ph. D.
Phone: +1 858 444 7334
RO Technology
E-mail: [email protected]
Webpage:www.rotechnology.net
86
7.4.2. Gravity filters
The gravity filters have the configuration of rectangular tanks, usually made of concrete. The tank
has connections for entry of influent and exit of filtrated effluent. In addition there is a connection
for air supply used air scouring of filtration media during backwash step. In the same manner as
with pressure filters, during the backwash step the flow direction is reversed, supplying the back-
wash flow through the effluent exit port.
An example of a gravity filter configuration is shown on Figure 4.4.9. In this diagram the influent
water to the filter is supply through a side channel. Filtrate leaves the filter through the effluent out-
let located at the bottom of the filter. The filter bottom is covered with blocks with slits that provide
support to the filtration media and also collects filtrate. The exit port and the filtrate collecting
blocks serve as an entrance of the backwash water. In some filter configurations, the blocks are re-
placed with a raised concrete floor with evenly spaced filter nozzles (shown on figure 4.4.9)
Backwash operation is sometimes augmented by air. The air port is a separate port for injecting the
compressed air to the underdrain. The backwash water is collected by the wash water troughs, lo-
cated above the level that the media expands during the backwash. Some gravity filters utilize
washing of media surface using water jets.

Mark Wilf Ph. D.
Phone: +1 858 444 7334
RO Technology
E-mail: [email protected]
Webpage:www.rotechnology.net
87
Wash water
troughs
Influent &
backwash water
channel
Underdrain blocks & media
retaining plate
Backwash supply
& filter effluent
Dual filter media
Air
backwash
Header
Surface wash, not
shown
Figure 4.4.9. Schematic configuration of a gravity media filter.
The dimensions of gravity filters cells are determined by the surface area which is in the range of
25m – 100 m2 per filter cell. The number of filtration cells for a given system is determined by the
logistic of operation, the filtration and backwash steps. The preffered configuration is not increase
filtration rate of filters in operation by more that 10 – 15%, while one filter is off line due to back-
wash. Another consideration is logistic operation of the RO membrane trains. In very large systems
it is sometimes convenient to have media filter cells divided into two groups, so the desalination
system can have flexibility to operate effectively at 50% of production capacity.
The usual range of length to with ratio of filter cell dimensions is in the range of 2 – 4. The depth of
the filter cell should be such to accommodate design depth of filtration layer, provide required driv-
ing head and safety free board. In dual media gravity filter the combined depth of filtration layers
usually does not exceed 2 m. The depth of sand layer is in the range of 0.5 – 1.0 m and the depth of
anthracite layer in the range of 0.5 – 1.0 m. Usually, the depth of top anthracite layer is larger than
the depths of underlying sand filtration layer. Depending on type and configuration of filtrate col-
lectors, the media layer could be supported by layer of gravel, 0.25 – 0.4 m thick.
The dimension range of filtration layers in gravity dual media filter is shown on Figure 4.4.10.

Mark Wilf Ph. D.
Phone: +1 858 444 7334
RO Technology
E-mail: [email protected]
Webpage:www.rotechnology.net
88
Figure 4.4.10. Configuration of filtration layers in a gravity filter
Figure 4.4.10 shows schematically the inlet – outlet connections of the gravity filter. Raw water en-
ters the filter through inlet port of channel above the filtration media. The filtrate exits the filter at
the bottom effluent port. Through this port the filtrate can be directed to the storage clear well or
send back to the head of the system in case that quality of filtrate is not within the limits. This port
also serves as an inlet port for the backwash water. The backwash water is usually collected through
backwash water troughs and sent through the dedicated outlet port to the backwash water storage
tank.
In gravity filters the filtration process is driven by hydrostatic level difference between water level
in the filter and water level in the clear well. These conditions are illustrated schematically in Figure
4.4.11.
If the level in the clear well is the same or higher than the level of the top surface of filter media
than the filtration driving head is regarded as positive driving head. If the level in the clear well is
below the level of the surface of top filtration layer, this difference of levels is designated as nega-
tive driving head. It is advisable that the positive driving head be as large as possible, as the pres-
ence of negative driving head could result if formation of vacuum and release of air in the filtration

Mark Wilf Ph. D.
Phone: +1 858 444 7334
RO Technology
E-mail: [email protected]
Webpage:www.rotechnology.net
89
bed. Some filtration systems are configured to relay only on a positive driving head for filter opera-
tion.
Driving
head
Filtrate Clearwell
Feed
Figure 4.4.11. Schematics of filtration driving head in the gravity filter.
The driving head determines the duration of the filtration run. It should be sufficiently high to com-
pensate for the flow resistance of clean filtration bed and additional friction loses due to solids ac-
cumulation.
In desalination applications, the gravity filters operate at constant flow rate during the filtration cy-
cle (the same way as pressure filters). The filtration rate is controlled by opening of the valve in-
stalled on the effluent line. The valve is initially partially closed and its opening is increased with
operating time. At the end of filtration cycle, determined by the filtration time, the filter is taken out
of operation, into a backwash step. In gravity filters the backwash step is usually longer than in
pressure filters. It is composed of number of steps and lasts 40 – 60 min.
The backwash steps include, partial draining of the filter, repeated segments of reverse filtrate flow,
air scouring, removal of backwash water and rinsing of the filter media. After quality of filtrate re-
turns to the specified values, the filter cell is returned to the regular operation cycle.

Mark Wilf Ph. D.
Phone: +1 858 444 7334
RO Technology
E-mail: [email protected]
Webpage:www.rotechnology.net
90
Example of design parameters of a gravity filter of nominal filtrate capacity of 100,000 m3/day is
provided in table 4.4.4.
Table 4.4.4. Design parameters of media filtration system utilizing gravity filters. System effluent
capacity 100,000 m3/day.
Net effluent system capacity m3/day 100,000
Number of filtration cells 10
Influent flow rate m3/hr 4,335
Suspended solids concentration ppm 5
Coagulant dosing rate ppm as Fe2(SO4)3 10
Nominal filtration rate m/hr 12.0
Total filtration area m2 356.9
Actual filtration rate m/hr 12.1
Filtration rate during backwash step m/hr 13.5
Filter cell with m 4.3
Filter cell length m 8.3
Filtration area per filter cell m2 35.7
Filter cell height m 6.0
Inlet/outlet pipe diameter m 0.23
Underdrain height m 0.40
Gravel layer depth m 0.25
Sand layer depth m 0.80
Anthracite layer depth m 1.20
Media expansion allowance m 0.68
Free board m 0.40

Mark Wilf Ph. D.
Phone: +1 858 444 7334
RO Technology
E-mail: [email protected]
Webpage:www.rotechnology.net
91
Media level relative to filter floor m 2.65
Filtration driving head m 3.35
Filter cell draining time min 10.00
Backwash # 1,duration min 6.0
Backwash # 1,flux m/hr 50.0
Backwash # 2,duration min 2.0
Backwash # 2,flux m/hr 50.0
Backwash # 3,duration min 2.0
Backwash # 3,flux m/hr 50.0
Air scouring, duration min 2.0
Air flow rate m/hr 50.0
Air volume per backwash m3 59.5
Media settling time min 10.0
Forward rinse min 15.0
Rinse water volume m3/backwash 107.1
Rinse volume per filtration cycle m3 1070.7
Total off line time min 60.0
Backwash water volume m3/backwash 297.4
Daily backwash volume m3/day 2974.2
Filtration interval hr 23.0
Filtrate volume per filtration cycle m3 104040.0
Nominal recovery rate % 96.1
Total gravel volume m3 89.2
Total Sand volume m3 285.5
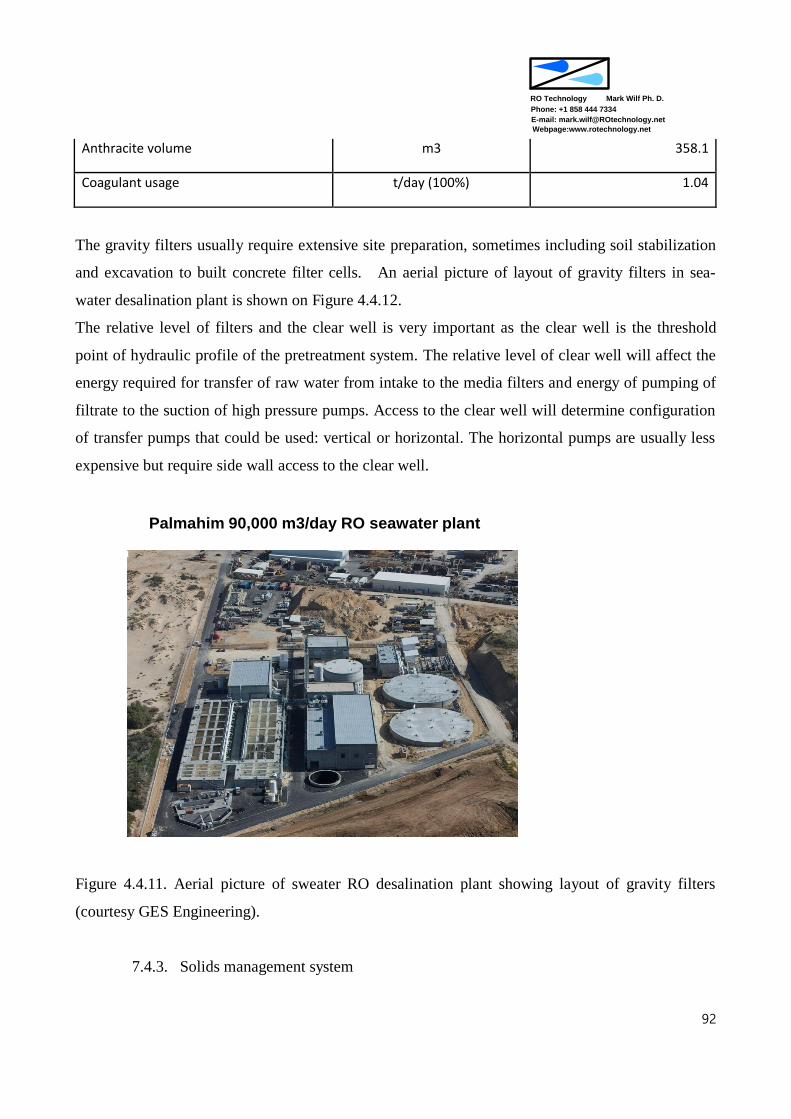
Mark Wilf Ph. D.
Phone: +1 858 444 7334
RO Technology
E-mail: [email protected]
Webpage:www.rotechnology.net
92
Anthracite volume m3 358.1
Coagulant usage t/day (100%) 1.04
The gravity filters usually require extensive site preparation, sometimes including soil stabilization
and excavation to built concrete filter cells. An aerial picture of layout of gravity filters in sea-
water desalination plant is shown on Figure 4.4.12.
The relative level of filters and the clear well is very important as the clear well is the threshold
point of hydraulic profile of the pretreatment system. The relative level of clear well will affect the
energy required for transfer of raw water from intake to the media filters and energy of pumping of
filtrate to the suction of high pressure pumps. Access to the clear well will determine configuration
of transfer pumps that could be used: vertical or horizontal. The horizontal pumps are usually less
expensive but require side wall access to the clear well.
Palmahim 90,000 m3/day RO seawater plant
Figure 4.4.11. Aerial picture of sweater RO desalination plant showing layout of gravity filters
(courtesy GES Engineering).
7.4.3. Solids management system

Mark Wilf Ph. D.
Phone: +1 858 444 7334
RO Technology
E-mail: [email protected]
Webpage:www.rotechnology.net
93
Almost all media filtration systems utilize coagulation process to improve capture efficiency of sus-
pended solids.
The solids together with coagulant are flushed from the filters during the backwash step. Due to
presence of metal coagulant (usually ferric hydroxide), the backwash stream can not be disposed
directly to the ocean. The backwash stream represents 3 – 10% of the volume of the influent to the
desalination system. The backwash stream contains about 0.01 – 0.05% concentration of solids.
Prior to disposal, dispersed solids have to be concentrated into sludge with solids concentration
above 20%. The concentration process includes solids thickening in a clarifier and dewatering in a
filter press. Figure 4.4.13 shows schematically the concentration and dewatering process of the
backwash stream.
Pumps
to RO
Backwash
pumps
Filtrate
Clear well
Filters backwash
water storage
Lamella
clarifiersBelt press
Polymer
dosing
Polymer
dosing
Figure 4.4.13. Schematic diagram of filtration system including solids management unit.
The backwash water is initially stored in the backwash water storage tank. From the storage tank it
is transfer to a clarifier. If necessary a polymer is added to this stream to improve settling of the sol-
ids. The upper clarified, fraction (overflow stream) from the clarifier is transfer back to the head of
the pretreatment system. The lower fraction, which is sludge of solids concentration of 0.5% – 1.5%
is transfer to the filter press. The press reduces water content in the sludge to less than 80%. The 20%
solids sludge can be disposed to the landfill. The effluent produced during press dewatering is re-
tuned to the backwash water storage tank.

Mark Wilf Ph. D.
Phone: +1 858 444 7334
RO Technology
E-mail: [email protected]
Webpage:www.rotechnology.net
94
The solids management system is essential part of modern pretreatment system based on media fil-
tration. It has to be design and sized to enable uninterrupted operation of the pretreatment system.
The sizing of the equipment also includes sufficient capacity of storage and transportation to the
landfill to account for periods when landfill is not operational (weekends and holidays).
An example of design parameters of solids management unit is provided in Table 4.4.5.
Table 4.4.5. Design parameters of solids management unit for a filtration system. Filtration system
capacity 100,000 m3/day
Net effluent filtration system capacity m3/day 100,000
Filtration system influent flow rate m3/hr 4,335
Suspended solids concentration in raw water ppm 5
Filter effluent coagulant dosing rate ppm as Fe2(SO4)3 10.0
Daily filter solids loading kg/day 1,076.8
Total filtration area m2 357.0
Backwash flux m/hr 50
Total duration of backwash flow min 10
Daily filter backwash volume m3 2,975
Solids concentration in the backwash flow % 0.036%
Operational volume of the filter backwash water equalization tank
m3 446
Operational capacity of the clarifier m3/hr 248
Clarifier sludge flow (@1% solids) m3/hr 4.5
Clarified effluent flow m3/hr 243.5
Daily sludge production (@20% solids) t/day 5.4
Filter press discharge liquid flow m3/hr 4.3
Filter press polymer dosing rate ppm 20
Filter press polymer usage kg/d (100%) 2.2
7.4.4. Pretreatment system design method
The pretreatment system design methods starts with evaluation of quality of raw water, follows by
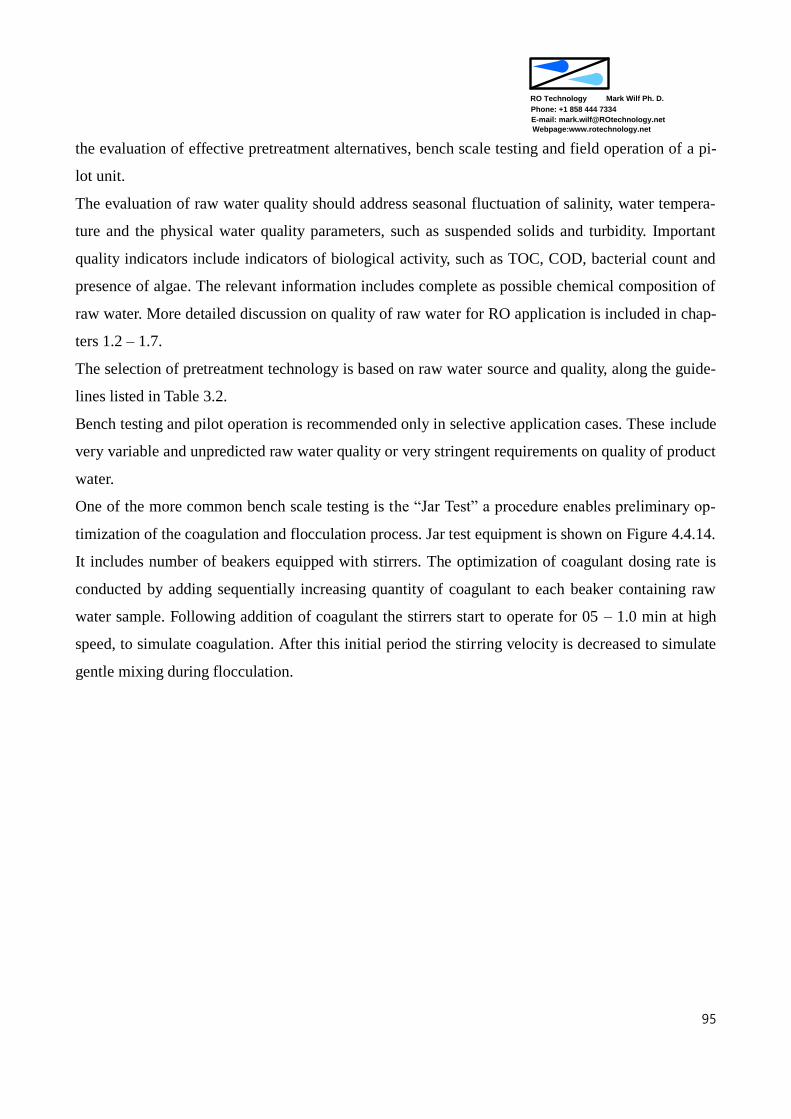
Mark Wilf Ph. D.
Phone: +1 858 444 7334
RO Technology
E-mail: [email protected]
Webpage:www.rotechnology.net
95
the evaluation of effective pretreatment alternatives, bench scale testing and field operation of a pi-
lot unit.
The evaluation of raw water quality should address seasonal fluctuation of salinity, water tempera-
ture and the physical water quality parameters, such as suspended solids and turbidity. Important
quality indicators include indicators of biological activity, such as TOC, COD, bacterial count and
presence of algae. The relevant information includes complete as possible chemical composition of
raw water. More detailed discussion on quality of raw water for RO application is included in chap-
ters 1.2 – 1.7.
The selection of pretreatment technology is based on raw water source and quality, along the guide-
lines listed in Table 3.2.
Bench testing and pilot operation is recommended only in selective application cases. These include
very variable and unpredicted raw water quality or very stringent requirements on quality of product
water.
One of the more common bench scale testing is the “Jar Test” a procedure enables preliminary op-
timization of the coagulation and flocculation process. Jar test equipment is shown on Figure 4.4.14.
It includes number of beakers equipped with stirrers. The optimization of coagulant dosing rate is
conducted by adding sequentially increasing quantity of coagulant to each beaker containing raw
water sample. Following addition of coagulant the stirrers start to operate for 05 – 1.0 min at high
speed, to simulate coagulation. After this initial period the stirring velocity is decreased to simulate
gentle mixing during flocculation.
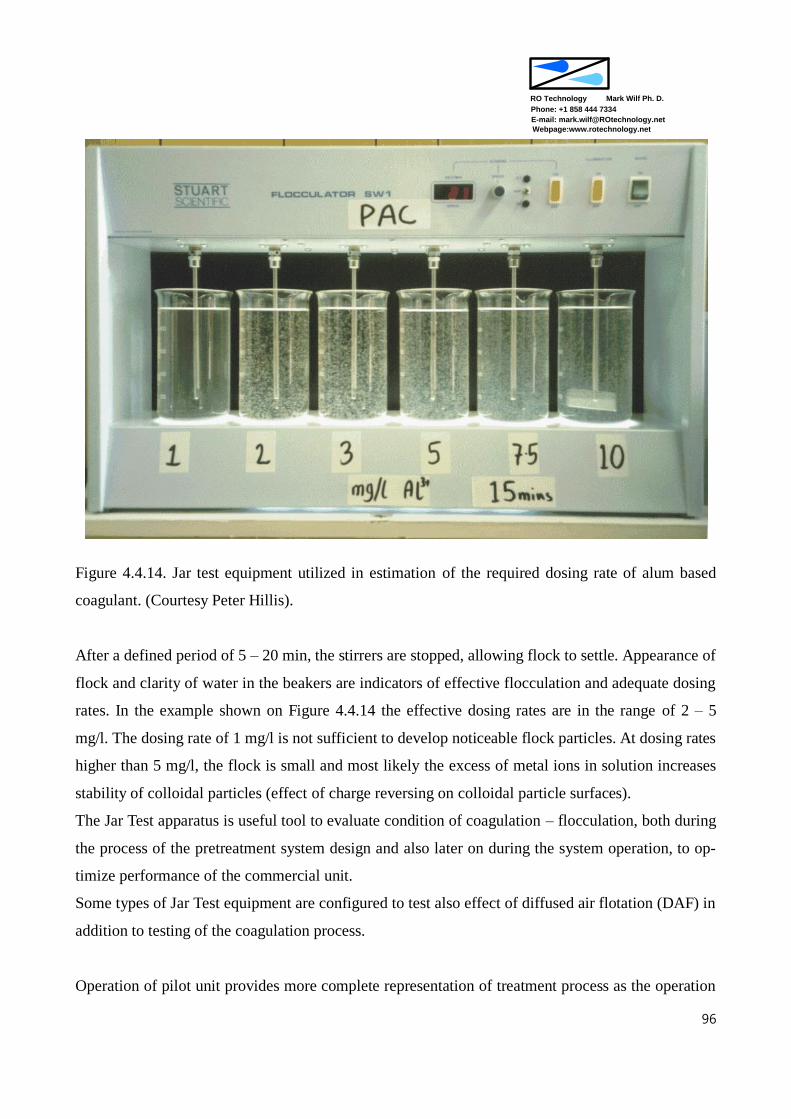
Mark Wilf Ph. D.
Phone: +1 858 444 7334
RO Technology
E-mail: [email protected]
Webpage:www.rotechnology.net
96
Figure 4.4.14. Jar test equipment utilized in estimation of the required dosing rate of alum based
coagulant. (Courtesy Peter Hillis).
After a defined period of 5 – 20 min, the stirrers are stopped, allowing flock to settle. Appearance of
flock and clarity of water in the beakers are indicators of effective flocculation and adequate dosing
rates. In the example shown on Figure 4.4.14 the effective dosing rates are in the range of 2 – 5
mg/l. The dosing rate of 1 mg/l is not sufficient to develop noticeable flock particles. At dosing rates
higher than 5 mg/l, the flock is small and most likely the excess of metal ions in solution increases
stability of colloidal particles (effect of charge reversing on colloidal particle surfaces).
The Jar Test apparatus is useful tool to evaluate condition of coagulation – flocculation, both during
the process of the pretreatment system design and also later on during the system operation, to op-
timize performance of the commercial unit.
Some types of Jar Test equipment are configured to test also effect of diffused air flotation (DAF) in
addition to testing of the coagulation process.
Operation of pilot unit provides more complete representation of treatment process as the operation
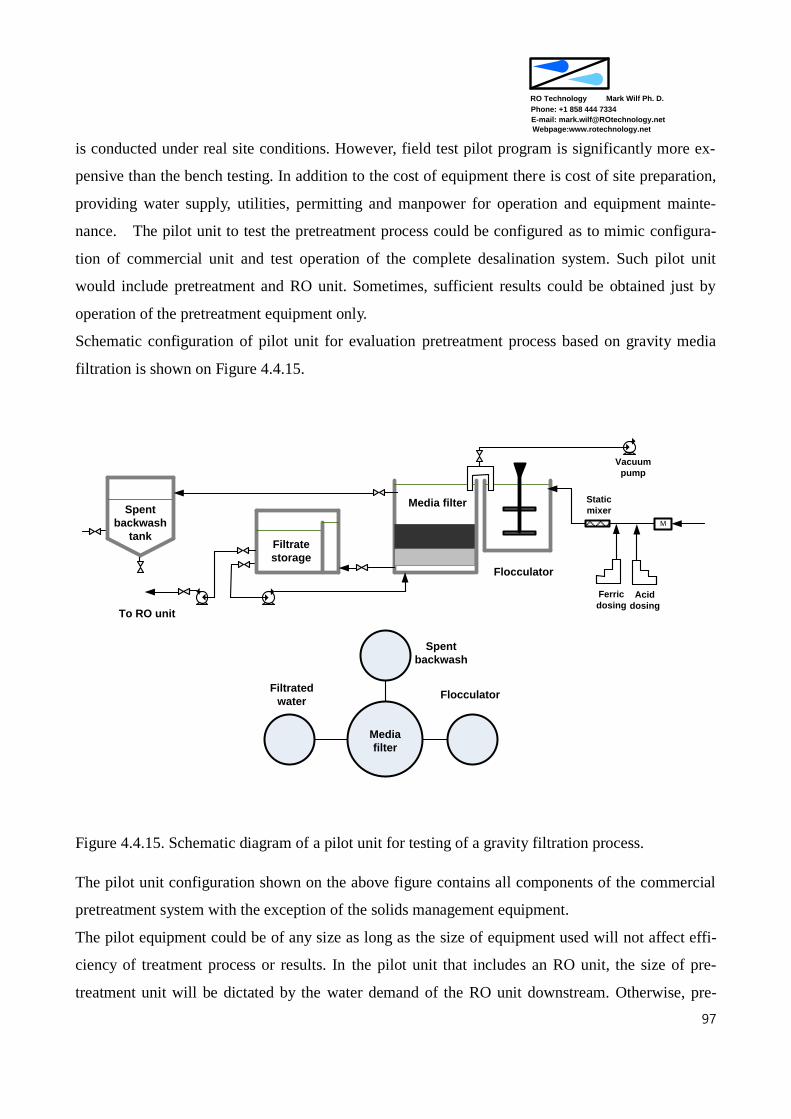
Mark Wilf Ph. D.
Phone: +1 858 444 7334
RO Technology
E-mail: [email protected]
Webpage:www.rotechnology.net
97
is conducted under real site conditions. However, field test pilot program is significantly more ex-
pensive than the bench testing. In addition to the cost of equipment there is cost of site preparation,
providing water supply, utilities, permitting and manpower for operation and equipment mainte-
nance. The pilot unit to test the pretreatment process could be configured as to mimic configura-
tion of commercial unit and test operation of the complete desalination system. Such pilot unit
would include pretreatment and RO unit. Sometimes, sufficient results could be obtained just by
operation of the pretreatment equipment only.
Schematic configuration of pilot unit for evaluation pretreatment process based on gravity media
filtration is shown on Figure 4.4.15.
Flocculator
Ferric
dosing Acid
dosing
Media filter Static
mixer
M
Vacuum
pump
Filtrate
storage
Spent
backwash
tank
To RO unit
Media
filter
FlocculatorFiltrated
water
Spent
backwash
Figure 4.4.15. Schematic diagram of a pilot unit for testing of a gravity filtration process.
The pilot unit configuration shown on the above figure contains all components of the commercial
pretreatment system with the exception of the solids management equipment.
The pilot equipment could be of any size as long as the size of equipment used will not affect effi-
ciency of treatment process or results. In the pilot unit that includes an RO unit, the size of pre-
treatment unit will be dictated by the water demand of the RO unit downstream. Otherwise, pre-
Mark Wilf Ph. D.
Phone: +1 858 444 7334
RO Technology
E-mail: [email protected]
Webpage:www.rotechnology.net
98
treatment pilot unit could be quite small. Small size pilot unit have advantage of being not only less
expensive to purchase but also more convenient to operate. It is advisable to operate pilot unit
though a complete cycle of raw water quality fluctuation to test the selected pretreatment process at
most adverse conditions at the future site of the commercial system.
The results of bench testing, and possibly pilot testing, are good source of information for pretreat-
ment system design. In case that commercial desalination system operated in vicinity of the future
system site, their configuration and operating parameters are good reference for the design process.
Also vendors of pretreatment equipment are good source reference information on configuration
and process parameters.
The number of possible pretreatment process alternatives has to be reduced to 2 – 3 options, which
should be evaluated in respect of required results of effluent quality, references, design difficulties
and capital and operating cost.
The evaluation process includes development of preliminary configuration, process and flow dia-
gram including process parameters (mass and flow balance) and general specification of major
equipment.
Once the pretreatment process has been selected, it is important to have alternative selection of ma-
jor equipment in order to arrive to a competitive prices of final system.
7.5. Cartridge filtration
The role of cartridge filters in RO system is mainly to protect equipment located downstream
(pumps and membrane elements) from sudden appearance of particulate matter in feed water. Such
conditions could be sometime experienced due to sudden sand or silt release from wells or from
sand filters (in system utilizing sand filters). Use of cartridge filters as a feed water filtration step for
colloidal matter removal is usually prohibitively expensive in respect of the cartridge replacement
cost.
Extensive field experience shows that RO systems treating well water, with cartridge filtration as
the only filtration step, operated successfully over the years. In some isolated cases that the plants of
this configuration experienced release of silt and/or sand from wells, and cartridge filters do not op-
erated properly, the particulate matter eventually ended up reaching membrane elements. In almost

Mark Wilf Ph. D.
Phone: +1 858 444 7334
RO Technology
E-mail: [email protected]
Webpage:www.rotechnology.net
99
all reported cases of such events, the solids intrusion and accumulation was limited to lead elements
only. This condition was eventually rectified by flushing of lead elements (in reverse flow direction,
after turning them around and moving to the end of the system) and replacing some of them.
Cartridge filters for RO applications have nominal porosity in the range of 5 – 15 micron. The pre-
ferred porosity rating of filtration cartridges is 5 micron. Feed water flow through cartridge filters
should not exceed 1 m3/hr per 25 cm of cartridge length. The schematic configuration of cartridge
filter housing is shown in Figure 4.4.16.
Max flow,m3/hr
Number of25 cm
cartridges
Diameter,cm
Height,cm
In-outdiameter,
cm
Weight,kg
3.5 3 33 70 5.0 57
7.0 6 38 70 5.0 82
27.0 24 38 130 7.5 100
86.0 76 60 150 10.0 200
CARTRIDGE FILTER CONFIGURATION
Figure 4.5.1. Schematic configuration of cartridge filtration unit.
In the above configuration the filtration cartridges are mounted in vertical position. In large capacity
plants horizontal cartridge filters (Figure 4.4.17) are sometimes being used.

Mark Wilf Ph. D.
Phone: +1 858 444 7334
RO Technology
E-mail: [email protected]
Webpage:www.rotechnology.net
100
Figure 4.5.2. Picture of horizontal housing of cartridge filter.
As shown in the above picture, the entry of the feed water is at the housing vessel wall and the exit
of filtrated water at the end of the vessel. The manual valves on the exit and entry are always in
completely open position, except for the events of cartridge replacement. The lid of the cartridge
vessel is mounted on hinge. This arrangement enables system operator to open the lid without need
of a lifting device, as it is necessary with vertical cartridge housing.
Horizontal cartridge housing in a process of cartridge replacement is shown on Figure 4.4.18.
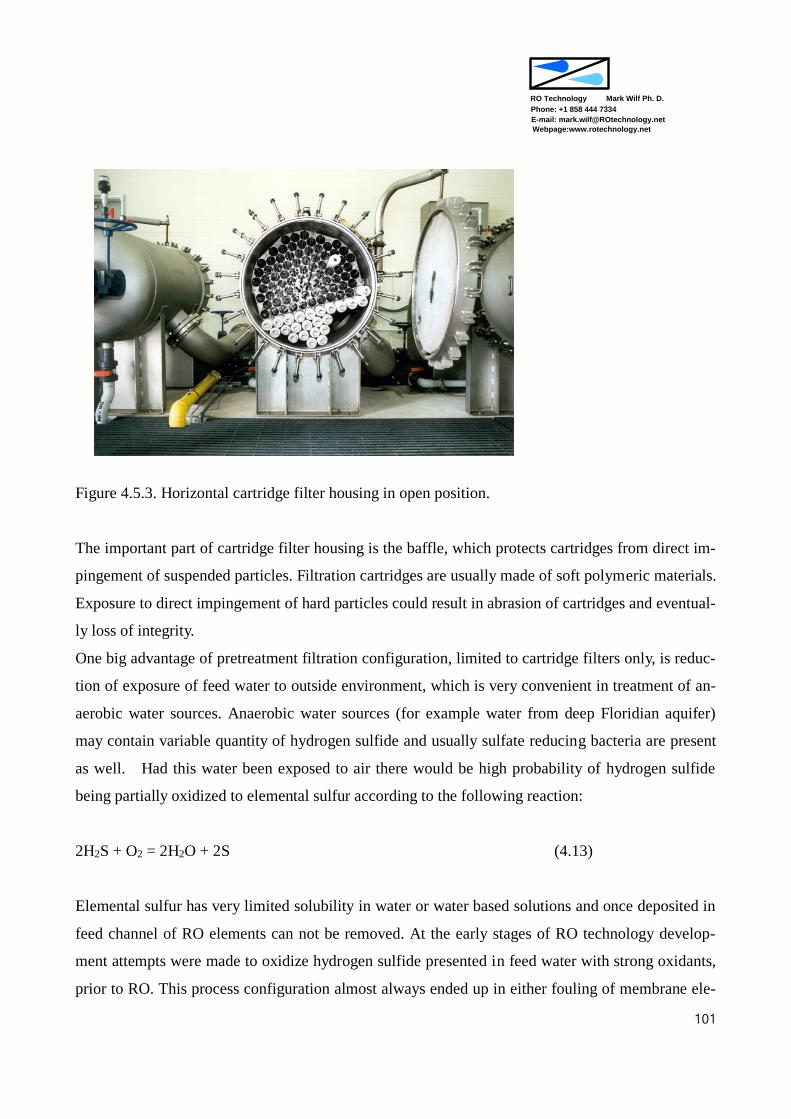
Mark Wilf Ph. D.
Phone: +1 858 444 7334
RO Technology
E-mail: [email protected]
Webpage:www.rotechnology.net
101
Figure 4.5.3. Horizontal cartridge filter housing in open position.
The important part of cartridge filter housing is the baffle, which protects cartridges from direct im-
pingement of suspended particles. Filtration cartridges are usually made of soft polymeric materials.
Exposure to direct impingement of hard particles could result in abrasion of cartridges and eventual-
ly loss of integrity.
One big advantage of pretreatment filtration configuration, limited to cartridge filters only, is reduc-
tion of exposure of feed water to outside environment, which is very convenient in treatment of an-
aerobic water sources. Anaerobic water sources (for example water from deep Floridian aquifer)
may contain variable quantity of hydrogen sulfide and usually sulfate reducing bacteria are present
as well. Had this water been exposed to air there would be high probability of hydrogen sulfide
being partially oxidized to elemental sulfur according to the following reaction:
2H2S + O2 = 2H2O + 2S (4.13)
Elemental sulfur has very limited solubility in water or water based solutions and once deposited in
feed channel of RO elements can not be removed. At the early stages of RO technology develop-
ment attempts were made to oxidize hydrogen sulfide presented in feed water with strong oxidants,
prior to RO. This process configuration almost always ended up in either fouling of membrane ele-

Mark Wilf Ph. D.
Phone: +1 858 444 7334
RO Technology
E-mail: [email protected]
Webpage:www.rotechnology.net
102
ments with elemental sulfur or in oxidative damage of membrane barrier. The design approach that
provides stable system performance is to maintain anaerobic conditions of the water through the RO
system. After the RO unit, hydrogen sulfide is removed from permeate (and sometimes from con-
centrate as well) either by aeration or oxidation. If location of the RO system is close to urban cen-
ters the degasifiers can not vent off gasses to the air. The common solution in case of hydrogen sul-
fide aeration is to follow degasifiers with an absorption system. In such a system hydrogen sulfide
is absorbed on an iron based catalyst and eventually disposed as a solid waste.
Recently some system designer introducing alternative equipment in place of cartridge filtration as
a safety filters. The new safety filters are 20 micron strainers of the same configuration as are being
used in protecting membrane filtration systems (Figure 4.1.2, Chapter 4.1). This equipment is
somewhat more expensive than the conventional cartridge filters, however, no cartridge replace-
ment is necessary. Therefore in systems that experience high rate of cartridge replacement, use of
this type of equipment could be cost effective.
7.6. Membrane pretreatment
Utilization of membrane pretreatment for RO applications is increasingly growing. In the RO sys-
tems, designed for salinity reduction of secondary treated municipal wastewater effluent, membrane
filtration is the most commonly used pretreatment technology. Also in systems treating waters for
industrial applications, either treatment of wastewater or production of process makeup water,
membrane filtration is quite frequently being applied. In RO systems treating surface water for po-
table applications, either brackish or seawater feed, membrane filtration is considered as an emerg-
ing technology, with great potential but still being usually more expensive than the conventional
pretreatment. The obvious benefit of membrane filtration is the existence of membrane barrier that
is preventing suspended particulate to pass through, regardless of the quality of the raw water.
However, membrane pretreatment systems are more complex than the “conventional” pretreatment
equipment and require more energy to operate.
In RO system treating secondary effluent, past application of conventional pretreatment resulted in
unacceptably high fouling rates of RO membranes. Application of membrane pretreatment, that
practically removed all colloidal matter from the feed water, improved dramatically stability of op-
eration of RO membranes in wastewater reclamation systems.
In RO systems treating surface water, well design conventional pretreatment is usually capable of
producing RO feed water of acceptable quality. However, in cases when quality of raw water is poor
Mark Wilf Ph. D.
Phone: +1 858 444 7334
RO Technology
E-mail: [email protected]
Webpage:www.rotechnology.net
103
with high degree of seasonal fluctuations, use of membrane pretreatment may improve stability of
performance of RO membranes and also be cost effective.
The membrane filtration technology that is used as pretreatment process in RO applications has the
following attributes:
1. The filtration process is conducted at low pressure, usually not exceeding 1 bar. Energy re-
quirement of this process is in the range of 0.05 – 0.15 kWhr/m3.
2. The filtration process is conducted through the membrane barrier that rejects all suspended
particles in the feed water.
3. Membranes are exclusively in a hollow fiber configuration.
4. The operation consists of sequence of steps. Filtration step, conducted at 100% recovery rate
(direct filtration), lasted 20 – 60 min. During the direct filtration step foulant layer is built on
the membrane surfaces, resulting in permeability decline.
5. The foulant deposits are removed and membrane permeability restored by reversing water
flow, i.e. pushing filtrate through the membrane in reverse direction for a short duration of
0.5 – 1 min.
6. This backwash step periodically includes addition of cleaning chemicals, mainly hypo-
chlorite, in a process called chemical enhanced backwash (CEB).
7. At variable frequency of once every few weeks or months, permeability restoration is con-
ducted by applying cleaning in place (CIP)
7.6.1. Configurations and components of membrane pretreatment system
The membrane filtration system could be either pressure driven or operating under vacuum. The
membrane unit in pressure driven system consists of encapsulated membrane modules and water is
driven through the membrane by feed pressure, developed by a feed pump or hydraulic head.
In vacuum driven membrane filtration system, membrane bundles, that form membrane modules,
are immersed in tanks. Water is driven through the membranes by negative pressure created by suc-
tion of filtrate pumps.
Block diagram of submersible membrane filtration system is shown in Figure 4.6.1. The difference
of configuration of pressure driven membrane filtration system is replacement of membrane tanks
with membrane racks and filtrate pumps with feed pumps as indicated in Figure 4.6.2..

Mark Wilf Ph. D.
Phone: +1 858 444 7334
RO Technology
E-mail: [email protected]
Webpage:www.rotechnology.net
104
Feed
pumpsStrainer
Static
mixerMembrane tanks
Filtrate
pumps
Filtrate
clearwell
Dosing
systems 1
Heat
exchanger
Backpulse
tank
Backpulse
pumps
Dosing
systems 3
Blowers
Compress
air
Cleaning and
neutralization
unit
Dosing
systems 2
Solids
handling
Vacuum
pumps
Electric
system
Control
system
Figure 4.6.1. Block diagram of submersible membrane filtration system
Feed
pumpsStrainer
Static
mixerMembrane racks
Filtrate
clearwell
Dosing
systems 1
Heat
exchanger
Backwash
tank
Backwash
pumps
Dosing
systems 3
Blowers
Compress
air
Cleaning and
neutralization
unit
Dosing
systems 2
Solids
handling
Electric
system
Control
system
Figure 4.6.2. Block diagram of pressure driven membrane filtration system
System components that are common to both membrane configurations are:
- Membrane units (racks or submersible trains)
- Micro strainers
- Cleaning chemicals storage and dosing units
- Feed pumps or filtrate pumps
- Blowers and/or compressors
- Membrane backwash unit
Mark Wilf Ph. D.
Phone: +1 858 444 7334
RO Technology
E-mail: [email protected]
Webpage:www.rotechnology.net
105
- Chemical cleaning and neutralization unit
- Filtrate storage and distribution unit.
- Solids management unit (if coagulant is being used)
- Electric power supply unit
- Process control unit
7.6.2. Settling and screening
Membrane filtration systems are very robust in respect of solids concentration in the feed water. The
quality of filtrate is very little affected by the variation of quality of the feed water. However, with
increased concentration of solids in the feed water the membrane system has to operate at lower fil-
trate flux rate and the filtration time between backwash steps is being reduced. These conditions
result in reduced filtrate flow rate and reduced recovery rate.
Therefore, if raw water turbity exceeds 20 – 30 NTU for significant period of time, it is more effec-
tive to include settling (clarification) unit ahead of membrane filtration unit. As indicated previously,
if suspended solids are of biological nature (algae) light particles, then use of DAF would be a more
effective solution than clarification through settling.
All filtration systems treating surface water include screens as safety measure to prevent large size
particles to reach membrane elements. For applications involving pressure drive membrane filtra-
tion technology, the screening devices are rated at 80 – 100mm.
The immersed, vacuum driven, technology can tolerate larger particle sizes than the pressure driven
systems. The opening size of screens used in submersible system could be as large as 0.5 – 2 mm,
depending on configuration of membrane module.
The sequence of operation of membrane filtration systems is fully automatic, controlled by PLC.
Therefore, the screening units used in membrane filtration systems are self cleaning, automatically
operated.
An example of screening device, used frequently in membrane filtration system is automatic filter
manufactured by Arcal, shown on Figure 4.6.3.
The filtration device consists of set of grooved discs held together by a clamp. Water is passing
through grooves between the discs. For membrane filtration applications the grooves opening size is
80 or 100 m. During filtration the trapped solids are accumulating in grooves between discs, in-
creasing flow resistance and the differential pressure. Once the differential pressure reaches the pre-
set limit, usually in the range of 0.3 bar, the filtration unit is disconnected from the effluent mani-
fold, clamping device holding the discs opens and the accumulated solid matter is flushed from the
filtration unit.

Mark Wilf Ph. D.
Phone: +1 858 444 7334
RO Technology
E-mail: [email protected]
Webpage:www.rotechnology.net
106
Figure 4.6.3. Microstrainer configuration offered by Arkal.
Configuration of a microstariner unit, based on Arkal equipment, that corresponds to system capaci-
ty of 200,000 m3/day is shown on Figures 4.6.4 and 4.65. Unit specifications are listed in Table
4.6.1.
Table 4.6.1. Specifications of microstariner unit. Output capacity 200,000 m3/day
Number of modules 4
Number of filters in module 12
Unit footprint 13.9 m X 10.1 m = 140.4 m2
Pressure loss during operation 0.015 – 0.30 bar
Backwash flow rate 960 m3/hr
Backwash duration 20 second
Backwash volume 43 m3/filtration cuycle
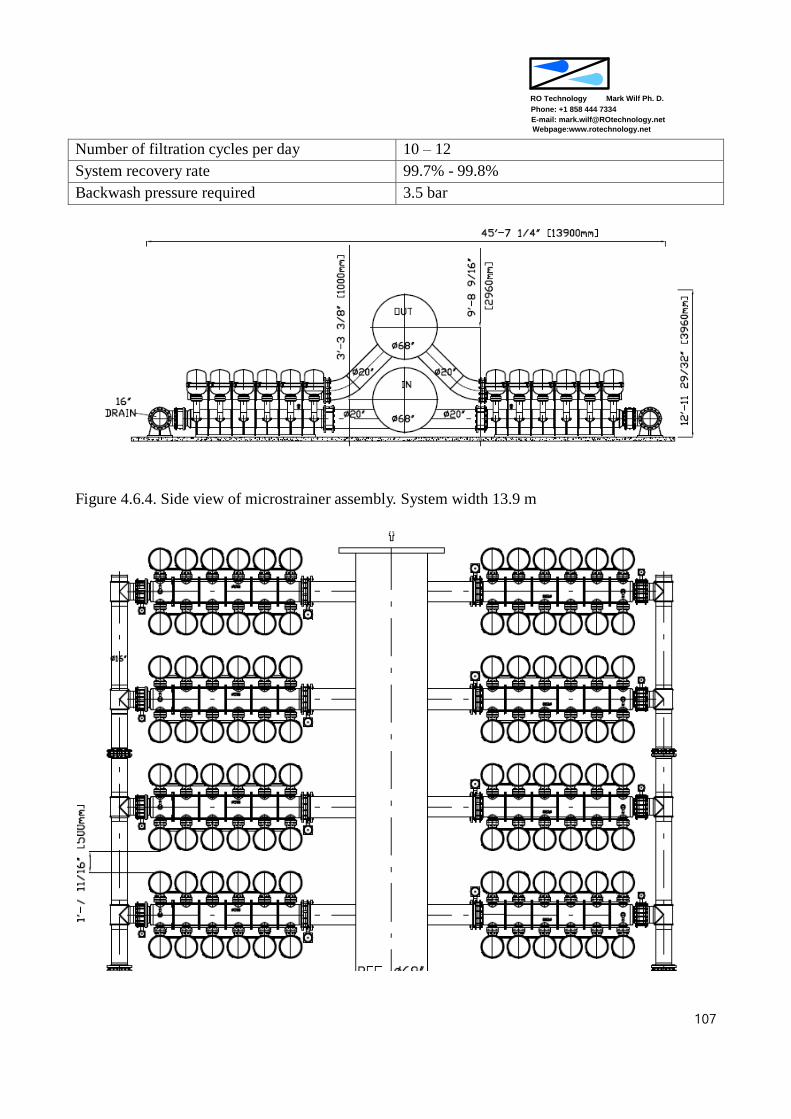
Mark Wilf Ph. D.
Phone: +1 858 444 7334
RO Technology
E-mail: [email protected]
Webpage:www.rotechnology.net
107
Number of filtration cycles per day 10 – 12
System recovery rate 99.7% - 99.8%
Backwash pressure required 3.5 bar
Figure 4.6.4. Side view of microstrainer assembly. System width 13.9 m
Mark Wilf Ph. D.
Phone: +1 858 444 7334
RO Technology
E-mail: [email protected]
Webpage:www.rotechnology.net
108
Figure 4.6.5. Top view of microstrainer assembly. System length 10.1 m
In addition to strainer configuration described above there are commercial strainers that utilize
screens in form of baskets or cylindrical cartridges.
One example of such a filter is strainer offered by Boll Filter Corporation. Schematics of system
with boll strainer is shown on Figure 4.6.6. The filter contains tubular filtration elements made from
wedged metal wires. Backwash is conducted by rotating arm that moves sequentially between filtra-
tion elements, disconnecting them from the effluent manifold and connecting to backwash discharge
line.
Majority of components of disc filter is made of polypropylene. The material of construction of
screen filters is mainly metal, which could be a reason of concern in operation in highly corrosive
environment.
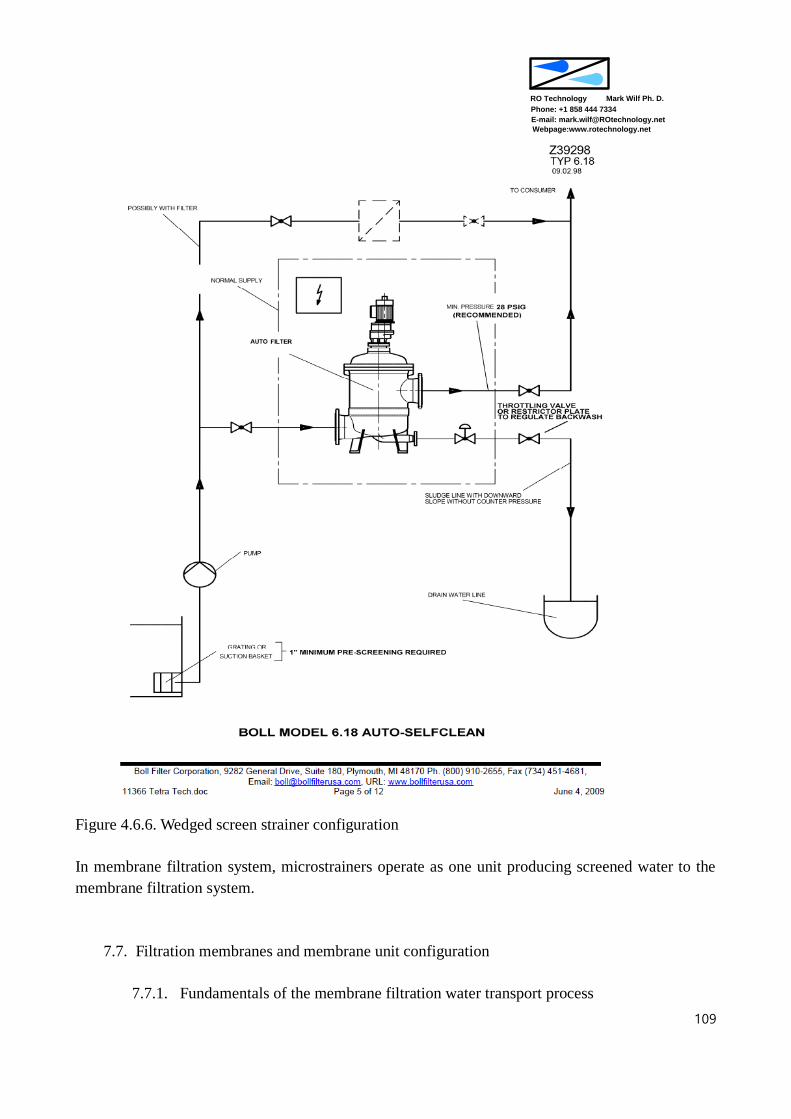
Mark Wilf Ph. D.
Phone: +1 858 444 7334
RO Technology
E-mail: [email protected]
Webpage:www.rotechnology.net
109
Figure 4.6.6. Wedged screen strainer configuration
In membrane filtration system, microstrainers operate as one unit producing screened water to the
membrane filtration system.
7.7. Filtration membranes and membrane unit configuration
7.7.1. Fundamentals of the membrane filtration water transport process

Mark Wilf Ph. D.
Phone: +1 858 444 7334
RO Technology
E-mail: [email protected]
Webpage:www.rotechnology.net
110
The water is driven through the membrane by difference of pressure between feed and permeate
sides of the filtration membrane.
The driving force is defined as trans membrane pressure (TMP) and it is calculated through the fol-
lowing equation:
TMP = (Pf + Pc)/2 – Pp (4.7.1)
Where Pf is feed pressure
Pc is concentrate pressure
Pp is permeate pressure
Accordingly, specific permeability, SP is calculated according to the following equation:
SP = Q/(Am * TMP) (4.7.2)
Where Q is instantaneous filtrate flow
Am is total membrane area in the system
Example of calculation of TMP and permeability for filtration membrane module is included in Ta-
ble 4.7.1.
As can be seen from the results displayed there is significant difference of TMP and SP values for
new membrane (ex-factory results) and for the membrane in operation at field conditions. At field
conditions the TMP is higher and water permeability significantly lower. The membrane filtration
devices operate at conditions of 100% recover rate (dead end operation). Therefore, during opera-
tion at field conditions the membrane surface is always fouled by deposits, which reduces the water
permeability rate.
The water permeability rate is affected by temperature. The effect of temperature on water permea-
bility is result of changes of water viscosity and changes of pore size of filtration membrane.
The effect of temperature on water permeability is expressed as temperature correction factor (TCF).
It is calculated by the following equation:
TCF = exp(-0.031*(T – 20))
Where T is water temperature expressed in C.
The reference temperature for calculation of TCF is 20 C.
Table 4.7.1. Example of the permeability results at ex-factory test and during field operation

Mark Wilf Ph. D.
Phone: +1 858 444 7334
RO Technology
E-mail: [email protected]
Webpage:www.rotechnology.net
111
Test parameter New membrane Field conditions
Pp, bar (psi) 0.25 (3.6) 0.70 (10.1)
Pc, bar (psi) 0.15 (2.2) 0.60 (8.5)
Pp, bar (psi) 0.10 (1.5) 0.15 (2.2)
TMP, bar (psi) 0.10 (1.5) 0.50 (7.2)
Q, l/hr (gpd) 3,500 (22,000) 5,100 (32,300)
Am, m2 (ft2) 46.5 (500) 46.5 (500)
SP, l/m2-hr (gfd/psi) 750 (29) 219 (8.9)
In graphic form changes of TCF are provided in Figure 4.7.1.
Figure 4.7.1. Temperature correction factor vs. water temperature
Temperature correction factor
0.0
0.5
1.0
1.5
2.0
0 5 10 15 20 25 30 35 40
Feed water temperature
TM
P C
orr
ecti
on
Facto
r

Mark Wilf Ph. D.
Phone: +1 858 444 7334
RO Technology
E-mail: [email protected]
Webpage:www.rotechnology.net
112
The membrane filtration represents almost absolute barrier to suspended particles. The filtration
spectrum, shown on Figure 4.7.2. indicates particles separation capability of different filtration
technologies. The figure shows distinct difference of projected particle separation sizes by utrafiltra-
tion (UF) and membrane filtration (MF). This is due to difference of pore sizes range of UF and MF
membranes. However, after short exposure to feed water a dynamic membrane is formed on the
membrane surfaces, making separation properties of UF and MF membranes quite similar.
um
A
RELATIVE
SIZE OF
COMMON
MATERIALS
MOLECULARWEIGHT
0.001
10
0.01
100
0.1
1000
1.0
10 4
10
10 5
100 1000
10 6 10 7
100 200 5,000 20,000 100,000 500,000
Aqueous salts
Metal ions
Sugars
FILTRATION
TECHNO-
LOGY
Pyrogens
Virus
Colloidal silica
Albumin protein
Bacteria
Carbon black Paint pigment
Yeast cells
Milled flour
Beach sand
Pollens
Reverse Osmosis and NF
Ultrafiltration
Microfiltration
Particle filtration
THE FILTRATION SPECTRUM
Figure 4.7.2. Separation size range of filtration technologies.
7.7.2. Membrane material and membrane configurations
The sequence of operation of UF and MF membranes require high durability of membranes and
membrane modules.
The important properties of membrane material are:
- Narrow pore distribution or sharp molecular weight cut off (MWCO)
- High polymer strength: elongation, high burst and collapse pressure
- Good polymer flexibility
- Permanent hydrophilic character
- Wide range of pH stability
- Good tolerance to strong oxidants
- Acceptable cost

Mark Wilf Ph. D.
Phone: +1 858 444 7334
RO Technology
E-mail: [email protected]
Webpage:www.rotechnology.net
113
There is no single membrane material that has all of the above properties. However, number of
membrane materials provide most of the listed properties and are preferred in commercial applica-
tions.
These are:
- PVDF (polyvinylidiene fluoride)
- PS (polysulfone)
- PES (polyether sulfone)
- PAN (polyacrilonitrile)
Majority of commercial membranes for filtration applications are made from the above listed poly-
mers.
Majority of membranes are configured as capillary devices. Very limited number of filtration mem-
branes is configured as flat sheet, plate and frame, or spiral modules.
The capillary membranes can operate as pressure driven or submersible, vacuum driven units.
In the pressure driven category there are two possible flow directions:
1. Feed water can be pumped through the lumen and filtrate collected outside the capillary: in-
side out operation (Figure 4.7.3 a), also called pressure driven inside (PDI).
2. Feed water can be applied under pressure outside the capillary and filtrate collected through
the capillary lumen: outside in operation (Figure 4.7.3 b) also called pressure driven outside
(PDO).
Figure 4.7.3. Filtrate flow direction in pressure drive capillary membranes: a – PDI, b - PDO.
According to flow directions through the membrane, the membrane elements are configured differ-
ently and operating parameters are different. The main difference are related to different size of ac-
tive membrane area per fiber length, difference of backwash flux rate and utilization of air scouring
for foulants removal.
Both PDI and PDO configurations are commercially viable technologies that provide comparable
a b

Mark Wilf Ph. D.
Phone: +1 858 444 7334
RO Technology
E-mail: [email protected]
Webpage:www.rotechnology.net
114
performance at field conditions at similar process economics.
The selection of a given filtration technology configuration for specific application is usually based
on the designer preferences.
The differences between membrane modules in these two flow configurations are listed in Table 4.7.
2.
Table 4.7.2. Attributes of PDI and PDO membranes configuration
Filtration direction Inside out Outside in
Designation PDI PDO
Membrane barrier On the lumen surface Outside fiber surface
Backwash flux rate 3 – 4 times forward flux 1.5 – 2 times forward flux
Air scouring No Yes
Advantages Barrier protected inside fiber High membrane area per mod-
ule
Advantages Sufficient backwash with fil-
trate only Reduced backwash volume re-
quired
Advantages Small volume of cleaning solu-
tion Small volume of cleaning solu-
tion
The other significant version of membrane filtration technology is the submersible, vacuum driven
process. In the submersible process the only practical water flow direction alternative is outside in
configuration.
In the past, the submersible technology has been used preferentially for high turbidity waters and
for large capacity systems. Today both the pressure driven and submersible, membrane filtration
technologies have converged in respect of performances and economics and they are competing for
the same markets and applications.
Summary of process attributes of pressure driven and submersible technologies are provided in Ta-
ble 4.7.3.
Table 4.7.3. Summary of process parameters of pressure driven and submersible technologies.
Pressurized Immersed
Treats low to medium feed turbidity Treats medium to high feed turbidity
Ability to compensate feed temperature fluctua-
tion in wide range Ability to compensate feed temperature fluctu-
ation in narrow range

Mark Wilf Ph. D.
Phone: +1 858 444 7334
RO Technology
E-mail: [email protected]
Webpage:www.rotechnology.net
115
Can operate at high flux rates Flux rate limited by available TMP
Limited ability to treat high turbidity water Limited ability to treat high turbidity water
Small footprint Larger footprint
Cost effective in small to medium capacity sys-
tems Cost effective in medium to large capacity sys-
tems
Small volume of cleaning solution Larger volume of cleaning solution
Suitable for prefabricated systems Can retrofit gravity filters
7.7.3. Membrane filtration process
The membrane filtration process operates in a stepwise manner. The sequence of operation depends
somewhat on type of technology: pressure driven or immersed.
7.7.3.1. Pressure driven technology.
The sequence of operation of pressure driven technology includes:
- Filtration
- Forward flush
- Backwash
- Chemical enhanced backwash (CEB)
- Air scouring (for PDO only)
- Cleaning in place (CIP)
The operation sequence starts with a filtration step, usually conducted in a direct flow mode (also
called dead end filtration), i.e. operation at 100% recovery. This step is shown schematically on
Figure 4.7.4.

Mark Wilf Ph. D.
Phone: +1 858 444 7334
RO Technology
E-mail: [email protected]
Webpage:www.rotechnology.net
116
Figure 4.7.4. Filtration step – direct flow mode of operation
The filtration step lasts between 30 – 60 min. During the direct flow step, membrane surface is be-
ing covered with particles. The water permeability declines, requiring increase of the feed pressure
in order to maintain the design filtrate flow rate.
The next step that follows is restoration of permeability of the membrane. This is accomplished
through removal of foulants that accumulated on the membrane surfaces by applying backwash of
the membrane module. In the backwash step, filtrate is pushed in reverse direction, through the
membrane to dislodge foulant form membrane surfaces and remove them from the membrane filtra-
tion modules. The backwash step may include application of air scouring or addition of chemicals
to increase efficiency of foulants removal. The chemical most frequently used during chemical en-
hanced backwash (CEB) step is hypochlorite added together filtrate backwash flow. Depending on
quality of feed water, usually the CEB is conducted once to few times per day.
Schematics of backwash step, including listing of process parameters is shown on Figure 4.7.5.
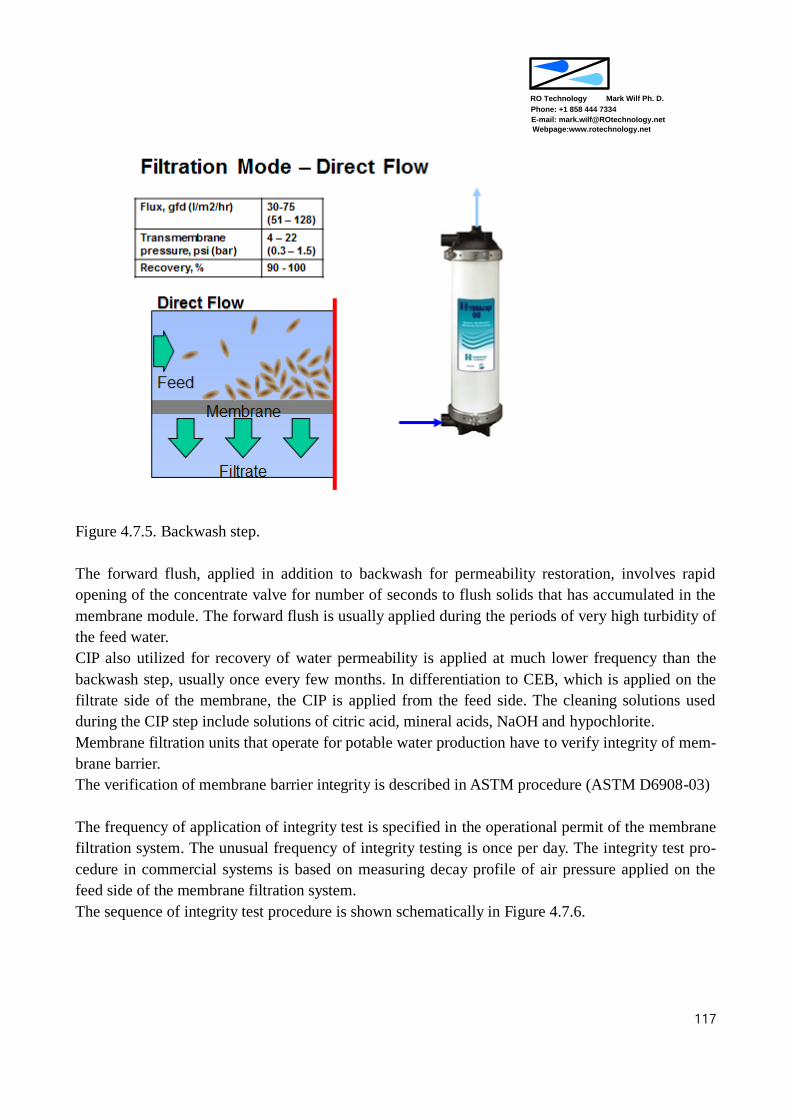
Mark Wilf Ph. D.
Phone: +1 858 444 7334
RO Technology
E-mail: [email protected]
Webpage:www.rotechnology.net
117
Figure 4.7.5. Backwash step.
The forward flush, applied in addition to backwash for permeability restoration, involves rapid
opening of the concentrate valve for number of seconds to flush solids that has accumulated in the
membrane module. The forward flush is usually applied during the periods of very high turbidity of
the feed water.
CIP also utilized for recovery of water permeability is applied at much lower frequency than the
backwash step, usually once every few months. In differentiation to CEB, which is applied on the
filtrate side of the membrane, the CIP is applied from the feed side. The cleaning solutions used
during the CIP step include solutions of citric acid, mineral acids, NaOH and hypochlorite.
Membrane filtration units that operate for potable water production have to verify integrity of mem-
brane barrier.
The verification of membrane barrier integrity is described in ASTM procedure (ASTM D6908-03)
The frequency of application of integrity test is specified in the operational permit of the membrane
filtration system. The unusual frequency of integrity testing is once per day. The integrity test pro-
cedure in commercial systems is based on measuring decay profile of air pressure applied on the
feed side of the membrane filtration system.
The sequence of integrity test procedure is shown schematically in Figure 4.7.6.

Mark Wilf Ph. D.
Phone: +1 858 444 7334
RO Technology
E-mail: [email protected]
Webpage:www.rotechnology.net
118
Figure 4.7.6. Integrity test sequence.
The integrity is calculated through determination of pressure decay rate (PDR) according to equa-
tion below
PDR = (Pi-Pf)/t
Where Pi – initial pressure
Pf – final pressure
t – time interval
PDR = PDR (measured) – rate of diffusion
Vacuum decay rate (VDR)
VDR = VDR (measured) – rate of diffusion
During determination of PDR, the rate of pressure decline due to diffusion of pressurized air
through water filled pores should be subtracted from the total measured PDR. The pressure decline
due to air diffusion is function of membrane surface. Therefore, the number of membrane modules
that could be tested for integrity as a one unit is limited by this phenomenon.
In majority of commercial systems the integrity test is conducted automatically, controlled by PLC,
which also automatically evaluates the results and displays warnings if the test results are outside
the range of sufficient membrane integrity.
7.7.3.1.1. Configuration of pressure driven membrane filtration unit
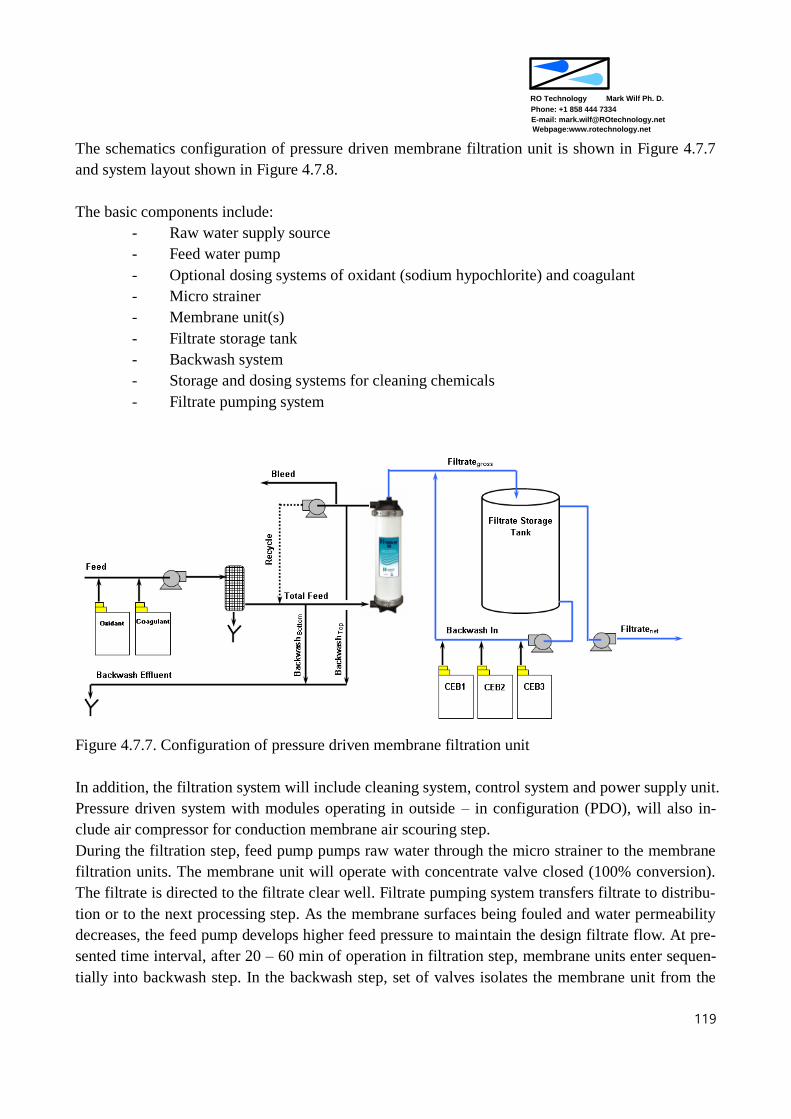
Mark Wilf Ph. D.
Phone: +1 858 444 7334
RO Technology
E-mail: [email protected]
Webpage:www.rotechnology.net
119
The schematics configuration of pressure driven membrane filtration unit is shown in Figure 4.7.7
and system layout shown in Figure 4.7.8.
The basic components include:
- Raw water supply source
- Feed water pump
- Optional dosing systems of oxidant (sodium hypochlorite) and coagulant
- Micro strainer
- Membrane unit(s)
- Filtrate storage tank
- Backwash system
- Storage and dosing systems for cleaning chemicals
- Filtrate pumping system
Figure 4.7.7. Configuration of pressure driven membrane filtration unit
In addition, the filtration system will include cleaning system, control system and power supply unit.
Pressure driven system with modules operating in outside – in configuration (PDO), will also in-
clude air compressor for conduction membrane air scouring step.
During the filtration step, feed pump pumps raw water through the micro strainer to the membrane
filtration units. The membrane unit will operate with concentrate valve closed (100% conversion).
The filtrate is directed to the filtrate clear well. Filtrate pumping system transfers filtrate to distribu-
tion or to the next processing step. As the membrane surfaces being fouled and water permeability
decreases, the feed pump develops higher feed pressure to maintain the design filtrate flow. At pre-
sented time interval, after 20 – 60 min of operation in filtration step, membrane units enter sequen-
tially into backwash step. In the backwash step, set of valves isolates the membrane unit from the
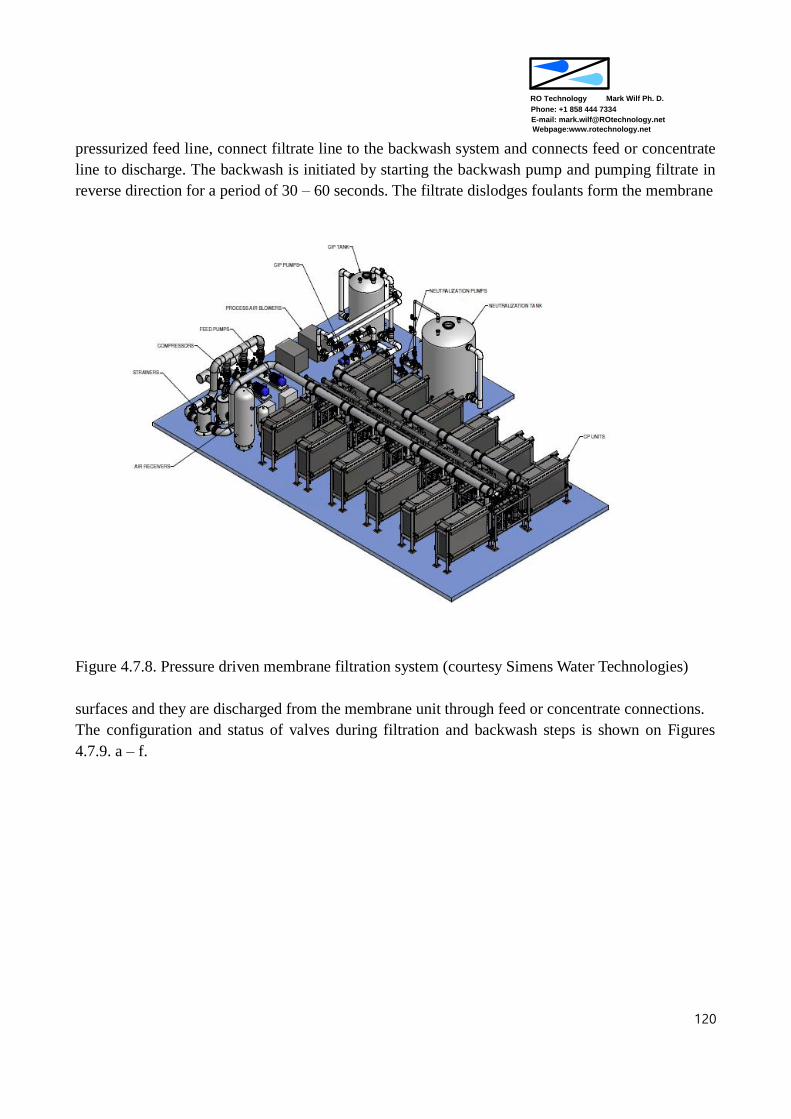
Mark Wilf Ph. D.
Phone: +1 858 444 7334
RO Technology
E-mail: [email protected]
Webpage:www.rotechnology.net
120
pressurized feed line, connect filtrate line to the backwash system and connects feed or concentrate
line to discharge. The backwash is initiated by starting the backwash pump and pumping filtrate in
reverse direction for a period of 30 – 60 seconds. The filtrate dislodges foulants form the membrane
Figure 4.7.8. Pressure driven membrane filtration system (courtesy Simens Water Technologies)
surfaces and they are discharged from the membrane unit through feed or concentrate connections.
The configuration and status of valves during filtration and backwash steps is shown on Figures
4.7.9. a – f.

Mark Wilf Ph. D.
Phone: +1 858 444 7334
RO Technology
E-mail: [email protected]
Webpage:www.rotechnology.net
121
Figure 4.7.9. a. Valves position during filtration step
Valves During Backwash - Top
Figure 4.7.9. b. Valves position during backwash step
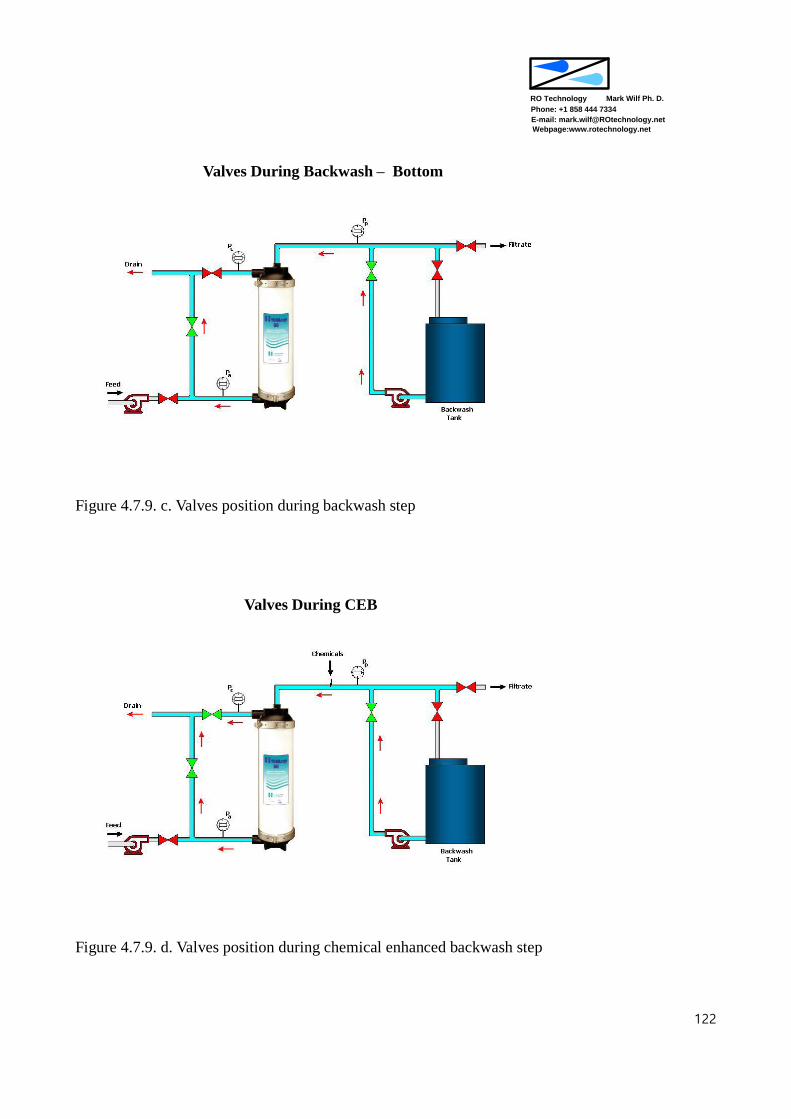
Mark Wilf Ph. D.
Phone: +1 858 444 7334
RO Technology
E-mail: [email protected]
Webpage:www.rotechnology.net
122
Valves During Backwash – Bottom
Figure 4.7.9. c. Valves position during backwash step
Valves During CEB
Figure 4.7.9. d. Valves position during chemical enhanced backwash step
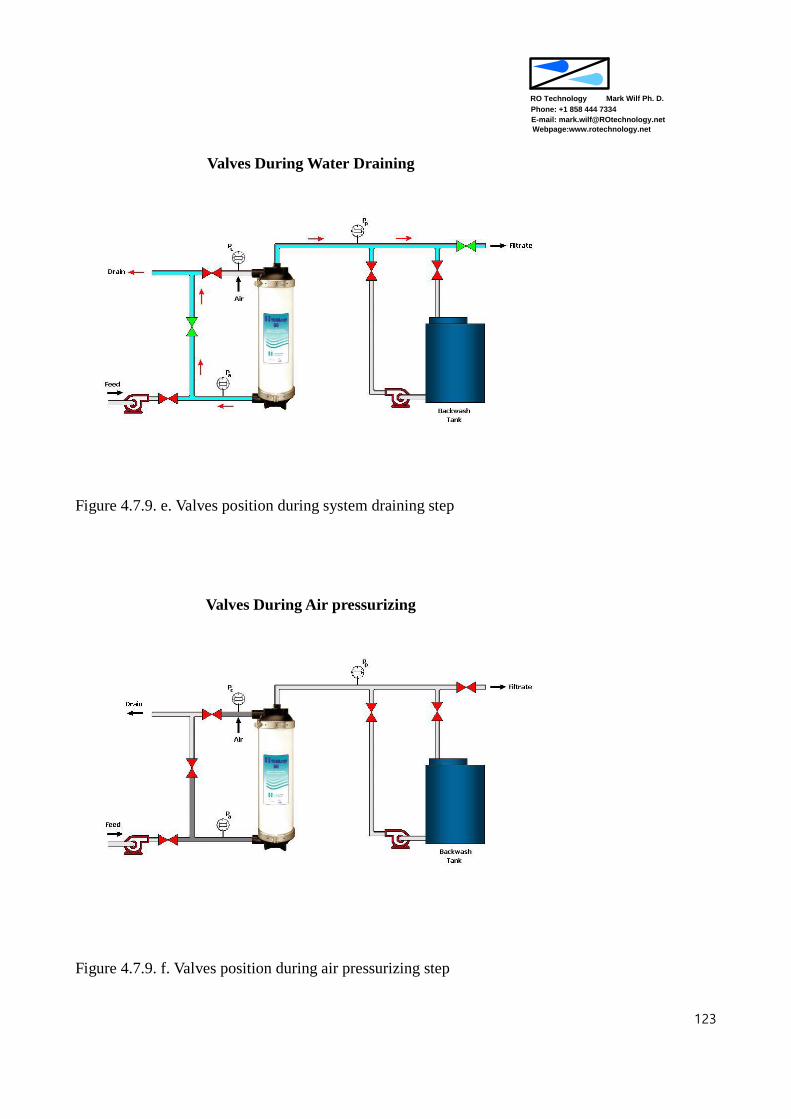
Mark Wilf Ph. D.
Phone: +1 858 444 7334
RO Technology
E-mail: [email protected]
Webpage:www.rotechnology.net
123
Valves During Water Draining
Figure 4.7.9. e. Valves position during system draining step
Valves During Air pressurizing
Figure 4.7.9. f. Valves position during air pressurizing step

Mark Wilf Ph. D.
Phone: +1 858 444 7334
RO Technology
E-mail: [email protected]
Webpage:www.rotechnology.net
124
The air pressurizing step is utilized by one of the manufacturer of pressure driven membrane mod-
ules (Hydranautics – PDI configuration) to increase effectiveness of filtrate backwash step. It is
called air enhanced backwash (AEB). During the AEB air is introduced on the feed side of the
membrane to drive off feed water from the module. At this conditions, the filtrate backwash that
follows, flows against empty feed volume, therefore at higher flow velocity resulting in better re-
moval of deposits from membrane surface.
Another manufacturer of pressure driven membrane modules (Siemens – PDO configuration) ap-
plies both air scouring and compressed air to drive filtrate back through the membranes.
The process steps during the backwash follows the schedule listed in Table 4.7.4.
Table 4.7.4. Air assisted backwash of the pressurized (PDI) membrane filtration system
Step 1 Normal filtration The unit is in filtration, the feed control valve is open.
Step 2 Drain to back-
wash level
Filtration stops. The unit drain valve is opened and water is
drained from the unit until the backwash level is reached.
Step 3 Aeration and liq-
uid backwash
Low pressure air enters the shell side to provide air scouring
to remove solids from the membrane fibers. The flow meter
on the discharge of the blower is used to monitor the back-
wash air scour flow. Compressed air pushes the filtrate in the
lumen side to the shell side of the fibers, thus achieving liquid
backwash.
Step 4 Post aeration Air scouring continues after the liquid backwash ends. The
lumen side remains pressurized with the compressed air.
Step 5 Shell draining The top shell side of the fibers is vented, while the lower
backwash discharge valve is opened. The backwash waste
drains under the influence of gravity out of the array. Site hy-
draulics should be such that shell draindown can be achieved
in 45 seconds.
Step 6 Shell fill - flush Feed enters the shell side via the lower feed manifold and ex-
its the unit via top backwash discharge valves.
Step 7 Resume to filtra-
tion ready status
Feed continues to enter the shell side via the lower feed mani-
fold, however the top backwash discharge valve is closed and
the filtrate exhaust valve is opened. This forces water into
the fibers. Once the unit is refilled with feed water, the unit
returns to filtration (or enters STANDBY).
7.7.3.1.2. Sizing of pressure driven membrane filtration unit
The sizing of membrane filtration unit consist of:

Mark Wilf Ph. D.
Phone: +1 858 444 7334
RO Technology
E-mail: [email protected]
Webpage:www.rotechnology.net
125
- Determination of process parameters (filtration flux, backwash flux)
- Defining duration of operating steps.
- Calculation of time allocation for each process step
- Calculation of gross filtrate capacity and membrane area required
- Defining membrane train size and number of membrane trains
An example of operational sequence in pressure driven membrane unit is provided in Table 4.7.5.
The values of duration and frequency of operational steps are provided as a range. The actual value
selected for design will depend on quality of raw water or previous experience of similar operation.
Table 4.7.5. Sequence of operation of pressure driven membrane filtration unit.
Process step Objective Duration Frequency
Forward flow Permeate production 15 – 60 min Continuous
Backwash Foulants removals 30 – 60 sec Every 15 – 60 min
Chemicals enhanced
backwash (CEB)
Foulanlts removal 1 – 15 min Once – twice a day
Cleaning in place Foulants removal 2 – 4 hr Every 1 – 6 months
Integrity test Verification of mem-
brane integrity
20 min Every 1 – 7 days
Example of water quality parameters of surface water source is provided in Table 4.7.6.
Table 4.7.6. Water quality parameters of surface water source
Parameter Value
Turbidity, NTU 0.5 – 5
Total suspended solids, ppm 2 – 5
Water temperature, C 2 - 25
An example of filtrate flux and schedule of operating sequence for membrane filtration system
treating surface water of quality parameters listed in Table 4.7.6 is provided in Table 4.7.7.
Defining of operational schedule allows calculation what fraction of the operating time the mem-
brane system is on line, producing filtrate. It is evident that the filtrate capacity of the unit should be
planned to provide design output and to produce sufficient filtrate for backwash and cleaning.
Table 4.7.7. Example of operational parameters and schedule of pressurized membrane filtration
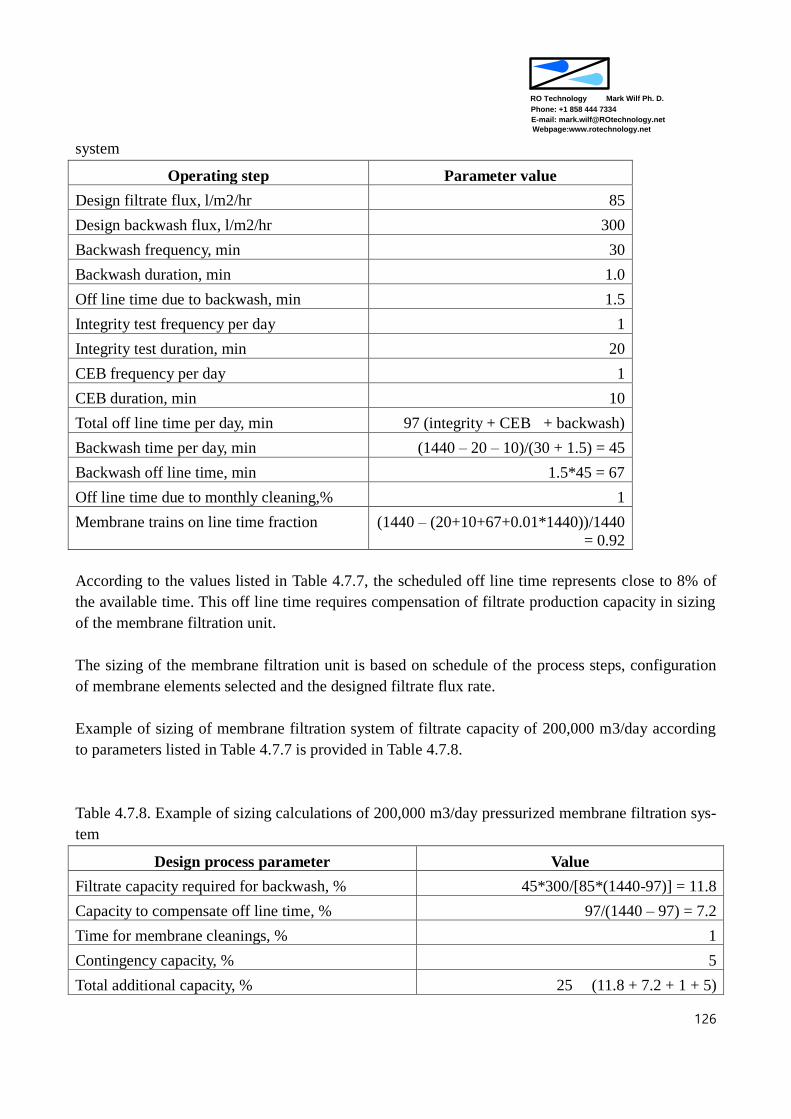
Mark Wilf Ph. D.
Phone: +1 858 444 7334
RO Technology
E-mail: [email protected]
Webpage:www.rotechnology.net
126
system
Operating step Parameter value
Design filtrate flux, l/m2/hr 85
Design backwash flux, l/m2/hr 300
Backwash frequency, min 30
Backwash duration, min 1.0
Off line time due to backwash, min 1.5
Integrity test frequency per day 1
Integrity test duration, min 20
CEB frequency per day 1
CEB duration, min 10
Total off line time per day, min 97 (integrity + CEB + backwash)
Backwash time per day, min (1440 – 20 – 10)/(30 + 1.5) = 45
Backwash off line time, min 1.5*45 = 67
Off line time due to monthly cleaning,% 1
Membrane trains on line time fraction (1440 – (20+10+67+0.01*1440))/1440
= 0.92
According to the values listed in Table 4.7.7, the scheduled off line time represents close to 8% of
the available time. This off line time requires compensation of filtrate production capacity in sizing
of the membrane filtration unit.
The sizing of the membrane filtration unit is based on schedule of the process steps, configuration
of membrane elements selected and the designed filtrate flux rate.
Example of sizing of membrane filtration system of filtrate capacity of 200,000 m3/day according
to parameters listed in Table 4.7.7 is provided in Table 4.7.8.
Table 4.7.8. Example of sizing calculations of 200,000 m3/day pressurized membrane filtration sys-
tem
Design process parameter Value
Filtrate capacity required for backwash, % 45*300/[85*(1440-97)] = 11.8
Capacity to compensate off line time, % 97/(1440 – 97) = 7.2
Time for membrane cleanings, % 1
Contingency capacity, % 5
Total additional capacity, % 25 (11.8 + 7.2 + 1 + 5)
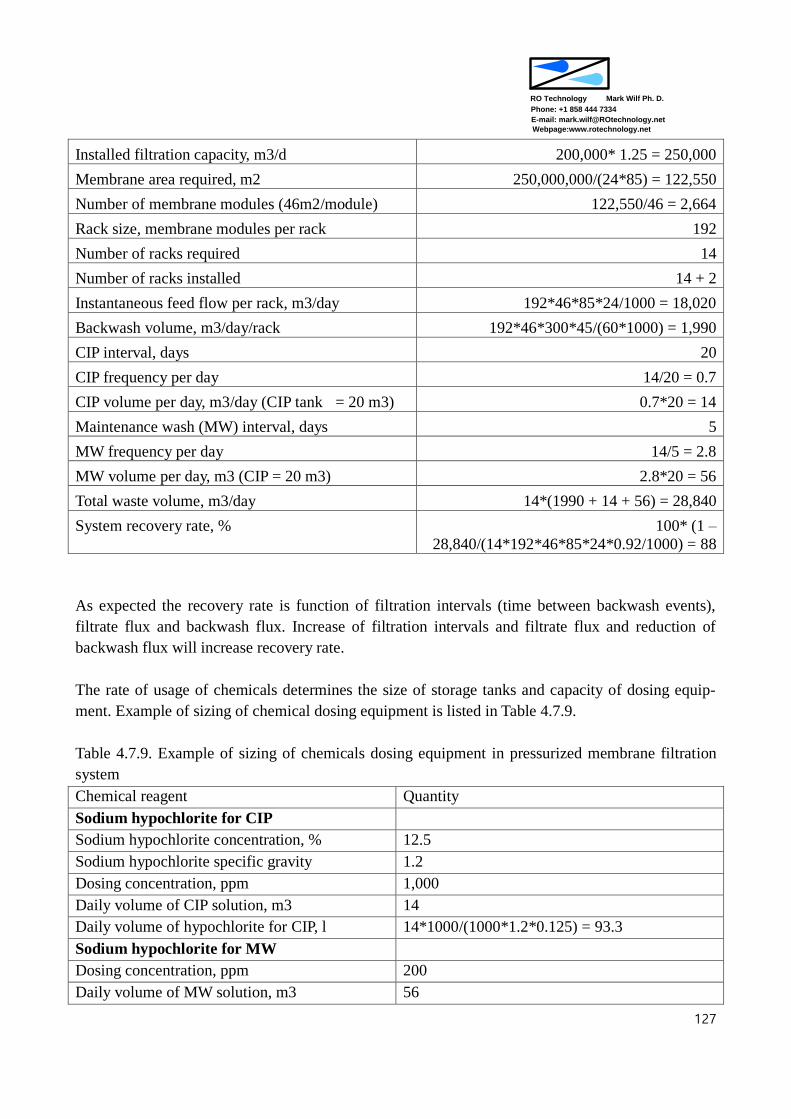
Mark Wilf Ph. D.
Phone: +1 858 444 7334
RO Technology
E-mail: [email protected]
Webpage:www.rotechnology.net
127
Installed filtration capacity, m3/d 200,000* 1.25 = 250,000
Membrane area required, m2 250,000,000/(24*85) = 122,550
Number of membrane modules (46m2/module) 122,550/46 = 2,664
Rack size, membrane modules per rack 192
Number of racks required 14
Number of racks installed 14 + 2
Instantaneous feed flow per rack, m3/day 192*46*85*24/1000 = 18,020
Backwash volume, m3/day/rack 192*46*300*45/(60*1000) = 1,990
CIP interval, days 20
CIP frequency per day 14/20 = 0.7
CIP volume per day, m3/day (CIP tank = 20 m3) 0.7*20 = 14
Maintenance wash (MW) interval, days 5
MW frequency per day 14/5 = 2.8
MW volume per day, m3 (CIP = 20 m3) 2.8*20 = 56
Total waste volume, m3/day 14*(1990 + 14 + 56) = 28,840
System recovery rate, % 100* (1 –
28,840/(14*192*46*85*24*0.92/1000) = 88
As expected the recovery rate is function of filtration intervals (time between backwash events),
filtrate flux and backwash flux. Increase of filtration intervals and filtrate flux and reduction of
backwash flux will increase recovery rate.
The rate of usage of chemicals determines the size of storage tanks and capacity of dosing equip-
ment. Example of sizing of chemical dosing equipment is listed in Table 4.7.9.
Table 4.7.9. Example of sizing of chemicals dosing equipment in pressurized membrane filtration
system
Chemical reagent Quantity
Sodium hypochlorite for CIP
Sodium hypochlorite concentration, % 12.5
Sodium hypochlorite specific gravity 1.2
Dosing concentration, ppm 1,000
Daily volume of CIP solution, m3 14
Daily volume of hypochlorite for CIP, l 14*1000/(1000*1.2*0.125) = 93.3
Sodium hypochlorite for MW
Dosing concentration, ppm 200
Daily volume of MW solution, m3 56

Mark Wilf Ph. D.
Phone: +1 858 444 7334
RO Technology
E-mail: [email protected]
Webpage:www.rotechnology.net
128
Daily volume of hypochlorite for MW, l 56*200/(1000*1.2*0.125) = 75.7
Total volume of hypochlorite, l/day 169
Storage volume of hypochlorite for 30 days, m3 ~ 5.0
Citric acid for CIP
Citric acid concentration, % 50
Citric acid specific gravity 1.25
Dosing concentration, ppm 20,000
Daily volume of citric acid, l 14*20000/(1000*1.25*0.5) = 448
Storage volume of citric acid for 30 days, m3 ~ 14.0
Sodium hydroxide for CIP
Sodium hydroxide concentration, % 40
Sodium hydroxide specific gravity 1.2
Dosing concentration, ppm 1,000
Daily volume of sodium hydroxide, l 14*1000/(1000*1.2*0.4) = 29
Storage volume of citric acid for 30 days, m3 ~ 1.0
The system will be composed of subunits providing functional operational capability according to
listing in Table 4.7.10.
Table 4.7.10. Listing of subunits and major equipment in pressurized membrane filtration system
Equipment Quantity Sizes/comments
Feed water system
Centrifugal, end suction pumps 16 800 m3/hr, 3 bar, VFD con-
trolled motor
Automatic backwashing strainer 16 800 m3/hr
Instrumentation Lot Turbiditymeter, pressure indi-
cators and transmitters, temper-
ature transmitter
Valves Lot Manual, butterfly
Membrane unit
Trains frame and piping 16 Corrosion protection coating
Membrane modules 3,072 46 m2/element
Set of automatic valves 16 lots Inlet, outlet, waste discharge,
air release
Instrumentation 16 lots Magnetic flow meters, turbidi-
tymeter, pressure indicators and
transmitters
Chemical cleaning system
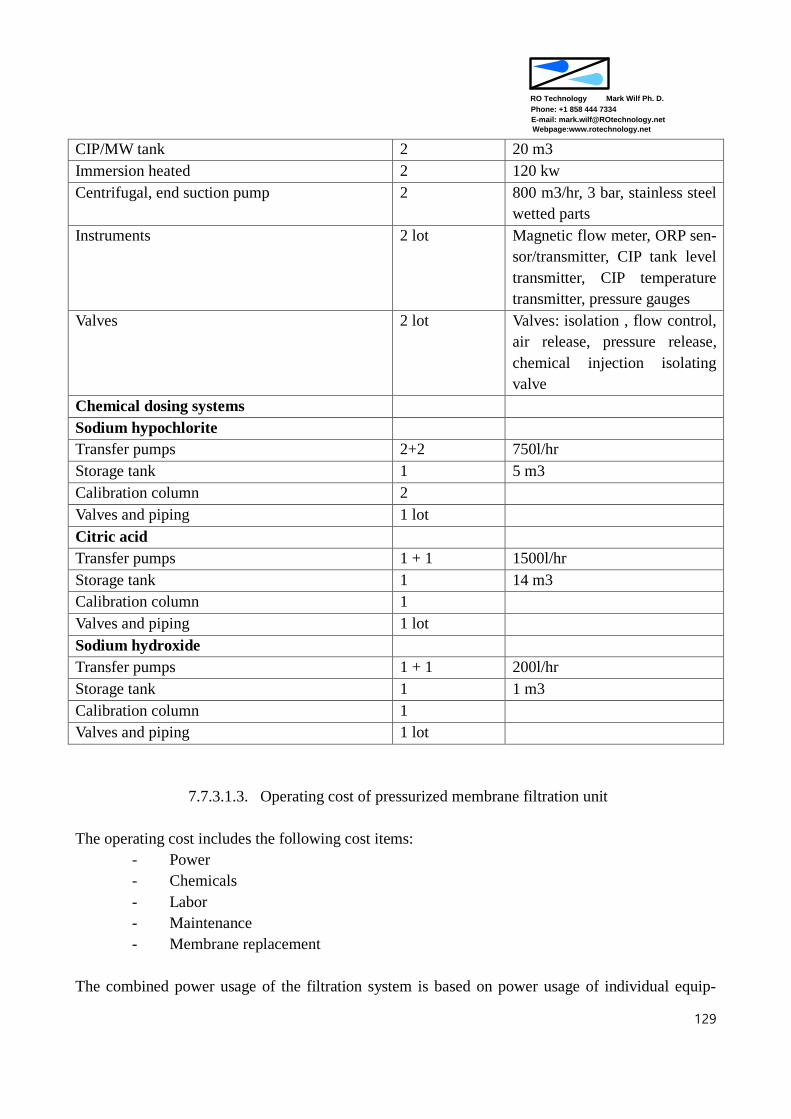
Mark Wilf Ph. D.
Phone: +1 858 444 7334
RO Technology
E-mail: [email protected]
Webpage:www.rotechnology.net
129
CIP/MW tank 2 20 m3
Immersion heated 2 120 kw
Centrifugal, end suction pump 2 800 m3/hr, 3 bar, stainless steel
wetted parts
Instruments 2 lot Magnetic flow meter, ORP sen-
sor/transmitter, CIP tank level
transmitter, CIP temperature
transmitter, pressure gauges
Valves 2 lot Valves: isolation , flow control,
air release, pressure release,
chemical injection isolating
valve
Chemical dosing systems
Sodium hypochlorite
Transfer pumps 2+2 750l/hr
Storage tank 1 5 m3
Calibration column 2
Valves and piping 1 lot
Citric acid
Transfer pumps 1 + 1 1500l/hr
Storage tank 1 14 m3
Calibration column 1
Valves and piping 1 lot
Sodium hydroxide
Transfer pumps 1 + 1 200l/hr
Storage tank 1 1 m3
Calibration column 1
Valves and piping 1 lot
7.7.3.1.3. Operating cost of pressurized membrane filtration unit
The operating cost includes the following cost items:
- Power
- Chemicals
- Labor
- Maintenance
- Membrane replacement
The combined power usage of the filtration system is based on power usage of individual equip-

Mark Wilf Ph. D.
Phone: +1 858 444 7334
RO Technology
E-mail: [email protected]
Webpage:www.rotechnology.net
130
ment according to the scheduled operation time.
Example of energy usage in membrane filtration system of filtrate flow capacity of 200,000 m3/day
is provided in Table 4.7.11. As expected the major energy user is feed pump that delivers the feed
water and provides sufficient pressure to drove water through the membranes.
Table 4.7.11. Breakdown of energy usage in pressurized membrane filtration system. Filtrate ca-
pacity 200,000 m3/day
Power compo-nent
Efficiency M (P)
Operating pressure, bar
Flow, m3/hr Active, % Power, kW
Feed pump 0.95 (0.80) 2.0 14*750 =
10,500
92.0 706.9
BW pump 0.95 (0.80) 2.4 2,650 23.0 53.5
Cleaning pumps
0.95 (0.80) 1.7 750 8.3 3.9
Cleaning tank heater
8.3 10.0
Compressor 12.0 1.0
Valve actuators 3.3 1.0
Instrumentation &PLC
100.0 20.0
Total 796.3
Annual usage 6,626,808 kWhr/y
Specific energy usage
0.091 kWhr/m3
Another significant contributor to the water operating cost is cost of chemicals used in the process
for recovery of membrane permeability. These are chemicals used in the course of CEB and CIP.
The calculation of quantity of chemicals used is based on volume CEB and CIP and concentration
of chemicals used. An example of calculation of volumes required is provided in Table 4.7.12.
Summary of chemicals usage in a 200,000 m3/day membrane filtration system is provided in Table
4.7.13. The generic chemicals used in permeability recovery procedure include sodium hypochlorite,
sodium hydroxide, sulfuric acid and citric acid.
If coagulation – flocculation process is utilized in the filtration process, then quantity and cost of
coagulant (usually ferric salts) should be included in calculation of water cost.
Table 4.7.12. Summary of volumes required for CEB and CIP in pressurized membrane filtration
system

Mark Wilf Ph. D.
Phone: +1 858 444 7334
RO Technology
E-mail: [email protected]
Webpage:www.rotechnology.net
131
Procedure Volume used,
m3/day/train
Number of treatments
in system per year
Total volume used,
m3/year
CEB1(1/4 backwash) 1990/4 = 500 14*365*0.95 = 4,950 2,475,500
CEB2 (1/40 backwash) 1990/50 = 50 4,950 247,550
CEB3 (1/40 backwash) 1990/50 = 50 4,950 247,550
CIP1 20 04*14*(365/20) = 102 2,040
CIP2 20 04*14*(365/20) = 102 2,040
CIP3 20 02*14*(365/20) = 51 1,020
Table 4.7.13. Summary of chemicals usage in pressurized membrane filtration system. Filtrate ca-
pacity 200,000 m3/day.
Process step Chemical Dosage, ppm t/year (as 100%) $/year
CEB1 NaOCl 50 123.8 123,800
CEB2 H2SO4 1,000 247.6 37,140
CEB3 NaOH 1,000 247.6 247,600
CIP1 Citric acid 20,000 40.8 81,600
CIP2 NaOH 3,500 7.1 7,100
CIP3 NaOCl 1,000 1.0 1,000
Total 497,240
Chemicals cost $0.007/m3
Summary of total operating cost is provided in Table 4.7.14.
Table 4.7.14. Summary of operating cost of pressurized membrane filtration system
Cost component $/year $/m3
Power@C10kWhr 662,681 0.0091
Chemicals 497,240 0.007
Operation and maintenance 480,000 (8 opera-
tors@$60,000/y)
0.006
Membrane replacement 658,285 (16 trains,7 years
membrane life)
0.009
Total 2,298,206 0.031
7.7.3.2. Configuration of immersed, vacuum driven, membrane filtration system
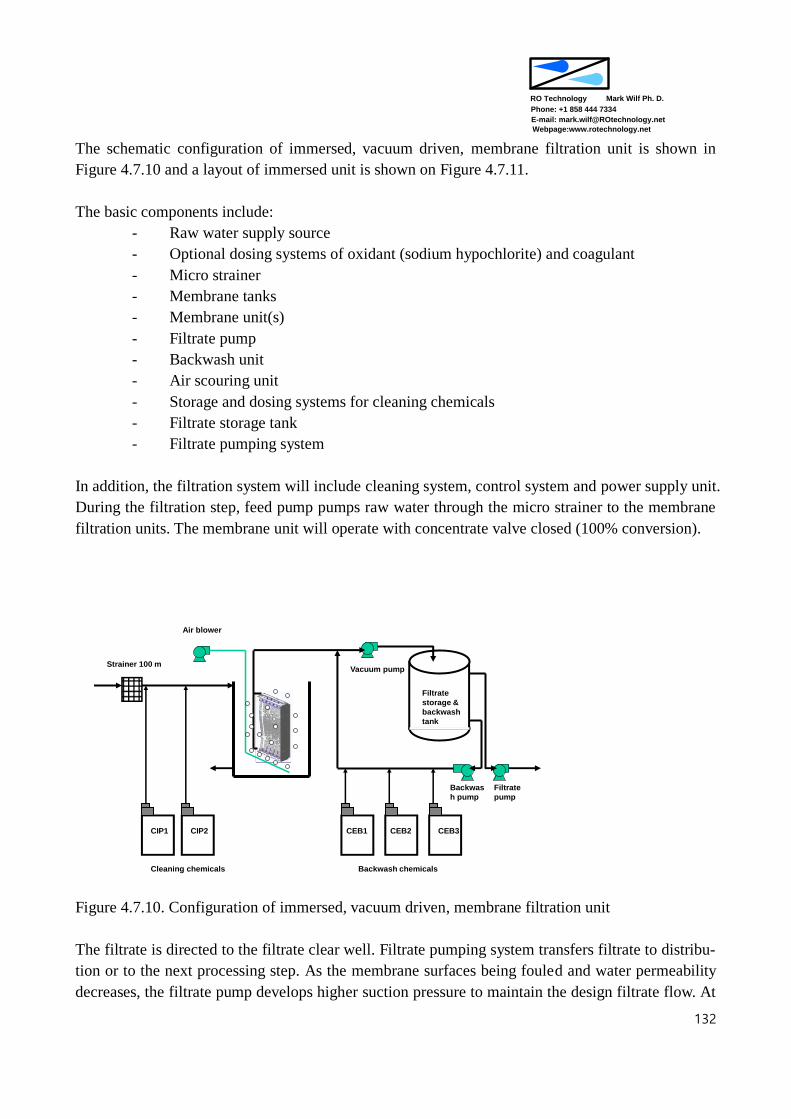
Mark Wilf Ph. D.
Phone: +1 858 444 7334
RO Technology
E-mail: [email protected]
Webpage:www.rotechnology.net
132
The schematic configuration of immersed, vacuum driven, membrane filtration unit is shown in
Figure 4.7.10 and a layout of immersed unit is shown on Figure 4.7.11.
The basic components include:
- Raw water supply source
- Optional dosing systems of oxidant (sodium hypochlorite) and coagulant
- Micro strainer
- Membrane tanks
- Membrane unit(s)
- Filtrate pump
- Backwash unit
- Air scouring unit
- Storage and dosing systems for cleaning chemicals
- Filtrate storage tank
- Filtrate pumping system
In addition, the filtration system will include cleaning system, control system and power supply unit.
During the filtration step, feed pump pumps raw water through the micro strainer to the membrane
filtration units. The membrane unit will operate with concentrate valve closed (100% conversion).
CEB1 CEB2 CEB3
Air blower
Vacuum pump
Backwas
h pump
Filtrate
pump
CIP1 CIP2
Strainer 100 m
Filtrate
storage &
backwash
tank
Cleaning chemicals Backwash chemicals
Figure 4.7.10. Configuration of immersed, vacuum driven, membrane filtration unit
The filtrate is directed to the filtrate clear well. Filtrate pumping system transfers filtrate to distribu-
tion or to the next processing step. As the membrane surfaces being fouled and water permeability
decreases, the filtrate pump develops higher suction pressure to maintain the design filtrate flow. At

Mark Wilf Ph. D.
Phone: +1 858 444 7334
RO Technology
E-mail: [email protected]
Webpage:www.rotechnology.net
133
presented time interval, after 20 – 60 min of operation in filtration step, membrane units enter se-
quentially into backwash step. In the backwash step, set of valves isolates the membrane unit from
the feed line, connecting filtrate line to the backwash system. The backwash is initiated by reducing
water level in the membrane tank and then starting the backwash pump and pumping filtrate in re-
verse direction for a period of 30 – 60 seconds. The reverse filtrate flow dislodges foulants form the
membrane surfaces to the tank volume. At the end of backwash step, water in the membrane tank is
drained (deconcentration step) and then the tank is refilled again with the feed water. `
The layout drawing on Figure 4.7.11. is of submersible system with 10 tanks, each containing racks
with connected membrane elements in configuration of clovers of four elements connected in paral-
lel. The equipment shown on the layout includes chemical storage tanks in containments, located at
the lower right corner. In clockwise direction there are two rows of five membrane tanks with the
manifolds and filtrate pumps located between the tanks. Each row of tanks is equipped with one
membrane lifting device. The compressed air system is located at the upper right corner. Low pres-
sure blowers are located to the right of the air compressors. Cleaning tanks and CIP recirculation
pumps are located between blowers and chemicals storage area.
Figure 4.7.11. Layout of immersed membrane filtration system (courtesy Siemens Water Technolo-
gies)
In system configuration shown in Figure 4.7.11 all the equipment including membrane storage tank
is located above the ground, mounted on a concrete slab. In alternate configuration the membrane
tanks and filtrate pumps could be located below the ground surface level. The total system area is
about 1200 m2.
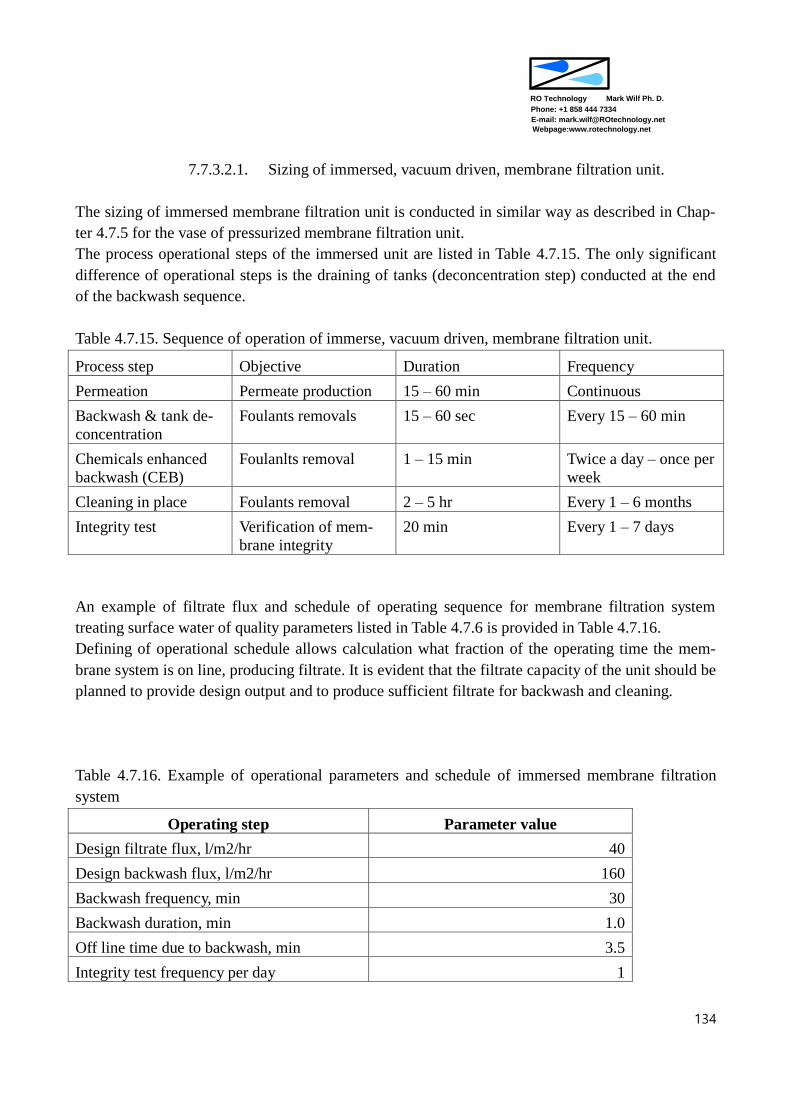
Mark Wilf Ph. D.
Phone: +1 858 444 7334
RO Technology
E-mail: [email protected]
Webpage:www.rotechnology.net
134
7.7.3.2.1. Sizing of immersed, vacuum driven, membrane filtration unit.
The sizing of immersed membrane filtration unit is conducted in similar way as described in Chap-
ter 4.7.5 for the vase of pressurized membrane filtration unit.
The process operational steps of the immersed unit are listed in Table 4.7.15. The only significant
difference of operational steps is the draining of tanks (deconcentration step) conducted at the end
of the backwash sequence.
Table 4.7.15. Sequence of operation of immerse, vacuum driven, membrane filtration unit.
Process step Objective Duration Frequency
Permeation Permeate production 15 – 60 min Continuous
Backwash & tank de-
concentration
Foulants removals 15 – 60 sec Every 15 – 60 min
Chemicals enhanced
backwash (CEB)
Foulanlts removal 1 – 15 min Twice a day – once per
week
Cleaning in place Foulants removal 2 – 5 hr Every 1 – 6 months
Integrity test Verification of mem-
brane integrity
20 min Every 1 – 7 days
An example of filtrate flux and schedule of operating sequence for membrane filtration system
treating surface water of quality parameters listed in Table 4.7.6 is provided in Table 4.7.16.
Defining of operational schedule allows calculation what fraction of the operating time the mem-
brane system is on line, producing filtrate. It is evident that the filtrate capacity of the unit should be
planned to provide design output and to produce sufficient filtrate for backwash and cleaning.
Table 4.7.16. Example of operational parameters and schedule of immersed membrane filtration
system
Operating step Parameter value
Design filtrate flux, l/m2/hr 40
Design backwash flux, l/m2/hr 160
Backwash frequency, min 30
Backwash duration, min 1.0
Off line time due to backwash, min 3.5
Integrity test frequency per day 1

Mark Wilf Ph. D.
Phone: +1 858 444 7334
RO Technology
E-mail: [email protected]
Webpage:www.rotechnology.net
135
Integrity test duration, min 20
CEB frequency per day 1
CEB duration, min 10
Total off line time per day, min 177 (integrity + CEB + backwash)
Backwash time per day, min (1440 – 20 – 10)/(30 + 3.5) = 42
Backwash off line time, min 3.5*42 = 147
Off line time due to monthly cleaning,% 1
Membrane trains on line time fraction (1440 –
(20+10+147+0.01*1440))/1440 = 0.87
According to the values listed in Table 4.7.15, the scheduled off line time represents close to 13% of
the available time. This off line time requires compensation of filtrate production capacity in sizing
of the membrane filtration unit.
The sizing of the membrane filtration unit is based on schedule of the process steps, configuration
of membrane elements selected and the designed filtrate flux rate.
Example of sizing of membrane filtration system of filtrate capacity of 200,000 m3/day according
to parameters listed in Table 4.7.16 is provided in Table 4.7.17.
Table 4.7.17. Example of sizing calculations of 200,000 m3/day immersed membrane filtration sys-
tem
Design process parameter Value
Filtrate capacity required for backwash, % 45*160/[40*(1440-177)] = 14.2
Capacity to compensate off line time, % 177/(1440 – 177) = 14.0
Time for membrane cleanings, % 1
Contingency capacity, % 3
Total additional capacity, % 31 (14.2 + 14 + 1 + 3)
Installed filtration capacity, m3/d 200,000* 1.31 = 262,000
Membrane area required, m2 262,000,000/(24*40) = 272,916
Number of membrane modules (28m2/module) 272,916/28 = 9,747
train size, membrane modules per tank (1 train per
tank)
720
Number of tanks required 14
Number of tanks installed 14 + 2
Instantaneous feed flow per tank, m3/day 720*28*40*24/1000 = 19,350
Backwash volume, m3/day/rack 720*28*160*42/(60*1000) = 2,260
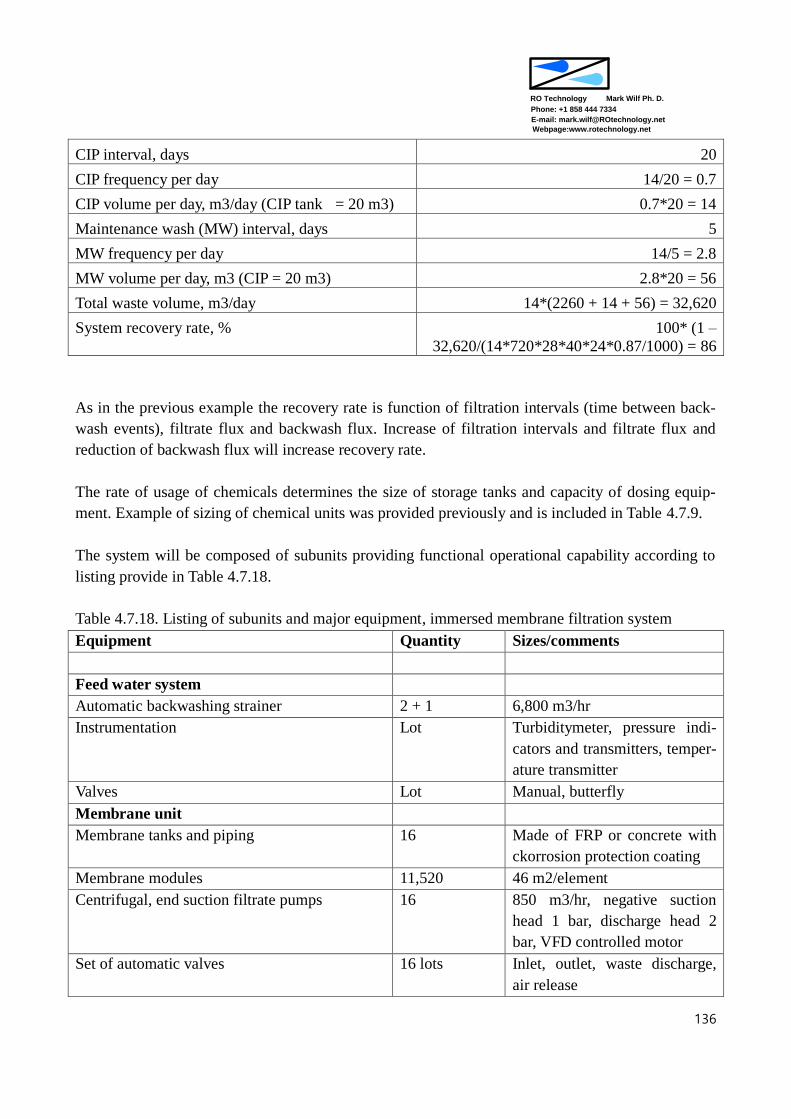
Mark Wilf Ph. D.
Phone: +1 858 444 7334
RO Technology
E-mail: [email protected]
Webpage:www.rotechnology.net
136
CIP interval, days 20
CIP frequency per day 14/20 = 0.7
CIP volume per day, m3/day (CIP tank = 20 m3) 0.7*20 = 14
Maintenance wash (MW) interval, days 5
MW frequency per day 14/5 = 2.8
MW volume per day, m3 (CIP = 20 m3) 2.8*20 = 56
Total waste volume, m3/day 14*(2260 + 14 + 56) = 32,620
System recovery rate, % 100* (1 –
32,620/(14*720*28*40*24*0.87/1000) = 86
As in the previous example the recovery rate is function of filtration intervals (time between back-
wash events), filtrate flux and backwash flux. Increase of filtration intervals and filtrate flux and
reduction of backwash flux will increase recovery rate.
The rate of usage of chemicals determines the size of storage tanks and capacity of dosing equip-
ment. Example of sizing of chemical units was provided previously and is included in Table 4.7.9.
The system will be composed of subunits providing functional operational capability according to
listing provide in Table 4.7.18.
Table 4.7.18. Listing of subunits and major equipment, immersed membrane filtration system
Equipment Quantity Sizes/comments
Feed water system
Automatic backwashing strainer 2 + 1 6,800 m3/hr
Instrumentation Lot Turbiditymeter, pressure indi-
cators and transmitters, temper-
ature transmitter
Valves Lot Manual, butterfly
Membrane unit
Membrane tanks and piping 16 Made of FRP or concrete with
ckorrosion protection coating
Membrane modules 11,520 46 m2/element
Centrifugal, end suction filtrate pumps 16 850 m3/hr, negative suction
head 1 bar, discharge head 2
bar, VFD controlled motor
Set of automatic valves 16 lots Inlet, outlet, waste discharge,
air release

Mark Wilf Ph. D.
Phone: +1 858 444 7334
RO Technology
E-mail: [email protected]
Webpage:www.rotechnology.net
137
Instrumentation 16 lots Magnetic flow meters, turbidi-
tymeter, pressure indicators and
transmitters
Chemical cleaning system
CIP/MW tank 2 20 m3
Immersion heated 2 120 kw
Centrifugal, end suction pump 2 800 m3/hr, 3 bar, stainless steel
wetted parts
Instruments 2 lot Magnetic flow meter, ORP sen-
sor/transmitter, CIP tank level
transmitter, CIP temperature
transmitter, pressure gauges
Valves 2 lot Valves: isolation , flow control,
air release, pressure release,
chemical injection isolating
valve
Chemical dosing systems
Sodium hypochlorite
Transfer pumps 2+2 750l/hr
Storage tank 1 4 m3
Calibration column 2
Valves and piping 1 lot
Citric acid
Transfer pumps 1 + 1 750l/hr
Storage tank 1 4 m3
Calibration column 1
Valves and piping 1 lot
Sodium hydroxide
Transfer pumps 1 + 1 200l/hr
Storage tank 1 1 m3
Calibration column 1
Valves and piping 1 lot
7.7.3.2.2. Operating cost of immersed membrane filtration system
The operating cost includes the following cost items:
- Power
- Chemicals
- Labor
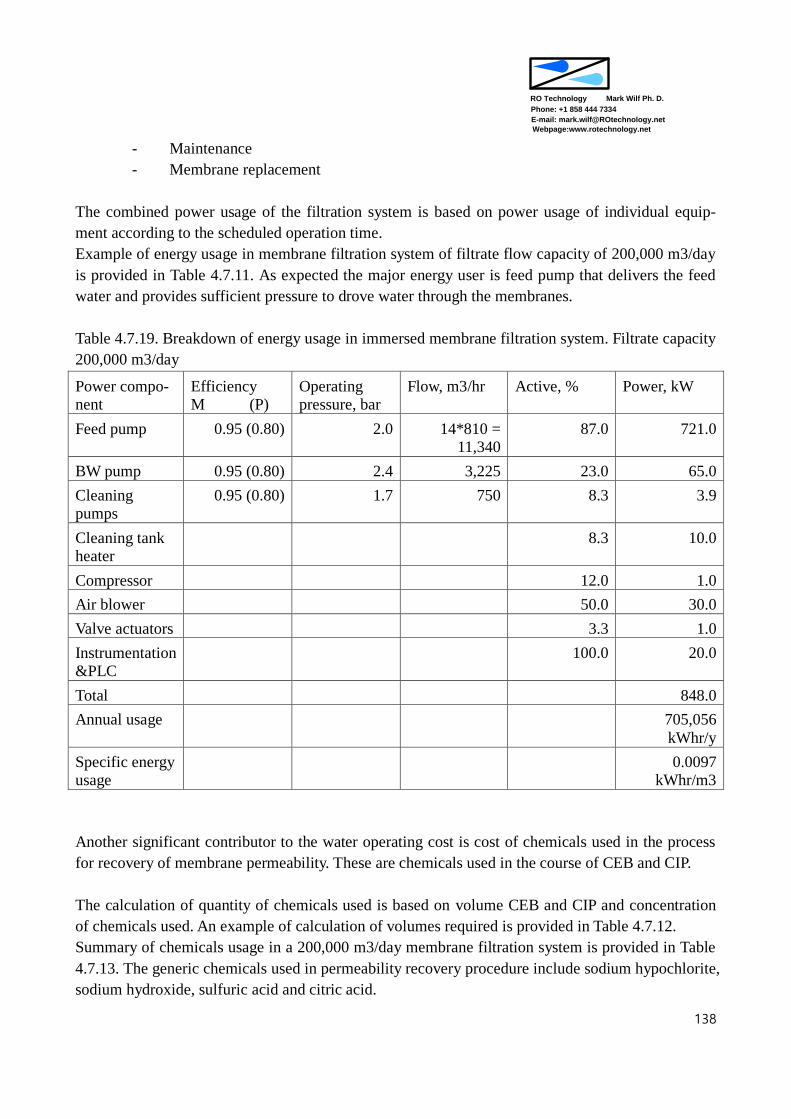
Mark Wilf Ph. D.
Phone: +1 858 444 7334
RO Technology
E-mail: [email protected]
Webpage:www.rotechnology.net
138
- Maintenance
- Membrane replacement
The combined power usage of the filtration system is based on power usage of individual equip-
ment according to the scheduled operation time.
Example of energy usage in membrane filtration system of filtrate flow capacity of 200,000 m3/day
is provided in Table 4.7.11. As expected the major energy user is feed pump that delivers the feed
water and provides sufficient pressure to drove water through the membranes.
Table 4.7.19. Breakdown of energy usage in immersed membrane filtration system. Filtrate capacity
200,000 m3/day
Power compo-nent
Efficiency M (P)
Operating pressure, bar
Flow, m3/hr Active, % Power, kW
Feed pump 0.95 (0.80) 2.0 14*810 = 11,340
87.0 721.0
BW pump 0.95 (0.80) 2.4 3,225 23.0 65.0
Cleaning pumps
0.95 (0.80) 1.7 750 8.3 3.9
Cleaning tank heater
8.3 10.0
Compressor 12.0 1.0
Air blower 50.0 30.0
Valve actuators 3.3 1.0
Instrumentation &PLC
100.0 20.0
Total 848.0
Annual usage 705,056
kWhr/y
Specific energy usage
0.0097 kWhr/m3
Another significant contributor to the water operating cost is cost of chemicals used in the process
for recovery of membrane permeability. These are chemicals used in the course of CEB and CIP.
The calculation of quantity of chemicals used is based on volume CEB and CIP and concentration
of chemicals used. An example of calculation of volumes required is provided in Table 4.7.12.
Summary of chemicals usage in a 200,000 m3/day membrane filtration system is provided in Table
4.7.13. The generic chemicals used in permeability recovery procedure include sodium hypochlorite,
sodium hydroxide, sulfuric acid and citric acid.

Mark Wilf Ph. D.
Phone: +1 858 444 7334
RO Technology
E-mail: [email protected]
Webpage:www.rotechnology.net
139
If coagulation – flocculation process is utilized in the filtration process, then quantity and cost of
coagulant (usually ferric salts) should be included in calculation of water cost.
Table 4.7.20. Summary of volumes required for CEB and CIP in immersed membrane filtration sys-
tem
Procedure Volume used,
m3/day/train
Number of treatments
in system per year
Total volume used,
m3/year
CEB1(1/4 backwash) 2260/4 = 600 14*365*0.95 = 4,950 2,970,500
CEB2 (1/40 backwash) 2260/50 = 50 4,950 247,550
CEB3 (1/40 backwash) 2260/50 = 50 4,950 247,550
CIP1 20 04*14*(365/20) = 102 2,040
CIP2 20 04*14*(365/20) = 102 2,040
CIP3 20 02*14*(365/20) = 51 1,020
Table 4.7.21. Summary of chemicals usage in immersed membrane filtration system. Filtrate ca-
pacity 200,000 m3/day.
Process step Chemical Dosage, ppm t/year (as 100%) $/year
CEB1 NaOCl 50 148.5 148,500
CEB2 H2SO4 1,000 247.6 37,140
CEB3 NaOH 1,000 247.6 247,600
CIP1 Citric acid 20,000 40.8 81,600
CIP2 NaOH 3,500 7.1 7,100
CIP3 NaOCl 1,000 1.0 1,000
Total 522,940
Chemicals cost $0.0075/m3
Summary of total operating cost is provided in Table 4.7.22.
Table 4.7.22. Summary of operating cost in immersed membrane filtration system
Cost component $/year $/m3
Power@C10kWhr 705,056 0.0097
Chemicals 522,940 0.0075
Operation and maintenance 480,000 (8 opera-
tors@$60,000/y)
0.006
Membrane replacement 822,857 (16 trains,7 years
membrane life)
0.012
Total 2,530,853 0.035
Mark Wilf Ph. D.
Phone: +1 858 444 7334
RO Technology
E-mail: [email protected]
Webpage:www.rotechnology.net
140
The above examples of calculations of power consumption, chemicals consumption and operating
cost are not specific for any commercial membrane filtration technology. The present calculations
are based on generic process parameters and just provided here to demonstrate the approach to this
type of calculations.
In calculations conducted for a commercial project the specific membrane module configuration,
filtration process sequence and operating parameters specified by equipment provider will have to
be applied. The results will have to be confirmed with provider of membrane filtration equipment to
receive their approval and eventually warranty for system performance and operating cost, once the
project is secured.
7.7.4. Comparison of conventional and membrane filtration technologies as pretreatment
for seawater RO desalination systems
The conventional pretreatment technology is based on suspended solids removal through coagula-
tion, flocculation and media filtration. The process is well established and in majority of cases is
capable to produce RO feed water of the required quality in respect of SDI and turbidity. The con-
ventional process is very effective as pretreatment. However the quality of the effluent could be
significantly affected by the quality of the raw water.
The membrane filtration process is more equipment intensive than the conventional pretreatment
process. Therefore maintenance requirements are much higher than of the conventional system. As
in the case of conventional system, deterioration of raw water quality will affect operation of the
filtration system. However, due to presence of the membrane barrier, filtrate quality will be much
less affected by the quality of raw water, as compared to operation of the conventional system at the
same conditions.
Schematic configuration of a conventional pretreatment system is shown on Figure 4.7.12. The pre-
treatment system components include coarse strainer, storage and dosing systems for chemicals
(hypochlorite, acid, coagulant and polymer), static mixer, flocculation system followed by gravity
filters. The filtration effluent is collected in the clear well. The filter backwash unit consists of
backwash pumps and air blower (for air scouring). The backwash stream is treated in solids man-
agement unit. The auxiliary units include electric supply unit and process control system.

Mark Wilf Ph. D.
Phone: +1 858 444 7334
RO Technology
E-mail: [email protected]
Webpage:www.rotechnology.net
141
Intake
pumpsStrainer
Static
mixerMedia filters
Filtrate
clearwell
Dosing
systems
2
Backwash
pumps
Blowers
Solids
handling
Electric
system
Control
system
Seawater
source
Dosing
systems
3
Dosing
systems
1
Dosing
systems
4
Flocculation
Figure 4.7.12. Configuration of conventional pretreatment system for SWRO
Feed
pumpsStrainer
Static
mixerMembrane tanks
Filtrate
pumps
Filtrate
clearwell
Dosing
systems 1
Heat
exchanger
Backpulse
tank
Backpulse
pumps
Dosing
systems 3
Blowers
Compress
air
Cleaning and
neutralization
unit
Dosing
systems 2
Solids
handling
Vacuum
pumps
Electric
system
Control
system
Figure 4.7.13. Configuration of immersed membrane pretreatment system for SWRO
The configuration of membrane filtration pretreatment system is shown on Figure 4.7.13. The pre-
treatment system components include fine strainer, storage and dosing systems for hypochlorite,
static mixer, flocculation system followed by membrane tanks with membrane modules. The filtra-
tion effluent pumped through the membrane by filtrate pumps is collected in the clear well. The fil-
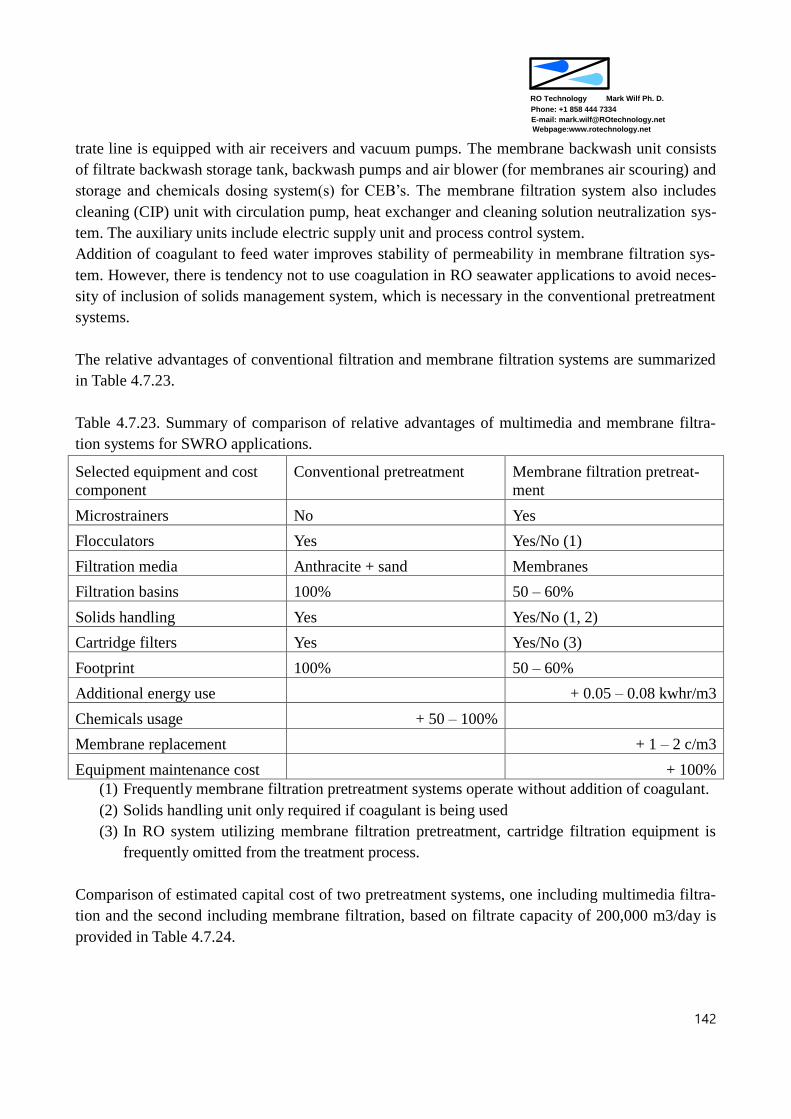
Mark Wilf Ph. D.
Phone: +1 858 444 7334
RO Technology
E-mail: [email protected]
Webpage:www.rotechnology.net
142
trate line is equipped with air receivers and vacuum pumps. The membrane backwash unit consists
of filtrate backwash storage tank, backwash pumps and air blower (for membranes air scouring) and
storage and chemicals dosing system(s) for CEB’s. The membrane filtration system also includes
cleaning (CIP) unit with circulation pump, heat exchanger and cleaning solution neutralization sys-
tem. The auxiliary units include electric supply unit and process control system.
Addition of coagulant to feed water improves stability of permeability in membrane filtration sys-
tem. However, there is tendency not to use coagulation in RO seawater applications to avoid neces-
sity of inclusion of solids management system, which is necessary in the conventional pretreatment
systems.
The relative advantages of conventional filtration and membrane filtration systems are summarized
in Table 4.7.23.
Table 4.7.23. Summary of comparison of relative advantages of multimedia and membrane filtra-
tion systems for SWRO applications.
Selected equipment and cost
component Conventional pretreatment Membrane filtration pretreat-
ment
Microstrainers No Yes
Flocculators Yes Yes/No (1)
Filtration media Anthracite + sand Membranes
Filtration basins 100% 50 – 60%
Solids handling Yes Yes/No (1, 2)
Cartridge filters Yes Yes/No (3)
Footprint 100% 50 – 60%
Additional energy use + 0.05 – 0.08 kwhr/m3
Chemicals usage + 50 – 100%
Membrane replacement + 1 – 2 c/m3
Equipment maintenance cost + 100%
(1) Frequently membrane filtration pretreatment systems operate without addition of coagulant.
(2) Solids handling unit only required if coagulant is being used
(3) In RO system utilizing membrane filtration pretreatment, cartridge filtration equipment is
frequently omitted from the treatment process.
Comparison of estimated capital cost of two pretreatment systems, one including multimedia filtra-
tion and the second including membrane filtration, based on filtrate capacity of 200,000 m3/day is
provided in Table 4.7.24.
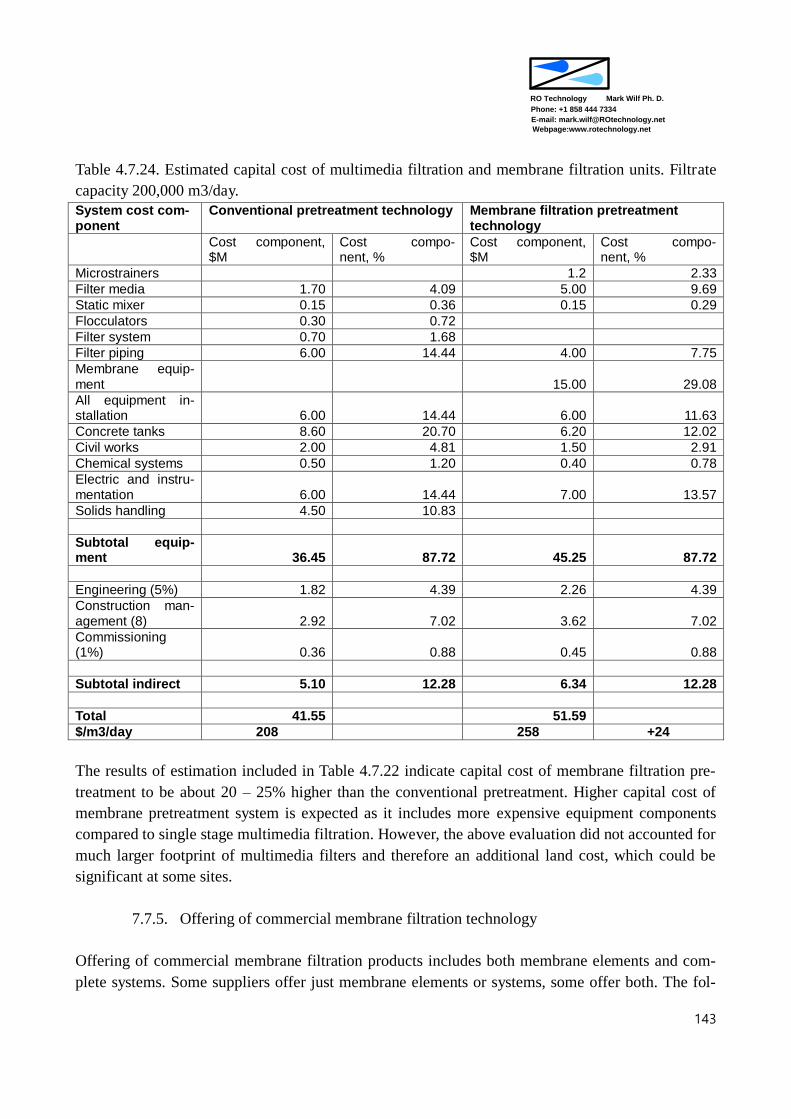
Mark Wilf Ph. D.
Phone: +1 858 444 7334
RO Technology
E-mail: [email protected]
Webpage:www.rotechnology.net
143
Table 4.7.24. Estimated capital cost of multimedia filtration and membrane filtration units. Filtrate
capacity 200,000 m3/day.
System cost com-ponent
Conventional pretreatment technology Membrane filtration pretreatment technology
Cost component, $M
Cost compo-nent, %
Cost component, $M
Cost compo-nent, %
Microstrainers 1.2 2.33
Filter media 1.70 4.09 5.00 9.69
Static mixer 0.15 0.36 0.15 0.29
Flocculators 0.30 0.72
Filter system 0.70 1.68
Filter piping 6.00 14.44 4.00 7.75
Membrane equip-ment 15.00 29.08
All equipment in-stallation 6.00 14.44 6.00 11.63
Concrete tanks 8.60 20.70 6.20 12.02
Civil works 2.00 4.81 1.50 2.91
Chemical systems 0.50 1.20 0.40 0.78
Electric and instru-mentation 6.00 14.44 7.00 13.57
Solids handling 4.50 10.83
Subtotal equip-ment 36.45 87.72 45.25 87.72
Engineering (5%) 1.82 4.39 2.26 4.39
Construction man-agement (8) 2.92 7.02 3.62 7.02
Commissioning (1%) 0.36 0.88 0.45 0.88
Subtotal indirect 5.10 12.28 6.34 12.28
Total 41.55 51.59
$/m3/day 208 258 +24
The results of estimation included in Table 4.7.22 indicate capital cost of membrane filtration pre-
treatment to be about 20 – 25% higher than the conventional pretreatment. Higher capital cost of
membrane pretreatment system is expected as it includes more expensive equipment components
compared to single stage multimedia filtration. However, the above evaluation did not accounted for
much larger footprint of multimedia filters and therefore an additional land cost, which could be
significant at some sites.
7.7.5. Offering of commercial membrane filtration technology
Offering of commercial membrane filtration products includes both membrane elements and com-
plete systems. Some suppliers offer just membrane elements or systems, some offer both. The fol-

Mark Wilf Ph. D.
Phone: +1 858 444 7334
RO Technology
E-mail: [email protected]
Webpage:www.rotechnology.net
144
lowing list of suppliers, included in Table 4.7.25, illustrates variability of approach to market place
by different suppliers
Table 4.7.25. Listing of established suppliers of commercial membrane filtration products.
Provider Market ap-proach
Membrane type
Membrane ma-terial
Module con-figuration
Well estab-
lished
Aquasource Systems UF CA PDI +
Dow/Omexell Elements & sys-
tems MF PVDF PDO
Hydranautics Elements UF PES PDI +
Inge Elements UF PES PDI +
Koch Systems UF PS PDI +
Norit Elements & sys-
tems UF PES PDI +
Pall/Asahi Systems MF PVDF PDO +
Polymem Systems UF PS PDO
Siemens (Memcor) Systems MF PVDF SUB
+
Siemens (Memcor) Systems MF PVDF PDO
+
Toray Elements MF PVDF PDO
Zenon Systems MF PVDF SUB +
The important information included in Table 4.7.23 is related to membrane material. Majority of
manufacturers provide membrane made of PVDF, followed by PES and PS. There is large variety of
membrane modules configurations. Larger number of manufacturers offers pressurized products,
while immersed products are only offered by two. One of the major providers, Siemens, offers both,
the pressurized and the immersed products.
Unlikely the offering of membrane elements for RO applications the offering of membrane filtration
products is not standardized in dimensions and configurations. The variability of membrane filtra-
tion products is illustrated in the following pictures of products offers by various providers.

Mark Wilf Ph. D.
Phone: +1 858 444 7334
RO Technology
E-mail: [email protected]
Webpage:www.rotechnology.net
145
Figure 4.7.14. Membrane filtration train with Hydracap modules – Hydranautics
Figure 4.7.14. Membrane filtration train with Xiga modules – Norit

Mark Wilf Ph. D.
Phone: +1 858 444 7334
RO Technology
E-mail: [email protected]
Webpage:www.rotechnology.net
146
Figure 4.7.15. Membrane products offered by Inge
Figure 4.7.16. Membrane products offered by Pall – Asahi.
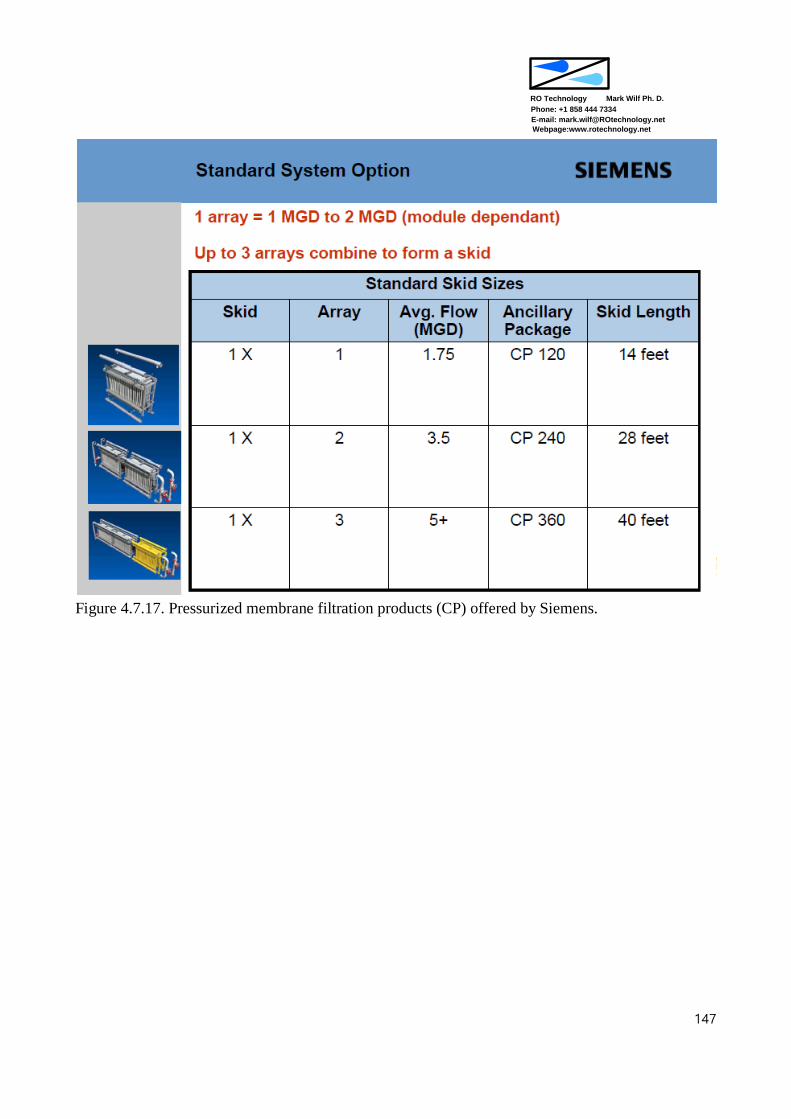
Mark Wilf Ph. D.
Phone: +1 858 444 7334
RO Technology
E-mail: [email protected]
Webpage:www.rotechnology.net
147
Figure 4.7.17. Pressurized membrane filtration products (CP) offered by Siemens.
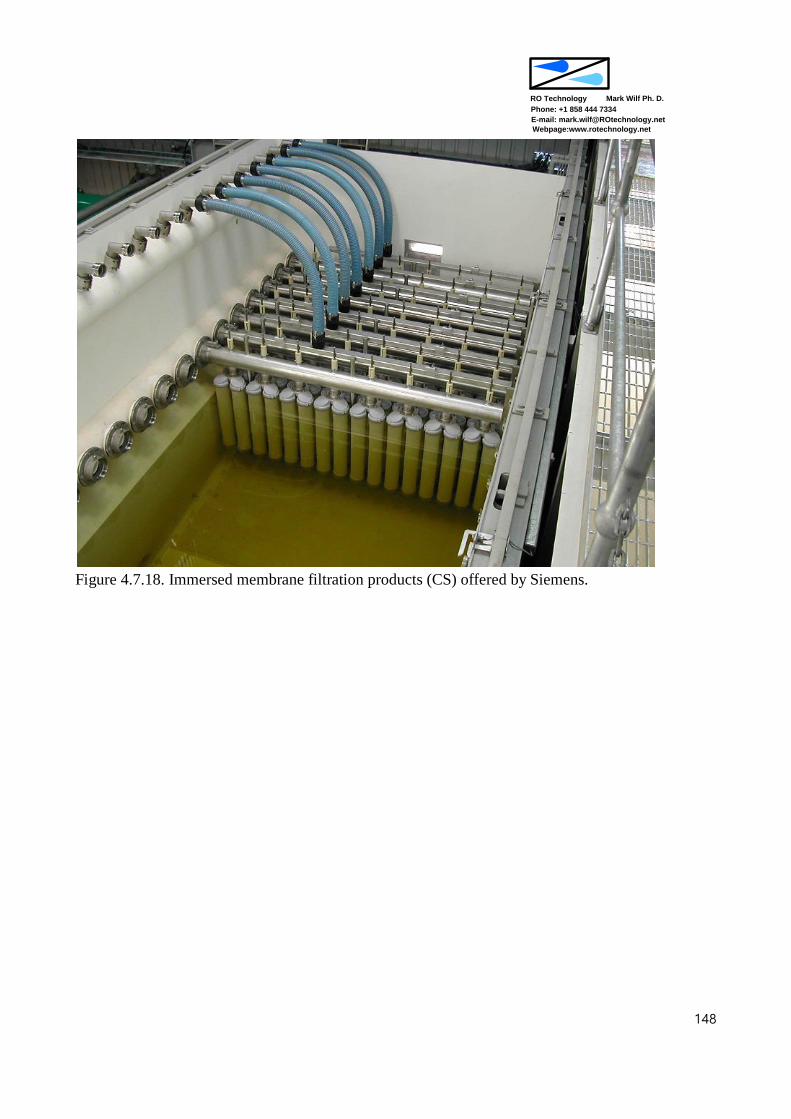
Mark Wilf Ph. D.
Phone: +1 858 444 7334
RO Technology
E-mail: [email protected]
Webpage:www.rotechnology.net
148
Figure 4.7.18. Immersed membrane filtration products (CS) offered by Siemens.

Mark Wilf Ph. D.
Phone: +1 858 444 7334
RO Technology
E-mail: [email protected]
Webpage:www.rotechnology.net
149
Figure 4.7.19. Immersed membrane filtration products (ZW-1000) offered by GE (Zenon)
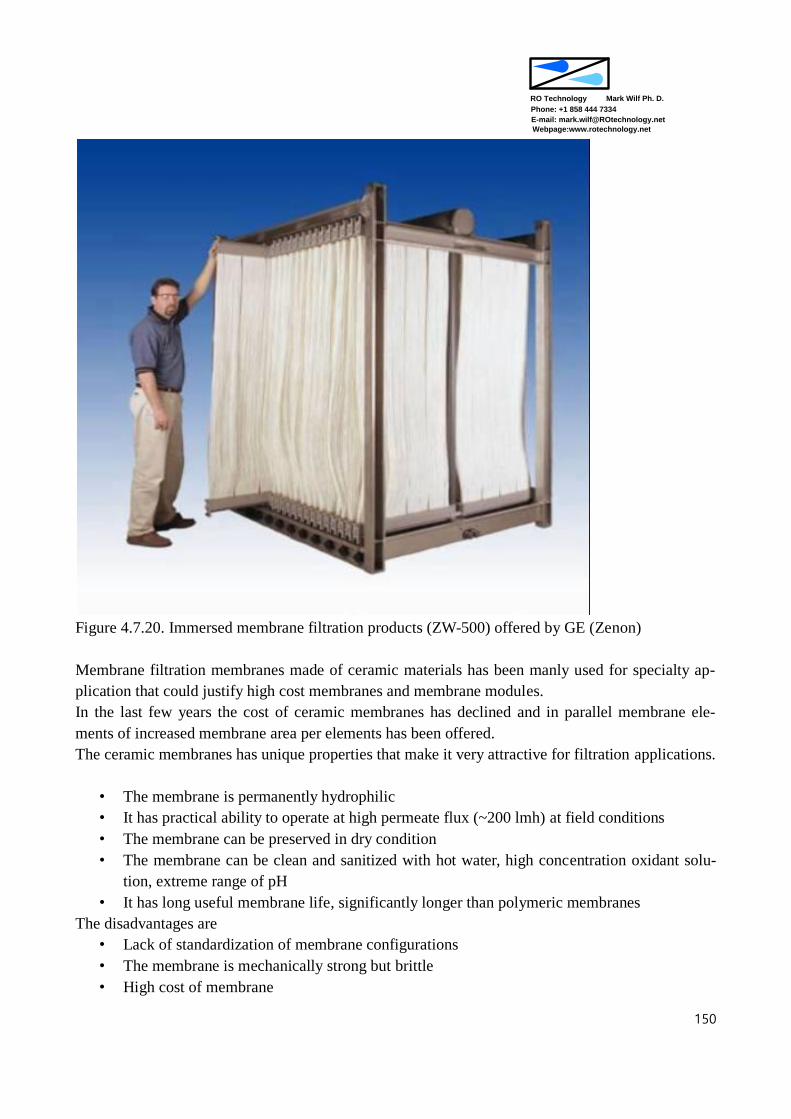
Mark Wilf Ph. D.
Phone: +1 858 444 7334
RO Technology
E-mail: [email protected]
Webpage:www.rotechnology.net
150
Figure 4.7.20. Immersed membrane filtration products (ZW-500) offered by GE (Zenon)
Membrane filtration membranes made of ceramic materials has been manly used for specialty ap-
plication that could justify high cost membranes and membrane modules.
In the last few years the cost of ceramic membranes has declined and in parallel membrane ele-
ments of increased membrane area per elements has been offered.
The ceramic membranes has unique properties that make it very attractive for filtration applications.
• The membrane is permanently hydrophilic
• It has practical ability to operate at high permeate flux (~200 lmh) at field conditions
• The membrane can be preserved in dry condition
• The membrane can be clean and sanitized with hot water, high concentration oxidant solu-
tion, extreme range of pH
• It has long useful membrane life, significantly longer than polymeric membranes
The disadvantages are
• Lack of standardization of membrane configurations
• The membrane is mechanically strong but brittle
• High cost of membrane
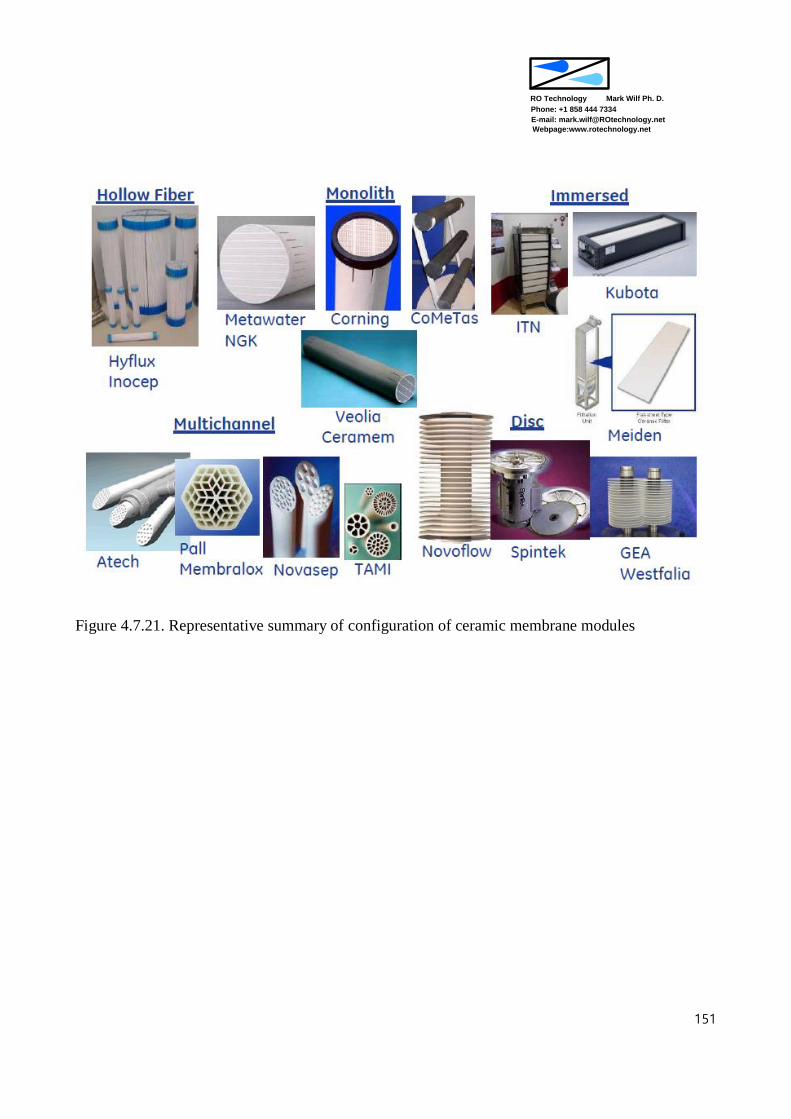
Mark Wilf Ph. D.
Phone: +1 858 444 7334
RO Technology
E-mail: [email protected]
Webpage:www.rotechnology.net
151
Figure 4.7.21. Representative summary of configuration of ceramic membrane modules


