
Deliver Profitable GrowthThierry PilenkoChairman and CEO
Investor PresentationParis, October 17, 2007 - New York, October 19, 2007

2Investor Presentation - Deliver Profitable Growth
Focus and Capitalize on our Strengths
Foster Operational Performance
Conclusion

3Investor Presentation - Deliver Profitable Growth
Focus and Capitalizeon our Strengths

4Investor Presentation - Deliver Profitable Growth
Solid fundamentals and outlook for the oil & gas industry
* assuming 3% per year depletion rate
40
80
120
160
200
20
40
60
80
100
2004 CAPEX in Bn$ Mb/d
Global Oil Production Capacity
Depletion Effect *
Demand Growth ~40% of current production
1976 1978 1980 1982 1984 1986 1988 1990 1992 1994 1996 1998 2000 2002 2004 2006 2008 2010 2012 2014
CAPEX
OIL SUPPLY AND DEMAND EVOLUTION
Global Oil Demand
Sources: IEA, CERA

5Investor Presentation - Deliver Profitable Growth
High Capex level required to increase production capacities
O&G EXPENDITURES(Average per year)
Deep Offshore Capex
0
5
10
15
20
25
2002 2004 2006 2008 2010
$Bn
+ 13% pa.
Sources: IEA, CAPP, Cedigaz, Douglas-Westwood
LNG Demand
+ 7% pa.
Bcm
0
150
300
450
600
2000 2005 2010 2020
Canadian Tar SandsProduction
0
1
2
3
4
2005 2010 2015 2020
Mb/d
+ 10% pa.
Refining Investments(Average 2006-2010)
$59 Bn per year
Greenfield
Expansion
Upgrade
60%32%
8%
2001 - 2005 2006 - 2010
$420 Bn
$280 Bn
15%
65%
16%4%
12%
67%
14%
7%
Other
E&P
RefiningLNG

6Investor Presentation - Deliver Profitable Growth
Increasing project complexity & technological challenges
SINGLE LNG TRAIN CAPACITYWATER DEPTH RECORDPRODUCTION VS DRILLING
0
500
1,000
1,500
2,000
2,500
3,000
3,500
1970 1980 1990 2000
Drilling
Production
Meter
Sources: Offshore magazine, Technip
Mt/y
0
2
4
6
8
1970 1980 1990 2000 2010

7Investor Presentation - Deliver Profitable Growth
Continuous shift of oil & gas onshore marketstowards the East
88 Mt
Middle East
North America
South America
Europe & Eurasia
Africa
Asia-Pacific
O&G Proven Reserves
2006
O&G Demand Growth
2006 - 2010
EthyleneGas Liquefaction Refining0%
20%
40%
60%
80%
100%28 Mt 7.3 Mb/d 24 Mboe/d2,380 Gboe
Sources: BP Statistical Review, Cedigaz, UBS, IEA
RELATIVE IMPORTANCE OF MIDDLE-EAST AND ASIA
Capacity Addition 2006 - 2010
71%
93%
73%

8Investor Presentation - Deliver Profitable Growth
Evolving customer base with NOCs gaining momentum
SPLIT OF CONTRACT AWARDSIOCs vs. NOCsO & G contractors*
Sources: NPC, Deutsch Bank
0%
20%
40%
60%
80%
100%
2003/2004 2005/2006
* Acergy, Aker Kvaerner, Petrofac, Saipem, Technip, Tecnicas Reunidas
IOCs
NOCs
ACCESS TO WORLD OIL RESERVES
Full IOC Access
NOC ReservesLimited Equity Access for IOC
Russian Reserves
NOC ReservesEquity Access for IOC
1970: 630 Gb
1%
2005: 1,210 Gb
65%
12%

9Investor Presentation - Deliver Profitable Growth
Technip’s global leadership in oil & gas
€ 9.7 Bn
TECHNIP BACKLOGJune 30th, 2007
Other
Petrochems
Refining /Heavy Oil
Gas / LNG
ShallowWater
Deepwater20%
12%
18%
36%
12%
TECHNIPRANKING
RECENT EVOLUTION OF TECHNIP POSITIONS COMMENTS
Top 5 in ethylene
Top 5 in refining
Top 5 in heavy-oils
Top 3 in LNG
Top 5 in gas treatment
Top 2 in GTL
N° 1 in Subsea Deep & shallow water
Top 5 in facilitiesFixed and floating
Proprietary technologies in ethylene
Part of the club of 5 licensors
Multiple grassroots references
Canada and Venezuela, H2 technology
Qatar LNG, Yemen LNG
Middle East references
Oryx
In-house technology (flexibles, umbilicals, …)
Leading edge fleet of specialized vessels
Proprietary platform designs
Float-over solutions
Proven track-record in multiple regions
2%
Source: Technip

10Investor Presentation - Deliver Profitable Growth
Strong Technip relationships with both IOCs & NOCs
Recent projects examples
Shah Deniz, Greater Plutonio, Secco PE
Tahiti, Greater Gorgon, Ras Laffan Ethylene
North Belut, Q Chem, Qatargas 3 & 4
East Area, Qatargas 2, Rasgas 3
Perdido, Na Kika, Qatargas 3 & 4
Dalia, Yemen LNG, Gonfreville, Qatargas 2
Das Island Gas, NEB, Takreer refinery
Akpo, Agbami, Bonny Island
P51 & P52, Roncador
Kikeh, Cili Padi, Petlin & Kertheh LDPE
Al Shaheen, Qatargas & Rasgas
Gasprocessing /
LNG
Refining,Hydrogen,Heavy oils
Petrochems
Khursaniyah, Al Jubail
Subsea Offshorefacilities
Gimboa, Dalia, Kizomba C
Source: Technip

11Investor Presentation - Deliver Profitable Growth
Technip’s presence in key Regions

12Investor Presentation - Deliver Profitable Growth
Focus on our core business: Oil & Gas
Proactive commitment to technology & know-how
€1 Bn investment program to develop asset base
Further expansion in important Regions
Technip strategic initiatives

13Investor Presentation - Deliver Profitable Growth
Technip’s focus on our core business:providing solutions to the oil & gas industry
Offshore
Subsea
Onshore
Strengthen internal capabilities and operational performance
Pursue geographical & technological expansion to develop our global leadership
Industries business segment integrated within Onshore

14Investor Presentation - Deliver Profitable Growth
Onshore / OffshoreLow fixed assets
Negative working capital
High degree of outsourcing & sub-contracting
Process technologies & know-how
A clear oil & gas focuswith two complementary business models
68%
40%
17%
32%
60%
83%
Revenue OperatingProfit
FixedAssets
SubseaFleet and manufacturing units
Capital intensive
Vertical integration
Proprietary technologies
€6.9 Bn €333 M €824 M
TECHNIP FINANCIALS, 2006

15Investor Presentation - Deliver Profitable Growth
A proactive commitment to technology & know-how
Subsea• 3,000 meter water-depth solutions• High pressure / high temperature solutions• Enhanced recovery / flow assurance systems• Subsea processing
Offshore• Spar solutions for 6th generation drilling systems & arctic applications• Extended Draft Platform (EDP) solutions for large deck, deepwater dry-tree completion• Floatover technology for heavier decks & in high swell seas
Onshore• Technologies: H2, heavy oil, Cryomax• Scale up: LNG, ethylene, grassroot refining• Environment: CO2 emission reduction, gasification
“New frontiers” deepwater, innovative platform concepts, technology & process know-how

16Investor Presentation - Deliver Profitable Growth
€1 Bn investment program to expand our asset base
2007-2010 Group Capex: ~ €1 Bn
Vessels
Flexible Pipes
Umbilicals
~5,800Vessel-days/year
~700 km/year
2006 Capacity Capacity Increase(2007-2010)
~700 km/year
+ 40
+ 40
+ 25
2010 Capacity
100
100
100

17Investor Presentation - Deliver Profitable Growth
Further expansion in important regions
17

18Investor Presentation - Deliver Profitable Growth
Create a full-fledged regional organization in the Middle East within two years
TECHNIP PRESENCE IN THE MIDDLE EAST
Relative importance of Middle East
• ~ 50 % of proven O&G reserves
• ~ 55 % of LNG capacity addition (2006-2010)
• ~ 50 % of ethylene capacity addition (2006-2010)
• ~ 30 % of refining capacity addition (2006-2010)
Abu Dhabi operating center
• Among the largest EPC organizations in the region
• Over 1,500 employees
• 3 million manhours per year on projects
• From conceptual and feasibility studies to LSTK
Abu Dhabi
DohaMuscat
Riyadh
Kuwait City
Sanaa

19Investor Presentation - Deliver Profitable Growth
Address new frontier areas
1919
20Investor Presentation - Deliver Profitable Growth
Foster Operational Performance
21Investor Presentation - Deliver Profitable Growth
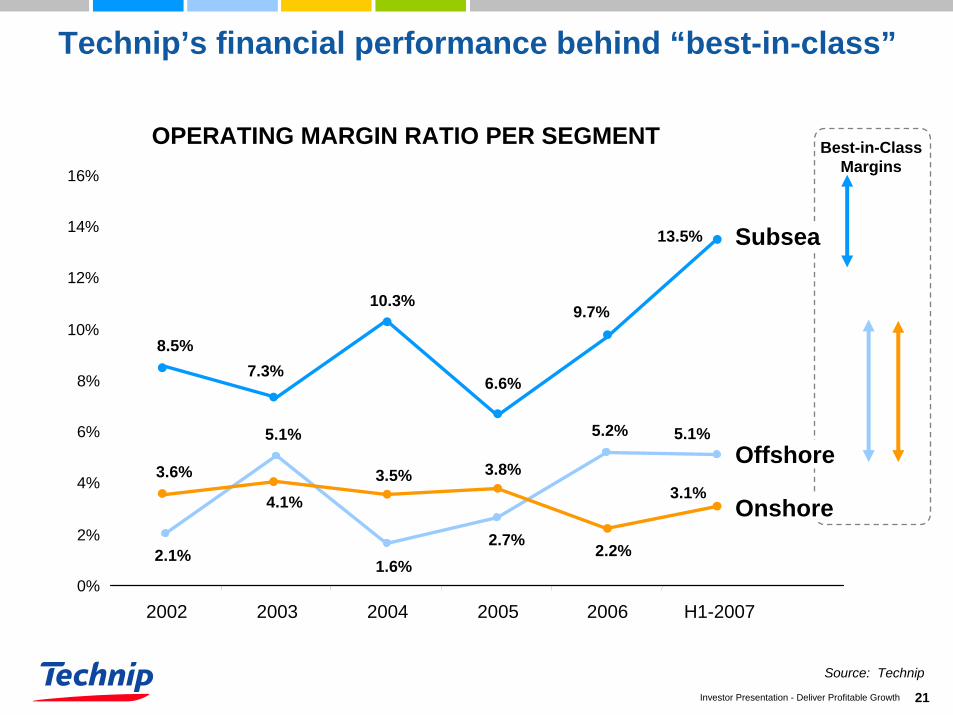
Technip’s financial performance behind “best-in-class”
OPERATING MARGIN RATIO PER SEGMENT
Source: Technip
13.5%
5.1%
3.1%
8.5%7.3%
10.3%
6.6%
9.7%
2.1%
5.1%
1.6%2.7%
5.2%
3.6%
4.1%3.5% 3.8%
2.2%
0%
2%
4%
6%
8%
10%
12%
14%
16%
2002 2003 2004 2005 2006 H1-2007
Best-in-ClassMargins
Subsea
Onshore
Offshore

22Investor Presentation - Deliver Profitable Growth
Change risk profile
Strengthen execution capabilities
Empower the organization
Commit to excellence in safety & quality
Develop high performance human resources
Five initiatives to increase operational performance

23Investor Presentation - Deliver Profitable Growth
Change risk profile
Reduce share of EPC Lump Sum
Balance reimbursable and fixed price contracts
Reduce exposure to construction risks
Improve risk management at all project stages
DE-RISKING INITIATIVES
TECHNIP ROLES AND RESPONSIBILITIES
EPCMLS
E&PLS
EPCMReimb.
FEEDReimb./LS
Engineering/Project Mg’t
Construction/Installation
Procurement
EPCLS
Contract Value
0%
100%
Lower risk
Source: Technip
24Investor Presentation - Deliver Profitable Growth
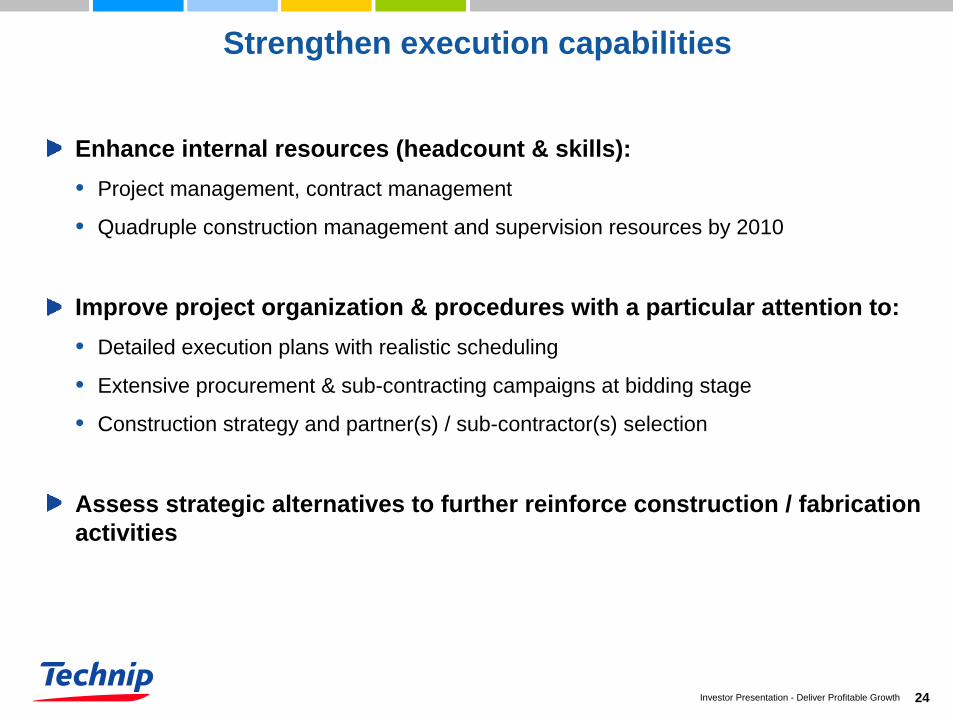
Strengthen execution capabilities
Enhance internal resources (headcount & skills):• Project management, contract management
• Quadruple construction management and supervision resources by 2010
Improve project organization & procedures with a particular attention to:• Detailed execution plans with realistic scheduling
• Extensive procurement & sub-contracting campaigns at bidding stage
• Construction strategy and partner(s) / sub-contractor(s) selection
Assess strategic alternatives to further reinforce construction / fabrication activities

25Investor Presentation - Deliver Profitable Growth
A new operational organization to support strategy: focused, empowered & accountable
A Chief Operating Officer (COO) responsible for:
Six Regions with full P&L responsibilities• Focus on project execution and customer relationships• Manage their own resources
A distinct Business Unit for Subsea• Technology and know-how development• Asset management (new and existing vessels and plants)
Eight Onshore/Offshore Product Lines• Marketing coordination across regions• Technology and know-how development

26Investor Presentation - Deliver Profitable Growth
Commitment to excellence in Safety and Quality to become the industry HSE reference
TOTAL RECORDABLE CASES FREQUENCY (TRC)*
Technip Average
Sources: Technip, 3LNG, External Oil & Gas Producers report* Every 200,000 hours
0.00
0.10
0.20
0.30
0.40
0.50
0.60
TechnipLarge LNG project
20072006Peers2006

27Investor Presentation - Deliver Profitable Growth
Attract & develop high performance human resources
A strong international workforce• 22,000 team members highly recognized within the oil & gas community• 77 nationalities • 47,000 unsolicited job applications received in 2006
Key initiatives • Retain and further develop an international company culture
Internal mobility and inter-cultural programsSecuring talent in countries with available resources (India, South East Asia, Mexico...)
• Create a “learning” organization Deploy Technip University (425,000 training hours in 2007)Foster knowledge sharingImplement mentoring program
• Review performance and retention schemesIndividual performance bonuses and incentivesShare-based compensation policy

28Investor Presentation - Deliver Profitable Growth
18,000
Attract & develop qualified resources worldwideTECHNIP HEADCOUNT BY LOCATION
6,000
1997 2001 2007
22,000
Russia, Central Asia
Middle East
Asia-Pacific
South America
North America
Other Europe
Germany
Italy
France
Africa
United Kingdom
India

29Investor Presentation - Deliver Profitable Growth
Conclusion
30Investor Presentation - Deliver Profitable Growth
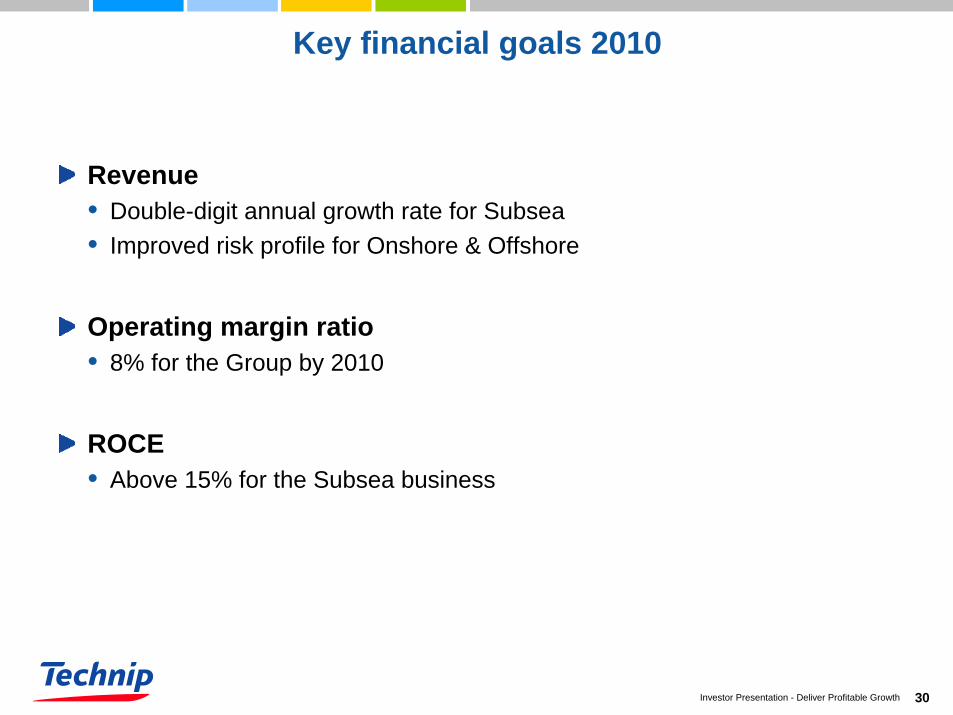
Key financial goals 2010
Revenue• Double-digit annual growth rate for Subsea• Improved risk profile for Onshore & Offshore
Operating margin ratio• 8% for the Group by 2010
ROCE• Above 15% for the Subsea business
31Investor Presentation - Deliver Profitable Growth
Merger & Acquisition framework
Technip’s leadership expansion in the oil and gas industry
• Complementary assets, technologies and know-how• Geographic expansion• Access to additional construction and fabrication capabilities
Profitability levels consistent with Technip’s financial goals
Value creation for shareholders

32Investor Presentation - Deliver Profitable Growth
How are we going to create shareholder value?
Clear focus on the needs of Oil & Gas customers
Capitalize on our strengths: people, assets, technologies & know-how
Improve project execution performance
Pursue geographical and technological expansion

33Investor Presentation - Deliver Profitable Growth
Safe Harborhis presentation contains both historical and forward-looking statements. All statements other than statements of historical fact are, or
may be deemed to be, forward-looking statements, or statements of future expectations; within the meaning of Section 27A of the Securities Act of 1933 or Section 21E of the Securities Exchange Act of 1934, each as amended. These forward-looking statements are not based on historical facts, but rather reflect our current expectations concerning future results and events and generally may be identified by the use of forward-looking words such as “believe”, “aim”, “expect”, “anticipate”, “intend”, “foresee”, “likely”, “should”, “planned”, “may”, “estimates”, “potential” or other similar words. Similarly, statements that describe our objectives, plans or goals are or may be forward-looking statements. These forward-looking statements involve known and unknown risks, uncertainties and other factors that may cause our actual results, performance or achievements to differ materially from the anticipated results, performance or achievements expressed or implied by these forward-looking statements. Risks that could cause actual results to differ materially from the results anticipated in the forward-looking statements include, among other things: our ability to successfully continue to originate and execute large services contracts, and construction and project risks generally; the level of production-related capital expenditure in the oil and gas industry as well as other industries; currency fluctuations; interest rate fluctuations; raw material (especially steel) as well as maritime freight price fluctuations; the timing of development of energy resources; armed conflict or political instability in the Arabian-Persian Gulf, Africa or other regions; the strength of competition; control of costs and expenses; the reduced availability of government-sponsored export financing; losses in one or more of our large contracts; U.S. legislation relating to investments in Iran or elsewhere where we seek to do business; changes in tax legislation, rules, regulation or enforcement; intensified price pressure by our competitors; severe weather conditions; our ability to successfully keep pace with technology changes; our ability to attract and retain qualified personnel; the evolution, interpretation and uniform application and enforcement of International Financial Reporting Standards (IFRS), according to which we prepare our financial statements as of January 1, 2006; political and social stability in developing countries; competition; supply chain bottlenecks; the ability of our subcontractors to attract skilled labor; the fact that our operations may cause the discharge of hazardous substances, leading to significant environmental remediation costs; our ability to manage and mitigate logistical challenges due to underdeveloped infrastructure in some countries where are performing projects; and our ability to remain compliant with the obligations imposed by Sarbanes-Oxley.Some of these risk factors are set forth and discussed in more detail in our Annual Report on Form 20-F as filed with the SEC on June 20, 2007, and as updated from time to time in our SEC filings. Should one of these known or unknown risks materialize, or should our underlying assumptions prove incorrect, our future results could be adversely affected, causing these results to differ materially from those expressed in our forward-looking statements. These factors are not necessarily all of the important factors that could cause our actual results to differ materially from those expressed in any of our forward-looking statements. Other unknown or unpredictable factors also could have material adverse effects on our future results. The forward-looking statements included in this release are made only as of the date of this release. We cannot assure you that projected results or events will be achieved. We do not intend, and do not assume any obligation to update any industry information or forward looking information set forth in this release to reflect subsequent events or circumstances. Except as otherwise indicated, the financial information contained in this document has been prepared in accordance with IFRS, and certain elements would differ materially upon reconciliation to U.S. GAAP.
****This presentation does not constitute an offer or invitation to purchase any securities of Technip in the United States or any other jurisdiction. Securities may not be offered or sold in the United States absent registration or an exemption from registration. The information contained in this presentation may not be relied upon in deciding whether or not to acquire Technip securities. This presentation is being furnished to you solely for your information, and it may not be reproduced, redistributed or published, directly or indirectly, in whole or in part, to any other person. Non-compliance with these restrictions may result in the violation of legal restrictions of the United States or of other jurisdictions.
T

34Investor Presentation - Deliver Profitable Growth
For more information, please contact:
INVESTOR RELATIONS
Xavier d’OuinceTel. +33 (0) 1 47 78 25 75
e-mail: [email protected]

35Investor Presentation - Deliver Profitable Growth
Trading Technip
ISINFR0000131708


