
2017 International Nuclear Atlantic Conference - INAC 2017
Belo Horizonte, MG, Brazil, October 22-27, 2017 ASSOCIAÇÃO BRASILEIRA DE ENERGIA NUCLEAR – ABEN
DEFINITION OF THERMAL-HYDRAULICS PARAMETERS OF A
NAVAL PWR VIA ENERGY BALANCE OF A WESTINGHOUSE PWR
Luiz C. Chaves, Marcos F. Curi
Department of Mechanical Engineering
Centro Federal de Educação Tecnológica Celso Suckow da Fonseca
Rodovia Mário Covas, lote J2, quadra J
23812-101 Rio de Janeiro, RJ
ABSTRACT
In this work, we used the operational parameters of the Angra 1 nuclear power plant, designed by Westinghouse,
to estimate the thermal-hydraulic parameters for naval nuclear propulsion, focusing on the analysis of the
reactor and steam generator. A thermodynamics analysis was made to reach the operational parameters of
primary circuit such as pressure, temperature, power generated among others. Previous studies available in
literature of 2-loop Westinghouse Nuclear Power Plants, which is based on a PWR and similar to Angra 1,
support this analysis in the sense of a correct procedure to deal with many complex processes to energy
generation from a nuclear source. Temperature profiles in reactor and steam generator were studied with
concepts of heat transfer, fluid mechanics and also some concepts of nuclear systems, showing the behavior into
them. In this simulation, the Angra 1 primary circuit was reduced on a scale of 1: 3.5 to fit in a Scorpène-class
submarine. The reactor generates 85.7 MW of total thermal power. The maximum power and temperatures
reached were lower than the operational safe limits established by Westinghouse. The number of tubes of the
steam generator was determined in 990 U-tubes with 6.3 m of average length.
1. INTRODUCTION
The Scorpène-class submarine, designed by DCNS, is designed to be able to add an extra AIP
(Air-Independent Propulsion) module to increase the autonomy of the submarine without the
need to return to the surface to feed the diesel engines with air. Thus, using operational
parameters of the Angra 1 nuclear power plant, a simulation of the thermal hydraulic
parameters of a naval nuclear propulsion was made for a hypothetical replacement of the AIP
module by a nuclear module.
An analysis of the mass and energy balance of the primary circuit of a PWR power plant was
made through thermodynamics, heat transfer and nuclear systems concepts. The study is
based on literature involved in 2-loop Westinghouse plants and the use of properties such as
pressure, temperature, flow, among other data available in [1,4], aiming for reliable results to
use in the primary circuit of a submarine.
An initial simulation is applied to a hypothetical nuclear submarine, based on a Scorpène-
class [8], using predefined operating parameters of Angra 1. The primary system of Angra 1
was reduced on a 1 : 3.5 scale to fit in a submarine. Thus, all thermodynamic parameters were
recalculated in order to obtain the new thermal power system, in accordance with the space
limitations of a submarine. Some data of INS Arihant, available in [10], were used to
compare with calculated parameters.

INAC 2017, Belo Horizonte, MG, Brazil.
2. METHODOLOGY USED FOR THIS ANALYSIS
The simplified PWR power plant, as [3], is showing in Figure 1:
Figure 1: Simplified flowchart of typical PWR plant. [3]
To make this analysis, the primary circuit was divided in two control volumes, as showing in
Figure 2.
Figure 2: Simplified primary circuit with analyzed control volumes. [3]
Control Volume 1 contains the nuclear fuel. This analysis was made from Newton's and
Fourier's laws [2], with concepts of nuclear systems [3]. Nuclear fuel was analyzed in three
steps, which are: fuel rods, reactor core and coolant. Volume Control 2 contains all the
primary circuit equipments. In this work only the reactor and steam generator were analyzed.
This analysis was made from the first law of thermodynamics (for reactor) and analysis of
heat exchangers without phase change (for SG). All the following equations were developed
to be possible to modeling the temperature profiles in Microsoft Excel software.
Reactor
Pressurizer
Steam
Generator
Reactor
Coolant
Pump
Condensed
Pump
Turbine Generator
Condenser
Electricity
Water source /
atmosphere
Nuclear
Fuel Reactor SG
RCP
PZR
SG
Control Volume 1
Control Volume 2
𝑇𝑓𝑢𝑒𝑙
𝑄 at
𝑇𝑐𝑜𝑜𝑙𝑎𝑛𝑡
𝑄 at
𝑊 ℎ𝑒𝑎𝑡𝑒𝑟
𝑊 𝑝𝑢𝑚𝑝

INAC 2017, Belo Horizonte, MG, Brazil.
2.1. Analysis of Control Volume 1
2.1.1. Fuel rods analysis
The first step was determining the temperature profiles on the fuel rods, as shown in Figure 3,
using the following equations developed according [3].
∆𝑇𝑓 =𝑞′′′
𝑓
4𝑘𝑓𝑎2 (1)
∆𝑇𝑔 =𝑞′′′
𝑓. (𝑎 + 𝑔)
2ℎ𝑔 (2)
∆𝑇𝑐𝑙 =𝑞′′′
𝑓. 𝑎²
2 ln (
𝑎 + 𝑔 + 𝑏𝑎 + 𝑔 )
𝑘𝑐𝑙
(3)
Where 𝑞′′′𝑓 is the power density of the nuclear fuel [W/m³], ∆𝑇𝑓 is the temperature variation
in the fuel pellet [°C], ∆𝑇𝑔 is the temperature variation in the gap between fuel pellet and
cladding [°C], ∆𝑇𝑐𝑙 is the temperature variation in the cladding [°C], 𝑘𝑓 is the thermal
conductivity of the fuel pellet [W/m.°C], ℎ𝑔 is the thermal conductance of the gap with
pressurized Helium [W/m².°C] and 𝑘𝑐𝑙 is the thermal conductivity of the cladding [W/m.°C]
Figure 3: Temperature distribution on the fuel rod
Temperature
distribution
∆𝑇𝑐𝑎𝑣𝑔
Flow
direction
∆𝑇𝑓
∆𝑇𝑐𝑙
∆𝑇𝑔
𝑎 𝑏
𝑔
𝑧
𝑟 𝜃

INAC 2017, Belo Horizonte, MG, Brazil.
The maximum temperature on the fuel pellet centerline depends on the local coolant average
temperature and is given by sum of the temperature variations in the fuel, gap, cladding and
the coolant itself, as following:
𝑇𝑓𝑚𝑎𝑥=
𝑞′′′𝑓
2 [𝑎²
2𝑘𝑓+(𝑎 + 𝑔)
ℎ𝑔+𝑎². ln (
𝑎 + 𝑔 + 𝑏𝑎 + 𝑔 )
𝑘𝑐𝑙+(𝑎 + 𝑔 + 𝑏)
ℎ𝑐,𝑐𝑙] + 𝑇𝑐𝑎𝑣𝑔 (4)
Where 𝑇𝑐𝑎𝑣𝑔 is the coolant average temperature [°C] and ℎ𝑐,𝑐𝑙 is the convective coefficient
between coolant and cladding [W/m².°C].
2.1.2. Reactor core analysis
According to [3], the power distribution in a homogeneous reactor core follows a Bessel and
cosine function, as shown in Figure 4:
Figure 4: Power generation profiles according multiplying factors. [3]
Thus, the second step was to determine the power density profiles in the reactor core. The
power density in a homogeneous cylindrical core, according to [3], is given by:
𝑞′′′(𝑟, 𝑧) = 𝑞′′′𝑚𝑎𝑥 𝐽0 (2,405𝑟
𝑅𝑒) cos (
𝜋𝑧
𝐿𝑒) (5)
0
0,5
1
-0,5 -0,3 -0,1 0,1 0,3 0,5
Mu
ltip
lyin
g f
act
or
Core radial position (r)
Bessel
-0,5
-0,3
-0,1
0,1
0,3
0,5
00,51
Core
ax
ial
posi
tion
(z)
Multiplying factor
Cosine

INAC 2017, Belo Horizonte, MG, Brazil.
Where 𝑞′′′𝑚𝑎𝑥 is the maximum core power density [W/m³], 𝐽0 is the zero order Bessel
function, 𝑟 is the core radial position, with ris the0 at center [m], 𝑅𝑒is the core extrapolated
radius [m], 𝑧 is the core axial position, with zis the0 at middle point [m] and 𝐿𝑒is the core
extrapolated length [m]. Extrapolated dimensions considered equal to physical dimensions.
Looking at Figure 4 is possible to note that the maximum core power density is located in the
middle of the axial and radial position. According to [5], the average core power density
(without considering the neutron flux analysis) is given by:
𝑞′′′𝑎𝑣𝑔 = Q 𝑡𝑜𝑡. 𝐹𝑟𝑔𝑒𝑟
𝐿𝑒 . 𝑁𝑓𝑟 . 𝜋. 𝑎2 (6)
Where 𝑄 𝑡𝑜𝑡 is the total reactor thermal power [W], “𝑎” is the radius of fuel pellet [m], 𝑁𝑓𝑟 is
the number of fuel rods and 𝐹𝑟𝑔𝑒𝑟 is the Fraction of heat generated in fuel [%]. Note that is
possible to determine the average linear power (𝑞′𝑎𝑣𝑔) multiplying the Equation 6 by 𝜋. 𝑎2
and the total reactor thermal power (Q 𝑡𝑜𝑡) can be obtained by thermodynamics first law.
2.1.3. Coolant analysis
The third step was determining the coolant temperature distribution along the core length, by
an energy balance on coolant, using core power distribution cited above. Note that the coolant
inlet temperature shall be known. This profile can be modeled by the following equation:
𝑇𝑐2𝑎𝑣𝑔(𝑧) = 𝑇𝑐1 + 0,61135 (𝑎2𝑞′′′
𝑚𝑎𝑥 . 𝐿𝑒
𝑚 𝑐𝑐𝑝) (𝑠𝑒𝑛 (
𝜋𝑧
𝐿𝑒) + 1) (7)
Where 𝑇𝑐1 is the coolant inlet temperature [°C], 𝑇𝑐2𝑎𝑣𝑔 is the average coolant temperature at
specified position [°C], 𝑚 𝑐 is the coolant mass flow in a single channel [kg/s] and 𝑐𝑝 is the
coolant specific heat [kJ/kg.°C].
2.2. Analysis of Control Volume 2
The total thermal power of the reactor can be obtained by applying the thermodynamics first
law in the reactor, as follows:
𝑄 𝑡𝑜𝑡 = 𝑚 𝑡𝑜𝑡(ℎ𝑜𝑢𝑡 − ℎ𝑖𝑛)𝑟𝑒𝑎𝑐𝑡𝑜𝑟 (8)
Where 𝑚 𝑡𝑜𝑡 is the total coolant mass flow through reactor [kg/s] and ℎ𝑜𝑢𝑡 , ℎ𝑖𝑛 is the coolant
enthalpy at reactor outlet and inlet, respectively [kJ/kg].
In order to optimize the analysis of the steam generator, the heat transfer from primary to
secondary circuit was studied assuming that the inlet tubes (Part 1) was considered as a
parallel current heat exchanger and the outlet tubes (Part 2) was considered as a
countercurrent heat exchanger, as shown in Figure 5.

INAC 2017, Belo Horizonte, MG, Brazil.
Figure 5: Selection of parts for steam generator analysis.
For the Part 1, a typical profile of the parallel current heat exchanger was analyzed to obtain a
general equation to model it in software Microsoft Excel, as following:
Figure 6: Analysis of a typical profile of the parallel current heat exchanger.
Through this analysis it was possible to develop the general equation of the parallel current
heat exchanger [6]. The following equation can be modeled in Microsoft Excel software:
𝑑𝑇𝑝
𝑑𝐴+ 𝑈.𝑿′. 𝑇𝑝 = −
𝑚 𝑝. 𝑐𝑝𝑝
𝑚 𝑠. 𝑐𝑝𝑠 𝑑𝑇𝑝
𝑑𝐴+ 𝑈.𝑿′. (𝑇𝑠𝑖 +
𝑚 𝑝. 𝑐𝑝𝑝
𝑚 𝑠. 𝑐𝑝𝑠 . (𝑇𝑝𝑖 − 𝑇𝑝)) (9)
𝑿′ = (1
𝑚 𝑝. 𝑐𝑝𝑝+
1
𝑚 𝑠. 𝑐𝑝𝑠)
Part 1: Studied by
considering as a
parallel current heat
exchanger
Part 2: Studied by
considering as a
countercurrent heat
exchanger
Tpi
Tsi
dTp
dTs
dQ = ṁ.Cp.dT
dA
Tpo
Tso
Area
Tem
per
ature
Tp
Ts
With

INAC 2017, Belo Horizonte, MG, Brazil.
For the Part 2, a typical profile of the countercurrent heat exchanger was analyzed to obtain a
general equation to model it in software Microsoft Excel, as following:
Figure 7: Analysis of a typical profile of the countercurrent heat exchanger.
Through this analysis it was possible to develop the general equation of the countercurrent
heat exchanger [6]. The following equation can be modeled in Microsoft Excel software:
𝑑𝑇𝑝
𝑑𝐴+ 𝑈.𝑿′′. 𝑇𝑝 =
𝑚 𝑝. 𝑐𝑝𝑝
𝑚 𝑠. 𝑐𝑝𝑠 𝑑𝑇𝑝
𝑑𝐴+ 𝑈.𝑿′′. (𝑇𝑠𝑖 +
𝑚 𝑝. 𝑐𝑝𝑝
𝑚 𝑠. 𝑐𝑝𝑠 . (𝑇𝑝 − 𝑇𝑝𝑜)) (10)
𝑿′′ = (1
𝑚 𝑝. 𝑐𝑝𝑝−
1
𝑚 𝑠. 𝑐𝑝𝑠)
Where 𝑑𝐴 is the infinitesimal area of heat transfer [m²], 𝑈 is the overall heat transfer
coefficient [W/m².°C], subscripts .𝑝 , .𝑠 refers to primary and secondary fluid respectively,
subscripts .𝑝𝑖 , .𝑝𝑜 refers to primary fluid inlet and outlet respectively, and subscripts .𝑠𝑖 , .𝑠𝑜
refers to secondary fluid inlet and outlet respectively.
The overall heat transfer coefficient (𝑈) depends on the convective coefficient of the primary
circuit and the secondary circuit, which are determined by the number of Reynolds, Nusselt,
Prandtl and friction factor of the flow tubes, internally and externally. In this study, the
Nusselt number was obtained by Gnielinski correlation [2]:
𝑁𝑢3 =(𝑓8)
(𝑅𝑒 − 1000)𝑃𝑟
1 + 12,7 (𝑓8)
0,5
(𝑃𝑟23 − 1)
(11)
Where 𝑓 is the tube friction factor (obtained by Moody chart)
It’s important to note that the equations 8 and 9 must be applied only in the subcooled region
of the secondary fluid. In other words, it should be used only where the secondary fluid
presents single phase.
dTp
dTs
Tpo
Tsi
Tem
per
ature
Area
dQ = ṁ.Cp.dT
Tp
Ts
dA
Tpi
Tso
With

INAC 2017, Belo Horizonte, MG, Brazil.
3. RESULTS AND DISCUSSION
To fit in a Scorpène Class submarine, with 11.7 m diameter [10], the Angra 1 primary circuit
was reduced on a 1 : 3.5 scale. Therefore, the geometric parameters were recalculated. Thus
the core active length has changed from 3.66m to 1.049m, the tubes internal diameter of the
primary circuit has changed from 0.737m to 0.215m and the average SG tubes length has
changed from 22.1m to 6.3m. This reduce is shown in Figure 8.
Figure 8: Illustration of the scale reduction of the Angra 1 primary circuit.
According to [1], when the coolant inside the tubes reaches a velocity around 15 m/s, the tube
corrosion begins to be severe. Thus, the coolant mass flow in a single loop was determined
assuming a velocity of 7.5 m/s and was defined as 203.5 kg/s. Therefore, the total flow
through reactor was defined as 407 kg/s.
Using the thermodynamics tables with the Equation 7, the total thermal power generated in
the reactor was calculated and defined as a value of 85.7 MWt.
Table 1 contains the main data required for the analysis of the submarine reactor to determine
the temperatures profiles. Note that the analysis was based on Angra 1 operational
parameters:
29
,2 m
11
,7 m
1,9
5 m
8,3
4 m

INAC 2017, Belo Horizonte, MG, Brazil.
Table 1: Parameters of Angra 1 reactor core used for this analysis. [1,3,4,7]
Operational Data of the Angra 1 Reactor Core
Fraction of heat generation in fuel [%] 97,4
Nominal pressure [kgf/cm²] 158
Fuel rods per assembly 235
Fuel rods average linear power [kW/m] 17,6
Coolant temperature at the reactor inlet [°C] 287,5
Coolant temperature at the reactor outlet [°C] 324,3
PWR 16 X 16 Fuel Assembly
Pellet diameter at BOC / MOC [mm] 8,23 / 8,38
Gap at BOC / MOC [mm] 0,086 / 0,010
Cladding thickness [mm] 0,535
Convective coefficient water-cladding [W/m².K] 34000
UO2 Thermal Conductivity [W/m.K] 2,163
Cladding thermal conductivity [W/m.K] 13,85
Thermal conductivity in gap [W/m.K] 0,4902
By the Equation 6 adapted to use the value of fuel rods average linear power of Angra 1, was
possible to determine the quantity of fuel assemblies following the concept of a cylindrical
core. The number of fuel assemblies was defined as 21. Therefore, the number of fuel rods
was defined as 4935. The cylindrical core defined for this reactor is shown in Figure 9:
Figure 9: Illustration of the cylindrical core found in this analysis.
Through the Equation 6 it was possible to determine the new value of the fuel rods average
linear power, defined as 16.12 kW/m, and the average core power density, defined as 303.1
MW/m³ at reactor startup (BOC) and 292.3 MW/m³ during normal operation (MOC).
By integrating the Bessel and cosine functions it was possible to obtain the mean values of
multiplication factors, defined as 0.611351 for the Bessel function and 0.63662 for the cosine
function. Thus, the value of the maximum core power density was defined as 779 MW/m³ at
BOC and 751MW/m³ at MOC.
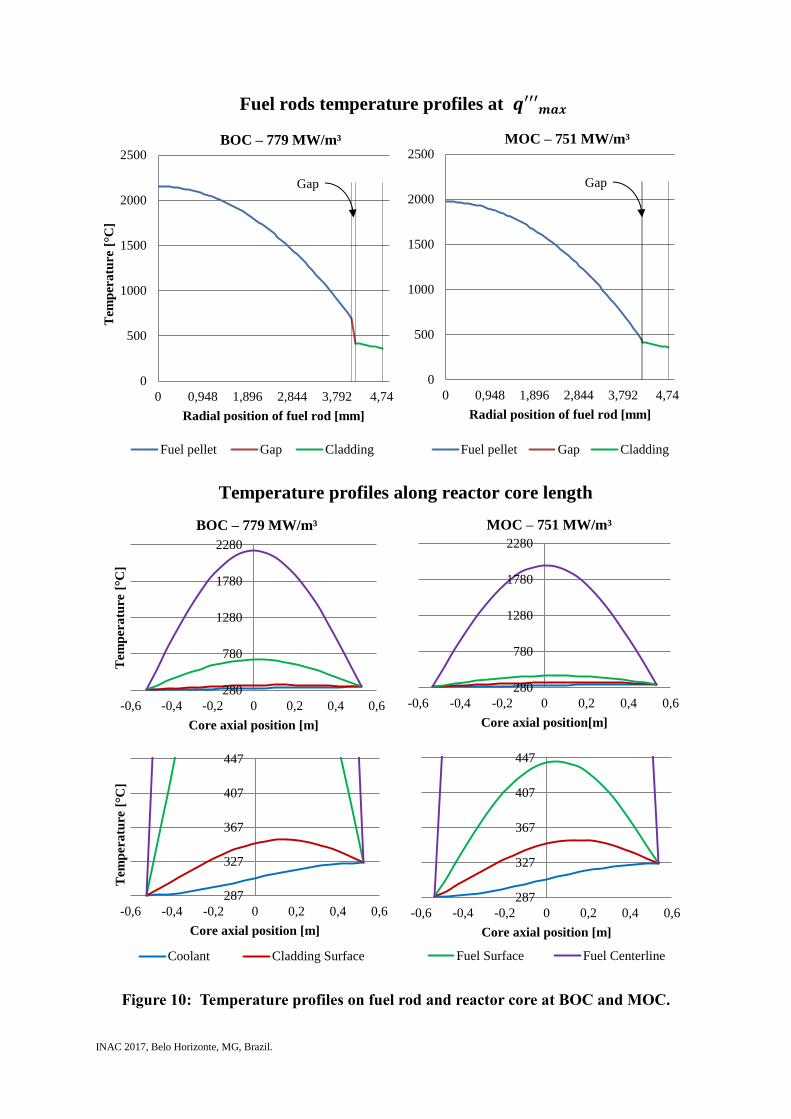
Equations 1, 2, 3 and 4 provide us the following behaviors at BOC and MOC:
INAC 2017, Belo Horizonte, MG, Brazil.
Figure 10: Temperature profiles on fuel rod and reactor core at BOC and MOC.
0
500
1000
1500
2000
2500
0 0,948 1,896 2,844 3,792 4,74
Tem
per
atu
re [
°C]
Radial position of fuel rod [mm]
Temperature profile at BOC /m³
Fuel pellet Gap Cladding
Gap
0
500
1000
1500
2000
2500
0 0,948 1,896 2,844 3,792 4,74
Radial position of fuel rod [mm]
Temperature profile at MO
Fuel pellet Gap Cladding
Gap
280
780
1280
1780
2280
-0,6 -0,4 -0,2 0 0,2 0,4 0,6
Tem
per
atu
re [
°C]
Core axial position [m]
Perfis de temperaturas para
750MW/m³ - BOC
280
780
1280
1780
2280
-0,6 -0,4 -0,2 0 0,2 0,4 0,6
Core axial position[m]
Perfis de temperaturas para
750MW/m³ - MOC
287
327
367
407
447
-0,6 -0,4 -0,2 0 0,2 0,4 0,6
Tem
per
atu
re [
°C]
Core axial position [m]
Coolant Cladding Surface
287
327
367
407
447
-0,6 -0,4 -0,2 0 0,2 0,4 0,6
Core axial position [m]
Fuel Surface Fuel Centerline
Fuel rods temperature profiles at 𝒒′′′𝒎𝒂𝒙
BOC – 779 MW/m³ MOC – 751 MW/m³
Temperature profiles along reactor core length
BOC – 779 MW/m³ MOC – 751 MW/m³

INAC 2017, Belo Horizonte, MG, Brazil.
Table 2 contains the required main data to Steam Generator analysis and to determine the
temperatures profiles:
Table 2: Angra 1 power plant steam generator data. [1,4]
Steam Generators operational data
Primary side pressure [kgf/cm²] 158
Secondary side pressure [kgf/cm²] 64,7
Primary side inlet temperature [°C] 324,3
Primary side outlet temperature [°C] 287,5
Feedwater inlet temperature [°C] 221,1
Steam outlet temperature [°C] 279,2
Steam outlet quality 0,999
Tube wall thickness [mm] 1,05
Inconel tubes thermal conductivity [W/m.°C] 12,1
Using the Equations 9, 10 and 11 it was possible to model the profiles in Microsoft Excel
software by iterations on values of the heat exchange area to determine the number of tubes
that are required to reach the operational parameters. Thus, around 990 tubes of 19,05mm
external diameter were required to these conditions.
The temperature profiles of the tubes subcooled regions are shown in the following figure.
The length of the tubes required for the secondary fluid to begin phase change was
determined at 451 mm as shown in Figure 11:
Figure 11: Temperature profile in the subcooled region of Parts 1 and 2.
The overall temperature profile in the SG tubes is shown in Figure 12. Note that in the phase
change region of the secondary fluid, the effects caused by the boiling have been neglected.
This causes the primary fluid temperature decrease following a linear behavior, while the
secondary fluid maintains the temperature during the phase change.
220
240
260
280
300
320
340
5,8 5,9 6 6,1 6,2 6,3
Tem
per
atu
re (
°C)
Tube length (m)
Primary Secondary
220
240
260
280
300
320
340
0 0,1 0,2 0,3 0,4 0,5
Tem
per
atu
re (
°C)
Tube length (m)
Primary Secondary

INAC 2017, Belo Horizonte, MG, Brazil.
Figure 12: Overall temperature profiles in SG tubes.
With the results of the analysis, was possible to develop the following table with comparative
data between studied submarine, Angra 1 and the INS Arihant to evaluate the encountered
results:
Table 3: Comparative data of nuclear submarine primary/secondary circuit
Reactor Submarine Angra1[1,4] INS Arihant* [10]
Power generated in the reactor (MWth) 85,7 1882 83
Submarine’s hull width (m) 11,7 --- 11
Number of fuel elements 21 121 13
Fuel rods in each element 235 235 348
Number of fuel rods 4935 28435 4524
Piping average diameter (mm) 215 737 ---
Average coolant flow (kg/s) 407 8950 ---
Fuel assemblies active length (m) 1,049 3,66 ---
Steam Generator Submarine Angra1[1,4] INS Arihant* [10]
Rejected heat in each SG (MWth) 42,85 943,14 ---
Secondary coolant average flow (kg/s) 23,41 515 ---
Approximated number of tubes 990 5428 ---
Tubes average length (m) 6,3 22,1 ---
Tubes external diameter (mm) 19,05 19,05 ---
* INS Arihant is India's first nuclear-powered submarine
4. CONCLUSIONS
The methodology used to calculate the thermodynamic parameters of the primary circuit of a
submarine was considered satisfactory, since the energy generated in the reactor is
comparable to the reactors used for naval propulsion [10,11] and the maximum values of
power and temperature found are lower than the limits set for safe operation [5].
The height of the SG tubes where the secondary fluid reaches saturation represents about
15% of the total height. Only for this value evaluation, assuming a constant variation of the
200
220
240
260
280
300
320
340
0 1 2 3 4 5 6
Tem
per
atu
re (
°C)
Average tube length (m)
Primary Secondary

INAC 2017, Belo Horizonte, MG, Brazil.
secondary fluid enthalpy, the saturation point is also about 15% of the total. Thus, the value
found was considered satisfactory.
Studies related to technology involving nuclear energy contribute to the Brazilian economic
and technological development. According to [12], a technology transfer agreement signed
between Brazil and France in 2009 provides for the construction of a Scorpène class nuclear
submarine. It will be the first Brazilian nuclear submarine and its construction is an entry card
for the select group of countries that dominate nuclear technology.
REFERENCES
1. Eletronuclear. Nuclear Power Plant Basic Systems – SBUN, Eletrobras Termonuclear SA,
Rio de Janeiro, Brazil (2014).
2. Incropera, Frank P, et al. Fundamentals of Heat and Mass Transfer 6th Edition, LTC, Rio
de Janeiro, Brazil (2008).
3. TODREAS, Neil E and KAZIMI, Mujid S. Nuclear Systems: Thermalhydraulic
Fundamentals, CRC Press, Florida, United States (2011).
4. Westinghouse, The Westinghouse Pressurized Water Reactor Nuclear Power Plant,
Westinghouse Nuclear Operations Division, Pennsylvania, United States (2005).
5. Westinghouse, Power Distribution Limits, Westinghouse Electric Corporation,
Pennsylvania, United States (2008).
6. Seleghim, Paulo J., Determining of temperature profiles by numerical solution of energy
balance differential equations, https://www.youtube.com/watch?v=AG7HD9wmHGM
(2014).
7. NUREG-1754, A New Comparative Analysis of LWR Fuel Designs, Office of Nuclear
Regulatory Research, Washington DC, United States (2001).
8. Poder Naval, “Brazilian Nuclear Submarine: Quo Vadis?”
http://www.naval.com.br/blog/destaque/submarinos/submarino-nuclear-brasileiro-quo-
vadis/ (2008).
9. Deagel, “Scorpene Basic-AIP Specifications”, http://www.deagel.com/Fighting-
Ships/Scorpene-Basic-AIP_a000425003.aspx (2012).
10. Naval-Technology.com, “SSBN Arihant Class Submarine, India” http://www.naval-
technology.com/projects/arihant-class/ (2017).
11. Ragheb, Magdi. Nuclear Marine Propulsion, Rensselaer Polytechnic Institute, New York
United States (2010).
12. Padilha, Luiz, “Brazilian Nuclear Submarine ‘Alvaro Alberto’ SN 10”,
http://www.defesaaereanaval.com.br/submarino-nuclear-brasileiro-alvaro-alberto-sn-10/
(2012).


![Definition of Quality of Service parameters and their ... · PDF fileLTE Long Term Evolution ... Definition of Quality of Service parameters and their computation ". [3] ... (QoS)](https://cdn.vdocuments.us/doc/165x107/5a8589f17f8b9ad30c8c73d3/definition-of-quality-of-service-parameters-and-their-long-term-evolution-.jpg)


