Evaluation of Key Elements and Options for Development of Human Health Criteria
Technical Workgroup Report November 13, 2018
FINAL
Prepared by Alaska Department of Environmental Conservation
Division of Water
Alaska Department of Environmental Conservation Human Health Criteria Technical Workgroup Report Final Draft. November 13, 2018
ii
Workgroup Participants and Affiliation
Primary Alternate
Dr. Lawrence Duffy. University of Alaska, Fairbanks
Dr. James Fall. Alaska Department of Fish and Game; Division of Subsistence
Marylynne Kostick. Alaska Department of Fish and Game; Division of Subsistence
Dr. Robert Gerlach. Alaska Department of Environmental Conservation; Environmental Health
Dr. Sandrine Deglin. Alaska Department of Health and Social Services; Division of Public Health
Brett Jokela. Anchorage Water & Wastewater Utility
John Plaskett. Anchorage Water & Wastewater Utility
Alison Kelley. NANA Regional Corporation
Michael Opheim. Seldovia Village Tribe
Nancy Sonafrank. Department of Environmental Conservation; Division of Water
Dr. Lori Verbrugge. U.S. Fish and Wildlife Service
Dr. Ted Wu. Department of Environmental Conservation; Division of Spill Prevention and Response
Dr. Kendra Zamzow. Center for Science in Public Participation
Technical support provided by:
Michelle Hale. Division of Water Director. Alaska Department of Environmental Conservation Lon Kissinger. U.S. Environmental Protection Agency Gina Shirey. Alaska Department of Environmental Conservation Matthew Szelag. U.S. Environmental Protection Agency Brock Tabor. Alaska Department of Environmental Conservation
Alaska Department of Environmental Conservation Human Health Criteria Technical Workgroup Report Final Draft. November 13, 2018
iii
Acronyms and Abbreviations
AAC Alaska Administrative Code
ADF&G Alaska Department of Fish and Game
APDES Alaska Pollutant Discharge Elimination System
AS Alaska Statute
BAF/BCF Bioaccumulation/Bioconcentration
BW Body Weight
CSIS Community Subsistence Information System
CFR Code of Federal Regulations
CWA Clean Water Act
DEC Alaska Department of Environmental Conservation
DI Drinking Water Intake
EPA U.S. Environmental Protection Agency
FCR Fish Consumption Rate
F.R. Federal Register
HHC Human Health Criteria
RfD Reference Dose
CRL Cancer Risk Level
RSC Relative Source Contribution
U.S.C. United States Code
WQC Water Quality Criteria
WQS Water Quality Standards
Alaska Department of Environmental Conservation Human Health Criteria Technical Workgroup Report Final Draft. November 13, 2018
iv
Executive Summary ........................................................................................................................................... 1
1.0 Introduction ............................................................................................................................................... 1
1.1 State and Federal Authority .................................................................................................................. 1 1.2 Definition of Water Quality Standards and Human Health Criteria .............................................. 1 1.3 State WQS Revision Efforts in the Pacific Northwest .................................................................... 5 1.4 DEC HHC Technical Workgroup ...................................................................................................... 6 1.5 Workgroup Meetings Summary ........................................................................................................... 6 1.6 Rule-Making Process ............................................................................................................................. 7
2.0 Establishment of Human Health Criteria .............................................................................................. 7
2.1 EPA Methodology ................................................................................................................................. 7 2.2 Human Health Criteria in Alaska Water Quality Standards ............................................................ 7 2.3 Need for Revising Alaska’s HHC ........................................................................................................ 9 2.4 HHC Public workshops and future opportunities ............................................................................ 9
3.0 Key Technical Issues for Consideration when Revising Human Health Criteria ............................ 9
3.1 Issues Related to Fish Consumption Rates ........................................................................................ 9
3.1.1 Issue #1: What Information about Fish Consumption and Fish Consumption Rates is Available to Inform the HHC Process? ........................................................ 10
Workgroup Recommendations – Issue #1 ...................................................................................... 12 3.1.2 Issue #2: What Aquatic Life Species Should Alaska Include When Deriving a
Fish Consumption Rate? ................................................................................................... 15 Workgroup Recommendations – Issue #2 ...................................................................................... 17 3.1.3 Issue #5: What is the Role of Relative Source Contribution (RSC) and What
Are Alaska’s Options? ........................................................................................................ 22 Workgroup Recommendations – Issue #5 ...................................................................................... 23 3.1.4 Issue #3: What is the Appropriate Population to Target for Protection? ............ 27 Workgroup Recommendations – Issue #3 ...................................................................................... 30
3.2 Additional Components of the HHC Formula ............................................................................... 33
3.2.1 Modeling approaches.......................................................................................................... 33 Workgroup Recommendations – Modeling approaches ............................................................... 34 3.2.2 Issue #4: Does Alaska’s Cancer Risk Level (CRL) Provide the Appropriate
Level of Protection to High Consumers? ..................................................................... 34 Workgroup Member Recommendations – Issue #4 ...................................................................... 36 3.2.3 Issue #6: How Should DEC Apply Bioaccumulation or Bioconcentration
Factors? .................................................................................................................................. 37 Workgroup Recommendations – Issue #6. ..................................................................................... 38
3.3 Issues Related to Implementation of HHC ..................................................................................... 40
3.3.1 Issue #7: What Options Does Alaska Have for Developing Criteria on a Statewide/Regional/Site-specific basis? ...................................................................... 40
Alaska Department of Environmental Conservation Human Health Criteria Technical Workgroup Report Final Draft. November 13, 2018
v
Workgroup Recommendations – Issue #7 ...................................................................................... 40 3.3.2 Issue #8: What Are Alaska’s Options for Implementing the Proposed Criteria
in Clean Water Act – Approved Programs?.................................................................. 42 Workgroup Recommendations – Issue #8 ...................................................................................... 43
4.0 Issues Raised by the Public .................................................................................................................... 47
APPENDIX A: Primary Regulations Involved
APPENDIX B: References
APPENDIX C: Glossary of Terms
APPENDIX D. DEC Draft Literature Review
APPENDIX E: Preliminary Regional Analysis of Fish Consumption Rate Estimates for Rural Alaska Populations
APPENDIX F: Comparison of EPA’s 2015 Final Updated Human Health AWQC and Previous AWQC
APPENDIX G: ALTERNATIVE VIEWPOINTS
Alaska Department of Environmental Conservation Human Health Criteria Technical Workgroup Report Final Draft. November 13, 2018
1
Executive Summary Human health criteria (HHC) in state water quality standards (WQS) serve as the foundation of state risk assessment and risk management efforts pertaining to the health of Alaska’s citizens through their interaction with its water resources. Revising Alaska’s HHC to reflect the latest science and science policy preferences is a priority for the Department of Environmental Conservation (DEC). DEC has initiated the revision process by formulating a technical workgroup (Workgroup) to review U.S. Environmental Protection Agency (EPA) technical and policy guidance and data specific to Alaska. The Workgroup is charged with making technical recommendations for DEC to consider during the rulemaking process.
Human Health Criteria - Without The Math
Human health criteria (HHC) are used by DEC to determine the amount of a pollutant a person can be exposed to without causing an unacceptable health risk. HHC are set low enough that the amount of a pollutant that may be present in seafood (e.g., fish) will not render fish unsafe to eat, water unsafe to drink, and the consumer will be protected if they were subject to continuous exposure over a lifetime (e.g., 70 years). ‘Unacceptable’ in this context refers to an adverse or negative effect on an individual’s health.
Fish consumption is often the most direct means of exposure that individuals will have to certain pollutants; the higher the consumption rate, the more stringent the resulting HHC values will be to achieve a given protection level. Several other factors are also considered when deriving a HHC including how much water a person may drink, how much a person weighs, and what other ways a person could be exposed to the same pollutant over the course of a lifetime.
In general, each factor has a range of numbers that states can choose from- some more conservative (i.e., stringent) while others less so. The choices states make are based on science, science policy, and risk assessment. The desired outcome is to develop HHC that consider state-specific factors and end result is a ‘balanced approach’ to protecting human health.
The Workgroup discussed and provided recommendations on nine technical issues. These can be broadly grouped into issues related to fish consumption, issues related to risk assessment, and issues related to policy implementation. For some issues alternative viewpoints were provided by certain members of the workgroup.
This report does not provide the reader with a specific fish consumption value or other HHC formula inputs that DEC intends to use for regulatory purposes but rather, describes the Workgroup discussions around potential approaches to deriving HHC, pros and cons of such approaches, potential outcomes of adopting those values, and Workgroup recommendations. This report is designed to be for informational purposes and not to be interpreted as DEC policy.
Alaska Department of Environmental Conservation Human Health Criteria Technical Workgroup Report Final Draft. November 13, 2018
2
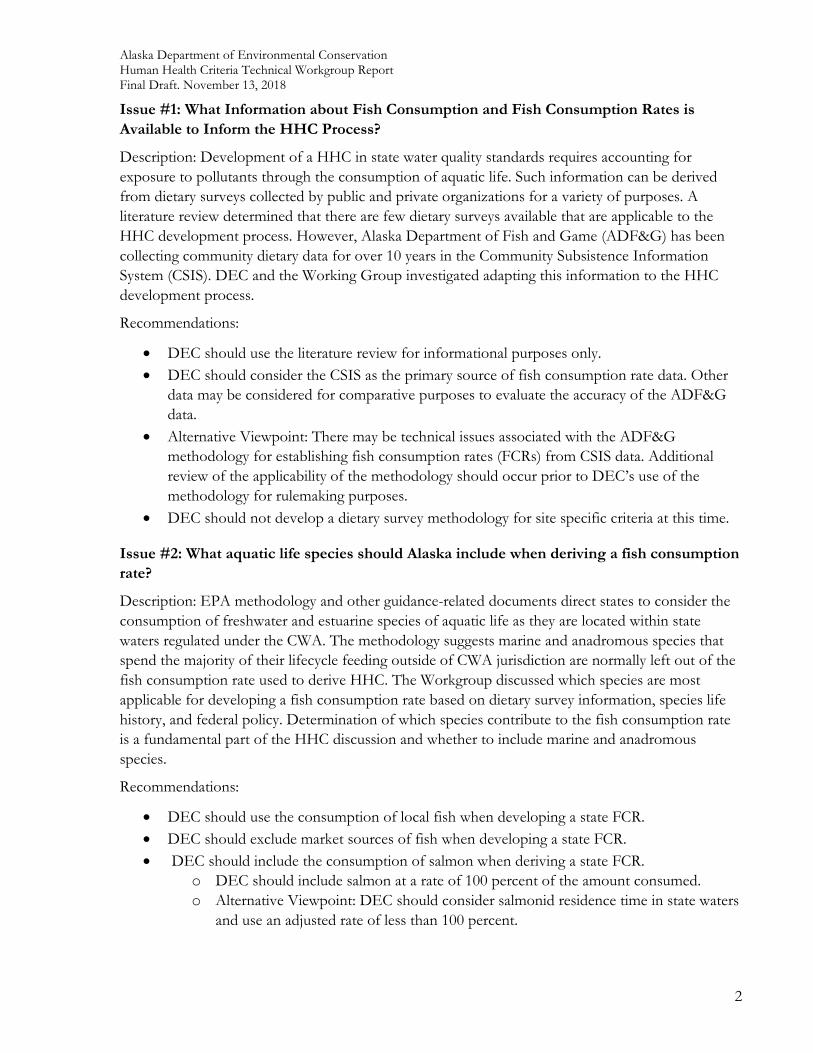
Issue #1: What Information about Fish Consumption and Fish Consumption Rates is Available to Inform the HHC Process?
Description: Development of a HHC in state water quality standards requires accounting for exposure to pollutants through the consumption of aquatic life. Such information can be derived from dietary surveys collected by public and private organizations for a variety of purposes. A literature review determined that there are few dietary surveys available that are applicable to the HHC development process. However, Alaska Department of Fish and Game (ADF&G) has been collecting community dietary data for over 10 years in the Community Subsistence Information System (CSIS). DEC and the Working Group investigated adapting this information to the HHC development process.
Recommendations:
• DEC should use the literature review for informational purposes only. • DEC should consider the CSIS as the primary source of fish consumption rate data. Other
data may be considered for comparative purposes to evaluate the accuracy of the ADF&G data.
• Alternative Viewpoint: There may be technical issues associated with the ADF&G methodology for establishing fish consumption rates (FCRs) from CSIS data. Additional review of the applicability of the methodology should occur prior to DEC’s use of the methodology for rulemaking purposes.
• DEC should not develop a dietary survey methodology for site specific criteria at this time.
Issue #2: What aquatic life species should Alaska include when deriving a fish consumption rate?
Description: EPA methodology and other guidance-related documents direct states to consider the consumption of freshwater and estuarine species of aquatic life as they are located within state waters regulated under the CWA. The methodology suggests marine and anadromous species that spend the majority of their lifecycle feeding outside of CWA jurisdiction are normally left out of the fish consumption rate used to derive HHC. The Workgroup discussed which species are most applicable for developing a fish consumption rate based on dietary survey information, species life history, and federal policy. Determination of which species contribute to the fish consumption rate is a fundamental part of the HHC discussion and whether to include marine and anadromous species.
Recommendations:
• DEC should use the consumption of local fish when developing a state FCR. • DEC should exclude market sources of fish when developing a state FCR. • DEC should include the consumption of salmon when deriving a state FCR.
o DEC should include salmon at a rate of 100 percent of the amount consumed. o Alternative Viewpoint: DEC should consider salmonid residence time in state waters
and use an adjusted rate of less than 100 percent.
Alaska Department of Environmental Conservation Human Health Criteria Technical Workgroup Report Final Draft. November 13, 2018
3
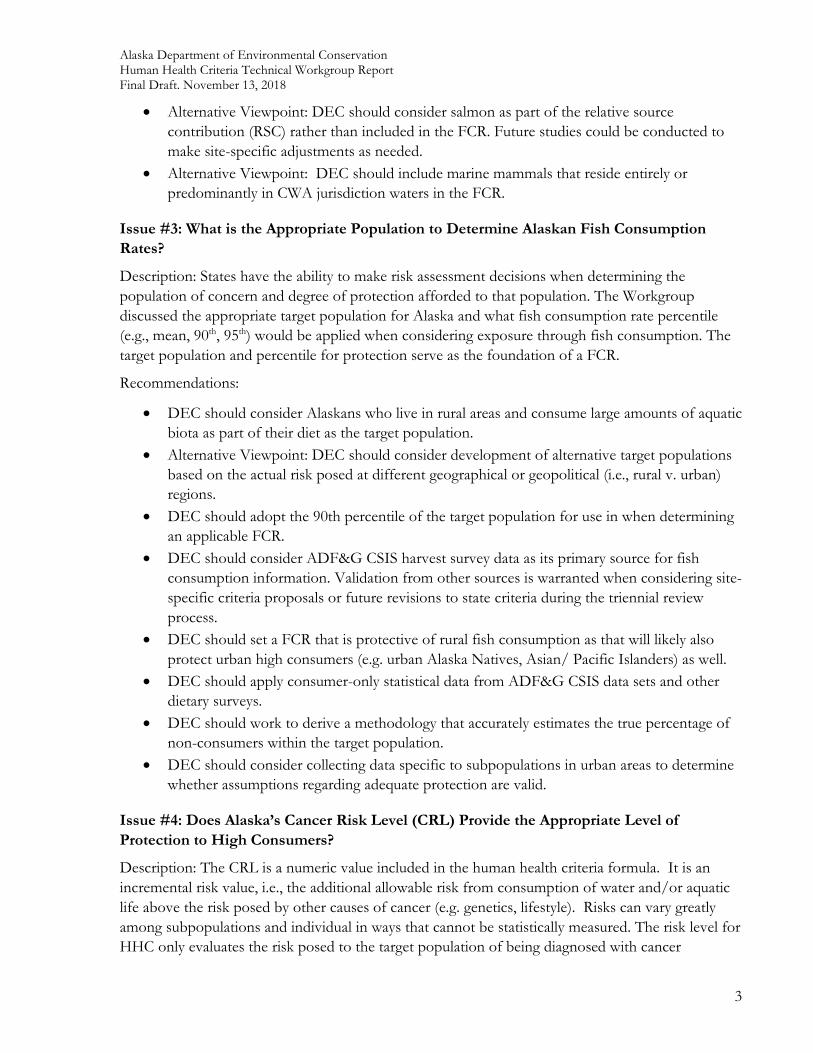
• Alternative Viewpoint: DEC should consider salmon as part of the relative source contribution (RSC) rather than included in the FCR. Future studies could be conducted to make site-specific adjustments as needed.
• Alternative Viewpoint: DEC should include marine mammals that reside entirely or predominantly in CWA jurisdiction waters in the FCR.
Issue #3: What is the Appropriate Population to Determine Alaskan Fish Consumption Rates?
Description: States have the ability to make risk assessment decisions when determining the population of concern and degree of protection afforded to that population. The Workgroup discussed the appropriate target population for Alaska and what fish consumption rate percentile (e.g., mean, 90th, 95th) would be applied when considering exposure through fish consumption. The target population and percentile for protection serve as the foundation of a FCR.
Recommendations:
• DEC should consider Alaskans who live in rural areas and consume large amounts of aquatic biota as part of their diet as the target population.
• Alternative Viewpoint: DEC should consider development of alternative target populations based on the actual risk posed at different geographical or geopolitical (i.e., rural v. urban) regions.
• DEC should adopt the 90th percentile of the target population for use in when determining an applicable FCR.
• DEC should consider ADF&G CSIS harvest survey data as its primary source for fish consumption information. Validation from other sources is warranted when considering site-specific criteria proposals or future revisions to state criteria during the triennial review process.
• DEC should set a FCR that is protective of rural fish consumption as that will likely also protect urban high consumers (e.g. urban Alaska Natives, Asian/ Pacific Islanders) as well.
• DEC should apply consumer-only statistical data from ADF&G CSIS data sets and other dietary surveys.
• DEC should work to derive a methodology that accurately estimates the true percentage of non-consumers within the target population.
• DEC should consider collecting data specific to subpopulations in urban areas to determine whether assumptions regarding adequate protection are valid.
Issue #4: Does Alaska’s Cancer Risk Level (CRL) Provide the Appropriate Level of Protection to High Consumers?
Description: The CRL is a numeric value included in the human health criteria formula. It is an incremental risk value, i.e., the additional allowable risk from consumption of water and/or aquatic life above the risk posed by other causes of cancer (e.g. genetics, lifestyle). Risks can vary greatly among subpopulations and individual in ways that cannot be statistically measured. The risk level for HHC only evaluates the risk posed to the target population of being diagnosed with cancer
Alaska Department of Environmental Conservation Human Health Criteria Technical Workgroup Report Final Draft. November 13, 2018
4
following exposure to a particular pollutant from the ingestion of surface water and/or consumption of aquatic life. The Workgroup discussed whether Alaska’s adopted value of 10-5 carcinogenic risk level is still appropriate for deriving human health criteria..
Recommendations:
• DEC should retain the existing CRL of 10-5. • Alternative Viewpoint: DEC should consider revising Alaska’s CRL to 10-6 based on the
premise that a lack of definitive information should not be a prerequisite for establishing a more conservative CRL.
Issue #5: What is the role of Relative Source Contribution (RSC) and what are Alaska’s options?
Description: While the CRL looks at the additional risk of exposure through ingestion of surface water/fish consumption, the RSC is an estimation of the exposure to a pollutant relative to how a person is exposed through other pathways (e.g., skin absorption, inhalation, other foods, and occupational exposure). The Workgroup discussed application of RSC in the HHC formula, available data on other forms of exposure, and state-specific factors are relevant to Alaska’s criteria development process. RSC are applicable to non-carcinogenic pollutants only.
Recommendations
• DEC should apply EPA-recommended RSC values when deriving HHC for non-carcinogens.
• DEC should include the consumption of marine mammals as part of the RSC and exclude them from the FCR.
• Alternative Viewpoint: DEC should include all salmon in the RSC or develop robust habitat, residence time, and exposure route data to accurately partition salmon between the RSC and FCR.
• Alternative Viewpoint: DEC should include those marine mammals that reside predominately and have demonstrated pollutant uptake in near shore waters in the FCR either in their entirety or based on a percentage of residence time and body burden.
Issue #6: How should DEC apply bioconcentration (BCF) or bioaccumulation (BAF) factors?
Description: Magnification of contaminant concentrations through absorption in water or sediment (BCF) or the food chain (BAF) was considered. The EPA 2000 HHC methodology and 2015 HHC supplemental information1 recommend that states, apply measured or estimated BAF rather than BCF, whenever available, when computing a human health criterion.
Recommendations:
1 U.S. Environmental Protection Agency. 2016. Development of National Bioaccumulation Factors: Supplemental information for EPA’s 2015 Human Health Criteria. Office of Water. Washington, D.C.
Alaska Department of Environmental Conservation Human Health Criteria Technical Workgroup Report Final Draft. November 13, 2018
5
• DEC should use EPA-recommended BAFs for deriving HHC whenever available. • DEC should apply EPA-recommended trophic level 4 BAFs for deriving HHC.
Issue #7: What Options does Alaska have for developing criteria on a statewide/regional/ site-specific basis?
Description: States have the ability to develop water quality standards at a variety of scales. The Workgroup explored the appropriate scale(s) to establish water quality criteria based on the dietary data available and applicable to the criteria development process. This is an issue of importance as the risk of exposure may vary depending on dietary behavior and resource availability.
Recommendations:
• DEC should adopt a statewide FCR. • When needed, FCRs can be adjusted using local data and existing regulatory tools such as
site-specific criteria. • Alternative Viewpoint: DEC should consider the adoption of HHC based on rural and
urban or regional FCRs rather than a statewide FCR.
Issue #8: What are Alaska’s options for implementing the proposed criteria?
Description: The Workgroup did not have specific recommendations for DEC to implementHHC in state water pollution control programs. The Workgroup acknowledged that a variety of tools are currently available in regulation or in the process of being developed (e.g., compliance schedules, water quality standards variances).
Recommendation:
• The Workgroup did not have specific recommendations regarding the tools or processes used for implementation of HHC in wastewater discharge permits or waterbody assessments.
• Alternative Viewpoint: DEC should conduct additional analysis regarding the potential number of impaired waters that would be created under different HHC scenarios and conduct a cost-benefit analysis of any proposed criteria (and decisions leading to its derivation) on the regulated community prior to rulemaking.
Alaska Department of Environmental Conservation Human Health Criteria Technical Workgroup Report Final Draft. November 13, 2018
1
1.0 Introduction 1.1 State and Federal Authority The Alaska Department of Environmental Conservation (DEC) proposes to conduct rulemaking pertaining to the Water Quality Standards (WQS) for ambient state waters (Alaska Administrative Code (18 AAC 70). Rulemaking will address two distinct areas of the WQS: (1) development and adoption of new human health criteria (HHC) and, (2) revision and expansion of implementation tools authorized by the WQS. This document provides a summary of deliberations held by the DEC HHC Technical Workgroup (Workgroup) between 2015 and 2017. The purpose of the Workgroup was to provide feedback to DEC on key technical issues associated with the development of revised HHC in state WQS.
States are required to adopt water quality standards per the Federal Water Pollution Control Act (hereinafter called the Clean Water Act or (CWA)). States adopt WQS to serve the purposes of the CWA to “restore and maintain the chemical, physical, and biological integrity of the Nation’s waters”.
Alaska Statute (AS) 46.03.020 – 120 provides DEC with the authority to adopt and apply those regulations necessary to control pollution and receive authorization to administer the CWA. AS 46.03.900 defines “waters” "as lakes, bays, sounds, ponds, impounding reservoirs, springs, wells, rivers, streams, creeks, estuaries, marshes, inlets, straits, passages, canals, the Pacific Ocean, Gulf of Alaska, Bering Sea, and Arctic Ocean, in the territorial limits of the state, and all other bodies of surface or underground water, natural or artificial, public or private, inland or coastal, fresh or salt, which are wholly or partially in or bordering the state or under the jurisdiction of the state. In accordance with 18 AAC 70.020(b): [t]he water quality standards regulate human activities that result in alterations to waters within the state’s jurisdiction.
The federal regulatory requirements governing the WQS program are published in the Code of Federal Regulations (CFR) at 40 CFR 131. EPA is required to develop and publish water quality criteria that reflect the latest scientific knowledge. EPA-recommended criteria are not rules, nor do they automatically become part of a state’s WQS.
Section 303(c) of the CWA provides the federal requirements for state WQS. Section 303(c)(2)(b) specifically requires states to adopt criteria for toxic priority pollutants. The CWA regulations direct States to adopt water quality criteria based upon the 304(a) National Recommended Water Quality Criteria, or in the State’s discretion, 304(a) criteria modified to reflect site-specific conditions or other scientifically defensible methods (40 CFR 131.11 (b)). States may adopt the criteria that EPA publishes, modify EPA’s criteria to reflect site-specific conditions, or adopt different criteria based on other scientifically-defensible methods. EPA must, however, approve any new or revised WQS adopted by a state before they can be used for CWA purposes (e.g., discharge permits, CWA 303(d) impaired waters lists).
1.2 Definition of Water Quality Standards and Human Health Criteria WQS are comprised of three elements; designated uses, numeric or narrative criteria to protect those uses, and an antidegradation policy and implementation methods for determining whether and to
Alaska Department of Environmental Conservation Human Health Criteria Technical Workgroup Report Final Draft. November 13, 2018
2
what extent the water quality may be lowered or degraded. Alaska’s designated uses and criteria are defined in 18 AAC 70.020 (Appendix A). The pollutant-specific numeric and narrative criteria are referenced at Alaska Water Quality Criteria Manual of Toxic and Other Deleterious Organic and Inorganic Substances (2008).
Human health criteria (HHC) refers to WQS criteria developed to protect humans consuming aquatic life and the water aquatic life is in. The designated uses that apply to HHC are referenced at 18 AAC 70.020(b)(11) as fresh water uses of drinking, culinary, and food processing, and growth and propagation of fish, shellfish, other aquatic life, and wildlife; and at 18 AAC 70.020(b)(23) marine water uses of aquaculture, growth and propagation of fish, shellfish, other aquatic life and wildlife, and harvesting for consumption of raw mollusks or other raw aquatic life (Appendix A).
Ambient water quality criteria for the protection of human health (hereinafter known as human health criteria (HHC)) are developed by states and EPA under CWA section 304(a). HHC are expressed as numeric concentrations of toxic substances in water and/or fish tissue that are not anticipated to cause unacceptable adverse effects to human health. The criteria are designed to protect populations who consume aquatic life, groundwater or fresh surface waters.2
The criteria are derived from EPA-developed formulas that consider the degree of toxicity a pollutant poses to human health, uncertainty regarding the pollutants’ toxicity to humans, different ways an individual can be exposed to a particular pollutant, and likelihood of exposure to the pollutant. An individual’s exposure is characterized as being exposed to a pollutant at a constant rate over the course of a ‘lifetime’ (e.g., 70 years). The criteria should be protective of populations that may have higher rates of water or fish consumption; this ensures protection of the general population as well. Exposure ‘pathways’ include drinking contaminated water and consuming contaminated fish, shellfish, or algae, as well as ‘relative source’ contributions – exposure through air, soil, or other ways a pollutant can enter a body other than through consuming aquatic life. Fish consumption rates may be the single factor with the most variability due to geographic availability, economic availability, cultural influence, and personal preferences.
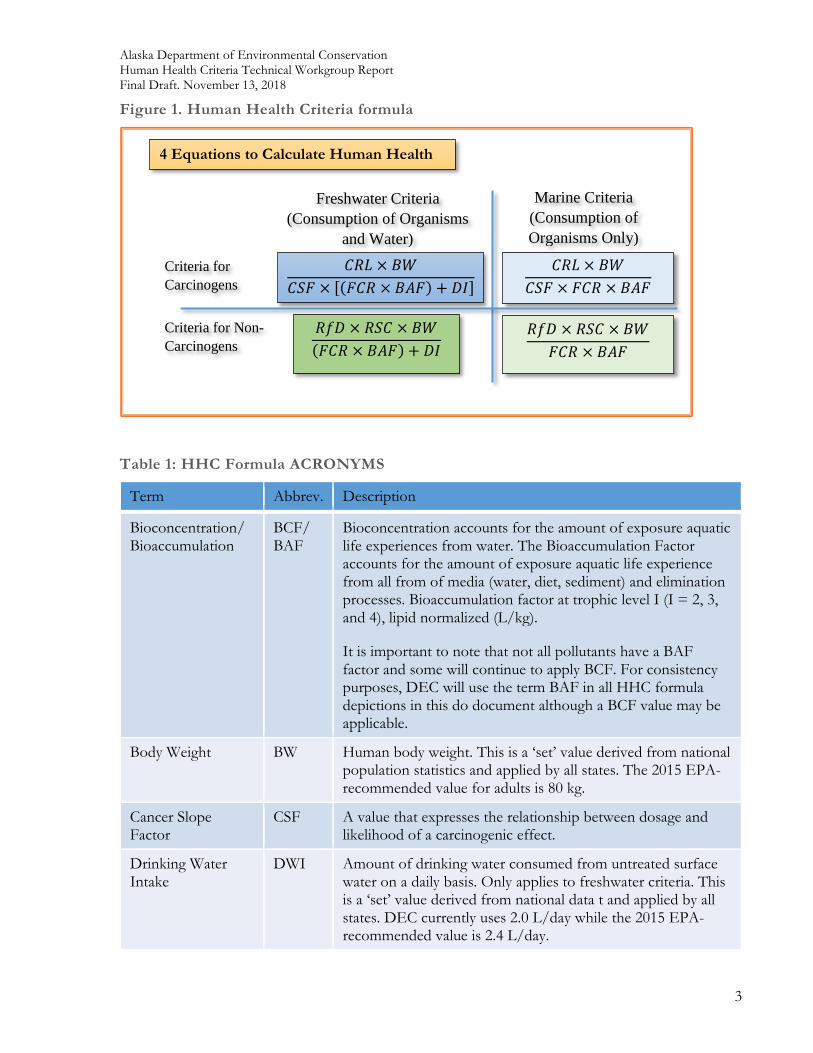
Figure 1 (following page) depicts the formula used for derivation of a human health criterion.
2 State waters defined at AS 46.04.900 and include freshwater and marine surface and groundwater within the territorial limits of the state.
Alaska Department of Environmental Conservation Human Health Criteria Technical Workgroup Report Final Draft. November 13, 2018
3
Figure 1. Human Health Criteria formula
Table 1: HHC Formula ACRONYMS
Term Abbrev. Description
Bioconcentration/ Bioaccumulation
BCF/ BAF
Bioconcentration accounts for the amount of exposure aquatic life experiences from water. The Bioaccumulation Factor accounts for the amount of exposure aquatic life experience from all from of media (water, diet, sediment) and elimination processes. Bioaccumulation factor at trophic level I (I = 2, 3, and 4), lipid normalized (L/kg).
It is important to note that not all pollutants have a BAF factor and some will continue to apply BCF. For consistency purposes, DEC will use the term BAF in all HHC formula depictions in this do document although a BCF value may be applicable.
Body Weight BW Human body weight. This is a ‘set’ value derived from national population statistics and applied by all states. The 2015 EPA-recommended value for adults is 80 kg.
Cancer Slope Factor
CSF A value that expresses the relationship between dosage and likelihood of a carcinogenic effect.
Drinking Water Intake
DWI Amount of drinking water consumed from untreated surface water on a daily basis. Only applies to freshwater criteria. This is a ‘set’ value derived from national data t and applied by all states. DEC currently uses 2.0 L/day while the 2015 EPA-recommended value is 2.4 L/day.
4 Equations to Calculate Human Health
𝐶𝐶𝐶𝐶𝐶𝐶 × 𝐵𝐵𝐵𝐵𝐶𝐶𝐶𝐶𝐶𝐶 × [(𝐶𝐶𝐶𝐶𝐶𝐶 × 𝐵𝐵𝐵𝐵𝐶𝐶) + 𝐷𝐷𝐷𝐷]
𝐶𝐶𝐶𝐶𝐶𝐶 × 𝐵𝐵𝐵𝐵
𝐶𝐶𝐶𝐶𝐶𝐶 × 𝐶𝐶𝐶𝐶𝐶𝐶 × 𝐵𝐵𝐵𝐵𝐶𝐶
𝐶𝐶𝑅𝑅𝐷𝐷 × 𝐶𝐶𝐶𝐶𝐶𝐶 × 𝐵𝐵𝐵𝐵(𝐶𝐶𝐶𝐶𝐶𝐶 × 𝐵𝐵𝐵𝐵𝐶𝐶) + 𝐷𝐷𝐷𝐷
𝐶𝐶𝑅𝑅𝐷𝐷 × 𝐶𝐶𝐶𝐶𝐶𝐶 × 𝐵𝐵𝐵𝐵
𝐶𝐶𝐶𝐶𝐶𝐶 × 𝐵𝐵𝐵𝐵𝐶𝐶
Criteria for Non-Carcinogens
Criteria for Carcinogens
Freshwater Criteria (Consumption of Organisms
and Water)
Marine Criteria (Consumption of Organisms Only)
Alaska Department of Environmental Conservation Human Health Criteria Technical Workgroup Report Final Draft. November 13, 2018
4
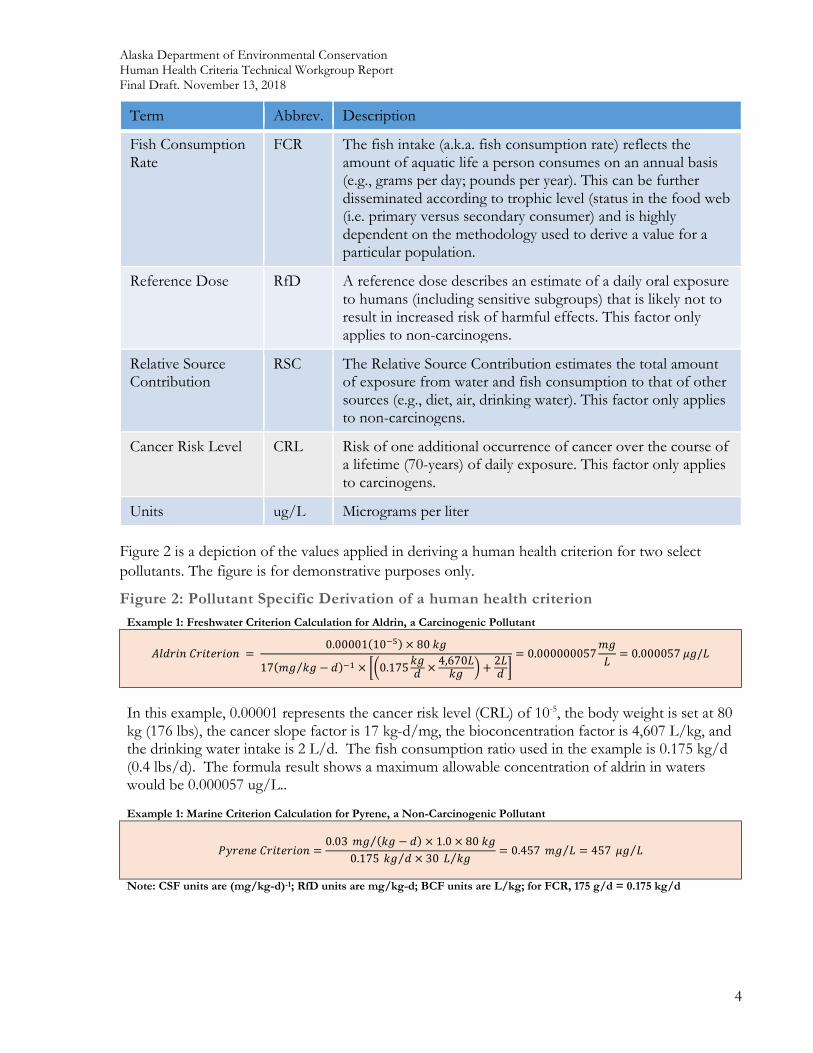
Term Abbrev. Description
Fish Consumption Rate
FCR The fish intake (a.k.a. fish consumption rate) reflects the amount of aquatic life a person consumes on an annual basis (e.g., grams per day; pounds per year). This can be further disseminated according to trophic level (status in the food web (i.e. primary versus secondary consumer) and is highly dependent on the methodology used to derive a value for a particular population.
Reference Dose RfD A reference dose describes an estimate of a daily oral exposure to humans (including sensitive subgroups) that is likely not to result in increased risk of harmful effects. This factor only applies to non-carcinogens.
Relative Source Contribution
RSC The Relative Source Contribution estimates the total amount of exposure from water and fish consumption to that of other sources (e.g., diet, air, drinking water). This factor only applies to non-carcinogens.
Cancer Risk Level CRL Risk of one additional occurrence of cancer over the course of a lifetime (70-years) of daily exposure. This factor only applies to carcinogens.
Units ug/L Micrograms per liter
Figure 2 is a depiction of the values applied in deriving a human health criterion for two select pollutants. The figure is for demonstrative purposes only.
Figure 2: Pollutant Specific Derivation of a human health criterion Example 1: Freshwater Criterion Calculation for Aldrin, a Carcinogenic Pollutant
𝐵𝐵𝐴𝐴𝐴𝐴𝐴𝐴𝐴𝐴𝐴𝐴 𝐶𝐶𝐴𝐴𝐴𝐴𝐶𝐶𝐶𝐶𝐴𝐴𝐴𝐴𝐶𝐶𝐴𝐴 = 0.00001(10−5) × 80 𝑘𝑘𝑘𝑘
17(𝑚𝑚𝑘𝑘 𝑘𝑘𝑘𝑘 − 𝐴𝐴⁄ )−1 × ��0.175𝑘𝑘𝑘𝑘𝐴𝐴 × 4,670𝐶𝐶𝑘𝑘𝑘𝑘 � + 2𝐶𝐶
𝐴𝐴 �= 0.000000057
𝑚𝑚𝑘𝑘𝐶𝐶 = 0.000057 𝜇𝜇𝑘𝑘/𝐶𝐶
In this example, 0.00001 represents the cancer risk level (CRL) of 10-5, the body weight is set at 80 kg (176 lbs), the cancer slope factor is 17 kg-d/mg, the bioconcentration factor is 4,607 L/kg, and the drinking water intake is 2 L/d. The fish consumption ratio used in the example is 0.175 kg/d (0.4 lbs/d). The formula result shows a maximum allowable concentration of aldrin in waters would be 0.000057 ug/L.. Example 1: Marine Criterion Calculation for Pyrene, a Non-Carcinogenic Pollutant
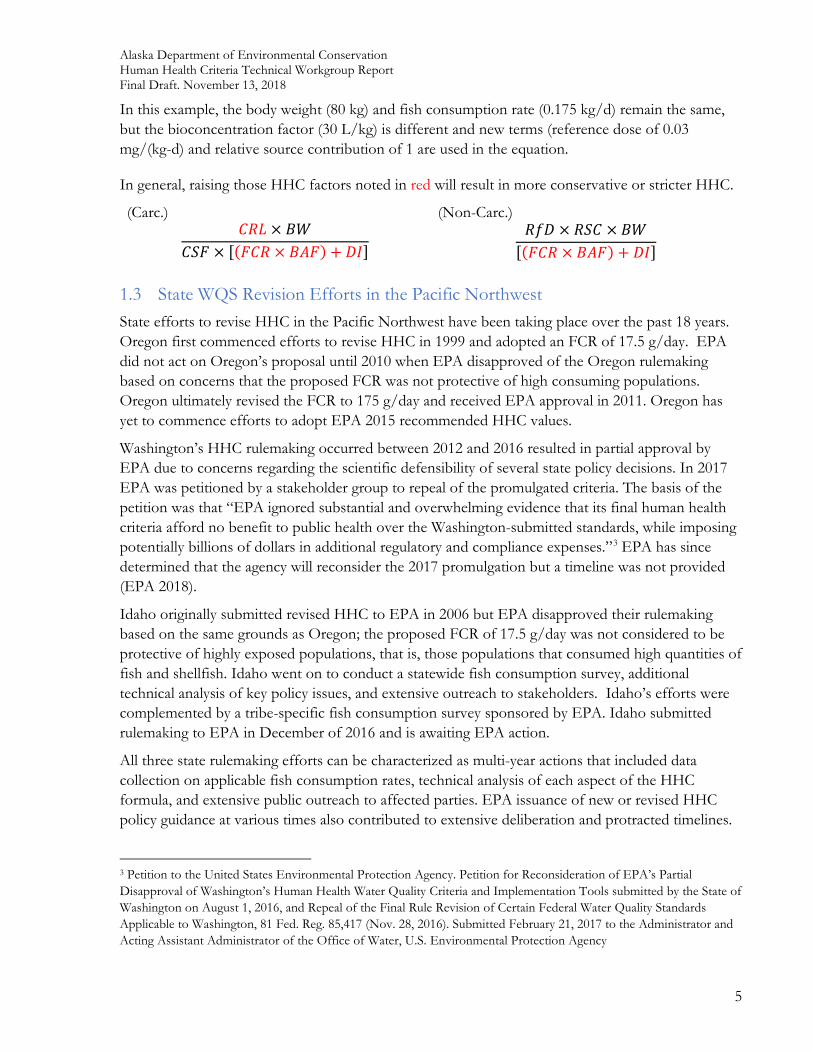
𝑃𝑃𝑃𝑃𝐴𝐴𝐶𝐶𝐴𝐴𝐶𝐶 𝐶𝐶𝐴𝐴𝐴𝐴𝐶𝐶𝐶𝐶𝐴𝐴𝐴𝐴𝐶𝐶𝐴𝐴 =0.03 𝑚𝑚𝑘𝑘 (𝑘𝑘𝑘𝑘 − 𝐴𝐴)⁄ × 1.0 × 80 𝑘𝑘𝑘𝑘
0.175 𝑘𝑘𝑘𝑘 𝐴𝐴⁄ × 30 𝐶𝐶 𝑘𝑘𝑘𝑘⁄ = 0.457 𝑚𝑚𝑘𝑘 𝐶𝐶⁄ = 457 𝜇𝜇𝑘𝑘 𝐶𝐶⁄
Note: CSF units are (mg/kg-d)-1; RfD units are mg/kg-d; BCF units are L/kg; for FCR, 175 g/d = 0.175 kg/d
Alaska Department of Environmental Conservation Human Health Criteria Technical Workgroup Report Final Draft. November 13, 2018
5
In this example, the body weight (80 kg) and fish consumption rate (0.175 kg/d) remain the same, but the bioconcentration factor (30 L/kg) is different and new terms (reference dose of 0.03 mg/(kg-d) and relative source contribution of 1 are used in the equation.
In general, raising those HHC factors noted in red will result in more conservative or stricter HHC.
(Carc.) (Non-Carc.) 𝐶𝐶𝐶𝐶𝐶𝐶 × 𝐵𝐵𝐵𝐵
𝐶𝐶𝐶𝐶𝐶𝐶 × [(𝐶𝐶𝐶𝐶𝐶𝐶 × 𝐵𝐵𝐵𝐵𝐶𝐶) + 𝐷𝐷𝐷𝐷]
𝐶𝐶𝑅𝑅𝐷𝐷 × 𝐶𝐶𝐶𝐶𝐶𝐶 × 𝐵𝐵𝐵𝐵[(𝐶𝐶𝐶𝐶𝐶𝐶 × 𝐵𝐵𝐵𝐵𝐶𝐶) + 𝐷𝐷𝐷𝐷]
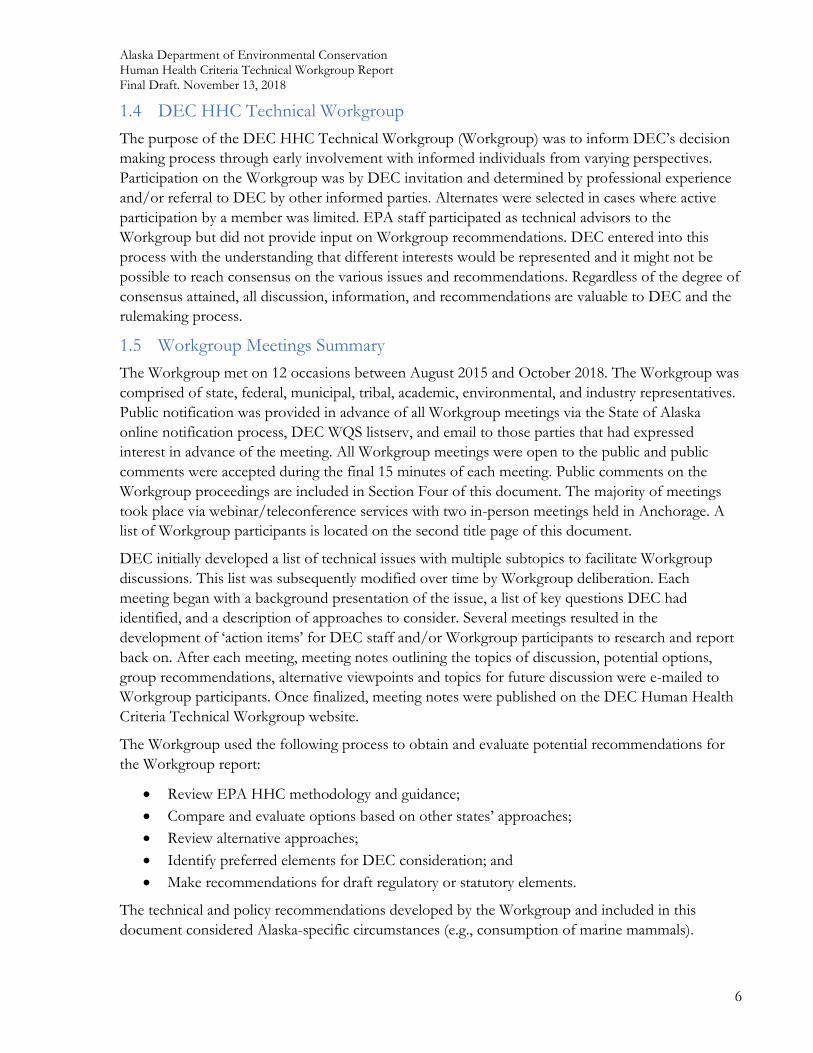
1.3 State WQS Revision Efforts in the Pacific Northwest State efforts to revise HHC in the Pacific Northwest have been taking place over the past 18 years. Oregon first commenced efforts to revise HHC in 1999 and adopted an FCR of 17.5 g/day. EPA did not act on Oregon’s proposal until 2010 when EPA disapproved of the Oregon rulemaking based on concerns that the proposed FCR was not protective of high consuming populations. Oregon ultimately revised the FCR to 175 g/day and received EPA approval in 2011. Oregon has yet to commence efforts to adopt EPA 2015 recommended HHC values.
Washington’s HHC rulemaking occurred between 2012 and 2016 resulted in partial approval by EPA due to concerns regarding the scientific defensibility of several state policy decisions. In 2017 EPA was petitioned by a stakeholder group to repeal of the promulgated criteria. The basis of the petition was that “EPA ignored substantial and overwhelming evidence that its final human health criteria afford no benefit to public health over the Washington-submitted standards, while imposing potentially billions of dollars in additional regulatory and compliance expenses.”3 EPA has since determined that the agency will reconsider the 2017 promulgation but a timeline was not provided (EPA 2018).
Idaho originally submitted revised HHC to EPA in 2006 but EPA disapproved their rulemaking based on the same grounds as Oregon; the proposed FCR of 17.5 g/day was not considered to be protective of highly exposed populations, that is, those populations that consumed high quantities of fish and shellfish. Idaho went on to conduct a statewide fish consumption survey, additional technical analysis of key policy issues, and extensive outreach to stakeholders. Idaho’s efforts were complemented by a tribe-specific fish consumption survey sponsored by EPA. Idaho submitted rulemaking to EPA in December of 2016 and is awaiting EPA action.
All three state rulemaking efforts can be characterized as multi-year actions that included data collection on applicable fish consumption rates, technical analysis of each aspect of the HHC formula, and extensive public outreach to affected parties. EPA issuance of new or revised HHC policy guidance at various times also contributed to extensive deliberation and protracted timelines.
3 Petition to the United States Environmental Protection Agency. Petition for Reconsideration of EPA’s Partial Disapproval of Washington’s Human Health Water Quality Criteria and Implementation Tools submitted by the State of Washington on August 1, 2016, and Repeal of the Final Rule Revision of Certain Federal Water Quality Standards Applicable to Washington, 81 Fed. Reg. 85,417 (Nov. 28, 2016). Submitted February 21, 2017 to the Administrator and Acting Assistant Administrator of the Office of Water, U.S. Environmental Protection Agency
Alaska Department of Environmental Conservation Human Health Criteria Technical Workgroup Report Final Draft. November 13, 2018
6
1.4 DEC HHC Technical Workgroup The purpose of the DEC HHC Technical Workgroup (Workgroup) was to inform DEC’s decision making process through early involvement with informed individuals from varying perspectives. Participation on the Workgroup was by DEC invitation and determined by professional experience and/or referral to DEC by other informed parties. Alternates were selected in cases where active participation by a member was limited. EPA staff participated as technical advisors to the Workgroup but did not provide input on Workgroup recommendations. DEC entered into this process with the understanding that different interests would be represented and it might not be possible to reach consensus on the various issues and recommendations. Regardless of the degree of consensus attained, all discussion, information, and recommendations are valuable to DEC and the rulemaking process.
1.5 Workgroup Meetings Summary The Workgroup met on 12 occasions between August 2015 and October 2018. The Workgroup was comprised of state, federal, municipal, tribal, academic, environmental, and industry representatives. Public notification was provided in advance of all Workgroup meetings via the State of Alaska online notification process, DEC WQS listserv, and email to those parties that had expressed interest in advance of the meeting. All Workgroup meetings were open to the public and public comments were accepted during the final 15 minutes of each meeting. Public comments on the Workgroup proceedings are included in Section Four of this document. The majority of meetings took place via webinar/teleconference services with two in-person meetings held in Anchorage. A list of Workgroup participants is located on the second title page of this document.
DEC initially developed a list of technical issues with multiple subtopics to facilitate Workgroup discussions. This list was subsequently modified over time by Workgroup deliberation. Each meeting began with a background presentation of the issue, a list of key questions DEC had identified, and a description of approaches to consider. Several meetings resulted in the development of ‘action items’ for DEC staff and/or Workgroup participants to research and report back on. After each meeting, meeting notes outlining the topics of discussion, potential options, group recommendations, alternative viewpoints and topics for future discussion were e-mailed to Workgroup participants. Once finalized, meeting notes were published on the DEC Human Health Criteria Technical Workgroup website.
The Workgroup used the following process to obtain and evaluate potential recommendations for the Workgroup report:
• Review EPA HHC methodology and guidance; • Compare and evaluate options based on other states’ approaches; • Review alternative approaches; • Identify preferred elements for DEC consideration; and • Make recommendations for draft regulatory or statutory elements.
The technical and policy recommendations developed by the Workgroup and included in this document considered Alaska-specific circumstances (e.g., consumption of marine mammals).
Alaska Department of Environmental Conservation Human Health Criteria Technical Workgroup Report Final Draft. November 13, 2018
7
1.6 Rule-Making Process DEC intends to use the Workgroup deliberations to inform the rule-making process. All rule-making is subject to the Administrative Procedures Act AS.62 as DEC is required to provide public notice when regulations are proposed as well as adopted into law. This process allows the public to review and comment on regulations during their development, allows DEC to make appropriate edits based upon public interests, and allows the public to learn when a regulation becomes effective. Once these rules have been adopted by the state, they must be approved by EPA for compliance with the CWA and application in state water pollution control programs.
2.0 Establishment of Human Health Criteria This section summarizes federal and state regulation of toxic pollutants with HHC in state WQS and describes DEC’s HHC derivation process.
2.1 EPA Methodology EPA issued the Methodology for Deriving Ambient Water Quality Criteria for the Protection of Human Health (EPA methodology) in 2000. The methodology requires states and authorized tribes, when adopting their HHC to use one of the four options below, listed in order of EPA preference.
1. Adopt 304(a) criteria modified to reflect site-specific local conditions 2. Adopt 304(a) criteria modified to reflect regional or state-specific conditions with similar
geography/population groups 3. Adopt 304(a) criteria modified by data from national surveys 4. Adopt EPA’s 304(a) nationally recommended criteria using EPA default values
The EPA methodology directs States and authorized Tribes to adjust water quality criteria developed under CWA section 304 to reflect local conditions or to develop their own water quality criteria using scientifically defensible methods consistent with this methodology. EPA encourages States and authorized Tribes to use the methodology to develop or revise water quality criteria to appropriately reflect local conditions. Use of national default values may not capture the actual variability present in the population of concern (e.g., sensitive populations/high-end consumers). If defaults are chosen as the basis for criteria, inherent uncertainties should be communicated to the public. EPA believes that ambient water quality criteria inherently require several risk management decisions that are, in many cases, better made at the State, Tribal, or regional level (EPA 2000).
In 2015 EPA updated recommended ambient water quality criteria for 94 toxic pollutants. The update includes revised national exposure factors (body weight, drinking water consumption rates, and consumption of aquatic life (a.k.a. fish consumption rate), bioaccumulation and/or bioconcentration factors, and toxicity factors (i.e., reference dose, cancer slope factor, and cancer risk level) (EPA 2015).
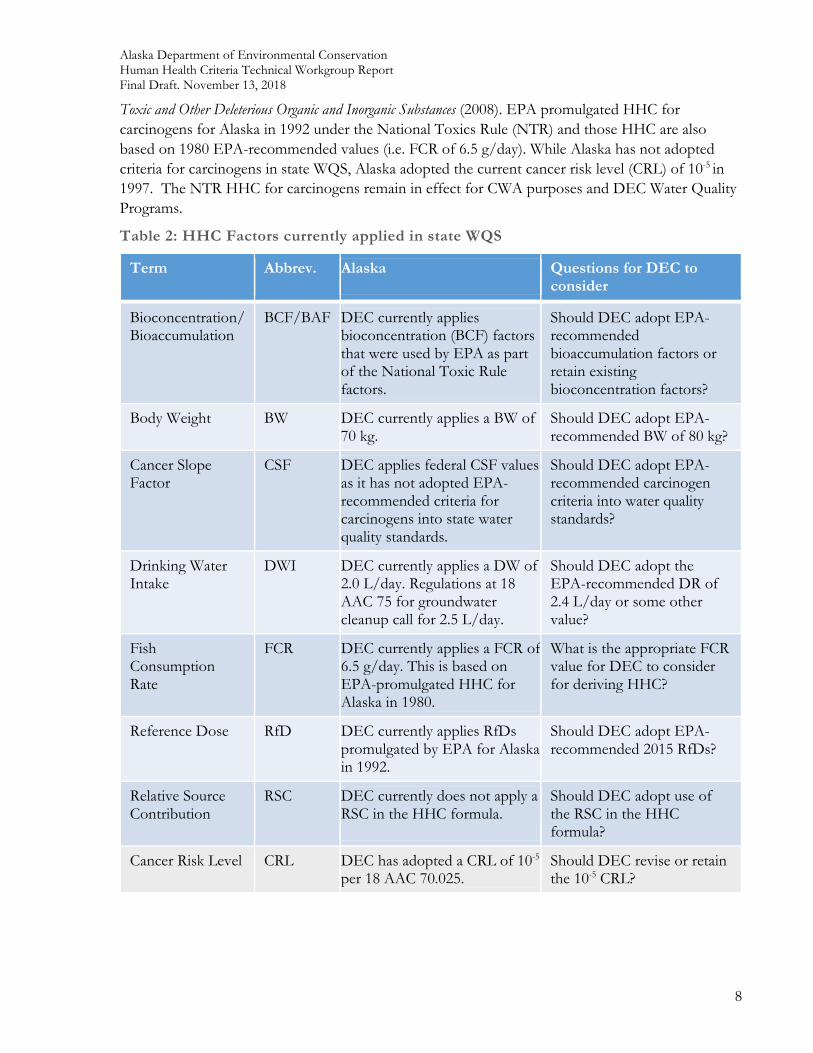
2.2 Human Health Criteria in Alaska Water Quality Standards The various inputs used to establish Alaska’s current HHC, per the EPA methodology, are noted in Table 2. As of the date of this report, HHC for non-carcinogenic pollutants are based on 1980 EPA-recommended values and adopted by reference to the Alaska Water Quality Criteria Manual for
Alaska Department of Environmental Conservation Human Health Criteria Technical Workgroup Report Final Draft. November 13, 2018
8
Toxic and Other Deleterious Organic and Inorganic Substances (2008). EPA promulgated HHC for carcinogens for Alaska in 1992 under the National Toxics Rule (NTR) and those HHC are also based on 1980 EPA-recommended values (i.e. FCR of 6.5 g/day). While Alaska has not adopted criteria for carcinogens in state WQS, Alaska adopted the current cancer risk level (CRL) of 10-5 in 1997. The NTR HHC for carcinogens remain in effect for CWA purposes and DEC Water Quality Programs.
Table 2: HHC Factors currently applied in state WQS
Term Abbrev. Alaska Questions for DEC to consider
Bioconcentration/ Bioaccumulation
BCF/BAF DEC currently applies bioconcentration (BCF) factors that were used by EPA as part of the National Toxic Rule factors.
Should DEC adopt EPA-recommended bioaccumulation factors or retain existing bioconcentration factors?
Body Weight BW DEC currently applies a BW of 70 kg.
Should DEC adopt EPA-recommended BW of 80 kg?
Cancer Slope Factor
CSF DEC applies federal CSF values as it has not adopted EPA-recommended criteria for carcinogens into state water quality standards.
Should DEC adopt EPA-recommended carcinogen criteria into water quality standards?
Drinking Water Intake
DWI DEC currently applies a DW of 2.0 L/day. Regulations at 18 AAC 75 for groundwater cleanup call for 2.5 L/day.
Should DEC adopt the EPA-recommended DR of 2.4 L/day or some other value?
Fish Consumption Rate
FCR DEC currently applies a FCR of 6.5 g/day. This is based on EPA-promulgated HHC for Alaska in 1980.
What is the appropriate FCR value for DEC to consider for deriving HHC?
Reference Dose RfD DEC currently applies RfDs promulgated by EPA for Alaska in 1992.
Should DEC adopt EPA-recommended 2015 RfDs?
Relative Source Contribution
RSC DEC currently does not apply a RSC in the HHC formula.
Should DEC adopt use of the RSC in the HHC formula?
Cancer Risk Level CRL DEC has adopted a CRL of 10-5
per 18 AAC 70.025. Should DEC revise or retain the 10-5 CRL?
Alaska Department of Environmental Conservation Human Health Criteria Technical Workgroup Report Final Draft. November 13, 2018
9
2.3 Need for Revising Alaska’s HHC EPA and the general public have notified DEC via the triennial review4 and other forums that the formulaic factors used to establish HHC do not represent local or regional exposure values (e.g., FCRs in Alaska). As a result of these concerns, DEC determined that revising the state HHC is an issue of priority for the department.
2.4 HHC Public workshops and future opportunities DEC held a HHC public workshop in Anchorage on October 29-30, 2015 in Anchorage, Alaska. Members of the Workgroup, APDES permittees, and the general public were in attendance. The workshop focused on the role of HHC, DEC’s proposed process for revising the criteria, and key technical concerns that may arise when implementing of the criteria. The workshop included speakers from ADF&G, EPA, Idaho Department of Environmental Quality, Seldovia Village Tribe, and Washington Ecology who have been actively involved in the development of fish consumption rates and state rulemaking efforts.
DEC anticipates an extensive outreach effort in 2019 will occur following the release of the Workgroup report and prior to the development of draft rulemaking language. Such outreach is expected to include additional public workshops and presentations to key interest groups. Outreach will target Alaska tribes and those APDES permittees that would be affected by these regulations. Both efforts would be designed to provide an understanding of the sources of data DEC is considering, range of technical and policy options available, and ways to provide comments to DEC.
3.0 Key Technical Issues for Consideration when Revising Human Health Criteria
DEC identified key technical issues for the Workgroup to consider and develop recommendations for DEC to consider during rulemaking. This section provides a brief description of those issues and summarizes the Workgroup recommendation(s). As many of the issues are interrelated, references are made to discussions that occurred at various times during the process.
Essentially, HHC will be a statement, codified in Alaska state regulations, about the concentration of pollutants in fishable waters that is safe when consumers are eating the fish and drinking water.
3.1 Issues Related to Fish Consumption Rates This section specifically addresses:
• (Issue #1) What information is available about FCR? • (Issue #2) Which species should be included in a state FCR? • (Issue #5) What is the role of the RSC?
4 In accordance with Section 303(c)(1) of the federal Clean Water Act, the Alaska Department of Environmental Conservation (DEC) conducts a comprehensive review of the state water quality standards (WQS) in 18 AAC 70 every three years (“triennial review”). The review evaluates the need to update or revise the pollution limits set for Alaska's waters by integrating the latest science, technology, policy, and federal requirements into the regulatory process.
Alaska Department of Environmental Conservation Human Health Criteria Technical Workgroup Report Final Draft. November 13, 2018
10
• (Issue #3) What is the appropriate target population to base an FCR?
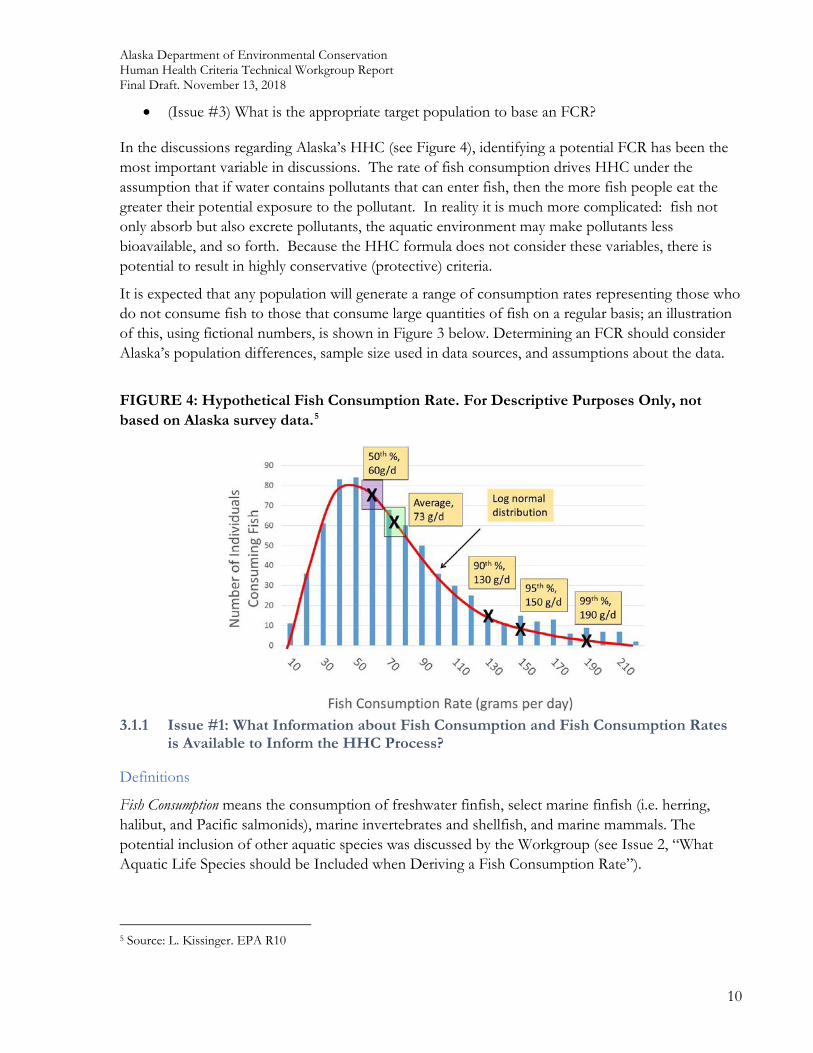
In the discussions regarding Alaska’s HHC (see Figure 4), identifying a potential FCR has been the most important variable in discussions. The rate of fish consumption drives HHC under the assumption that if water contains pollutants that can enter fish, then the more fish people eat the greater their potential exposure to the pollutant. In reality it is much more complicated: fish not only absorb but also excrete pollutants, the aquatic environment may make pollutants less bioavailable, and so forth. Because the HHC formula does not consider these variables, there is potential to result in highly conservative (protective) criteria.
It is expected that any population will generate a range of consumption rates representing those who do not consume fish to those that consume large quantities of fish on a regular basis; an illustration of this, using fictional numbers, is shown in Figure 3 below. Determining an FCR should consider Alaska’s population differences, sample size used in data sources, and assumptions about the data.
FIGURE 4: Hypothetical Fish Consumption Rate. For Descriptive Purposes Only, not based on Alaska survey data.5
3.1.1 Issue #1: What Information about Fish Consumption and Fish Consumption Rates is Available to Inform the HHC Process?
Definitions
Fish Consumption means the consumption of freshwater finfish, select marine finfish (i.e. herring, halibut, and Pacific salmonids), marine invertebrates and shellfish, and marine mammals. The potential inclusion of other aquatic species was discussed by the Workgroup (see Issue 2, “What Aquatic Life Species should be Included when Deriving a Fish Consumption Rate”).
5 Source: L. Kissinger. EPA R10
Alaska Department of Environmental Conservation Human Health Criteria Technical Workgroup Report Final Draft. November 13, 2018
11
Fish Consumption Rates or (FCR) means the amount of aquatic life (e.g., finfish, marine invertebrates, marine mammals) consumed by humans within a given time period established through the use of a dietary survey instrument. For the purposes of HHC, it is listed as grams per day (gpd); 100 grams is about ¼ lb.
Population of Concern means a specific part of the general population that is selected for specific study or protection. For example, people that consume high amounts of fish, or children with low body weight relative to the general population.
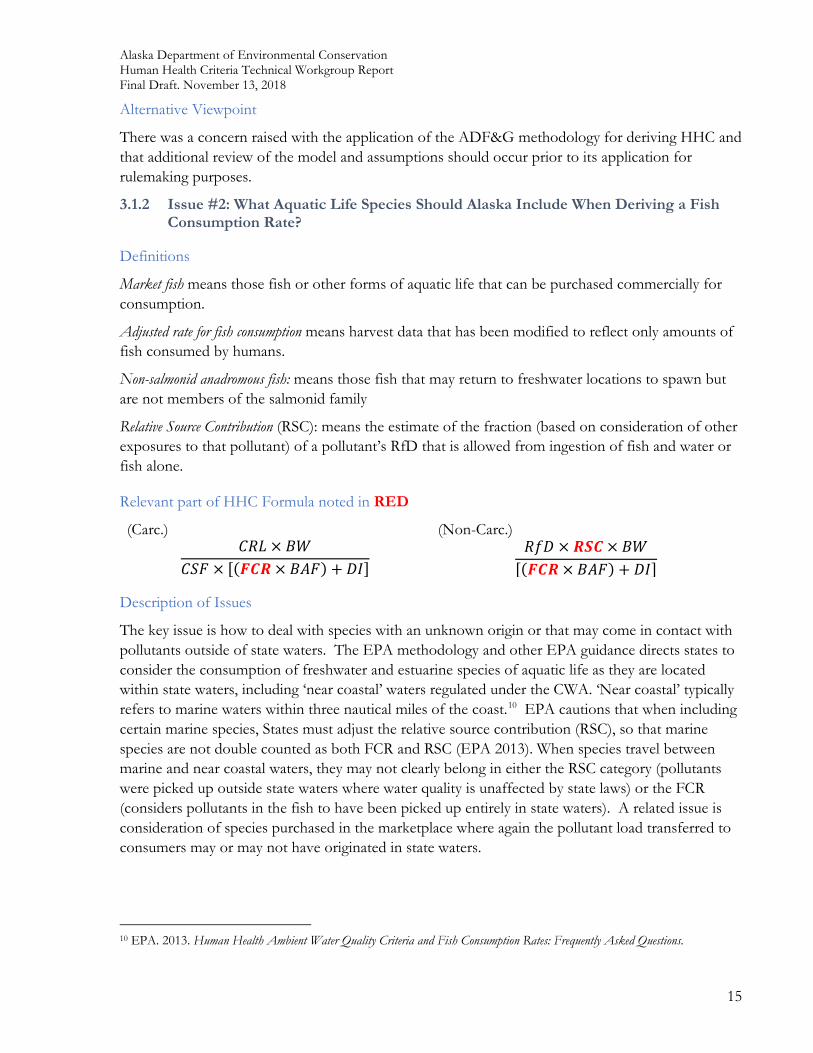
Relevant part of HHC Formula noted in RED
(Carc.) (Non-Carc.) 𝐶𝐶𝐶𝐶𝐶𝐶 × 𝐵𝐵𝐵𝐵
𝐶𝐶𝐶𝐶𝐶𝐶 × [(𝑭𝑭𝑭𝑭𝑭𝑭 × 𝐵𝐵𝐵𝐵𝐶𝐶) + 𝐷𝐷𝐷𝐷]
𝐶𝐶𝑅𝑅𝐷𝐷 × 𝐶𝐶𝐶𝐶𝐶𝐶 × 𝐵𝐵𝐵𝐵[(𝑭𝑭𝑭𝑭𝑭𝑭 × 𝐵𝐵𝐵𝐵𝐶𝐶) + 𝐷𝐷𝐷𝐷]
Description of Issue
FCRs are typically derived through use of dietary surveys and statistical instruments. Dietary surveys will have varying degrees of statistical strength, data reliability, and predictive capacity depending on their purpose and execution. Information specific to their development is provided in the EPA (2016) Guidance for Conducting Fish Consumption Surveys.
To determine what Alaska-specific dietary survey data was available, DEC contracted with The Cadmus Group to conduct a literature review of dietary information that identified fish consumption patterns. The literature review recommended that while the available literature may inform the DEC process, there is insufficient Alaska-specific dietary information currently published to accurately determine a state FCR for rulemaking purposes.
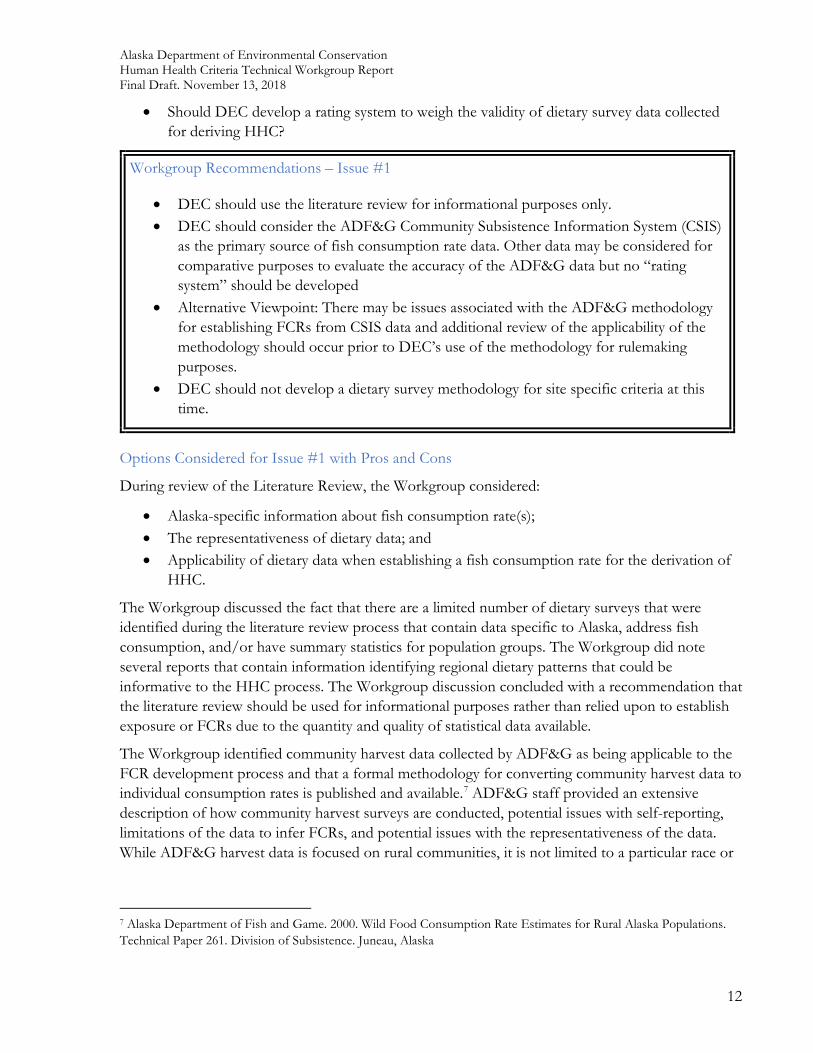
ADF&G Division of Subsistence (ADF&G) provided information related to the development of FCRs at different spatial scales based on data in the Community Subsistence Information System database (CSIS).6 This data was collected from community harvest surveys for 108 rural Alaska communities and could be used as a surrogate for dietary survey data specific to fish consumption rates.
The Workgroup considered the following questions while discussing this issue:
• What is the role of the DEC HHC literature review? • Should the literature review be a one-time report or an ongoing catalogue of dietary data? • When should DEC finalize the report? • How should or should not the data in the literature review be used in the HHC rulemaking
process? • Should DEC endorse one particular means of collecting dietary data or develop a state-
specific dietary survey methodology?
6 http://www.adfg.alaska.gov/sb/CSIS/
Alaska Department of Environmental Conservation Human Health Criteria Technical Workgroup Report Final Draft. November 13, 2018
12
• Should DEC develop a rating system to weigh the validity of dietary survey data collected for deriving HHC?
Workgroup Recommendations – Issue #1
• DEC should use the literature review for informational purposes only. • DEC should consider the ADF&G Community Subsistence Information System (CSIS)
as the primary source of fish consumption rate data. Other data may be considered for comparative purposes to evaluate the accuracy of the ADF&G data but no “rating system” should be developed
• Alternative Viewpoint: There may be issues associated with the ADF&G methodology for establishing FCRs from CSIS data and additional review of the applicability of the methodology should occur prior to DEC’s use of the methodology for rulemaking purposes.
• DEC should not develop a dietary survey methodology for site specific criteria at this time.
Options Considered for Issue #1 with Pros and Cons
During review of the Literature Review, the Workgroup considered:
• Alaska-specific information about fish consumption rate(s); • The representativeness of dietary data; and • Applicability of dietary data when establishing a fish consumption rate for the derivation of
HHC.
The Workgroup discussed the fact that there are a limited number of dietary surveys that were identified during the literature review process that contain data specific to Alaska, address fish consumption, and/or have summary statistics for population groups. The Workgroup did note several reports that contain information identifying regional dietary patterns that could be informative to the HHC process. The Workgroup discussion concluded with a recommendation that the literature review should be used for informational purposes rather than relied upon to establish exposure or FCRs due to the quantity and quality of statistical data available.
The Workgroup identified community harvest data collected by ADF&G as being applicable to the FCR development process and that a formal methodology for converting community harvest data to individual consumption rates is published and available.7 ADF&G staff provided an extensive description of how community harvest surveys are conducted, potential issues with self-reporting, limitations of the data to infer FCRs, and potential issues with the representativeness of the data. While ADF&G harvest data is focused on rural communities, it is not limited to a particular race or
7 Alaska Department of Fish and Game. 2000. Wild Food Consumption Rate Estimates for Rural Alaska Populations. Technical Paper 261. Division of Subsistence. Juneau, Alaska
Alaska Department of Environmental Conservation Human Health Criteria Technical Workgroup Report Final Draft. November 13, 2018
13
ethnicity but rather considers all members of a typical community and generally achieves a sample size of 80 to 90 percent of the resident population in any given community.
ADF&G demonstrated how they use the ADF&G methodology for converting CSIS data to FCRs and established FCR percentiles for rural, regional and statewide populations based on harvest by community, species harvested, and percentage of diet. 8 ADF&G provided a variety of scenarios that considered consumption of Pacific salmonids, select marine fish, freshwater fish, marine invertebrates, and marine mammals as these aquatic species reside in Alaskan waters and are harvested for human consumption.
ADF&G CSIS data collection only occurs in areas defined by the Joint Board of Fisheries and Game [AS 16.05.258(c)] as subsistence areas or ‘rural’. CSIS-derived FCRs are not available for non-subsistence areas or ‘urban’ settings (i.e. Ketchikan, Juneau, Anchorage, or Fairbanks). These areas are illustrated in Figure 5 on the following page. Estimates of urban population harvests of fish in subsistence, personal use, and sport fisheries can be developed based on permit-specific statistics developed by the ADF&G Division of Sportfish. This data was not readily available for the Workgroup deliberations.
FIGURE 5: Subsistence (Rural) and Non-Subsistence (Urban) Areas in Alaska
In addition to completing an analysis of CSIS data, ADF&G also reviewed the Assessment of Cook Inlet Tribe Subsistence Consumption (2012) study conducted by the Seldovia Village Tribe (Seldovia) under an EPA-approved Quality Assurance Project Plan. ADF&G compared CSIS-derived FCR estimates to FCR estimates for those communities considered in the Seldovia study derived using EPA dietary survey guidance. The ADF&G - Seldovia comparison demonstrated that despite
8 Ibid
Alaska Department of Environmental Conservation Human Health Criteria Technical Workgroup Report Final Draft. November 13, 2018
14
differences in methodology (i.e. sample selection, dietary recall versus harvest and use recall) the two approaches produced comparable FCRs.9
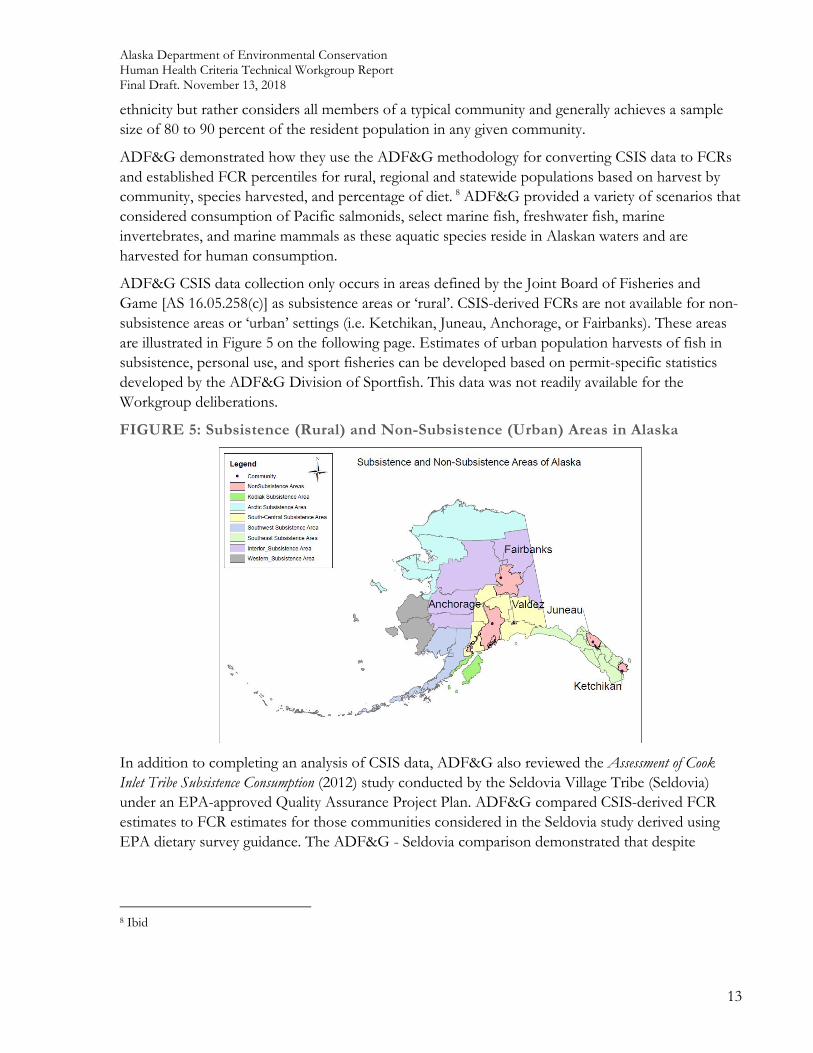
Although probability distribution curves were not developed by ADF&G, percentiles of FCR and species consumed were calculated. A sample from the ADF&G FCR report is located in Figure 6 below. The report in its entirety is available in Appendix D of this document.
Figure 6. Mean, 90th percentile, and 95th percentile fish consumption rate estimates per capita (grams per day) comparisons for consumers of salmon, nonmarine fish, and marine invertebrates by region, Alaska.
The Workgroup briefly considered whether DEC should develop an Alaska-specific dietary survey methodology for the collection and derivation of FCR data. EPA noted that revised guidance on how to conduct a dietary survey was available but that states and tribes are welcome to develop guidance according to their specific needs. The Workgroup discussed how regional differences (e.g., coastal versus interior communities) may be significant but the basic principles in survey design provide the fundamentals behind a good product. The Workgroup consensus was that while Alaska-specific guidance is desirable, it is not essential to the rulemaking process as dietary survey protocols are readily available from EPA Indian General Assistance Program (IGAP) and the EPA (2016) Guidance for Conducting Fish Consumption Surveys.
The Workgroup also discussed how FCR data would be incorporated into future DEC rulemaking efforts. The Workgroup recommended that FCR data should be accepted by DEC on a “rolling” basis and incorporated according to need. This may include periodic updates to FCRs/HHC via the triennial review process of the CWA or establishment of site-specific criteria.
9 Alaska Department of Fish and Game. Powerpoint™ Presentation to HHC TWG. September 2015. Retrieved at http://dec.alaska.gov/water/FCWQS/HumanHealthCriteriaTechWG.html on August 24, 2017.
Alaska Department of Environmental Conservation Human Health Criteria Technical Workgroup Report Final Draft. November 13, 2018
15
Alternative Viewpoint
There was a concern raised with the application of the ADF&G methodology for deriving HHC and that additional review of the model and assumptions should occur prior to its application for rulemaking purposes.
3.1.2 Issue #2: What Aquatic Life Species Should Alaska Include When Deriving a Fish Consumption Rate?
Definitions
Market fish means those fish or other forms of aquatic life that can be purchased commercially for consumption.
Adjusted rate for fish consumption means harvest data that has been modified to reflect only amounts of fish consumed by humans.
Non-salmonid anadromous fish: means those fish that may return to freshwater locations to spawn but are not members of the salmonid family
Relative Source Contribution (RSC): means the estimate of the fraction (based on consideration of other exposures to that pollutant) of a pollutant’s RfD that is allowed from ingestion of fish and water or fish alone.
Relevant part of HHC Formula noted in RED
(Carc.) (Non-Carc.) 𝐶𝐶𝐶𝐶𝐶𝐶 × 𝐵𝐵𝐵𝐵
𝐶𝐶𝐶𝐶𝐶𝐶 × [(𝑭𝑭𝑭𝑭𝑭𝑭 × 𝐵𝐵𝐵𝐵𝐶𝐶) + 𝐷𝐷𝐷𝐷]
𝐶𝐶𝑅𝑅𝐷𝐷 × 𝑭𝑭𝑹𝑹𝑭𝑭 × 𝐵𝐵𝐵𝐵[(𝑭𝑭𝑭𝑭𝑭𝑭 × 𝐵𝐵𝐵𝐵𝐶𝐶) + 𝐷𝐷𝐷𝐷]
Description of Issues
The key issue is how to deal with species with an unknown origin or that may come in contact with pollutants outside of state waters. The EPA methodology and other EPA guidance directs states to consider the consumption of freshwater and estuarine species of aquatic life as they are located within state waters, including ‘near coastal’ waters regulated under the CWA. ‘Near coastal’ typically refers to marine waters within three nautical miles of the coast.10 EPA cautions that when including certain marine species, States must adjust the relative source contribution (RSC), so that marine species are not double counted as both FCR and RSC (EPA 2013). When species travel between marine and near coastal waters, they may not clearly belong in either the RSC category (pollutants were picked up outside state waters where water quality is unaffected by state laws) or the FCR (considers pollutants in the fish to have been picked up entirely in state waters). A related issue is consideration of species purchased in the marketplace where again the pollutant load transferred to consumers may or may not have originated in state waters.
10 EPA. 2013. Human Health Ambient Water Quality Criteria and Fish Consumption Rates: Frequently Asked Questions.
Alaska Department of Environmental Conservation Human Health Criteria Technical Workgroup Report Final Draft. November 13, 2018
16
EPA 2013 Frequently Asked Questions:
It is not necessary for the FCR to include fish and shellfish species designated as marine species, as that exposure is addressed by relative source contribution. However, partitioning of fish and shellfish into the different habitats in order to develop an FCR can only be done where sufficient data are available for this to be done in a scientifically defensible manner.
In an effort to determine how best to establish a FCR that was both scientifically and technically defensible, the Workgroup considered the following questions:
• Should Alaska include all fish consumed, including store-bought fish (‘market basket approach’),) or only base a fish consumption rate on the consumption of locally-sourced (e.g., state waters) fish?
• Should Alaska include all shellfish? • Should seaweeds be included? • How should Alaska address anadromous species (other than salmonids)? • How should Alaska address salmonids in the derivation of FCRs? • If Alaska was to include salmonids should it:
o Use a full consumption rate in which consumption is weighted equally as freshwater-species?
o Use adjusted (i.e., fraction of total) rate for salmonids species to account for time within state waters (e.g., within three miles of shore) and percentage of body burden acquired during residency in state waters?
o Exclude salmonids as part of the FCR but include them as part of the RSC (similar to the approach used to derive the nationally recommended FCRs)?
Alaska Department of Environmental Conservation Human Health Criteria Technical Workgroup Report Final Draft. November 13, 2018
17
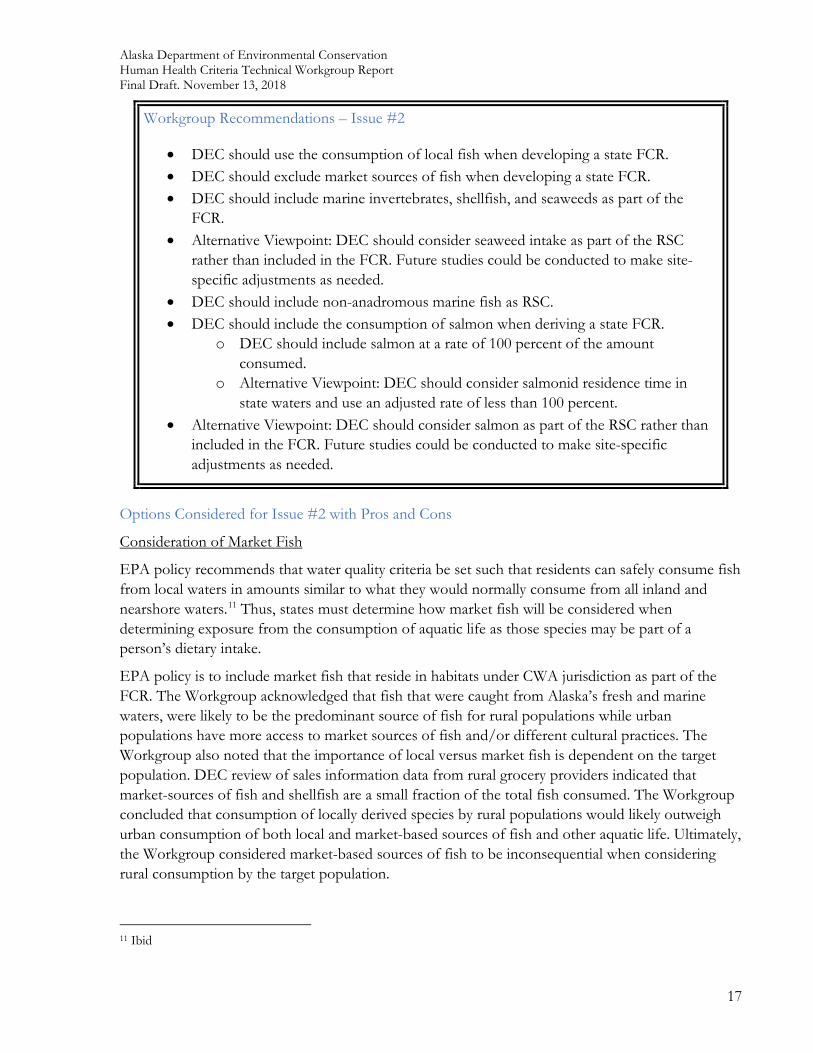
Workgroup Recommendations – Issue #2
• DEC should use the consumption of local fish when developing a state FCR. • DEC should exclude market sources of fish when developing a state FCR. • DEC should include marine invertebrates, shellfish, and seaweeds as part of the
FCR. • Alternative Viewpoint: DEC should consider seaweed intake as part of the RSC
rather than included in the FCR. Future studies could be conducted to make site-specific adjustments as needed.
• DEC should include non-anadromous marine fish as RSC. • DEC should include the consumption of salmon when deriving a state FCR.
o DEC should include salmon at a rate of 100 percent of the amount consumed.
o Alternative Viewpoint: DEC should consider salmonid residence time in state waters and use an adjusted rate of less than 100 percent.
• Alternative Viewpoint: DEC should consider salmon as part of the RSC rather than included in the FCR. Future studies could be conducted to make site-specific adjustments as needed.
Options Considered for Issue #2 with Pros and Cons
Consideration of Market Fish
EPA policy recommends that water quality criteria be set such that residents can safely consume fish from local waters in amounts similar to what they would normally consume from all inland and nearshore waters.11 Thus, states must determine how market fish will be considered when determining exposure from the consumption of aquatic life as those species may be part of a person’s dietary intake.
EPA policy is to include market fish that reside in habitats under CWA jurisdiction as part of the FCR. The Workgroup acknowledged that fish that were caught from Alaska’s fresh and marine waters, were likely to be the predominant source of fish for rural populations while urban populations have more access to market sources of fish and/or different cultural practices. The Workgroup also noted that the importance of local versus market fish is dependent on the target population. DEC review of sales information data from rural grocery providers indicated that market-sources of fish and shellfish are a small fraction of the total fish consumed. The Workgroup concluded that consumption of locally derived species by rural populations would likely outweigh urban consumption of both local and market-based sources of fish and other aquatic life. Ultimately, the Workgroup considered market-based sources of fish to be inconsequential when considering rural consumption by the target population.
11 Ibid
Alaska Department of Environmental Conservation Human Health Criteria Technical Workgroup Report Final Draft. November 13, 2018
18
Consideration of coastal marine fish
EPA has clarified in the EPA 2013 FAQ that those species of nearshore (e.g., reside within state waters) may be considered as part of a state fish consumption rate. While is not necessary for states to include all marine species that may reside in coastal/estuarine waters as part of the FCR, it is advantageous for states to have data available to determine which habitat a species predominately resides in to be able to make those decisions defensible. The Workgroup did not address this issue in great detail as the information available indicated that while some species like rockfish spend their entire livers near shore, certain coastal/estuarine species such as salmon, halibut, and herring which do not necessarily reside predominately in nearshore waters, comprised the majority of coastal marine species consumed.
Consideration of shellfish, non-salmon anadromous fish, and aquatic plants
Some benthic invertebrates are known to absorb pollutants, and bioaccumulate certain pollutants depending on their pollutant properties.
Workgroup deliberations indicated that freshwater invertebrates, including freshwater shellfish, should be included in the FCR. Marine invertebrates known to be sedentary in coastal waters should also be included. This would encompass clams, sea urchins, chitons, and mussels. Herring eggs and aquatic plants (i.e., seaweed) could also be included as these foods generally reside in and are harvested within state waters. Market sourced (e.g., store bought sushi wrappers) seaweed and similar products would be excluded in a manner similar to other market-sourced seafood.
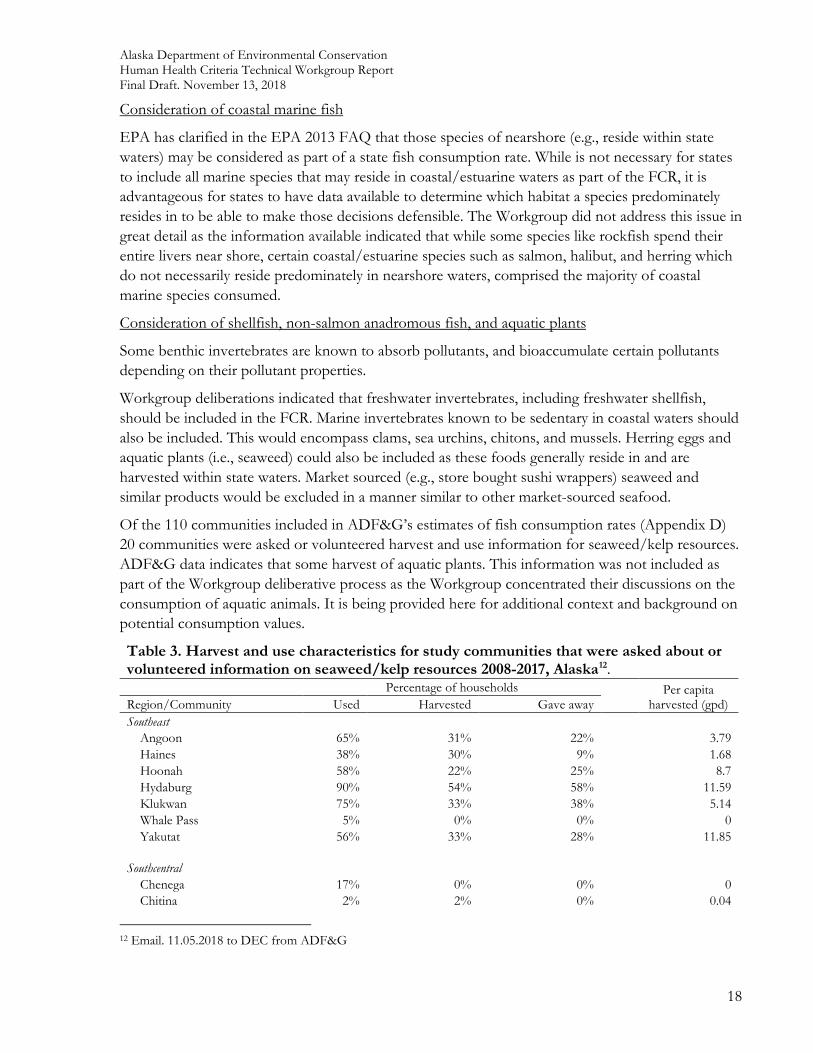
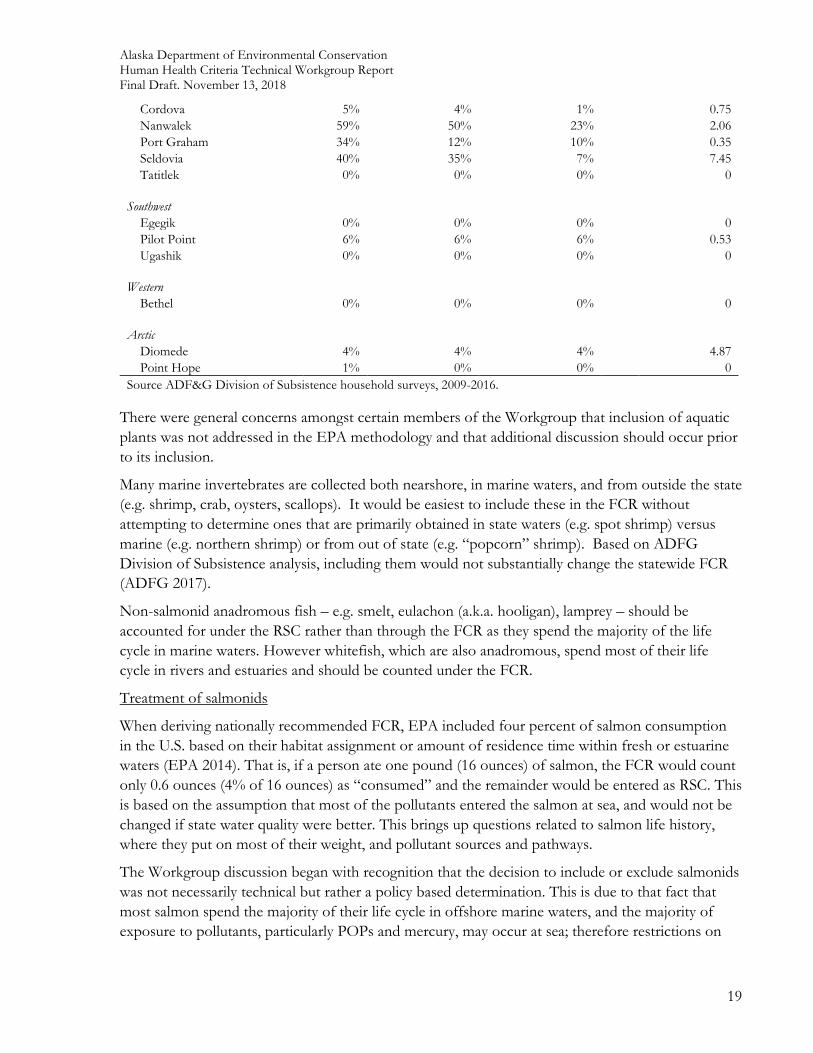
Of the 110 communities included in ADF&G’s estimates of fish consumption rates (Appendix D) 20 communities were asked or volunteered harvest and use information for seaweed/kelp resources. ADF&G data indicates that some harvest of aquatic plants. This information was not included as part of the Workgroup deliberative process as the Workgroup concentrated their discussions on the consumption of aquatic animals. It is being provided here for additional context and background on potential consumption values.
Table 3. Harvest and use characteristics for study communities that were asked about or volunteered information on seaweed/kelp resources 2008-2017, Alaska12. Percentage of households Per capita
harvested (gpd) Region/Community Used Harvested Gave away Southeast
Angoon 65% 31% 22% 3.79 Haines 38% 30% 9% 1.68 Hoonah 58% 22% 25% 8.7 Hydaburg 90% 54% 58% 11.59 Klukwan 75% 33% 38% 5.14 Whale Pass 5% 0% 0% 0 Yakutat 56% 33% 28% 11.85
Southcentral Chenega 17% 0% 0% 0 Chitina 2% 2% 0% 0.04
12 Email. 11.05.2018 to DEC from ADF&G
Alaska Department of Environmental Conservation Human Health Criteria Technical Workgroup Report Final Draft. November 13, 2018
19
Cordova 5% 4% 1% 0.75 Nanwalek 59% 50% 23% 2.06 Port Graham 34% 12% 10% 0.35 Seldovia 40% 35% 7% 7.45 Tatitlek 0% 0% 0% 0
Southwest Egegik 0% 0% 0% 0 Pilot Point 6% 6% 6% 0.53 Ugashik 0% 0% 0% 0
Western Bethel 0% 0% 0% 0
Arctic Diomede 4% 4% 4% 4.87 Point Hope 1% 0% 0% 0
Source ADF&G Division of Subsistence household surveys, 2009-2016.
There were general concerns amongst certain members of the Workgroup that inclusion of aquatic plants was not addressed in the EPA methodology and that additional discussion should occur prior to its inclusion.
Many marine invertebrates are collected both nearshore, in marine waters, and from outside the state (e.g. shrimp, crab, oysters, scallops). It would be easiest to include these in the FCR without attempting to determine ones that are primarily obtained in state waters (e.g. spot shrimp) versus marine (e.g. northern shrimp) or from out of state (e.g. “popcorn” shrimp). Based on ADFG Division of Subsistence analysis, including them would not substantially change the statewide FCR (ADFG 2017).
Non-salmonid anadromous fish – e.g. smelt, eulachon (a.k.a. hooligan), lamprey – should be accounted for under the RSC rather than through the FCR as they spend the majority of the life cycle in marine waters. However whitefish, which are also anadromous, spend most of their life cycle in rivers and estuaries and should be counted under the FCR.
Treatment of salmonids
When deriving nationally recommended FCR, EPA included four percent of salmon consumption in the U.S. based on their habitat assignment or amount of residence time within fresh or estuarine waters (EPA 2014). That is, if a person ate one pound (16 ounces) of salmon, the FCR would count only 0.6 ounces (4% of 16 ounces) as “consumed” and the remainder would be entered as RSC. This is based on the assumption that most of the pollutants entered the salmon at sea, and would not be changed if state water quality were better. This brings up questions related to salmon life history, where they put on most of their weight, and pollutant sources and pathways.
The Workgroup discussion began with recognition that the decision to include or exclude salmonids was not necessarily technical but rather a policy based determination. This is due to that fact that most salmon spend the majority of their life cycle in offshore marine waters, and the majority of exposure to pollutants, particularly POPs and mercury, may occur at sea; therefore restrictions on
Alaska Department of Environmental Conservation Human Health Criteria Technical Workgroup Report Final Draft. November 13, 2018
20
discharges to state waters would not impact the pollutant body burden of salmon or reduce the pollutants that enter consumers through consumption of salmon. However, salmonids represent a substantial part of most rural population diets13 and are a key part of the Alaskan cultural landscape.
Key questions were:
• Where do salmon acquire pollutants – and to what extent does this occur in state waters? • What type of pollutants are acquired, and are they pollutants that DEC has included in
discharge permits?
The DEC/DHSS fish tissue monitoring program does conduct some sampling for certain pollutants but has not attempted to identify the source(s) of pollutants found in samples taken as part of the DEC/DHSS Fish Tissue Monitoring Program. What studies have been done in regards to pollutant tracking typically focus on methylmercury rather than the full suite of pollutants with HHC assigned to them.14 DHSS and DEC have issued fish consumption guidelines for Alaska that generally allow more consumption than generic EPA guidance due to the health benefits associated with the consumption of fish and the fact that wild Alaska salmon, the fish most consumed by Alaskans, have far lower mercury levels than those used to develop federal guidance.15
DEC developed a whitepaper on pollutants to be regulated with HHC that have been permitted or documented in wastewater discharges to Alaska waters.16 The whitepaper reviewed federal and state databases and determined that the majority of pollutants discharged were poly-aromatic hydrocarbons or metals/metalloids. Other types of pollutants found in Alaska were attributed to ‘legacy sources’ (e.g., DDT, PCBs) that are no longer manufactured and discharges of new types of pollutants such as pharmaceuticals and perfluorooctyl sulfonate/perfluorooctanoic acid (PFOS/PFOA). Legacy pollutants remain within the Alaskan food web due to their long residence time in sediments and bioaccumulation in the tissues of aquatic species.
The Workgroup raised questions regarding habitat requirements for the different species of salmon and how that could affect pollutant concentration in fish tissue. Pink, Sockeye, and Chinook salmon were identified as species that may spend a significant amount of residence time in nearshore state waters. DEC contacted ADF&G Sportfish Division for additional information on salmonid biology and the potential for acquiring a significant portion of their total body mass while in state waters. ADF&G Sportfish informed DEC that there are a multitude of issues associated with trying to attribute a particular percentage of salmonid body burden to waters under state jurisdiction. ADF&G Sportfish also noted that there are resident stocks of Chinook salmon that may not migrate
13 Salmon account for 32% of total harvest of food stuffs in rural communities on a statewide basis (ADF&G 2016) but vary widely between different regions as demonstrated in the ADF&G (2018) CSIS data summary.
14 http://dec.alaska.gov/eh/vet/FTMP.html
15 Division of Public Health. 2014. A Risk Management Strategy to Optimize the Public’s Health. Alaska Department of Health and Social Services, Section of Epidemiology. State of Alaska
16 DEC draft White Paper: Chemicals in Alaska with Human Health Criteria. December 1, 2016. Retrieved at http://dec.alaska.gov/water/FCWQS/HumanHealthCriteriaTechWG.html
Alaska Department of Environmental Conservation Human Health Criteria Technical Workgroup Report Final Draft. November 13, 2018
21
to open ocean but rather spend the majority of their adult life within state waters in Southeast Alaska.17 This is similar to research conducted in Puget Sound that identified the presence of PCBs in Chinook stocks determined to reside in state waters for an extended period of time.18
There was concern amongst the Workgroup that the inclusion of salmon would be inconsistent with the EPA methodology and counter to known information on the lifecycle of salmon species. As the majority of salmonid stocks spend a limited time in state waters, general inclusion may overestimate the degree of risk from exposure to pollutants from discharges to state waters by inflating the relevant FCR estimate.
The majority of the Workgroup ultimately concluded that salmonids should be fully included in the fish consumption rate. The basis of this decision was based on:
• ADF&G information that certain stocks of salmonids may spend the majority of their lifecycle within state waters;
• The challenge of attempting to differentiate the actual body burden acquired by different salmonids within state waters versus that of offshore waters (>3 miles); and
• Possible objection by the public to excluding salmonids as part of the Alaska FCR when salmon are such a large part of Alaskan diets.
Alternative Viewpoint
There was concern that inclusion of salmon as part of the FCR was based on public perception, rather than based on evidence that fish were exposed to pollutants within state waters, and that this recommendation was not scientifically defensible. There were also concerns with inclusion of salmonids at 100% as this value would suggest to the public that the entirety of their body burden (and any pollutant loading) is acquired in state waters and the pollutant burden could be reduced through state action, e.g. limits on wastewater discharge permits.
Inadequate link between human health and exposure of salmon to water quality in jurisdictional waters.
While many rural communities harvest salmon, the relationship between local water quality and exposure of potential pollutants to the salmon, and therefore the risk of exposure to salmon consumers is obscure. Juvenile salmon and smolt will be exposed to fresh waters under the jurisdiction of the CWA for only a small portion of their lives. A Pacific salmon smolt might grow to, say, 50 grams (1.8 ounces) in fresh water, then leave the watershed only to return 2 to 5 years later with a mass ranging from one kilogram (2.2 lbs) to more than 20 kilograms (44 lbs), depending on species. The ratio of mass derived from feeding in jurisdictional waters to total body mass upon return is estimated to range from 1:20 to as little as 1:400. Even if salmon retained pollutants
17 Email communication with J. Nichols, Research Coordinator, ADF&G Sport Fish Division, Southeast Region. 11-03-2016. 18 O’Neill, Sandra M., James E. West, James C. Hoeman. 1998. “Spatial Trends in the Concentration of Polychlorinated Biphenyls (PCBs) in Chinook (Oncorhynchus tshawytscha) and Coho Salmon (O. kisutch) in Puget Sound and Factors Affecting PCB Accumulation: Results from the Puget Sound Ambient Monitoring Program.” Puget Sound Research ’98 Proceedings, Seattle, Washington, Volume 1, pages 312-328. Adapted from page 316, Table 1.
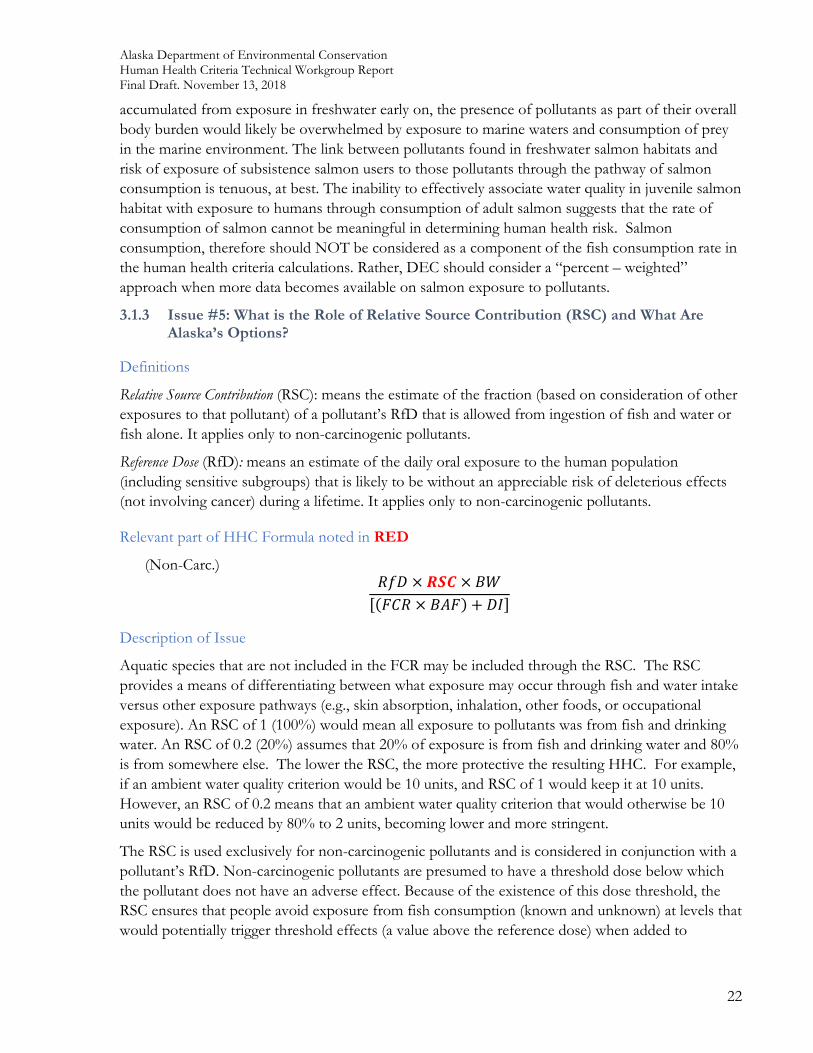
Alaska Department of Environmental Conservation Human Health Criteria Technical Workgroup Report Final Draft. November 13, 2018
22
accumulated from exposure in freshwater early on, the presence of pollutants as part of their overall body burden would likely be overwhelmed by exposure to marine waters and consumption of prey in the marine environment. The link between pollutants found in freshwater salmon habitats and risk of exposure of subsistence salmon users to those pollutants through the pathway of salmon consumption is tenuous, at best. The inability to effectively associate water quality in juvenile salmon habitat with exposure to humans through consumption of adult salmon suggests that the rate of consumption of salmon cannot be meaningful in determining human health risk. Salmon consumption, therefore should NOT be considered as a component of the fish consumption rate in the human health criteria calculations. Rather, DEC should consider a “percent – weighted” approach when more data becomes available on salmon exposure to pollutants.
3.1.3 Issue #5: What is the Role of Relative Source Contribution (RSC) and What Are Alaska’s Options?
Definitions
Relative Source Contribution (RSC): means the estimate of the fraction (based on consideration of other exposures to that pollutant) of a pollutant’s RfD that is allowed from ingestion of fish and water or fish alone. It applies only to non-carcinogenic pollutants.
Reference Dose (RfD): means an estimate of the daily oral exposure to the human population (including sensitive subgroups) that is likely to be without an appreciable risk of deleterious effects (not involving cancer) during a lifetime. It applies only to non-carcinogenic pollutants.
Relevant part of HHC Formula noted in RED
(Non-Carc.) 𝐶𝐶𝑅𝑅𝐷𝐷 × 𝑭𝑭𝑹𝑹𝑭𝑭 × 𝐵𝐵𝐵𝐵
[(𝐶𝐶𝐶𝐶𝐶𝐶 × 𝐵𝐵𝐵𝐵𝐶𝐶) + 𝐷𝐷𝐷𝐷]
Description of Issue
Aquatic species that are not included in the FCR may be included through the RSC. The RSC provides a means of differentiating between what exposure may occur through fish and water intake versus other exposure pathways (e.g., skin absorption, inhalation, other foods, or occupational exposure). An RSC of 1 (100%) would mean all exposure to pollutants was from fish and drinking water. An RSC of 0.2 (20%) assumes that 20% of exposure is from fish and drinking water and 80% is from somewhere else. The lower the RSC, the more protective the resulting HHC. For example, if an ambient water quality criterion would be 10 units, and RSC of 1 would keep it at 10 units. However, an RSC of 0.2 means that an ambient water quality criterion that would otherwise be 10 units would be reduced by 80% to 2 units, becoming lower and more stringent.
The RSC is used exclusively for non-carcinogenic pollutants and is considered in conjunction with a pollutant’s RfD. Non-carcinogenic pollutants are presumed to have a threshold dose below which the pollutant does not have an adverse effect. Because of the existence of this dose threshold, the RSC ensures that people avoid exposure from fish consumption (known and unknown) at levels that would potentially trigger threshold effects (a value above the reference dose) when added to
Alaska Department of Environmental Conservation Human Health Criteria Technical Workgroup Report Final Draft. November 13, 2018
23
exposures from different environmental sources. In other words, RSC is an estimate of the fraction of a pollutant’s RfD that is allowed from ingestion of fish and water or fish alone with the remaining fraction of the RfD being allocated to other pollutant exposures (e.g. consumption of marine organisms, ambient air, skin absorption, and occupational exposures). RSC can be considered as a fraction or a percentage (e.g., 0.20 or 20 percent). If exposures from other sources are determined to be minimal, then more exposure can be allowed for the ingestion of aquatic life and surface water and the RSC will be a larger fraction.
The Workgroup considered the following questions while discussing this issue:
• Is use of the RSC concept appropriate when WQS only apply to actions associated with the CWA?
• What species (e.g., salmon, marine mammals) should be in FCR vs the RSC? • What pollutant exposure information is available other than consumption of water and
aquatic life? • Is there enough information available and flexibility within EPA to adjust RSC values to be
more or less stringent than EPA recommendations?
Workgroup Recommendations – Issue #5 • DEC should apply EPA-recommended RSC values when deriving HHC for non-
carcinogens. • DEC should include the consumption of marine mammals as part of the RSC and
exclude them from the FCR • Alternative Viewpoint: DEC should include all salmon in the RSC or develop robust
habitat, residence time, and exposure route data to partition salmon between the RSC and FCR.
• Alternative Viewpoint: DEC should include those marine mammals that reside predominately and have demonstrated pollutant uptake in near shore waters in the FCR either in their entirety or based on a percentage of residence time and body burden.
• For those pollutants known to bioaccumulate in marine mammal tissues, the Workgroup recommended that the RSC should be set to the lowest allowed level (0.2).
Options Considered for Issue #5 with Pros and Cons
Workgroup deliberations began with the role of RSC and application to non-carcinogens, but not for carcinogens. The Workgroup brought up the fact that some pollutants have both carcinogenic and non-carcinogenic responses that should be accounted for. EPA does consider both cancer and non-cancer endpoints for pollutants with both types of toxicity and recommends state regulation of the more stringent of the two possible criteria.
Alaska Department of Environmental Conservation Human Health Criteria Technical Workgroup Report Final Draft. November 13, 2018
24
The Workgroup discussed whether the RSC was (1) the appropriate mechanism for addressing other sources of pollutants in the environment (e.g., air, occupational exposure) based on the limited geographical scope of state regulations and (2) the financial cost of advanced treatment to achieve a minor reduction of overall pollution sources.
The Workgroup recognized the utility of the RSC when considering exposure to a particular pollutant from various media; however, there was concern that the EPA recommended values were somewhat arbitrary and did not necessarily reflect actual exposure to pollutants. This is due in part to the role of bioaccumulation and the degree to which bioaccumulation varies by pollutant, trophic level, or organ. The Workgroup raised specific concerns pertaining to populations that may already exceed the reference dose for some pollutants due to their diet (e.g., consumption of certain marine mammal organs) and that applying the RSC would not alleviate that exposure.
Additional discussion focused on the pros and cons of addressing market fish, salmonids and marine mammals through RSC or FCR. The Workgroup acknowledged Oregon and Washington have set a precedent by including salmonids as part of the FCR rather than the RSC. As mentioned previously, the majority of the Workgroup ultimately concluded that inclusion of salmonids as part of the FCR was advantageous due to anecdotal information suggesting longer stock-specific residence time in state waters and public perception regarding the consumption of salmonids.
Workgroup ultimately recommended use of EPA-derived RSC values with no pollutant-specific adjustments at this time.
Consumption of marine mammals
The role of marine mammal consumption was raised at multiple Workgroup meetings. Certain marine species are consumed in Alaska and known to bioaccumulate certain pollutants at higher rates than other forms of aquatic life. The consumption of marine mammals is fairly unique to Alaska and was not considered during the development of the EPA 2000 guidance or other relevant EPA documentation. As previously discussed, marine mammal consumption is significant in some regions but the data on marine mammal life cycle and pollutant uptake in jurisdictional waters is currently inconclusive or unavailable. The ADF&G CSIS data established consumption rates for marine mammals (e.g., seals, sea lion, beluga, and bowhead whale) and determined that consumption rates were higher in coastal regions but not necessarily isolated to just coastal communities as ADF&G research has demonstrated that bartering networks do exist between coastal and interior communities for these foodstuffs.
The question posed to the Workgroup was whether marine mammals constitute part of the FCR or should be considered an alternative pathway of exposure and be included as a part of RSC.
One challenge associated with marine mammal consumption is that certain pollutants may be present in different concentrations within different tissues and organs within an individual animal. For example, metals like cadmium may accumulate in high concentrations in liver and kidney, but have concentrations in other tissues that are hundreds of times lower than in organ meats. In contrast, organic pollutants such as polychlorinated biphenyls and organochlorine pesticides are found in fatty tissues such as blubber, at concentrations hundreds of times higher than in other tissues. In order to accurately characterize human exposures to pollutants via marine mammal
Alaska Department of Environmental Conservation Human Health Criteria Technical Workgroup Report Final Draft. November 13, 2018
25
consumption, it is necessary to know which specific tissues within the animal are eaten, and even how the foods have been prepared.
The Workgroup considered three potential scenarios:
1. Exclude marine mammals from the FCR; 2. Use some percentage of marine mammal consumption (as identified by ADF&G) as FCR
(essentially species that predominately reside in CWA waters) but only include those species that have demonstrated pollutant uptake predominately in Alaska near-shore waters, and only for those pollutants demonstrated to have been taken up in Alaska marine mammal tissues; or
3. Include, in their entirety, those species of marine mammals that reside in near-shore waters.
The marine mammal discussion considered bioaccumulation of pollutants and indicated that it is possible to develop food web models that derive alternative tissue-dependent BAF values.19 Such modeling would be able to account for the different concentration of pollutants within different tissues of the animal. It would also be possible to develop a regional or site-specific BAF multiplier that is based on local food webs that include marine mammal consumption. However, it is unlikely that DEC would have the resources or technical expertise available to complete this analysis.
Research has indicated that populations that consume marine mammals may have higher body burdens of persistent or ‘legacy’ pollutants than the general population does. Data regarding percentages of tissue (e.g., organ meats, blubber) consumed is available but making generalizations regarding concentrations of pollutants that may reside in marine mammal tissue, or patterns of consumption that may increase/decrease risk to human health is challenging due to the amount of species by species and individual by individual variability. Nutritional studies have also identified the consumption of traditional foods (i.e., marine mammals) as being the source of many essential nutritional benefits.
One option discussed was excluding marine mammals from the FCR but setting the RSC value at 0.2. This action could be problematic for individuals who consume marine mammals as they may already be exceeding the RfD for certain pollutants. The Workgroup acknowledged that in some situations there may be no ‘safe’ consumption of certain parts of marine mammals due to the level of pollutants present in tissue but that this cannot be completely accounted for by the HHC if these pollutants are ‘legacy pollutants’ or derived from sources not regulated by the state. The Workgroup considered Fish Consumption Advisories, which are unrelated to HHC or WQS, to be an effective means of reducing exposure to pollutants by encouraging consumers to recognize which body parts are more likely to bioaccumulate pollutants and make wise dietary choices.20
19 See Mtg #9 Notes and Workgroup Meeting Agenda. 12-15-16. Retrieved at http://dec.alaska.gov/water/FCWQS/HumanHealthCriteriaTechWG.html
20 Laird et. al. 2013. Dietary Advice on Inuit Traditional Food Use Needs to Balance Benefits and Risks of Mercury, Selenium, and N3 Fatty Acids. Journal of Nutrition. Vol 143. No 6. 923-930
Alaska Department of Environmental Conservation Human Health Criteria Technical Workgroup Report Final Draft. November 13, 2018
26
The majority of the Workgroup ultimately concluded that DEC should consider marine mammals as part of the RSC. The reasons for this were two-fold: 1) most marine mammals reside in and acquire the majority of their body burden in waters outside CWA jurisdiction, so including them would not directly impact the actual sources of nor provide protection from pollutants present in marine mammals; 2) simplistic trophic-level characterizations of marine mammals that are within the resources of DEC would not accurately characterize actual human exposures to pollutants from marine mammal consumption due to large variations in tissue concentrations.
For those pollutants known to bioaccumulate in marine mammal tissues, the Workgroup recommended that the RSC should be set to the lowest allowed level (0.2). Such pollutants include heavy metals and other inorganics known to bioaccumulate in liver and kidney, and persistent organic pollutants known to bioaccumulate in blubber and other fatty tissues. It would be prudent to be conservative with other elements of the formula as well, to counter any presumed under-protectiveness of not including marine mammals in the FCR.
Alternative Viewpoints
1. The inclusion of salmon in the Relative Source Contribution (RSC) vs. the Fish Consumption Rate (FCR)
The EPA 2000 methodology excludes those fish and shellfish species designated as marine species from the FCR as exposure from consumption is accounted for by RSC. EPA has established a policy of recommending RSC values of 0.2 with a cap of 0.8.to ensure a measure of uncertainty is accommodated. Thus, the inclusion of salmon in the fish consumption rate poses a potential “double counting” effect in the RSC as marine species.
The inclusion of salmon, which includes species that may spend a significant portion of the life cycle in non-regulated and international waters, would result in significantly higher FCR than an FCR developed with strict adherence to the EPA 2000 methodology. However, the higher FCR and resultant lower HHC would not reduce the exposure of individual Alaskans to pollutants originating in non-regulated waters. Exposure from pollutants originating in non-regulated and international waters is better addressed by source control rather than state water quality regulations
Therefore, to ensure that the HHC sufficiently protect Alaskans from exposure to pollutants from fish in jurisdictional waters and to remain consistent with EPA recommendations, DEC should retain salmon in the relative source contribution. Essentially, the inclusion of salmon in the FCR may present to the public the appearance of reduced risk from pollutants but is unlikely to actually result in health benefits for fish consumers.
If the State were to develop statistically robust data on salmon residence time within jurisdictional waters and pollutants exposure and uptake routes, the data may support the inclusion of a weighted fraction of salmon in the FCR, but should resolve the double-counting risk within the relative source contribution.
Washington proposed to include salmon in its FCR and concurrently establish an RSC equal to one. This effort attempts to accommodate the potential presence of pollutants in salmon but by establishing an RSC of 1, may reduce the potential over-counting error described above. EPA accepted the inclusion of salmon in the FCR, but rejected Washington’s proposed RSC value of 1
Alaska Department of Environmental Conservation Human Health Criteria Technical Workgroup Report Final Draft. November 13, 2018
27
and ultimately revised those pollutants with an EPA-recommended RSC of 0.2 to 0.5 to account for the inclusion of marine species.
The inclusion of salmon in the FCR, as opposed to the RSC, is:
a) Inconsistent with EPA’s past recommendations and current approach to deriving national HHC;
b) Could result in significantly lower HHC and significantly higher compliance costs without a measureable reduction in risk from pollutants; and
c) Could result in “double-counting,” since the RSC already accounts for marine fish species yet salmon would be captured by the FCR as well.
2. The consumption of marine mammals in their entirety or as a percentage should be considered part of the FCR but restricted to near-shore species only:
Marine mammals known to live primarily or exclusively in waters within state CWA jurisdiction are harbor seals, Cook Inlet beluga whales, and Lake Iliamna seals. In particular, harbor seals are harvested for food throughout coastal Alaska.
There was limited Workgroup support for this option based on the lack of quantifying exposure data currently available. Inclusion of near-shore species only is important because exposure and resultant body burden would need to be attributed to pollutants present in state waters to the greatest extent possible. There was support amongst the Workgroup for additional consideration on a site-specific basis.
There was limited support for including a percentage of marine mammal consumption as part of the FCR. This was based on the fact that there is limited data available to accurately predict the percentage of time a particular species would spend in CWA waters, percentage of pollutants acquired in CWA waters, or percentage of total marine mammal consumption that is specific to near-shore species. This argument is similar to that presented for inclusion of a percentage of salmonids in the FCR rather than at 100 percent. There was also concern regarding the amount of variability in consumption that occurs from year to year depending on resource availability which makes determinations of average pounds per person consumed challenging. The Workgroup acknowledged intensive data collection efforts could be undertaken should site-specific criteria be sought but such work would be resource intensive.
3.1.4 Issue #3: What is the Appropriate Population to Target for Protection?
Definitions
Consumer means an individual consuming an amount of aquatic life acquired either through harvesting or receiving from a harvester and is synonymous with “user”;
Exposed Population means the sub-set of a population who are or have the potential to be more sensitive to or highly susceptible to exposure to pollutants through the consumption of fish and other aquatic life.
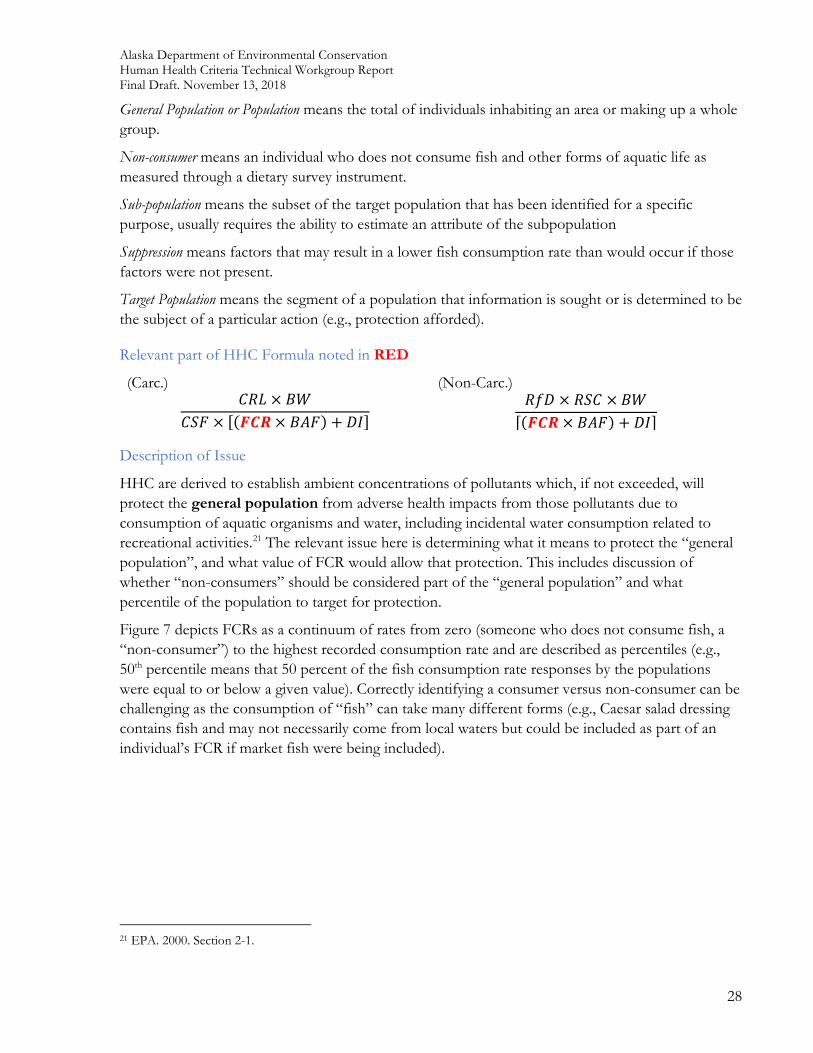
Alaska Department of Environmental Conservation Human Health Criteria Technical Workgroup Report Final Draft. November 13, 2018
28
General Population or Population means the total of individuals inhabiting an area or making up a whole group.
Non-consumer means an individual who does not consume fish and other forms of aquatic life as measured through a dietary survey instrument.
Sub-population means the subset of the target population that has been identified for a specific purpose, usually requires the ability to estimate an attribute of the subpopulation
Suppression means factors that may result in a lower fish consumption rate than would occur if those factors were not present.
Target Population means the segment of a population that information is sought or is determined to be the subject of a particular action (e.g., protection afforded).
Relevant part of HHC Formula noted in RED
(Carc.) (Non-Carc.) 𝐶𝐶𝐶𝐶𝐶𝐶 × 𝐵𝐵𝐵𝐵
𝐶𝐶𝐶𝐶𝐶𝐶 × [(𝑭𝑭𝑭𝑭𝑭𝑭 × 𝐵𝐵𝐵𝐵𝐶𝐶) + 𝐷𝐷𝐷𝐷]
𝐶𝐶𝑅𝑅𝐷𝐷 × 𝐶𝐶𝐶𝐶𝐶𝐶 × 𝐵𝐵𝐵𝐵[(𝑭𝑭𝑭𝑭𝑭𝑭 × 𝐵𝐵𝐵𝐵𝐶𝐶) + 𝐷𝐷𝐷𝐷]
Description of Issue
HHC are derived to establish ambient concentrations of pollutants which, if not exceeded, will protect the general population from adverse health impacts from those pollutants due to consumption of aquatic organisms and water, including incidental water consumption related to recreational activities.21 The relevant issue here is determining what it means to protect the “general population”, and what value of FCR would allow that protection. This includes discussion of whether “non-consumers” should be considered part of the “general population” and what percentile of the population to target for protection.
Figure 7 depicts FCRs as a continuum of rates from zero (someone who does not consume fish, a “non-consumer”) to the highest recorded consumption rate and are described as percentiles (e.g., 50th percentile means that 50 percent of the fish consumption rate responses by the populations were equal to or below a given value). Correctly identifying a consumer versus non-consumer can be challenging as the consumption of “fish” can take many different forms (e.g., Caesar salad dressing contains fish and may not necessarily come from local waters but could be included as part of an individual’s FCR if market fish were being included).
21 EPA. 2000. Section 2-1.
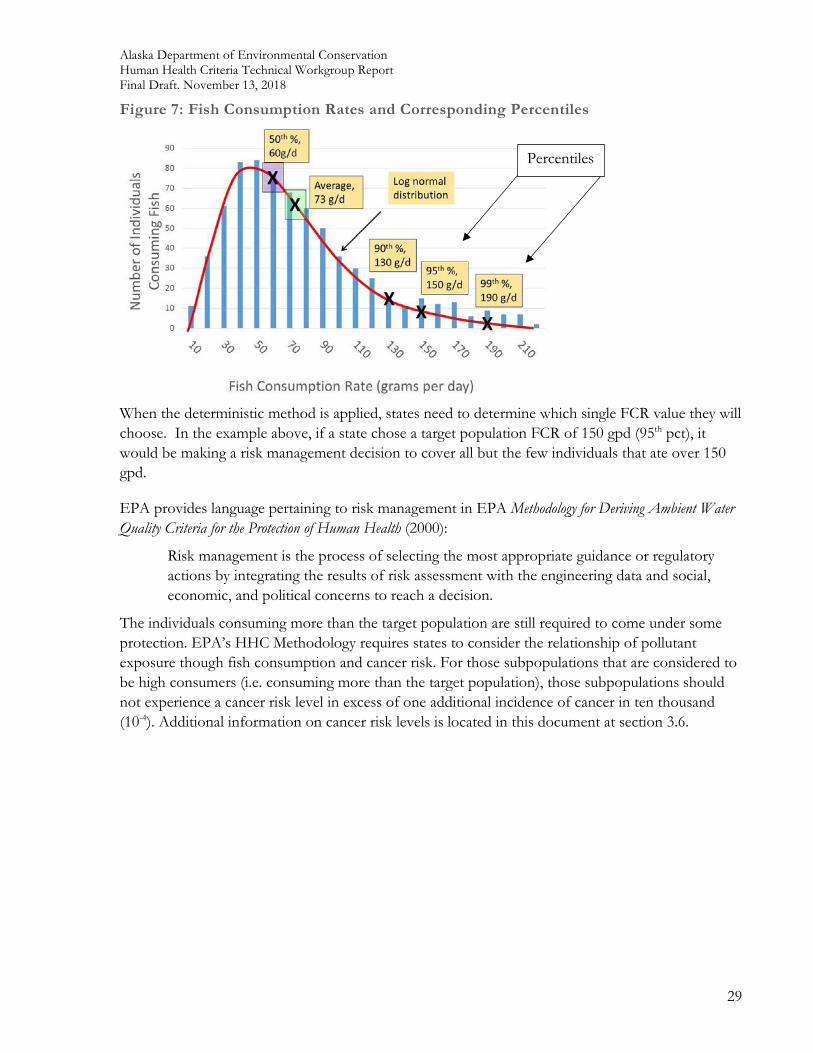
Alaska Department of Environmental Conservation Human Health Criteria Technical Workgroup Report Final Draft. November 13, 2018
29
Figure 7: Fish Consumption Rates and Corresponding Percentiles
When the deterministic method is applied, states need to determine which single FCR value they will choose. In the example above, if a state chose a target population FCR of 150 gpd (95th pct), it would be making a risk management decision to cover all but the few individuals that ate over 150 gpd.
EPA provides language pertaining to risk management in EPA Methodology for Deriving Ambient Water Quality Criteria for the Protection of Human Health (2000):
Risk management is the process of selecting the most appropriate guidance or regulatory actions by integrating the results of risk assessment with the engineering data and social, economic, and political concerns to reach a decision.
The individuals consuming more than the target population are still required to come under some protection. EPA’s HHC Methodology requires states to consider the relationship of pollutant exposure though fish consumption and cancer risk. For those subpopulations that are considered to be high consumers (i.e. consuming more than the target population), those subpopulations should not experience a cancer risk level in excess of one additional incidence of cancer in ten thousand (10-4). Additional information on cancer risk levels is located in this document at section 3.6.
Percentiles
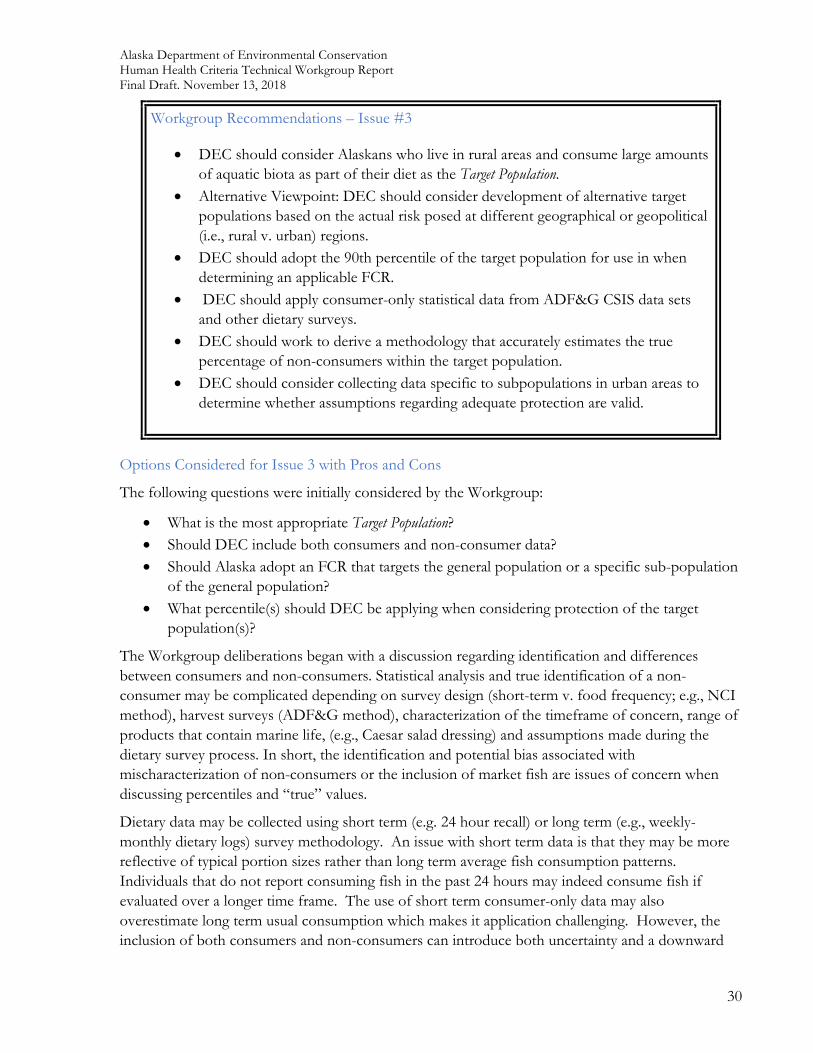
Alaska Department of Environmental Conservation Human Health Criteria Technical Workgroup Report Final Draft. November 13, 2018
30
Workgroup Recommendations – Issue #3
• DEC should consider Alaskans who live in rural areas and consume large amounts of aquatic biota as part of their diet as the Target Population.
• Alternative Viewpoint: DEC should consider development of alternative target populations based on the actual risk posed at different geographical or geopolitical (i.e., rural v. urban) regions.
• DEC should adopt the 90th percentile of the target population for use in when determining an applicable FCR.
• DEC should apply consumer-only statistical data from ADF&G CSIS data sets and other dietary surveys.
• DEC should work to derive a methodology that accurately estimates the true percentage of non-consumers within the target population.
• DEC should consider collecting data specific to subpopulations in urban areas to determine whether assumptions regarding adequate protection are valid.
Options Considered for Issue 3 with Pros and Cons
The following questions were initially considered by the Workgroup:
• What is the most appropriate Target Population? • Should DEC include both consumers and non-consumer data? • Should Alaska adopt an FCR that targets the general population or a specific sub-population
of the general population? • What percentile(s) should DEC be applying when considering protection of the target
population(s)?
The Workgroup deliberations began with a discussion regarding identification and differences between consumers and non-consumers. Statistical analysis and true identification of a non-consumer may be complicated depending on survey design (short-term v. food frequency; e.g., NCI method), harvest surveys (ADF&G method), characterization of the timeframe of concern, range of products that contain marine life, (e.g., Caesar salad dressing) and assumptions made during the dietary survey process. In short, the identification and potential bias associated with mischaracterization of non-consumers or the inclusion of market fish are issues of concern when discussing percentiles and “true” values.
Dietary data may be collected using short term (e.g. 24 hour recall) or long term (e.g., weekly-monthly dietary logs) survey methodology. An issue with short term data is that they may be more reflective of typical portion sizes rather than long term average fish consumption patterns. Individuals that do not report consuming fish in the past 24 hours may indeed consume fish if evaluated over a longer time frame. The use of short term consumer-only data may also overestimate long term usual consumption which makes it application challenging. However, the inclusion of both consumers and non-consumers can introduce both uncertainty and a downward
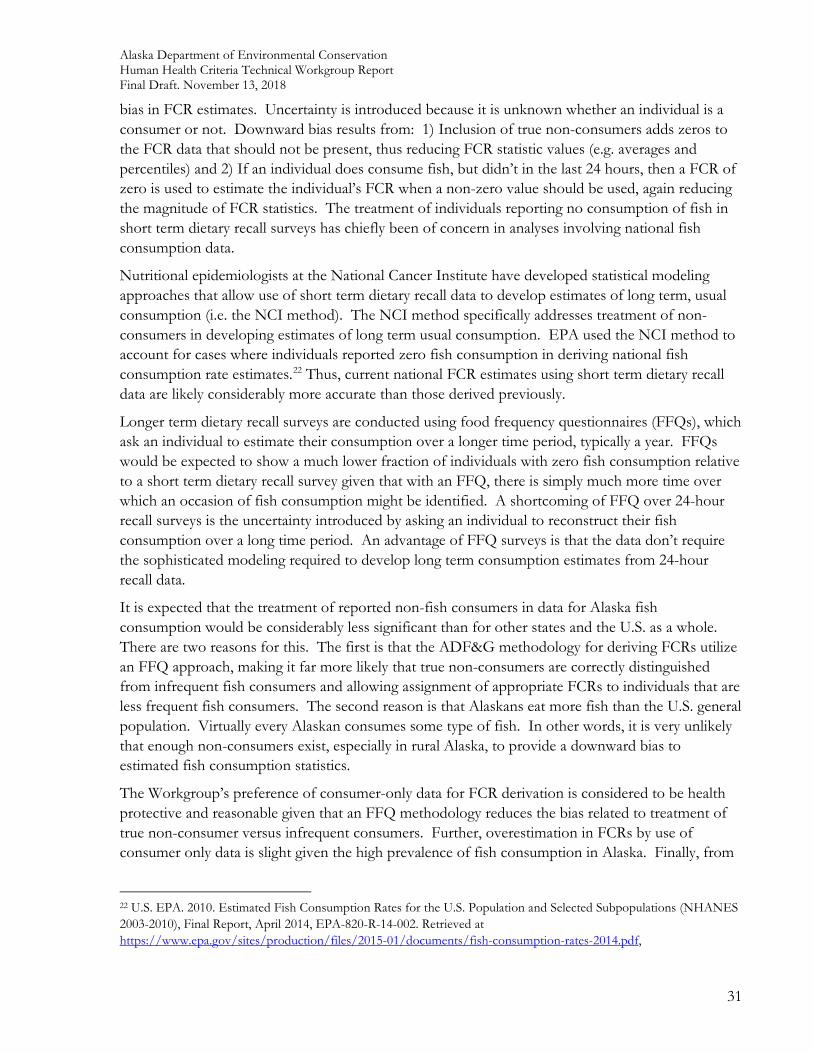
Alaska Department of Environmental Conservation Human Health Criteria Technical Workgroup Report Final Draft. November 13, 2018
31
bias in FCR estimates. Uncertainty is introduced because it is unknown whether an individual is a consumer or not. Downward bias results from: 1) Inclusion of true non-consumers adds zeros to the FCR data that should not be present, thus reducing FCR statistic values (e.g. averages and percentiles) and 2) If an individual does consume fish, but didn’t in the last 24 hours, then a FCR of zero is used to estimate the individual’s FCR when a non-zero value should be used, again reducing the magnitude of FCR statistics. The treatment of individuals reporting no consumption of fish in short term dietary recall surveys has chiefly been of concern in analyses involving national fish consumption data.
Nutritional epidemiologists at the National Cancer Institute have developed statistical modeling approaches that allow use of short term dietary recall data to develop estimates of long term, usual consumption (i.e. the NCI method). The NCI method specifically addresses treatment of non-consumers in developing estimates of long term usual consumption. EPA used the NCI method to account for cases where individuals reported zero fish consumption in deriving national fish consumption rate estimates.22 Thus, current national FCR estimates using short term dietary recall data are likely considerably more accurate than those derived previously.
Longer term dietary recall surveys are conducted using food frequency questionnaires (FFQs), which ask an individual to estimate their consumption over a longer time period, typically a year. FFQs would be expected to show a much lower fraction of individuals with zero fish consumption relative to a short term dietary recall survey given that with an FFQ, there is simply much more time over which an occasion of fish consumption might be identified. A shortcoming of FFQ over 24-hour recall surveys is the uncertainty introduced by asking an individual to reconstruct their fish consumption over a long time period. An advantage of FFQ surveys is that the data don’t require the sophisticated modeling required to develop long term consumption estimates from 24-hour recall data.
It is expected that the treatment of reported non-fish consumers in data for Alaska fish consumption would be considerably less significant than for other states and the U.S. as a whole. There are two reasons for this. The first is that the ADF&G methodology for deriving FCRs utilize an FFQ approach, making it far more likely that true non-consumers are correctly distinguished from infrequent fish consumers and allowing assignment of appropriate FCRs to individuals that are less frequent fish consumers. The second reason is that Alaskans eat more fish than the U.S. general population. Virtually every Alaskan consumes some type of fish. In other words, it is very unlikely that enough non-consumers exist, especially in rural Alaska, to provide a downward bias to estimated fish consumption statistics.
The Workgroup’s preference of consumer-only data for FCR derivation is considered to be health protective and reasonable given that an FFQ methodology reduces the bias related to treatment of true non-consumer versus infrequent consumers. Further, overestimation in FCRs by use of consumer only data is slight given the high prevalence of fish consumption in Alaska. Finally, from
22 U.S. EPA. 2010. Estimated Fish Consumption Rates for the U.S. Population and Selected Subpopulations (NHANES 2003-2010), Final Report, April 2014, EPA-820-R-14-002. Retrieved at https://www.epa.gov/sites/production/files/2015-01/documents/fish-consumption-rates-2014.pdf,
Alaska Department of Environmental Conservation Human Health Criteria Technical Workgroup Report Final Draft. November 13, 2018
32
a policy perspective, Alaska should focus on the risks faced by individuals exposed to pollutants in fish and water, not individuals that do not have these exposures.
Target Population
The Workgroup then deliberated on whether Alaska should concentrate its efforts on developing a fish consumption rate for the general population or focus on sub-population consumption rates. Currently, the majority of Alaska’s population of ~740,000 reside in the more developed parts of Alaska including Anchorage, Fairbanks, and Juneau.23 The EPA methodology allows states to apply a fish consumption rate which is either protective of 90 percent of the general population or a particular percentage of a highly exposed population.24 However, EPA is explicit as to their policy preferences on selection of a target population:
[i]f the State or Tribe determines that a highly exposed population is at greater risk and would not be adequately protected by criteria based on the general population, and by the national 304(a) criteria in particular, EPA recommends that the State or Tribe adopt more stringent criteria using alternative exposure assumptions. 25
The Workgroup discussed the role of the general population, regional sub-populations and their dietary choices, and sub-populations that are racial/ethnic in origin in both urban and rural Alaska as potential target populations. Most rural Alaskans practice a subsistence lifestyle that relies on consuming fish from local waters while populations in urban areas may choose alternative food sources and consume less fish. This leads to one population potentially being more ‘exposed’ to pollutants than another based on their respective lifestyle.
The Workgroup initially found merit in the idea of developing a series of regional consumption rates as a means of addressing the wide range of consumption patterns evident from the ADF&G Community Subsistence Information System database. Issues with trying to merge anthropogenic data (e.g., Communities, harvest areas) with geographic data (i.e., watersheds), the fact that certain rivers (e.g., Yukon River) cross through multiple regions, and issues with implementing regional criteria in discharge permits led the majority of the Workgroup to ultimately prefer a statewide approach to setting an FCR rather than regional.
The majority of the Workgroup recommended that Alaska’s general rural population should be the target population for protection and that the 90th percentile was the more appropriate FCR percentile. The Workgroup’s recommendation is based on:
• Availability of data from the ADF&G CSIS database; • Recognition that Alaska’s rural populations are likely to be the highest consumers of fish and
other aquatic organisms; • Recognition of the wide range of FCR values in communities across rural Alaska;
23 Alaska Department of Labor and Workforce Development. Retrieved from http://live.laborstats.alaska.gov/pop/index.cfm on 11-16-2015.
24 EPA 2000. Section 1-12
25 EPA. 2000. Section 2-2
Alaska Department of Environmental Conservation Human Health Criteria Technical Workgroup Report Final Draft. November 13, 2018
33
• Recognition that multiple regional FCRs rather than a single statewide FCR would add complexity to the administration of WQS in various water pollution control programs; and
• Establishment of a FCR that is protective of rural populations is anticipated to be protective of sub-populations within urban areas that may be high consumers.
Alternative Viewpoint
There was concern amongst the Workgroup that fish consumption rates and species consumed are not equal across Alaska at the statewide, regional, or even at a local scale. This imbalance has the potential to over or under estimate fish intake. The Workgroup acknowledged that the majority of Alaska’s population resides in areas characterized by ADF&G as ‘urban’ or non-subsistence while the criteria may be developed using data from rural populations. Rather than selecting a single populations and percentage of said population to be the subject of statewide criteria, it may be advantageous to establish protection based on the actual population at the appropriate geographical/geopolitical scale. While this could lead to significant implementation issues, it would be a more realistic reflection of Alaska’s diverse dietary patterns and risk from exposure through fish consumption.
3.2 Additional Components of the HHC Formula
This section addresses those aspects of the HHC formula that are not directly related to fish consumption including:
• Modeling approaches • (Issue #4) Application of Cancer Risk Levels • (Issue #6) Application of Bioaccumulation/Bioconcentration
3.2.1 Modeling approaches
Definitions
Deterministic means a modeling approach in which the derivation of a particular value using point estimates that represent exposure such as body weight, drinking water intake, and fish consumption rates. A single number for each of these values is inserted into the formula to derive criteria.
Probabilistic means a statistical modeling approach used to determine the chance that something may re-occur, based on past data. The result is a distribution of potential risk to the population when a range of possible exposures is present. The probabilistic approach therefore provides explicit estimates of potential risk for different segments of the population, including both the general population (e.g., arithmetic mean or 50th percentile) and individuals with high-end exposures (e.g., the 90th, 95th or 99th percentiles).26
26 The probabilistic definition was modified from that found in ARCADIS (2014) Derivation of Alternative Human Health Risk-Based Ambient Water Quality Criteria Using Probabilistic Methods for the State of Washington. Submitted to Washington Ecology on behalf of the Northwest Pulp and Paper Association.
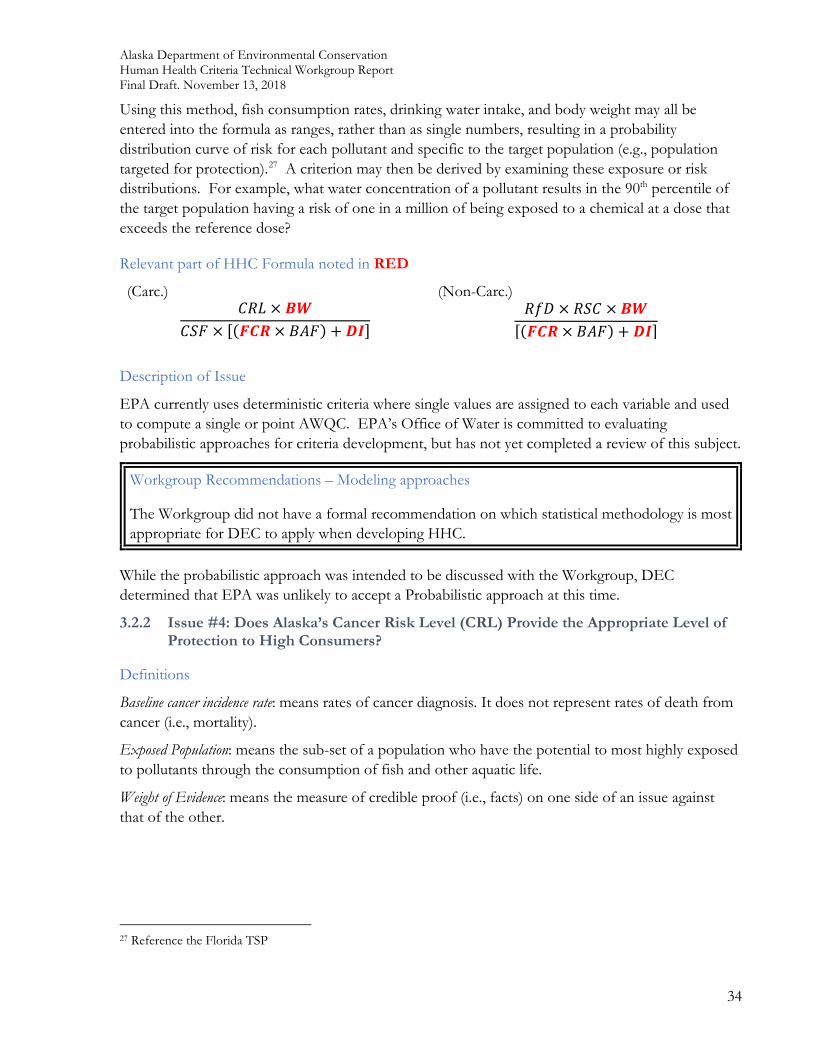
Alaska Department of Environmental Conservation Human Health Criteria Technical Workgroup Report Final Draft. November 13, 2018
34
Using this method, fish consumption rates, drinking water intake, and body weight may all be entered into the formula as ranges, rather than as single numbers, resulting in a probability distribution curve of risk for each pollutant and specific to the target population (e.g., population targeted for protection).27 A criterion may then be derived by examining these exposure or risk distributions. For example, what water concentration of a pollutant results in the 90th percentile of the target population having a risk of one in a million of being exposed to a chemical at a dose that exceeds the reference dose?
Relevant part of HHC Formula noted in RED
(Carc.) (Non-Carc.) 𝐶𝐶𝐶𝐶𝐶𝐶 × 𝑩𝑩𝑩𝑩
𝐶𝐶𝐶𝐶𝐶𝐶 × [(𝑭𝑭𝑭𝑭𝑭𝑭 × 𝐵𝐵𝐵𝐵𝐶𝐶) + 𝑫𝑫𝑫𝑫] 𝐶𝐶𝑅𝑅𝐷𝐷 × 𝐶𝐶𝐶𝐶𝐶𝐶 × 𝑩𝑩𝑩𝑩
[(𝑭𝑭𝑭𝑭𝑭𝑭 × 𝐵𝐵𝐵𝐵𝐶𝐶) + 𝑫𝑫𝑫𝑫]
Description of Issue
EPA currently uses deterministic criteria where single values are assigned to each variable and used to compute a single or point AWQC. EPA’s Office of Water is committed to evaluating probabilistic approaches for criteria development, but has not yet completed a review of this subject.
Workgroup Recommendations – Modeling approaches
The Workgroup did not have a formal recommendation on which statistical methodology is most appropriate for DEC to apply when developing HHC.
While the probabilistic approach was intended to be discussed with the Workgroup, DEC determined that EPA was unlikely to accept a Probabilistic approach at this time.
3.2.2 Issue #4: Does Alaska’s Cancer Risk Level (CRL) Provide the Appropriate Level of Protection to High Consumers?
Definitions
Baseline cancer incidence rate: means rates of cancer diagnosis. It does not represent rates of death from cancer (i.e., mortality).
Exposed Population: means the sub-set of a population who have the potential to most highly exposed to pollutants through the consumption of fish and other aquatic life.
Weight of Evidence: means the measure of credible proof (i.e., facts) on one side of an issue against that of the other.
27 Reference the Florida TSP
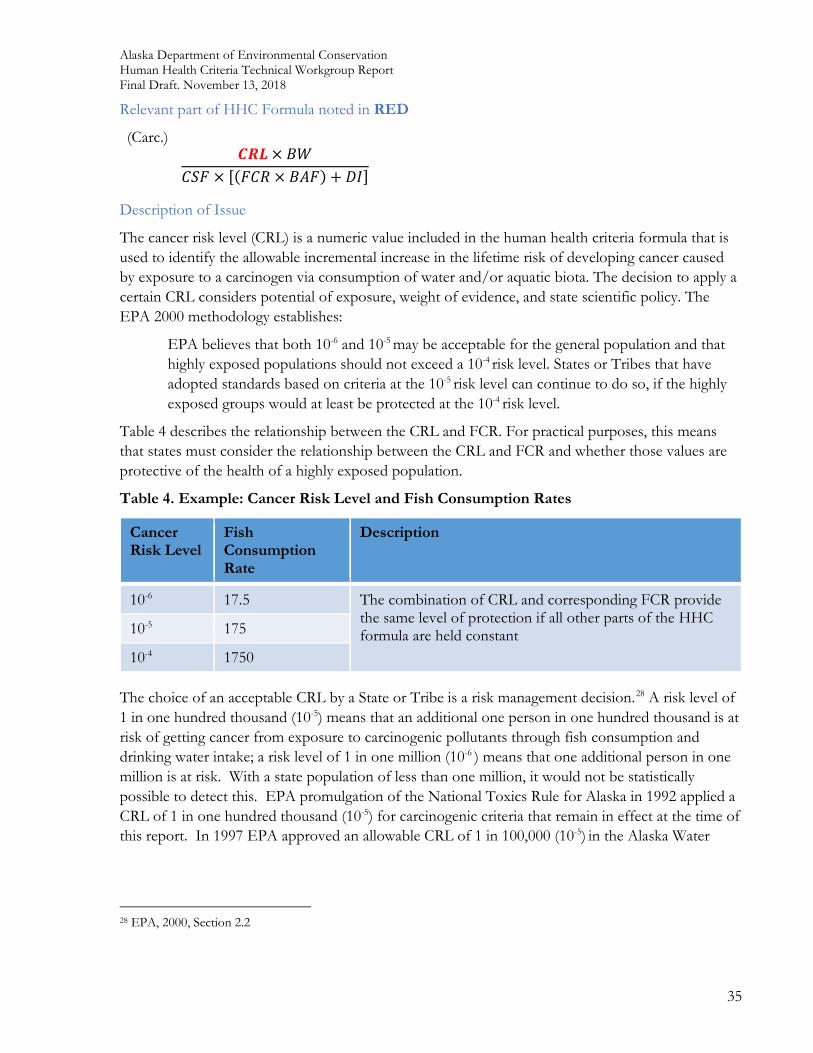
Alaska Department of Environmental Conservation Human Health Criteria Technical Workgroup Report Final Draft. November 13, 2018
35
Relevant part of HHC Formula noted in RED
(Carc.) 𝑭𝑭𝑭𝑭𝑪𝑪 × 𝐵𝐵𝐵𝐵
𝐶𝐶𝐶𝐶𝐶𝐶 × [(𝐶𝐶𝐶𝐶𝐶𝐶 × 𝐵𝐵𝐵𝐵𝐶𝐶) + 𝐷𝐷𝐷𝐷]
Description of Issue
The cancer risk level (CRL) is a numeric value included in the human health criteria formula that is used to identify the allowable incremental increase in the lifetime risk of developing cancer caused by exposure to a carcinogen via consumption of water and/or aquatic biota. The decision to apply a certain CRL considers potential of exposure, weight of evidence, and state scientific policy. The EPA 2000 methodology establishes:
EPA believes that both 10-6 and 10-5 may be acceptable for the general population and that highly exposed populations should not exceed a 10-4 risk level. States or Tribes that have adopted standards based on criteria at the 10-5 risk level can continue to do so, if the highly exposed groups would at least be protected at the 10-4 risk level.
Table 4 describes the relationship between the CRL and FCR. For practical purposes, this means that states must consider the relationship between the CRL and FCR and whether those values are protective of the health of a highly exposed population.
Table 4. Example: Cancer Risk Level and Fish Consumption Rates
Cancer Risk Level
Fish Consumption Rate
Description
10-6 17.5 The combination of CRL and corresponding FCR provide the same level of protection if all other parts of the HHC formula are held constant 10-5 175
10-4 1750
The choice of an acceptable CRL by a State or Tribe is a risk management decision.28 A risk level of 1 in one hundred thousand (10-5) means that an additional one person in one hundred thousand is at risk of getting cancer from exposure to carcinogenic pollutants through fish consumption and drinking water intake; a risk level of 1 in one million (10-6 ) means that one additional person in one million is at risk. With a state population of less than one million, it would not be statistically possible to detect this. EPA promulgation of the National Toxics Rule for Alaska in 1992 applied a CRL of 1 in one hundred thousand (10-5) for carcinogenic criteria that remain in effect at the time of this report. In 1997 EPA approved an allowable CRL of 1 in 100,000 (10-5) in the Alaska Water
28 EPA, 2000, Section 2.2
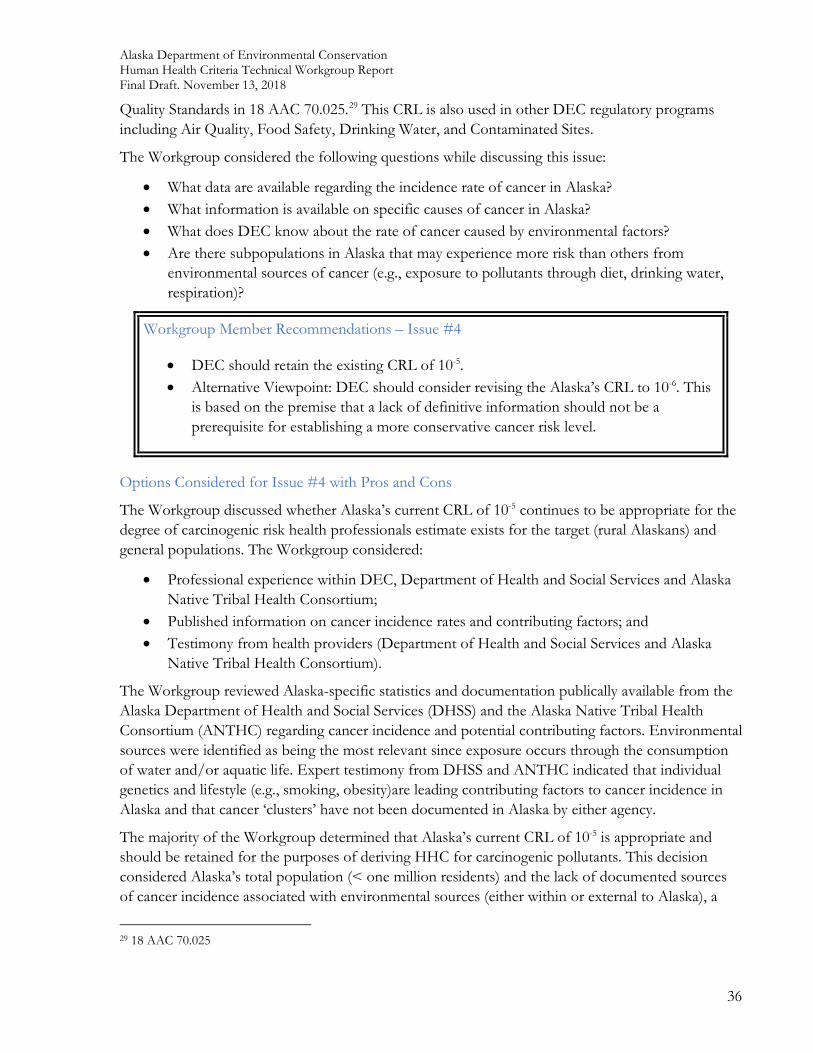
Alaska Department of Environmental Conservation Human Health Criteria Technical Workgroup Report Final Draft. November 13, 2018
36
Quality Standards in 18 AAC 70.025.29 This CRL is also used in other DEC regulatory programs including Air Quality, Food Safety, Drinking Water, and Contaminated Sites.
The Workgroup considered the following questions while discussing this issue:
• What data are available regarding the incidence rate of cancer in Alaska? • What information is available on specific causes of cancer in Alaska? • What does DEC know about the rate of cancer caused by environmental factors? • Are there subpopulations in Alaska that may experience more risk than others from
environmental sources of cancer (e.g., exposure to pollutants through diet, drinking water, respiration)?
Workgroup Member Recommendations – Issue #4
• DEC should retain the existing CRL of 10-5. • Alternative Viewpoint: DEC should consider revising the Alaska’s CRL to 10-6. This
is based on the premise that a lack of definitive information should not be a prerequisite for establishing a more conservative cancer risk level.
Options Considered for Issue #4 with Pros and Cons
The Workgroup discussed whether Alaska’s current CRL of 10-5 continues to be appropriate for the degree of carcinogenic risk health professionals estimate exists for the target (rural Alaskans) and general populations. The Workgroup considered:
• Professional experience within DEC, Department of Health and Social Services and Alaska Native Tribal Health Consortium;
• Published information on cancer incidence rates and contributing factors; and • Testimony from health providers (Department of Health and Social Services and Alaska
Native Tribal Health Consortium).
The Workgroup reviewed Alaska-specific statistics and documentation publically available from the Alaska Department of Health and Social Services (DHSS) and the Alaska Native Tribal Health Consortium (ANTHC) regarding cancer incidence and potential contributing factors. Environmental sources were identified as being the most relevant since exposure occurs through the consumption of water and/or aquatic life. Expert testimony from DHSS and ANTHC indicated that individual genetics and lifestyle (e.g., smoking, obesity)are leading contributing factors to cancer incidence in Alaska and that cancer ‘clusters’ have not been documented in Alaska by either agency.
The majority of the Workgroup determined that Alaska’s current CRL of 10-5 is appropriate and should be retained for the purposes of deriving HHC for carcinogenic pollutants. This decision considered Alaska’s total population (< one million residents) and the lack of documented sources of cancer incidence associated with environmental sources (either within or external to Alaska), a
29 18 AAC 70.025
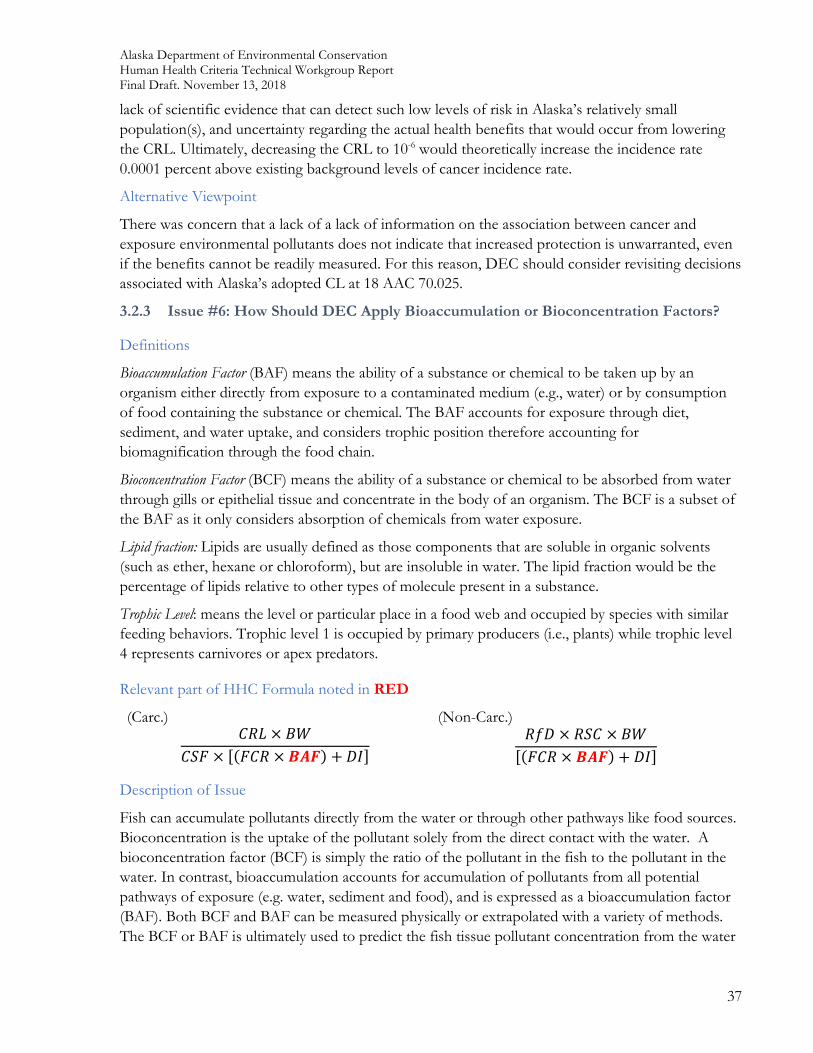
Alaska Department of Environmental Conservation Human Health Criteria Technical Workgroup Report Final Draft. November 13, 2018
37
lack of scientific evidence that can detect such low levels of risk in Alaska’s relatively small population(s), and uncertainty regarding the actual health benefits that would occur from lowering the CRL. Ultimately, decreasing the CRL to 10-6 would theoretically increase the incidence rate 0.0001 percent above existing background levels of cancer incidence rate.
Alternative Viewpoint
There was concern that a lack of a lack of information on the association between cancer and exposure environmental pollutants does not indicate that increased protection is unwarranted, even if the benefits cannot be readily measured. For this reason, DEC should consider revisiting decisions associated with Alaska’s adopted CL at 18 AAC 70.025.
3.2.3 Issue #6: How Should DEC Apply Bioaccumulation or Bioconcentration Factors?
Definitions
Bioaccumulation Factor (BAF) means the ability of a substance or chemical to be taken up by an organism either directly from exposure to a contaminated medium (e.g., water) or by consumption of food containing the substance or chemical. The BAF accounts for exposure through diet, sediment, and water uptake, and considers trophic position therefore accounting for biomagnification through the food chain.
Bioconcentration Factor (BCF) means the ability of a substance or chemical to be absorbed from water through gills or epithelial tissue and concentrate in the body of an organism. The BCF is a subset of the BAF as it only considers absorption of chemicals from water exposure.
Lipid fraction: Lipids are usually defined as those components that are soluble in organic solvents (such as ether, hexane or chloroform), but are insoluble in water. The lipid fraction would be the percentage of lipids relative to other types of molecule present in a substance.
Trophic Level: means the level or particular place in a food web and occupied by species with similar feeding behaviors. Trophic level 1 is occupied by primary producers (i.e., plants) while trophic level 4 represents carnivores or apex predators.
Relevant part of HHC Formula noted in RED
(Carc.) (Non-Carc.) 𝐶𝐶𝐶𝐶𝐶𝐶 × 𝐵𝐵𝐵𝐵
𝐶𝐶𝐶𝐶𝐶𝐶 × [(𝐶𝐶𝐶𝐶𝐶𝐶 × 𝑩𝑩𝑩𝑩𝑭𝑭) + 𝐷𝐷𝐷𝐷]
𝐶𝐶𝑅𝑅𝐷𝐷 × 𝐶𝐶𝐶𝐶𝐶𝐶 × 𝐵𝐵𝐵𝐵[(𝐶𝐶𝐶𝐶𝐶𝐶 × 𝑩𝑩𝑩𝑩𝑭𝑭) + 𝐷𝐷𝐷𝐷]
Description of Issue
Fish can accumulate pollutants directly from the water or through other pathways like food sources. Bioconcentration is the uptake of the pollutant solely from the direct contact with the water. A bioconcentration factor (BCF) is simply the ratio of the pollutant in the fish to the pollutant in the water. In contrast, bioaccumulation accounts for accumulation of pollutants from all potential pathways of exposure (e.g. water, sediment and food), and is expressed as a bioaccumulation factor (BAF). Both BCF and BAF can be measured physically or extrapolated with a variety of methods. The BCF or BAF is ultimately used to predict the fish tissue pollutant concentration from the water
Alaska Department of Environmental Conservation Human Health Criteria Technical Workgroup Report Final Draft. November 13, 2018
38
concentration; thus it is used to calculate a population’s pollutant exposure for setting human health criteria values.
The EPA 2000 methodology and 2015 HHC supplemental information30 recommend that states apply measured or estimated bioaccumulation factors (BAF), whenever they are available, rather than bioconcentration factors (BCF) when computing a human health criterion. The EPA nationally recommended BAF values consider three trophic levels of fish. (TL2, TL3, TL4), with TL4 as the highest level (top predators). BAF can be applied by using the geometric mean of the values for the three trophic levels (TL2-TL4) or by using a single trophic level should dietary surveys indicate consumption is concentrated in a particular part of the food web. While EPA applied the TL2-TL4 BAF values when deriving national HHC values, the ADF&G CSIS data currently available would need to be reanalyzed to differentiate consumption by trophic level.
The Workgroup considered the following:
• Which species should DEC include in the FCR, and how would that inform the range of trophic levels applicable to the BAF?
• Is use of EPA-recommended BAFs more scientifically defensible and appropriate for Alaska than previously published BCFs?
• Is use of BAF still appropriate when the species of fish used to derive national BAF values are not species commonly seen in Alaska?
• Should DEC consider using a range of trophic level values (TL 2- TL4) or simply apply a single trophic level (i.e., TL4) value as the applicable BAF?
• How would DEC address marine mammal BAF when EPA did not consider marine mammals when deriving nationally recommended values?
• How should DEC address the fact that BAFs for marine mammals are likely to vary among species, and among organs and tissue types within an individual animal, given that consumers favor certain parts of each species?
Workgroup Recommendations – Issue #6.
• DEC should use EPA-recommended bioaccumulation factors for fish, whenever available, for deriving HHC.
• DEC should apply EPA-recommended TL 4 BAFs for deriving HHC.
Options Considered for Issue 6 with Pros and Cons
The Workgroup discussed sources of information, species used to derive the proposed values, and the relationship between trophic levels and dietary preferences. The Workgroup noted that BAF values were available for both carcinogens and non-carcinogens and that focusing attention on the BAF rather than other factors of the HHC formula may address an area of documented risk to
30 U.S. Environmental Protection Agency. 2016. Development of National Bioaccumulation Factors: Supplemental information for EPA’s 2015 Human Health Criteria. Office of Water. Washington, D.C.
Alaska Department of Environmental Conservation Human Health Criteria Technical Workgroup Report Final Draft. November 13, 2018
39
Alaskan consumers (i.e. bioaccumulative pollutants actually measured in some Alaska residents). This is in part because BAF values are pollutant-specific and more directly related to the degree of risk certain bioaccumulative pollutants may pose to the target population.
There was some discussion about the potential to adjust BAFs based on bioaccumulation data specific to Alaska but also recognition that such an effort would be data intensive to meet EPA technical thresholds. This question was also raised in relation to the consumption of marine mammals as EPA-recommended BAFs are fish-based rather than inclusive of bioaccumulation occurring in marine mammal tissue and organs. Both the Workgroup and DEC acknowledged that completion of Alaska-specific BAFs was not feasible prior to completing the proposed rulemaking due to staffing and technical capacity available to DEC at this time. Additional discussion regarding the role of marine mammals is located at Section 3.8.3 of this report.
The Workgroup also discussed the fact that part of EPA’s rationale to Washington when disapproving their 2016 rulemaking was a decision to retain BCF values rather than apply the EPA-recommended BAFs based on concerns that national BAF values are not scientifically defensible when applied to individual states. Tribal FCR studies in Washington demonstrated TL4 species make up the majority of fish consumed. EPA used this information and applied the national TL4 BAF rather than the national (TL2-TL4) approach when they promulgated HHC for Washington in 2016.
Further Discussion
The Workgroup discussed whether there was merit in having ADF&G partition those species identified in the CSIS data as being consumed according to their trophic position to establish TL2, TL3, and TL4 weighted values. This is also known as “binning”. Neither DEC nor ADF&G have previously considered manipulating the data in this manner nor has DEC identified studies that have done so previously.
The Workgroup concluded that DEC should apply the TL4 BAF rather than applying a weighted average of TL2, TL3, and TL4 (i.e., EPA national methodology). The Workgroup acknowledged the fact that the decision whether to include salmon as part of the FCR will influence this decision as salmon are a TL4 species and likely to make the contribution of other species to the BAF equation negligible. A weighted average approach that considers TL2 - TL4 may be more appropriate should salmon be excluded from the FCR.
The Workgroup also discussed which trophic position marine mammals represented should they be included in the fish consumption rate. Marine mammals were not included when EPA derived BAF values. The workgroup considered a peer-reviewed study of marine mammal feeding behaviors which determined that while marine mammals could be characterized as TL3 or TL4, more discussion regarding their role in the HHC process was warranted. More information on marine mammals is located in section 3.8 of this document.
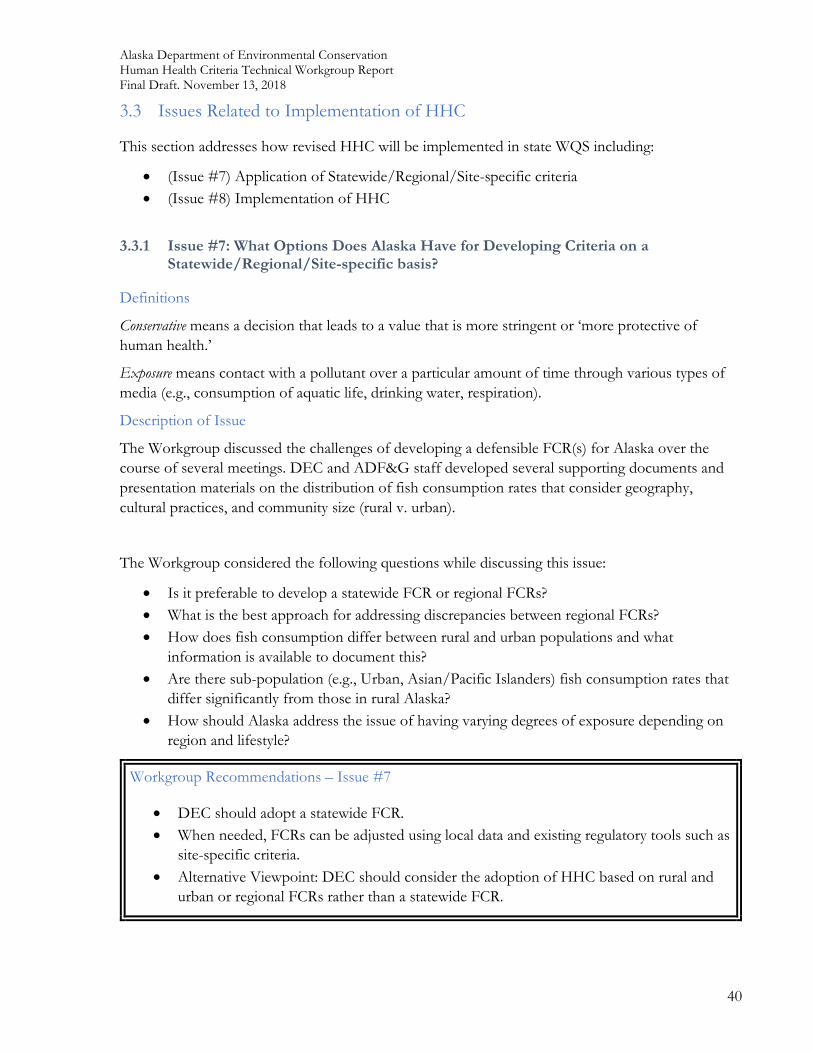
Alaska Department of Environmental Conservation Human Health Criteria Technical Workgroup Report Final Draft. November 13, 2018
40
3.3 Issues Related to Implementation of HHC
This section addresses how revised HHC will be implemented in state WQS including:
• (Issue #7) Application of Statewide/Regional/Site-specific criteria • (Issue #8) Implementation of HHC
3.3.1 Issue #7: What Options Does Alaska Have for Developing Criteria on a Statewide/Regional/Site-specific basis?
Definitions
Conservative means a decision that leads to a value that is more stringent or ‘more protective of human health.’
Exposure means contact with a pollutant over a particular amount of time through various types of media (e.g., consumption of aquatic life, drinking water, respiration).
Description of Issue
The Workgroup discussed the challenges of developing a defensible FCR(s) for Alaska over the course of several meetings. DEC and ADF&G staff developed several supporting documents and presentation materials on the distribution of fish consumption rates that consider geography, cultural practices, and community size (rural v. urban).
The Workgroup considered the following questions while discussing this issue:
• Is it preferable to develop a statewide FCR or regional FCRs? • What is the best approach for addressing discrepancies between regional FCRs? • How does fish consumption differ between rural and urban populations and what
information is available to document this? • Are there sub-population (e.g., Urban, Asian/Pacific Islanders) fish consumption rates that
differ significantly from those in rural Alaska? • How should Alaska address the issue of having varying degrees of exposure depending on
region and lifestyle?
Workgroup Recommendations – Issue #7
• DEC should adopt a statewide FCR. • When needed, FCRs can be adjusted using local data and existing regulatory tools such as
site-specific criteria. • Alternative Viewpoint: DEC should consider the adoption of HHC based on rural and
urban or regional FCRs rather than a statewide FCR.
Alaska Department of Environmental Conservation Human Health Criteria Technical Workgroup Report Final Draft. November 13, 2018
41
Options Considered for Issue #7 with Pros and Cons
The Workgroup discussed the merit of developing FCRs at both the statewide and regional scale. The Workgroup acknowledged that Alaskans have the capacity to consume a variety of aquatic resources from a multitude of waterbodies and markets due to transportation and social networks. While application of regional FCRs would be more characteristic of subpopulation diets and risk for that specific geographic area, regional criteria would not account for food sharing systems or the practice of obtaining fish/shellfish in one region and transporting it to another region (e.g., catching halibut in Valdez and transporting it to Tok). Adoption of an upper percentile FCR (e.g., 90th) for a high consuming rural population could ensure that consumption of fish, regardless of where that fish was acquired (within state waters) would be considered protective of the general population and high consuming subpopulations wherever they live. However, such a decision could be viewed as being overprotective if this value represents a very small number of individuals depending on which target population and percentile are applied.
The Workgroup acknowledged that water quality criteria are typically developed on a statewide basis and establishment of regional values could be contrary to EPA’s interpretation of fish consumption.31 Another issue of concern raised with application of regional FCRs would be how DEC would demonstrate the protection of designated uses in downstream waters when many watersheds may span two or more regions. The majority of the Workgroup ultimately concluded that development of a “conservative” statewide FCR was more appropriate for DEC regulatory purposes.
Alternate Viewpoints
Rural versus Urban Fish Consumption Rates
Alaska’s vast geographic expanse and diverse array of native Alaskan and immigrant cultures make selection of a singular value for fish consumption rate both challenging and questionable. The 2010 census identified the urban Alaska population as 66 percent of the state’s total population of 710,231, residing in 37 places of 2,500 or more people. Over 40 percent of the state’s population – roughly 300,000 people – lives in Anchorage. By contrast, 237 communities (over half of the state’s 355 communities) support populations of fewer than 500 individuals. Establishment of a single statewide value does not necessarily reflect the actual risk of pollutant exposure to the majority of Alaska’s populace.
Regional differences in subsistence consumption
The dietary habits of rural Alaskans are likely to be very distinct. Rural communities are much more likely to be involved in subsistence activities including the consumption of local fish, game, and
31 EPA. 2015. Human Health Ambient Water Quality Criteria and Fish Consumption Rates: Frequently Asked Questions.
“[E]PA expects that the standards will be set to enable residents to safely consume from local waters the amount of fish they would normally consume from all (emphasis added) fresh and estuarine waters (including estuarine species harvested in near coastal waters).” Retrieved from https://www.epa.gov/wqc/human-health-ambient-water-quality-criteria-and-fish-consumption-rates-frequently-asked on August 24, 2017
Alaska Department of Environmental Conservation Human Health Criteria Technical Workgroup Report Final Draft. November 13, 2018
42
vegetative resources. Rural subsistence diets are by tradition and necessity dominated by resources available locally. The composition of foodstuffs harvested for subsistence will change from season to season and region to region. ADF&G CSIS data has identified a higher level of harvest and consumption of marine mammals on the coastal areas of Arctic and western Alaska. Interior Alaska subsistence is dominated by resident fish and anadromous salmon, as well as significant harvest of meat, especially moose and caribou. Pacific Coastal areas tend toward increased harvest of anadromous salmon, with additional input from other pelagic and coastal marine species, as well as upland game. Establishment of a single statewide value does not necessarily reflect a specific dietary pattern of consumption nor actual risk of exposure to pollutants through one’s diet.
3.3.2 Issue #8: What Are Alaska’s Options for Implementing the Proposed Criteria in Clean Water Act – Approved Programs?
Description of Issue
The DEC Alaska Pollutant Discharge Elimination System (APDES) discharge permitting process generally applies HHC to those facilities that discharge in excess of one million gallons per day or demonstrate applicability through Reasonable Potential Analysis (RPA). General permits do not currently include numeric effluent limits for HHC. These thresholds narrow application down to two major types of dischargers, Publicly Owned Treatment Works (POTWs) and Mining (metals). Other industries may include discharge limits with HHC but are addressed on an individual permit basis. Stormwater discharges are generally excluded from HHC due to the amount of variance in concentration that occurs both in effluent and receiving water and concerns that HHC are based on lifetime exposure rates.
The Workgroup considered implementation of revised HHC using existing or new regulatory tools. The Workgroup was provided DEC background information regarding treatment of HHC in the assessment and monitoring process, discharge permitting process, and new regulatory tools for implementing water quality standards in state pollution control programs. While effluent discharge requirements are available on a permit-by-permit basis, quantifying the contribution of individual dischargers or groups of similar facilities contributing to the influent load at POTWs to water bodies in general is difficult to determine because pollutants may no longer be actively used (e.g., legacy pesticides, PCBs), could be formed as a byproduct of numerous processes (e.g., dioxin), or there is a lack of background water quality monitoring data available to determine the degree to which pollutants with HHC are in fact present in Alaska. Thus, it is difficult to estimate pretreatment costs to direct and indirect dischargers for pollutants. If process optimization or source control are considered insufficient for compliance with the baseline or revised criteria, alternative discharge options or end-of-pipe treatment technologies may be necessary. Review of current technology has indicated that advance treatment technology alone may not meet all proposed HHC and that implementation tool may be necessary for discharger compliance.32 Implementation tools to adjust water quality standards are limited in type and requirements by federal regulations and policy
32 HDR Engineering, Inc. 2013. Treatment Technology Review and Assessment. Conducted under contract for the Association of Washington Business, Association of Washington Cities, and Washington State Association of Counties. Bellevue, Washington.
Alaska Department of Environmental Conservation Human Health Criteria Technical Workgroup Report Final Draft. November 13, 2018
43
preferences. Information regarding implementation was provided to the Workgroup primarily for their information and not for technical feedback.
Workgroup Recommendations – Issue #8 • The Workgroup did not make specific recommendations regarding the tools or
processes used for implementation of HHC in wastewater discharge permits or waterbody assessments and 303(d) impaired water determinations.
• Alternative Viewpoint: DEC should undertake additional analysis regarding the potential number of impaired waters created by the proposed criteria and conduct a cost-benefit analysis of the proposed criteria (and decisions leading to its derivation) on the regulated community prior to engaging in rulemaking.
Options Considered for Issue #8 with Pros and Cons
The Workgroup discussed the challenges that may arise with the implementation of revised HHC due to technical assessment issues, ‘legacy’ (i.e., PCBs), and implications when a waterbody is determined to be ‘polluted.’ For several of the proposed HHC, technical feasibility is challenging because projected effluent limitations are below analytical limits of quantification. Hence, there may be a need for alternative compliance mechanisms.
Water quality standards-based tools including reclassification of designated uses, site-specific criteria, intake credits and water quality standards variances were acknowledged as having potential value but place administrative burdens on discharge permittees and the administrating agencies.
Reclassification
18 AAC 70. 230 authorizes the reclassification of designated uses for state waters. In certain cases, physical or chemical factors may preclude the attainment of designated uses. If a change in the designated use is warranted based on a use attainability analysis, states may modify the uses currently assigned. The CWA allows for states to re-designate a water assigned a section 101(a)(2) use (e.g., support of aquatic life and recreation) under the following conditions:
40 CFR 131.11(g):
1. Naturally occurring pollutant concentrations prevent the attainment of the use. 2. Natural, ephemeral, intermittent, or low flow conditions or water levels prevent the
attainment of the use, unless these conditions may be compensated for by the discharge of sufficient volume of effluent discharges to enable uses to be met without violating state water conservation requirements.
3. Human-caused conditions or sources of pollution prevent the attainment of the use and cannot be remedied or would cause more environmental damage to correct than to leave in place.
4. Dams, diversions, or other types of hydrologic modifications preclude the attainment of the use, and it is not feasible to restore the water body to its original condition or to operate such modification in a way which would result in the attainment of the use.
Alaska Department of Environmental Conservation Human Health Criteria Technical Workgroup Report Final Draft. November 13, 2018
44
5. Physical conditions related to the natural features of the water body, such as the lack of a proper substrate, cover, flow, depth, pools, riffles, and unrelated to water quality preclude attainment of aquatic life protection uses.
6. Controls more stringent than those required by CWA sections 301(b) and 306 would result in substantial and widespread economic and social impact.
Site-specific criteria (SSC)
18 AAC 70.235 allow for the establishment of SSC when evidence is presented that the proposed criteria will fully protect designated uses. SSC are typically requested when water quality naturally differs from that adopted by DEC. SSC requests may involve multiple years of data collection to ensure the representativeness of data presented in support of SSC.
Intake Credits
18 AAC 83.545 allows for DEC provide intake credits for manufacturing, commercial, mining, and other facilities that discharge only non-process wastewater If the requirements of 18 AAC 83.545 are met. Discharges must demonstrate through sampling and other technical factors that the pollutant is not present in the discharge or is present only at background levels from intake water and without any increase in the pollutant due to activities of the discharger. Intake credits are only applicable to technology-based effluent limitations guidelines and standards. Since the proposed SSC numeric values for many pollutants are significantly lower than technology-based limits can accommodate, it is likely that water quality based effluent limits (WQBEL) will be required if Reasonable Potential Analysis determine a pollutant to be present. Intake credits for WQBELs will not be allowable until state policies at 18 AAC 83 are modified accordingly.
Water Quality Standards Variances
EPA recently clarified that States have the ability to develop water quality standards variances under the same conditions as established for reclassification of designated uses at 40 CFR 131.11(g). Establishment of variances under the terms of “substantial and widespread economic and social impact” would require in-depth analysis of various economic metrics that may not be readily available to dischargers. DEC has yet to adopt use of water quality based variances into regulation and may need additional time to do so if such a tool will provide any practical alternative. DEC will also need resources and support from EPA to determine the acceptable burden of proof as there are few examples currently available to states; this is especially true of variances that apply to general permits. EPA has estimated costs for water quality standards variances may range from $100,000 to over $400,000 depending on the size of the facility, pollutant complexity, and data requirements.33
General Technology Limitations
EPA has recommended use of fish tissue data for assessing compliance with certain pollutant criteria (i.e., methylmercury and selenium). It is anticipated that EPA-recommended criteria will be issued in the future for other pollutants that have demonstrated high rates of bioaccumulation. Fish
33 Ibid
Alaska Department of Environmental Conservation Human Health Criteria Technical Workgroup Report Final Draft. November 13, 2018
45
tissue data is also useful for serving as an alternative source of supporting information when making water body impairment decisions. The development of fish tissue sampling technology and means implementing that technology in Alaska is challenging due to the limited market for such products. Commercial laboratories do not regularly conduct fish tissue analysis and samples will either need to be processed by the State laboratory or be sent out of state. Washington has been considering incorporating fish tissue as an additional line of evidence when conducting assessments and determining whether a pollutant is ‘persistent’ but DEC has yet to consider how fish tissue data will be used for assessment purposes.
Impairment Determinations
DEC is required to identify waters are being impaired and added to the state’s 303(d) list when water quality standard are exceeded on a persistent basis. Such decisions require development of Total Maximum Daily Loads (TMDLs). TMDLs are pollutant control plans that identify potential sources and ways of facilitating attainment of designated uses. TMDLs require significant state and federal resources to develop (>$25,000) and may result in costs to local permittees (i.e., municipalities and individual permittees) to implement through nonpoint pollution reduction plans and point source reductions. There is potential for revised HHC to result in new impairment determinations and require development of TMDLs in cases where concerns were not previously documented. Several Workgroup members noted that placement of resources into TMDLs for certain pollutants with HHC will ultimately result in less resources being spent on treatment and or source reduction efforts for pollutants that may be better correlated to actual risks to human health.
The Workgroup concluded that DEC will need to ensure coordination between different programs occurs if implementation of revised HHC is to occur in a manner not considered to be overly onerous. While the revised criteria may not result in actual costs to industry, the perception alone has the potential to lead to confusion and mischaracterization of risk to Alaska residents.
Another area of concern when implementing revised criteria has to do with creating synergy between DEC water programs and those of the DEC/DHSS Fish Tissue Monitoring program. The purpose and goals of water quality standards and water quality assessments are distinctly different than those of DEC/DHSS Fish Tissue Monitoring program. Ensuring that there is clear and consistent messaging regarding what is considered ‘safe consumption’ of fish and what do water quality standards actually represent will be very important to subsistence and commercial fishing interests. Messaging will continue to be a significant concern as DEC does not want to infer the consumption of aquatic life is not safe without ample scientific evidence. While some states have chosen to use issuance of Fish Consumption Advisories as proxies for formal water quality assessments, DEC has yet to determine how data collected by either DEC Water or DEC/DHSS Fish Tissue Monitoring will be used in the decision making process.
The Workgroup ultimately determined that implementation of HHC will require a variety of tools, both technical and administrative, and that specific recommendations were not appropriate at this time.
Alaska Department of Environmental Conservation Human Health Criteria Technical Workgroup Report Final Draft. November 13, 2018
46
Alternative Viewpoint
Although the proposed rule does not establish any requirements directly applicable to regulated entities or non-point sources of pollution, state implementation of revised criteria may result in new or revised discharge permit conditions for point source dischargers and additional controls on nonpoint sources of pollutant loadings.
Some of the policy decisions affecting the HHC formula inputs may result in very low HHC without demonstrating additional protection for human health. These low HHC values may increase the number of water bodies listed as ‘impaired,’ even if the consumption of water or fish do not pose actual human health risk.34 There are significant challenges and costs to permitting discharges to impaired waters such that projects that require discharges to ‘impaired’ waters could be delayed or prohibited- regardless of whether the discharge contributes toxic pollutants. Without an analysis of which waterbodies would likely become impaired for specific HHC and the associated State and discharger costs required to develop and implement total maximum daily loads, the State cannot reasonably make informed decisions regarding the proposed methods to derive the HHC.
For unimpaired waters, the revised HHC will likely pose challenges as well due to the stringency of the criteria and currently available technology to test and/or treat pollutants with HHC. DEC has suggested that dischargers use existing implementation tools, such as mixing zones and compliance schedules, to permit discharges. Compliance schedules provide a limited extension of time to adopt technology to meet the HHC, which can temporarily defer some of the compliance costs but is unlikely to reduce the overall cost to dischargers- or their rate payers. All mixing zones are prohibited in anadromous fish spawning waters, so they provide no benefits in much of Alaska. The revised HHC may make some projects uneconomical and limit community and industrial development due to costs for such treatment technology. In addition, for the reasons stated above, it is not clear that the additional treatment and associated cost to meet these more stringent HHC would provide a reduction in human health risk from consumption of fish caught in fresh water. It is recognized that the state has an obligation to establish HHC based on reasonable assumptions to address human health risk. However, the state has wide discretion in determining how to establish and implement HHC that are protective of human health while at the same time not imposing extremely burdensome and unnecessary costs on industry and public infrastructure. Given the real potential that the methods being considered by the state to derive HHC could lead to prohibitive costs without tangible reductions in risk, the state should conduct a thorough and transparent cost-benefit analysis prior to promulgating draft HHC. Each element/assumption in deriving the criteria should be considered in terms of how it actually minimizes risk The cost-benefit analysis should determine the likely costs of HHC implementation to municipal and industrial dischargers and other affected parties.
34 An Economic Analysis for Washington’s Human Health Criteria noted 49 potential impairments (24% increase above baseline) under revised criteria but did note which pollutants were most likely to be contributing to those impairments. See Abt Associates. 2015. Economic Analysis for the Revision of Certain Federal Water Quality Criteria Applicable to Washington. Prepared for U.S. EPA.
Alaska Department of Environmental Conservation Human Health Criteria Technical Workgroup Report Final Draft. November 13, 2018
47
4.0 Issues Raised by the Public This section summarizes issues raised by the public during Workgroup meetings. It does not include comments received by DEC during presentations, conference calls, personal meetings, and other interactions with individuals or groups during 2012. That input will also be considered by DEC.
All Workgroup meetings were advertised and open to the public. Public notice was provided via newspaper ad, website, and email listserv approximately two weeks in advance of every meeting.
During all meetings, public comments were accepted at the end of each meeting day. Comments were made directly to the Workgroup and sometimes included brief discussions with Workgroup participants.
General comments received from the public regarding the Human Health Criteria Workgroup process included:
Comments from Meeting 7
Buck (SEACC): I would like to thank everyone for working on this so hard on these issues and spending the effort on this. I have a couple of comments. I’m sorry that Guy couldn’t participate today. He’s the expert. When you talk about alternatives, one option is no action by DEC. Fifteen years ago, EPA set national criteria for a new fish consumption rate. Alaska’s fish consumption rate falls far under EPA’s updated national criteria. I understand data issues, but it seems remarkable that Alaska can’t move ahead. I would encourage the folks here to do that. The other issue that came up was how to measure limits, i.e., set the criteria at current detection levels. The Clean Water Act is supposed to be technology-forcing. If a discharger needs to reduce pollutants going into the water, they need to do that and develop the methods for measuring those levels.
Mark (UFA): I also appreciate the people participating in this process. One thing I didn’t see, maybe because the discussion papers seem to be older, is the migration of permits, i.e., the migration of people holding permits. I wonder how much goes back to the home communities. If this is the case, it would be interesting to see what their pattern of consumption might be. I think the numbers might be big enough as you look into the movement of people back and forth. People don’t fit into a box of criteria or normal patterns. It may be a large enough number to be worth looking into. Fish may not be consumed where it’s caught.
Comment: This is a good point. I was in a village (in northern Alaska?) where they had Togiak herring eggs. Things move around. A lot of people with fishing permits take the fish home.
Comments from Meeting 11
Ron Rimmelman (NovaGold): I would like to go back to the concept of actually looking at incremental risk. Everyone wants to make sure that the criteria as stringent as possible but it comes with a cost to industry. Are you really getting any benefit associated with it? Whatever criterion you apply to that discharge, are you getting a benefit from it? If you go with the Washington State rate, many western Alaska fish will be impaired. It is striking that you will have criteria lower than fish advisories. Some criteria will be lower than can be detected. Site Specific Criteria was mentioned. It is almost impossible to set a site-specific Human Health Criteria using the existing process.
Alaska Department of Environmental Conservation Human Health Criteria Technical Workgroup Report Final Draft. November 13, 2018
48
Mike Rieser (Donlin Gold): There is a reasonable potential for the proposed criteria to be at or near detection level. How can that be implemented? It seems like it would make things very problematic if you can’t measure what you’re trying to regulate.
Comments from Meeting 12
Tony Gallegos (Ketchikan Indian Community): I have two comments. First thing, communities like Ketchikan are not in the federal subsistence user classification because of their urban status. I’m not sure if our consumption rate was considered because of the fact that we are not considered rural. Consumption is important. We are not sure if Ketchikan’s consumption was considered. Second, the tribal council is concerned that there not be a one sizes fits all for final water quality standards because of significant regional differences. Those are two general comments for the record.
Dennis Nickerson (Prince of Wales Tribal Stewardship Consortium): Thank you. This is my first time at this meeting. Fish consumption rate was added to his work plan for this fiscal year. One of the things I noticed is that we have a lot of resident sport fisherman. I noted that this wasn’t something that was taken into consideration. We have federal subsistence users on Prince of Wales. These are a few ways that I use licenses to catch my fish. Using just subsistence data leaves out other considerations.
Jim Fall (ADF&G): The data we used to calculate harvest and consumption rates include harvest data from all gear types. We’re trying to capture the full range of fish harvest and use by communities.
C: This would be an important clarification for presentations, such as at AFE.
Guy Archibald (Southeast Alaska Conservation Council): I noticed that the consumption of aquatic plants wasn’t included. Will that uncertainly be reflected in somewhere else? Cancer risk?
DEC Response: It is addressed through the Relative Source Contribution.
Guy: Will there be a response to comments published?
DEC Response: Yes. I’ve got several ways to address comments. DEC can collected comments on the webpage and post on the webpage. We can set up a place where people can submit comments directly to the DEC. There will also be a way to see how DEC response to comments.
Dennis: When it comes to outreach and resources, is there a way for tribes to utilize these resources so that we can educate our tribal members?
DEC Response: What I’m hoping to do is develop fact sheets and presentations to drill down to what the technical workgroup told us and what DEC is doing. DEC is planning on doing statewide webinars. We are also trying to do some in-person meetings. We’d like to talk to you more about that.
Alaska Department of Environmental Conservation Human Health Criteria Technical Workgroup Report Final Draft. November 13, 2018
49
APPENDIX A: State and Federal Regulations
State of Alaska Regulations
18 AAC 70.020. Protected water use classes and subclasses; water quality criteria; water quality standards table. (a) Classes and subclasses of use of the state's water protected by criteria set out under (b) of this section are
(1) fresh water (A) water supply
(i) drinking, culinary, and food processing; (ii) agriculture, including irrigation and stock watering; (iii) aquaculture; (iv) industrial;
(B) water recreation (i) contact recreation; (ii) secondary recreation;
(C) growth and propagation of fish, shellfish, other aquatic life, and wildlife; and (2) marine water
(A) water supply (i) aquaculture; (ii) seafood processing; (iii) industrial;
(B) water recreation (i) contact recreation; (ii) secondary recreation;
(C) growth and propagation of fish, shellfish, other aquatic life, and wildlife; and (D) harvesting for consumption of raw mollusks or other raw aquatic life.
(Eff. 11/1/97, Register 143; am 4/29/99, Register 150; am 5/27/99, Register 150; am 6/22/2003, Register 166; am 6/13/2006, Register 178; am 9/1/2006, Register 179; am 9/19/2009, Register 191; am 5/26/2011, Register 198)
Human Health Criteria: Water quality standards for toxic and other deleterious substances for fresh water uses of drinking, culinary, and food processing, and growth and propagation of fish, shellfish, other aquatic life, and wildlife in 18 AAC 70.020(b)(11); and marine water uses of aquaculture, growth and propagation of fish, shellfish, other aquatic life and wildlife, and harvesting for consumption of raw mollusks or other raw aquatic life in 18 AAC 70.020(b)(23) must be based on human health criteria for consumption noted in the Alaska Water Quality Criteria Manual for Toxic and Other Deleterious Organic and Inorganic Substances (2008) and adopted by reference.
18 AAC 70.050. Classification of state water. Except as specified in 18 AAC 70.230(e) [reclassified waters], state water is protected for the following use classes:
(1) fresh water - Classes (1)(A), (1)(B), and (1)(C); (2) groundwater - Class (1)(A);
Alaska Department of Environmental Conservation Human Health Criteria Technical Workgroup Report Final Draft. November 13, 2018
50
(3) marine water - Classes (2)(A), (2)(B), (2)(C), and (2)(D). (Eff. 11/1/97, Register 143)
18 AAC 70.025. Human health risk level for carcinogenic substances. After November 1, 1997, when, to protect human health, the department adopts water quality criteria for a carcinogenic substance, the criteria will be based on a lifetime incremental cancer risk level of 1 in 100,000 for exposed individuals. (Eff. 11/1/97, Register 143)
Authority: AS 46.03.020 AS 46.03.070 AS 46.03.080 AS 46.03.050
Federal Regulations
40 CFR 122.2. Waters of the United States
For purposes of the Clean Water Act, "Waters of the United States" means:
(a) All waters which are currently used, were used in the past, or may be susceptible to use in interstate or foreign commerce, including all waters which are subject to the ebb and flow of the tide;
(b) All interstate waters, including interstate "wetlands"; (c) All other waters such as intrastate lakes, rivers, streams (including intermittent streams),
mudflats, sandflats, “wetlands”, sloughs, prairie potholes, wet meadows, playa lakes, or natural ponds the use, degradation, or destruction of which would affect or could affect interstate or foreign commerce including any such waters: (1) Which are or could be used by interstate or foreign travelers for recreational or other
purposes; (2) From which fish or shellfish are or could be taken and sold in interstate or foreign
commerce; or (3) Which are used or could be used for industrial purposes by industries in interstate
commerce; (d) All impoundments of waters otherwise defined as waters of the United States under this
definition; (e) Tributaries of waters identified in paragraphs (a) through (d) of this definition; (f) The territorial sea; and (g) “Wetlands” adjacent to waters (other than waters that are themselves wetlands) identified in
paragraphs (a) through (f) of this definition.
Waste treatment systems, including treatment ponds or lagoons designed to meet the requirements of CWA (other than cooling ponds as defined in 40 CFR 423.11(m) which also meet the criteria of this definition) are not waters of the United States. This exclusion applies only to manmade bodies of water which neither were originally created in waters of the United States (such as disposal area in wetlands) nor resulted from the impoundment of waters of the United States. [See Note 1 of this section.] Waters of the United States do not include prior converted cropland. Notwithstanding the determination of an area’s status as prior converted cropland by any other federal agency, for the purposes of the Clean Water Act, the final authority regarding Clean Water Act jurisdiction remains with EPA.
Alaska Department of Environmental Conservation Human Health Criteria Technical Workgroup Report Final Draft. November 13, 2018
51
APPENDIX B: References Abt Associates. 2015. Economic Analysis for the Revision of Certain Federal Water Quality Criteria Applicable to Washington. Contract # EP-C-13-03. Prepared for U.S. Environmental Protection Agency. Bethesda, MD.
Alaska Department of Fish and Game-Sportfish. 2016. Email communication with J. Nichols, Research Coordinator, Southeast Region.
Alaska Department of Fish and Game. 2015. Powerpoint™ Presentation to HHC TWG.
ARCADIS. 2014. Derivation of Alternative Human Health Risk-Based Ambient Water Quality Criteria Using Probabilistic Methods for the State of Washington. Submitted to Washington Ecology on behalf of the Northwest Pulp and Paper Association.
Division of Public Health. 2014. A Risk Management Strategy to Optimize the Public’s Health. Alaska Department of Health and Social Services, Section of Epidemiology. State of Alaska
Division of Subsistence. 2016. Seldovia Village Tribe and Alaska Department of Fish and Game Division of Subsistence Fish and Shellfish Consumption Rate Estimate. Alaska Department of Fish and Game. Anchorage, Alaska
Division of Subsistence. 2017. Preliminary Regional Analysis of Fish Consumption Rate Estimates for Rural Alaska Populations. Prepared for the DEC Human Health Criteria Technical Workgroup. Alaska Department of Fish and Game. Anchorage, Alaska.
EPA. 2010. Estimated Fish Consumption Rates for the U.S. Population and Selected Subpopulations (NHANES 2003-2010), Final Report, April 2014, EPA-820-R-14-002.
EPA. 2012. Water Quality Standards Handbook: Second Edition. EPA-823-B-12-002. U.S. Environmental Protection Agency, Office of Science & Technology, Washington, DC.
EPA. 2013. Human Health Ambient Water Quality Criteria and Fish Consumption Rates Frequently Asked Questions. Accessed online at: http://water.epa.gov/scitech/swguidance/standards/criteria/health/methodology/upload/hhfaqs.pdf
EPA. 2014. Estimated Fish Consumption Rates for the U.S. Population and Selected Subpopulations (NHANES 2003-2010). EPA-820-R-14-002. U.S. Environmental Protection Agency, Office of Science & Technology, Washington, DC.
EPA. 2015. Human Health Ambient Water Quality Criteria: 2015 Update. EPA 820-F-15-001. Office of Water. Washington, DC
EPA. 2016. Development of National Bioaccumulation Factors: Supplemental information for EPA’s 2015 Human Health Criteria. Office of Water. Washington, D.C
EPA. 2016. Guidance for Conducting Fish Consumption Surveys. EPA-823-B-16-002. U.S. Environmental Protection Agency, Office of Water, Washington, DC.
EPA. 2018. Response to Council for Utility Water Act Group regarding Petition for Reconsideration of the Environmental Protection Agency’s Partial Disapproval of Washington’s Human Health
Alaska Department of Environmental Conservation Human Health Criteria Technical Workgroup Report Final Draft. November 13, 2018
52
Water Quality Criteria and Implementation Tools submitted by the State of Washington on August 1, 2016, and Repeal of the Final Rule Revision of Certain Federal Water Quality Standards Applicable to Washington. US Environmental Protection Agency, Office of Water, Washington DC.
Laird et. al. 2013. Dietary Advice on Inuit Traditional Food Use Needs to Balance Benefits and Risks of Mercury, Selenium, and N3 Fatty Acids. Journal of Nutrition. Vol 143. No 6. 923-930
O’Neill, Sandra M., James E. West, James C. Hoeman. 1998. “Spatial Trends in the Concentration of Polychlorinated Biphenyls (PCBs) in Chinook (Oncorhynchus tshawytscha) and Coho Salmon (O. kisutch) in Puget Sound and Factors Affecting PCB Accumulation: Results from the Puget Sound Ambient Monitoring Program.” Puget Sound Research ’98 Proceedings, Seattle, Washington, Volume 1, pages 312-328.
Petition for Reconsideration of EPA’s Partial Disapproval of Washington’s Human Health Water Quality Criteria and Implementation Tools submitted by the State of Washington on August 1, 2016, and Repeal of the Final Rule Revision of Certain Federal Water Quality Standards Applicable to Washington, 81 Fed. Reg 85,417 (Nov. 28, 2016). Submitted February 21, 2017 to the Administrator and Acting Assistant Administrator of the Office of Water, U.S. Environmental Protection Agency.
Wolfe, R.J. & Utermohle, C.J. (2000). Wild Food Consumption Rate Estimates for Rural Alaska Populations. Alaska Department of Fish and Game, Division of Subsistence - Technical Paper No. 261. Prepared for the Alaska Department of Conservation, Contaminated Sites Program. ADN No. 1800086. June 2000.
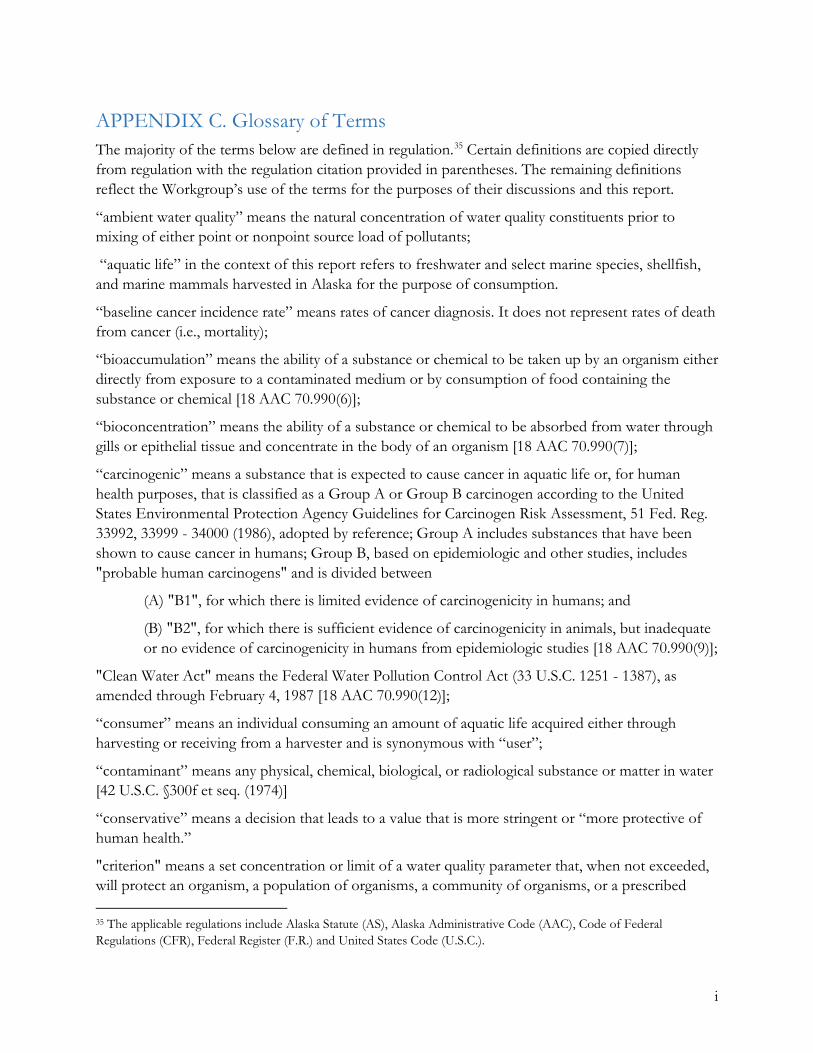
i
APPENDIX C. Glossary of Terms The majority of the terms below are defined in regulation.35 Certain definitions are copied directly from regulation with the regulation citation provided in parentheses. The remaining definitions reflect the Workgroup’s use of the terms for the purposes of their discussions and this report.
“ambient water quality” means the natural concentration of water quality constituents prior to mixing of either point or nonpoint source load of pollutants;
“aquatic life” in the context of this report refers to freshwater and select marine species, shellfish, and marine mammals harvested in Alaska for the purpose of consumption.
“baseline cancer incidence rate” means rates of cancer diagnosis. It does not represent rates of death from cancer (i.e., mortality);
“bioaccumulation” means the ability of a substance or chemical to be taken up by an organism either directly from exposure to a contaminated medium or by consumption of food containing the substance or chemical [18 AAC 70.990(6)];
“bioconcentration” means the ability of a substance or chemical to be absorbed from water through gills or epithelial tissue and concentrate in the body of an organism [18 AAC 70.990(7)];
“carcinogenic” means a substance that is expected to cause cancer in aquatic life or, for human health purposes, that is classified as a Group A or Group B carcinogen according to the United States Environmental Protection Agency Guidelines for Carcinogen Risk Assessment, 51 Fed. Reg. 33992, 33999 - 34000 (1986), adopted by reference; Group A includes substances that have been shown to cause cancer in humans; Group B, based on epidemiologic and other studies, includes "probable human carcinogens" and is divided between
(A) "B1", for which there is limited evidence of carcinogenicity in humans; and
(B) "B2", for which there is sufficient evidence of carcinogenicity in animals, but inadequate or no evidence of carcinogenicity in humans from epidemiologic studies [18 AAC 70.990(9)];
"Clean Water Act" means the Federal Water Pollution Control Act (33 U.S.C. 1251 - 1387), as amended through February 4, 1987 [18 AAC 70.990(12)];
“consumer” means an individual consuming an amount of aquatic life acquired either through harvesting or receiving from a harvester and is synonymous with “user”;
“contaminant” means any physical, chemical, biological, or radiological substance or matter in water [42 U.S.C. §300f et seq. (1974)]
“conservative” means a decision that leads to a value that is more stringent or “more protective of human health.”
"criterion" means a set concentration or limit of a water quality parameter that, when not exceeded, will protect an organism, a population of organisms, a community of organisms, or a prescribed 35 The applicable regulations include Alaska Statute (AS), Alaska Administrative Code (AAC), Code of Federal Regulations (CFR), Federal Register (F.R.) and United States Code (U.S.C.).
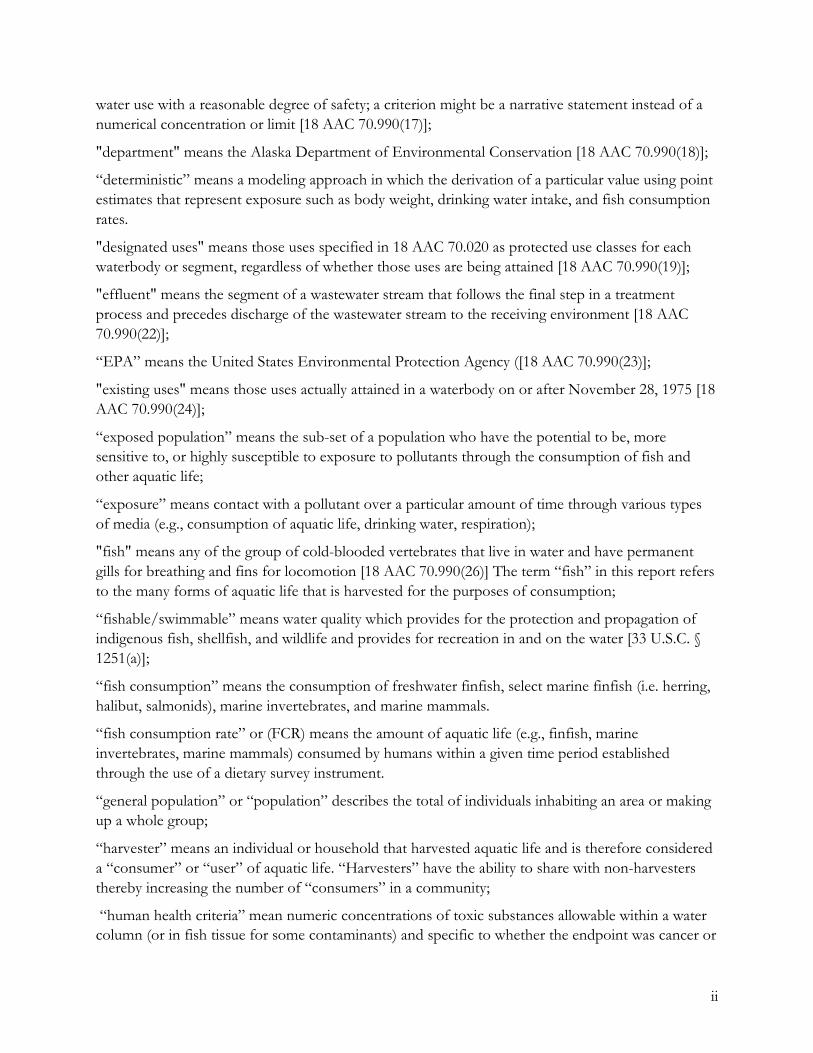
ii
water use with a reasonable degree of safety; a criterion might be a narrative statement instead of a numerical concentration or limit [18 AAC 70.990(17)];
"department" means the Alaska Department of Environmental Conservation [18 AAC 70.990(18)];
“deterministic” means a modeling approach in which the derivation of a particular value using point estimates that represent exposure such as body weight, drinking water intake, and fish consumption rates.
"designated uses" means those uses specified in 18 AAC 70.020 as protected use classes for each waterbody or segment, regardless of whether those uses are being attained [18 AAC 70.990(19)];
"effluent" means the segment of a wastewater stream that follows the final step in a treatment process and precedes discharge of the wastewater stream to the receiving environment [18 AAC 70.990(22)];
“EPA” means the United States Environmental Protection Agency ([18 AAC 70.990(23)];
"existing uses" means those uses actually attained in a waterbody on or after November 28, 1975 [18 AAC 70.990(24)];
“exposed population” means the sub-set of a population who have the potential to be, more sensitive to, or highly susceptible to exposure to pollutants through the consumption of fish and other aquatic life;
“exposure” means contact with a pollutant over a particular amount of time through various types of media (e.g., consumption of aquatic life, drinking water, respiration);
"fish" means any of the group of cold-blooded vertebrates that live in water and have permanent gills for breathing and fins for locomotion [18 AAC 70.990(26)] The term “fish” in this report refers to the many forms of aquatic life that is harvested for the purposes of consumption;
“fishable/swimmable” means water quality which provides for the protection and propagation of indigenous fish, shellfish, and wildlife and provides for recreation in and on the water [33 U.S.C. § 1251(a)];
“fish consumption” means the consumption of freshwater finfish, select marine finfish (i.e. herring, halibut, salmonids), marine invertebrates, and marine mammals.
“fish consumption rate” or (FCR) means the amount of aquatic life (e.g., finfish, marine invertebrates, marine mammals) consumed by humans within a given time period established through the use of a dietary survey instrument.
“general population” or “population” describes the total of individuals inhabiting an area or making up a whole group;
“harvester” means an individual or household that harvested aquatic life and is therefore considered a “consumer” or “user” of aquatic life. “Harvesters” have the ability to share with non-harvesters thereby increasing the number of “consumers” in a community;
“human health criteria” mean numeric concentrations of toxic substances allowable within a water column (or in fish tissue for some contaminants) and specific to whether the endpoint was cancer or
iii
non-cancer. When a pollutant is regulated as a carcinogen, that criterion is derived to prevent exceedance of a particular acceptable incremental increase in the risk of acquiring cancer over the course of a lifetime that is due to pollutant exposure via consumption of fish and water. These incremental cancer risks are typically either one in one million or one in one hundred thousand for the target population the criterion is designed to protect. When a non-cancer toxic effect is the basis for developing a criterion for a particular pollutant, the criteria is designed to result in exposures that are unlikely to cause adverse human health effects.36 A criterion for a pollutant based on a non-cancer toxic effect considers not only exposure via consumption of fish and water, but also exposure to that pollutant from other sources. The criterion is designed so that the sum of exposures from other sources, fish, and water does not exceed an allowable exposure. Human health criteria are designed to protect populations who consume aquatic life from local waters and/or the consumption of untreated surface water;
“lipid fraction” means those components that are soluble in organic solvents (such as ether, hexane or chloroform), but are insoluble in water. The lipid fraction would be the percentage of different types of molecule present in a substance;
“marine mammal” means any mammal which (A) is morphologically adapted to the marine environment (including sea otters and members of the orders Sirenia, Pinnipedia and Cetacea), or (B) primarily inhabits the marine environment (such as the polar bear); and, for the purposes of this report, includes any part of any such marine mammal that is targeted for consumption. "natural condition" means any physical, chemical, biological, or radiological condition existing in a waterbody before any human-caused influence on, discharge to, or addition of material to, the waterbody [18 AAC 70.990(41)];
“market fish” means those fish or other forms of aquatic life that can be purchased commercially for consumption;
“non-consumer” means an individual who does not consume fish or other forms of aquatic life as measured through a dietary instrument;
“persist” means the ability of a substance or chemical not to decay, degrade, transform, volatilize, hydrolyze, or photolyze [18 AAC 70.990(44)];
“point source” means a discernible, confined, and discrete conveyance, including a pipe, ditch, channel, tunnel, conduit, well, container, rolling stock, or vessel or other floating craft, from which pollutants are or could be discharged [18 AAC 70.990(46)];
“pollutant” means dredged spoil, solid waste, incinerator residue, sewage, garbage, sewage sludge, munitions, chemical wastes, biological materials, radioactive materials, heat, wrecked or discarded equipment, rock, sand, cellar dirt and industrial, municipal, and agricultural waste discharged into water [40 CFR 122.2]
"pollution" means the contamination or altering of waters, land, or subsurface land of the state in a manner which creates a nuisance or makes waters, land, or subsurface land unclean, or noxious, or
36 U.S. EPA 2000. Methodology for Deriving Ambient Water Quality Criteria for the Protection of Human Health. EPA-8222-B-00-004. Office of Water. Washington D.C.
iv
impure, or unfit so that they are actually or potentially harmful or detrimental or injurious to public health, safety, or welfare, to domestic, commercial, industrial, or recreational use, or to livestock, wild animals, bird, fish, or other aquatic life (AS 46.03.900);
“population of concern” means a specific part of the general population that is selected for specific study or protection.
“practicable” means available and capable of being done after taking into consideration cost, existing technology, and logistics in light of overall project purposes [18 AAC 70.990(48)];
“probabilistic” means a modeling approach which accounts for variability within populations by allowing one or more of the exposure parameters to be defined as distributions of potential values (i.e., probability density functions). The result is a distribution of potential risk representing a range of possible exposures;
“range” means the difference between the largest and smallest values in a particular data set;
“reference dose” means an estimate the daily oral exposure to the human population (including sensitive subgroups) that is likely to be without an appreciable risk of deleterious effects (not involving cancer) during a lifetime;37
“relative source contribution” means the estimate of the fraction (based on consideration of other exposures to that pollutant) of a pollutant’s reference dose that is allowed from ingestion of fish and water or fish alone;
“risk” means the probability of deleterious health or environmental effects;
“shellfish” means a species of crustacean, mollusk, or other aquatic invertebrate with a shell or shell-like exoskeleton, in any stage of its life cycle [18 AAC 70.990(72)];
"spawning" means the process of producing, emitting, or depositing eggs, sperm, seed, germ, larvae, young, or juveniles, especially in large numbers, by aquatic life [18 AAC 70.990(56)];
“sub- population” means the subset or defined part of the target population that has been identified for a specific purpose, usually requires the ability to estimate an attribute of the subpopulation;
“subsistence” (synonymous with "subsistence uses) means the noncommercial, customary and traditional uses of wild, renewable resources by a resident domiciled in a rural area of the state for direct personal or family consumption as food, shelter, fuel, clothing, tools, or transportation, for the making and selling of handicraft articles out of nonedible by-products of fish and wildlife resources taken for personal or family consumption, and for the customary trade, barter, or sharing for personal or family consumption; in this paragraph, "family" means persons related by blood, marriage, or adoption, and a person living in the household on a permanent basis [AS 16.05.940];
“suppression” means factors that may result in a lower fish consumption rate than would occur if those factors were not present;
37 U.S. Environmental Protection Agency. Integrated Risk Information System (IRIS) Glossary
v
“target population” means the segment of a population that information is sought or is determined to be the subject of a particular action (e.g., protection afforded);
“toxic” means of, relating to, or resulting from a substance or substance combination that causes in affected organisms or their offspring (A) death, disease, malignancy or genetic mutations; (B) abnormalities or malfunctions in growth, development, behavior, or reproduction; or (C) other physical or physiological abnormalities or malfunctions [18 AAC 70.990(61)];
“trophic level” means the level or particular place in a food web and occupied by species with similar feeding behaviors. Trophic level 1 is occupied by primary producers (i.e., plants) while trophic level 4 represents carnivores or apex predators;
“water,” “waterbody,” and “waters” mean “waters of the United States”
“waters of the United States” has the meaning given the term “waters of the United States” in 40 C.F.R. 122.2, as amended through August 15, 1997 [18 AAC 70.990(66)] and includes waters subject to the ebb and flow of the tide, waters that may be used for commerce or recreation, and tributaries, impoundments, the territorial sea, or wetlands adjacent to such waters regardless of whether such waters are intermittent;
“weight of evidence” means the measure of credible proof (i.e., facts) on one side of an issue against that of the other;
“wildlife” means all species of mammals, birds, reptiles, and amphibians [18 AAC 70.990(69)].
i
APPENDIX D. DEC Draft Literature Review
Literature Review of Fish Consumption Rate Research Conducted in the State of
Alaska
June 2014 Modified by DEC as of 8-28-2017
Prepared by
The Cadmus Group, Inc. for
Alaska Department of Conservation
ii
Table of Contents
Introduction ...................................................................................................................................................... 1
Human Health Ambient Water Quality Criteria and Fish Consumption Rates .......................... 2
EPA’s Default FCR and Use in Deriving Water Quality Criteria .......................................................... 2 FCRs in EPA Region 10 States .................................................................................................................... 3 Fish Consumption in Alaska ........................................................................................................................ 3
Research Methods .......................................................................................................................................... 4
Literature Search ............................................................................................................................................ 5 Consultation with Subject Matter Experts ................................................................................................. 5
Review of Data Sources ................................................................................................................................. 5
Dietary Surveys ............................................................................................................................................ 5
The Final Report on the Alaska Traditional Diet Survey Alaska Native Health Board and the Alaska Native Epidemiology Center, March 2004 ................................................................. 8
Evaluation of Seafood and Plant Data Collected from Cook Inlet near the Native Villages of Port Graham, Nanwalek, Seldovia, and Tyonek, Alaska. U.S. Agency for Toxic Substances and Disease Registry, Division of Health Assessment and Consultation, 2009 ................................................................................................................................................... 10
Investigation into Potential Exposures to Mercury Vapor in Small-Scale and Recreational Mining – 2012: Nome Small Scale Mining Areas - Nome, Alaska Alaska Department of Health and Social Services, September, 2013 ................... 11
Dietary Intake of Alaska Native People in Two Regions and Implications of Health: The Alaska Native Dietary and Subsistence Food Assessment Project Jennifer S. Johnson, Elizabeth D. Nobmann, Elvin Assay & Anne P. Lanier; International Journal of Circumpolar Health, 2009 ......................................................................................................... 13
The Diet of Alaska Native Adults: 1987-1988 Elizabeth D. Nobmann, Tim Byers, Anne. P Lanier, Jean H. Hankin and M. Yvonne Jackson; American Journal of Clinical Nutrition, 1992 ................................................................................................................................................... 14
Seafood as Local Food: Food Security and Locally Caught Seafood on Alaska’s Kenai Peninsula Philip A. Loring, S. Craig Gerlach & Hannah L. Harrison; Journal of Agriculture, Food Systems and Community Development, 2013 .................................. 16
Assessment of Cook Inlet Tribes Subsistence Consumption Seldovia Village Tribe Environmental Department, September 2013 .............................................................................. 17
Amchitka Island, Alaska, Biological Monitoring Report 2011 Sampling Results U.S. Department of Energy, September 2013 ...................................................................................... 19
Harvest Assessment Data ....................................................................................................................... 21
General Overview ................................................................................................................................ 21 Data Collection Methods .................................................................................................................... 21 Description of Data ............................................................................................................................. 22 Findings on Fish Harvest Assessment .............................................................................................. 22
iii
Applicability of the Data for use in Determining FCRs ................................................................ 23
Data Gaps and Potential Limitations .................................................................................................. 23
Potential Limitations ........................................................................................................................... 23 Data Gaps ............................................................................................................................................. 23
Recommendations .................................................................................................................................... 24 Resources .................................................................................................................................................... 26
iv
Acronyms
ADEC Alaska Department of Environmental Conservation
ADF&G Alaska Department of Fish and Game
ASFDB Alaska Subsistence Fisheries Database
ATSDR U.S. Agency for Toxic Substances and Disease Registry
BBAHC Bristol Bay Area Health Corporation
CSIS Community Subsistence Information System
CWA Clean Water Act
DDT Dichloro-diphenyl-trichloroethane
DHSS Alaska Department of Health and Social Services
DOE U.S. Department of Energy
EPA U.S. Environmental Protection Agency
FCR Fish Consumption Rate
FFQ Food Frequency Questionnaire
FMRs Fishery Management Reports
g/day Grams per day
IHS U.S. Indian Health Service
NCI
NSHC
National Cancer Institute
Norton Sound Health Corporation
PCB Polychlorinated biphenyls
POP Persistent Organic Pollutants
SEARHC Southeast Alaska Regional Health Consortium
TCC Tanana Chief’s Conference Region
WQC Water Quality Criteria
YKHC Yukon-Kuskokwim Health Corporation

v
Page Intentionally Left Blank
1
Introduction Aquatic life (fresh and marine fish)38 are a fundamental part of the Alaskan lifestyle and economy. Alaska is the largest supplier of domestically-produced seafood in the United States, directly employs over 27,000 Alaska residents in the seafood industry (McDowell, 2013), and draws visitors from around the world to participate in its sportfishing opportunities. Data collected in 2007 determined that over 475,000 resident and non-resident licenced anglers fished 2.5 million days in Alaska and spent nearly 1.4 billion dollars on fishing related goods and services (Southwick Associates Inc. 2008)
For many Alaskans, fish are part of their regular diet, with some studies showing that Alaskans consume six times more fish than the average U.S. citizen (Nobmann, 1992). Alaska health officials recommend that everyone eat fish at least twice a week to obtain important health benefits (DHSS 2014). While fish are considered to be part of a healthy diet, some fish species can bioaccumulate potentially harmful pollutants, such as mercury, in fish tissue. To protect human health from the risks associated with ingesting fish and shellfish that have been exposed to toxic pollutants, the U.S. Environmental Protection Agency (EPA) and states derive water quality criteria (WQC) for use in [s]tate water quality standards. A critical component of developing WQC that are protective of human health is accurately estimating how individuals may be exposed to pollutants through consumption of fish.
The Clean Water Act (CWA) regulations direct States to adopt criteria based upon the 304(a) National Recommended Water Quality Criteria, or in the State’s discretion, 304(a) criteria modified to reflect site-specific conditions or other scientifically defensible methods (40 CFR 131.11 (b)). EPA states in its 2000 Methodology for Deriving Ambient Criteria for the Protection of Human Health at page 2-14 that if a site-specific fish consumption rate is used instead of EPA’s national default rate, the State must assemble appropriate survey data to defend the local fish consumption rate (EPA 2000a).
This report was developed to support the Alaska Department of Environmental Conservation (ADEC) in their efforts to evaluate existing data on the quantity and types of fish and shellfish consumed by Alaskans. This report aims to provide an assessment of the sources and types of data currently available on fish consumption rates in Alaska, and will serve as a preliminary step in the effort to determine a fish consumption rate reflective of Alaskan residents. The remainder of this report is organized as follows:
Section 2 provides an overview of WQC and fish consumption rates; Section 3 describes the methods used to acquire the information summarized in this report; Section 4 presents a review of existing studies and data on fish consumption rates in Alaska; Section 5 describes data gaps and limitations; and Section 6 provides recommendations for future research.
This report is designed to be informational in nature and does not address the policy questions associated with fish consumption rates. It focuses quite specifically on the issue of how much and
38 In most places in this document, unless noted otherwise, aquatic life (fish) refers to both finfish and shellfish.
2
what types of fish are consumed by the people of Alaska, and what data are available about fish consumption rates. The report will not address such issues as establishing a statewide, regional, or local fish consumption rates in Alaska; how revisions to Alaska’s human health water quality criteria (HHC) in water quality standards will be implemented in the Alaska Pollutant Discharge Elimination System (APDES) program, or potential economic outcomes of any rule making that may occur.
Human Health Ambient Water Quality Criteria and Fish Consumption Rates Some pollutants in water, such as mercury and persistent organic pollutants known as (POPs), can bioaccumulate and have toxicological impacts to fish, shellfish, and other aquatic organisms. Pollutants that bioaccumulate can biomagnify up the food chain. This means that the pollutant becomes more concentrated at each higher level of the food chain. Mercury is of particular concern for humans because it affects the central nervous system. Persistent organic pollutants, including polychlorinated biphenyls (PCBs) and dichloro-diphenyl-trichloroethane (DDT), are a group of pollutants that do not readily degrade and pose myriad human health impacts (Department of Health and Social Services (DHSS), 2007; EPA, 2012).
To increase the protection of human health from exposure to these types of toxic pollutants, EPA has developed recommended HHC for 126 “priority” toxic pollutants (EPA, 2000a). A human health criterion sets a target concentration for a given pollutant, below which levels are not expected to pose a significant risk to humans. States and authorized tribes (hereinafter referred to as states) can adopt the recommended HHC or modify them based on site-specific conditions. Because certain populations may be at an increased risk from pollutants in fish (e.g., children, pregnant women, and people who consume a lot of fish and shellfish), fish consumption rate (FCR) is considered when deriving HHC for these types of toxic pollutants. FCR refers to a person’s fish or shellfish consumption per unit of time (i.e. grams per day) (EPA, 2014a).
The following subsection summarizes the evolution of EPA’s recommended FCR since it was first issued in 1992, as well as EPA’s recommendations for how states should develop their own FCR when deriving WQC. The EPA Region 10 subsection describes recent actions in EPA’s Region 10 (which includes Alaska) to update and revise the FCRs when deriving HHC. The Alaska subsection provides a summary of fish consumption trends in Alaska.
EPA’s Default FCR and Use in Deriving Water Quality Criteria As required by Section 304(a) of the Clean Water Act (CWA), EPA has developed recommended human health WQC, which states may adopt or modify based on site-specific conditions (EPA, 2000a). The 1992 National Toxics Rule set numeric HHC for 126 priority toxic pollutants and used a default FCR of 6.5 g/day (EPA, 1992). The recommended FCR value in the HHC formula was updated by EPA in 2000 to 17.5 g/day (EPA, 2000a), and again in 2014 to 22 g/day (EPA, 2014b). The most recent 2014 FCR of 22 g/day was used by EPA in the draft Updated National Recommended Water Quality Criteria - Human Health, which contains updated national recommended human health WQC for 94 pollutants (EPA, 2014b). The default FCR of 22 g/day used in the criteria derivation process represents the 90th percentile consumption rate of freshwater and estuarine fish for the U.S. adult population age 21 and over, based on National Health and Nutrition Examination Survey data
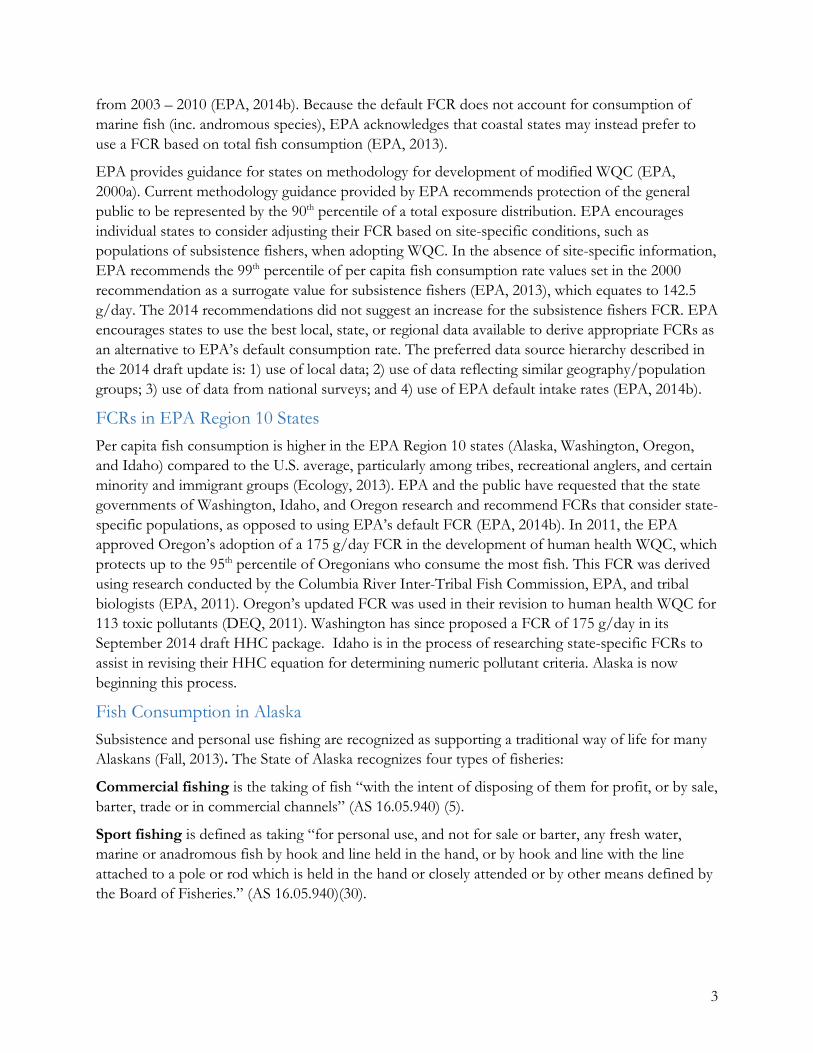
3
from 2003 – 2010 (EPA, 2014b). Because the default FCR does not account for consumption of marine fish (inc. andromous species), EPA acknowledges that coastal states may instead prefer to use a FCR based on total fish consumption (EPA, 2013).
EPA provides guidance for states on methodology for development of modified WQC (EPA, 2000a). Current methodology guidance provided by EPA recommends protection of the general public to be represented by the 90th percentile of a total exposure distribution. EPA encourages individual states to consider adjusting their FCR based on site-specific conditions, such as populations of subsistence fishers, when adopting WQC. In the absence of site-specific information, EPA recommends the 99th percentile of per capita fish consumption rate values set in the 2000 recommendation as a surrogate value for subsistence fishers (EPA, 2013), which equates to 142.5 g/day. The 2014 recommendations did not suggest an increase for the subsistence fishers FCR. EPA encourages states to use the best local, state, or regional data available to derive appropriate FCRs as an alternative to EPA’s default consumption rate. The preferred data source hierarchy described in the 2014 draft update is: 1) use of local data; 2) use of data reflecting similar geography/population groups; 3) use of data from national surveys; and 4) use of EPA default intake rates (EPA, 2014b).
FCRs in EPA Region 10 States Per capita fish consumption is higher in the EPA Region 10 states (Alaska, Washington, Oregon, and Idaho) compared to the U.S. average, particularly among tribes, recreational anglers, and certain minority and immigrant groups (Ecology, 2013). EPA and the public have requested that the state governments of Washington, Idaho, and Oregon research and recommend FCRs that consider state-specific populations, as opposed to using EPA’s default FCR (EPA, 2014b). In 2011, the EPA approved Oregon’s adoption of a 175 g/day FCR in the development of human health WQC, which protects up to the 95th percentile of Oregonians who consume the most fish. This FCR was derived using research conducted by the Columbia River Inter-Tribal Fish Commission, EPA, and tribal biologists (EPA, 2011). Oregon’s updated FCR was used in their revision to human health WQC for 113 toxic pollutants (DEQ, 2011). Washington has since proposed a FCR of 175 g/day in its September 2014 draft HHC package. Idaho is in the process of researching state-specific FCRs to assist in revising their HHC equation for determining numeric pollutant criteria. Alaska is now beginning this process.
Fish Consumption in Alaska Subsistence and personal use fishing are recognized as supporting a traditional way of life for many Alaskans (Fall, 2013). The State of Alaska recognizes four types of fisheries:
Commercial fishing is the taking of fish “with the intent of disposing of them for profit, or by sale, barter, trade or in commercial channels” (AS 16.05.940) (5).
Sport fishing is defined as taking “for personal use, and not for sale or barter, any fresh water, marine or anadromous fish by hook and line held in the hand, or by hook and line with the line attached to a pole or rod which is held in the hand or closely attended or by other means defined by the Board of Fisheries.” (AS 16.05.940)(30).
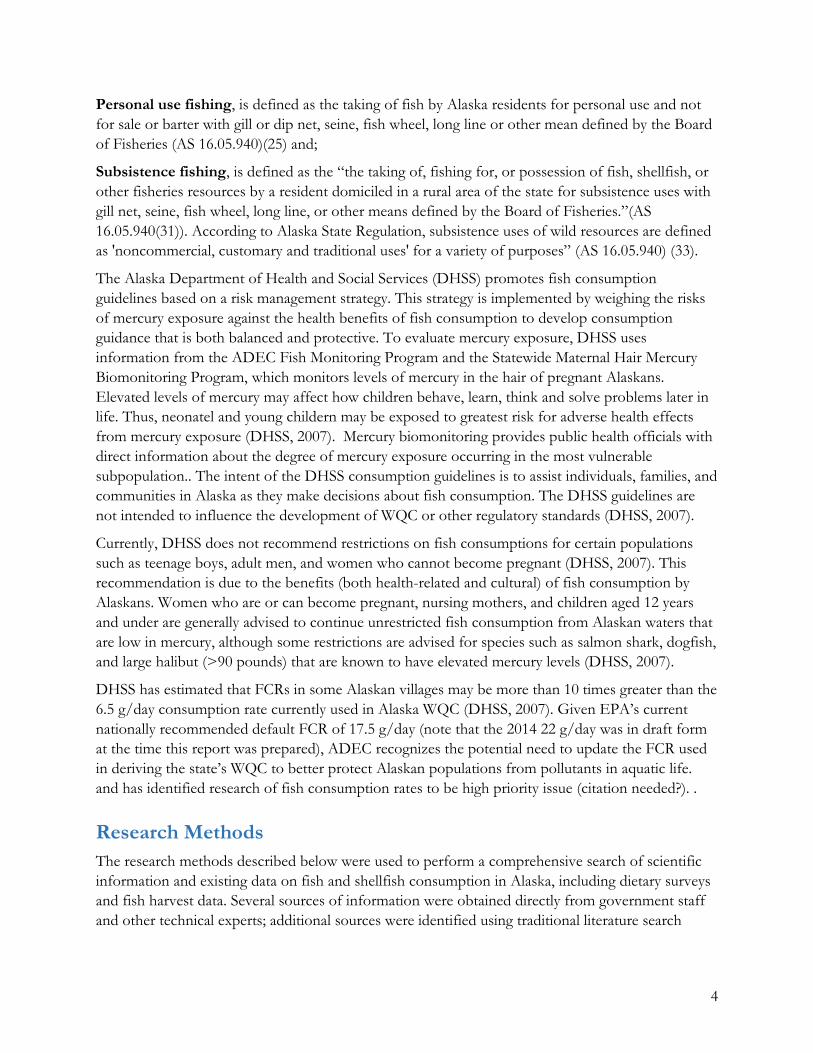
4
Personal use fishing, is defined as the taking of fish by Alaska residents for personal use and not for sale or barter with gill or dip net, seine, fish wheel, long line or other mean defined by the Board of Fisheries (AS 16.05.940)(25) and;
Subsistence fishing, is defined as the “the taking of, fishing for, or possession of fish, shellfish, or other fisheries resources by a resident domiciled in a rural area of the state for subsistence uses with gill net, seine, fish wheel, long line, or other means defined by the Board of Fisheries.”(AS 16.05.940(31)). According to Alaska State Regulation, subsistence uses of wild resources are defined as 'noncommercial, customary and traditional uses' for a variety of purposes” (AS 16.05.940) (33).
The Alaska Department of Health and Social Services (DHSS) promotes fish consumption guidelines based on a risk management strategy. This strategy is implemented by weighing the risks of mercury exposure against the health benefits of fish consumption to develop consumption guidance that is both balanced and protective. To evaluate mercury exposure, DHSS uses information from the ADEC Fish Monitoring Program and the Statewide Maternal Hair Mercury Biomonitoring Program, which monitors levels of mercury in the hair of pregnant Alaskans. Elevated levels of mercury may affect how children behave, learn, think and solve problems later in life. Thus, neonatel and young childern may be exposed to greatest risk for adverse health effects from mercury exposure (DHSS, 2007). Mercury biomonitoring provides public health officials with direct information about the degree of mercury exposure occurring in the most vulnerable subpopulation.. The intent of the DHSS consumption guidelines is to assist individuals, families, and communities in Alaska as they make decisions about fish consumption. The DHSS guidelines are not intended to influence the development of WQC or other regulatory standards (DHSS, 2007).
Currently, DHSS does not recommend restrictions on fish consumptions for certain populations such as teenage boys, adult men, and women who cannot become pregnant (DHSS, 2007). This recommendation is due to the benefits (both health-related and cultural) of fish consumption by Alaskans. Women who are or can become pregnant, nursing mothers, and children aged 12 years and under are generally advised to continue unrestricted fish consumption from Alaskan waters that are low in mercury, although some restrictions are advised for species such as salmon shark, dogfish, and large halibut (>90 pounds) that are known to have elevated mercury levels (DHSS, 2007).
DHSS has estimated that FCRs in some Alaskan villages may be more than 10 times greater than the 6.5 g/day consumption rate currently used in Alaska WQC (DHSS, 2007). Given EPA’s current nationally recommended default FCR of 17.5 g/day (note that the 2014 22 g/day was in draft form at the time this report was prepared), ADEC recognizes the potential need to update the FCR used in deriving the state’s WQC to better protect Alaskan populations from pollutants in aquatic life. and has identified research of fish consumption rates to be high priority issue (citation needed?). .
Research Methods The research methods described below were used to perform a comprehensive search of scientific information and existing data on fish and shellfish consumption in Alaska, including dietary surveys and fish harvest data. Several sources of information were obtained directly from government staff and other technical experts; additional sources were identified using traditional literature search
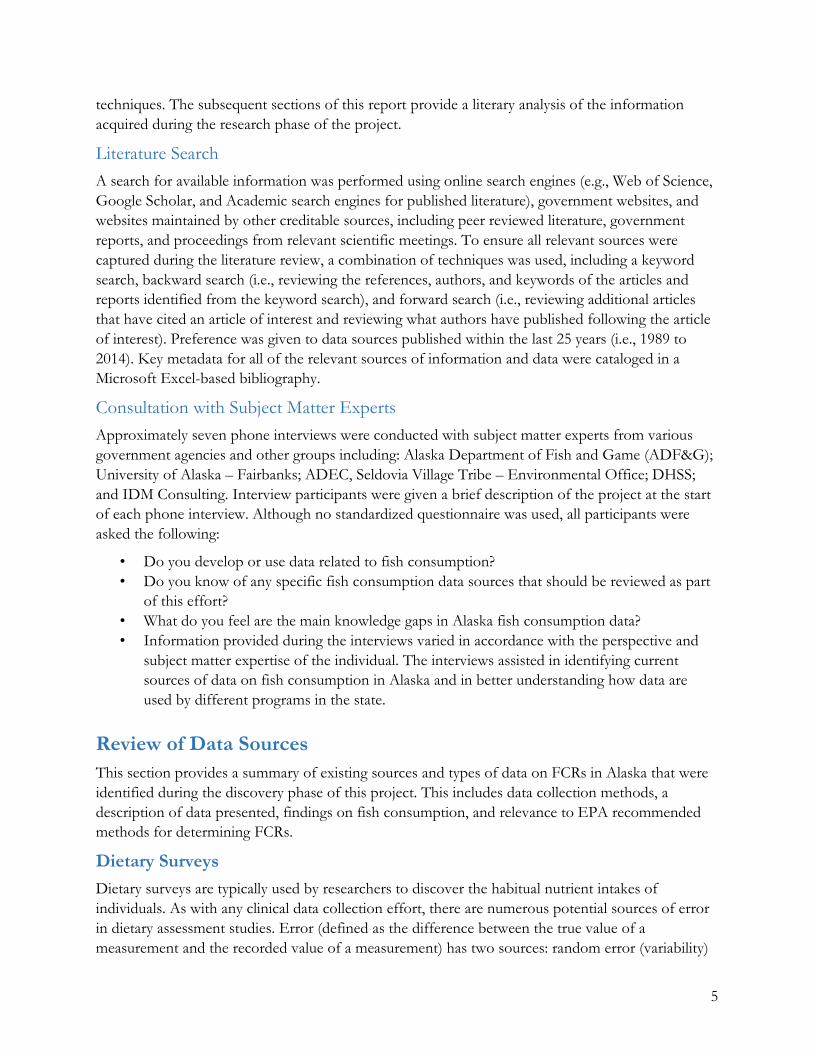
5
techniques. The subsequent sections of this report provide a literary analysis of the information acquired during the research phase of the project.
Literature Search A search for available information was performed using online search engines (e.g., Web of Science, Google Scholar, and Academic search engines for published literature), government websites, and websites maintained by other creditable sources, including peer reviewed literature, government reports, and proceedings from relevant scientific meetings. To ensure all relevant sources were captured during the literature review, a combination of techniques was used, including a keyword search, backward search (i.e., reviewing the references, authors, and keywords of the articles and reports identified from the keyword search), and forward search (i.e., reviewing additional articles that have cited an article of interest and reviewing what authors have published following the article of interest). Preference was given to data sources published within the last 25 years (i.e., 1989 to 2014). Key metadata for all of the relevant sources of information and data were cataloged in a Microsoft Excel-based bibliography.
Consultation with Subject Matter Experts Approximately seven phone interviews were conducted with subject matter experts from various government agencies and other groups including: Alaska Department of Fish and Game (ADF&G); University of Alaska – Fairbanks; ADEC, Seldovia Village Tribe – Environmental Office; DHSS; and IDM Consulting. Interview participants were given a brief description of the project at the start of each phone interview. Although no standardized questionnaire was used, all participants were asked the following:
• Do you develop or use data related to fish consumption? • Do you know of any specific fish consumption data sources that should be reviewed as part
of this effort? • What do you feel are the main knowledge gaps in Alaska fish consumption data? • Information provided during the interviews varied in accordance with the perspective and
subject matter expertise of the individual. The interviews assisted in identifying current sources of data on fish consumption in Alaska and in better understanding how data are used by different programs in the state.
Review of Data Sources This section provides a summary of existing sources and types of data on FCRs in Alaska that were identified during the discovery phase of this project. This includes data collection methods, a description of data presented, findings on fish consumption, and relevance to EPA recommended methods for determining FCRs.
Dietary Surveys Dietary surveys are typically used by researchers to discover the habitual nutrient intakes of individuals. As with any clinical data collection effort, there are numerous potential sources of error in dietary assessment studies. Error (defined as the difference between the true value of a measurement and the recorded value of a measurement) has two sources: random error (variability)
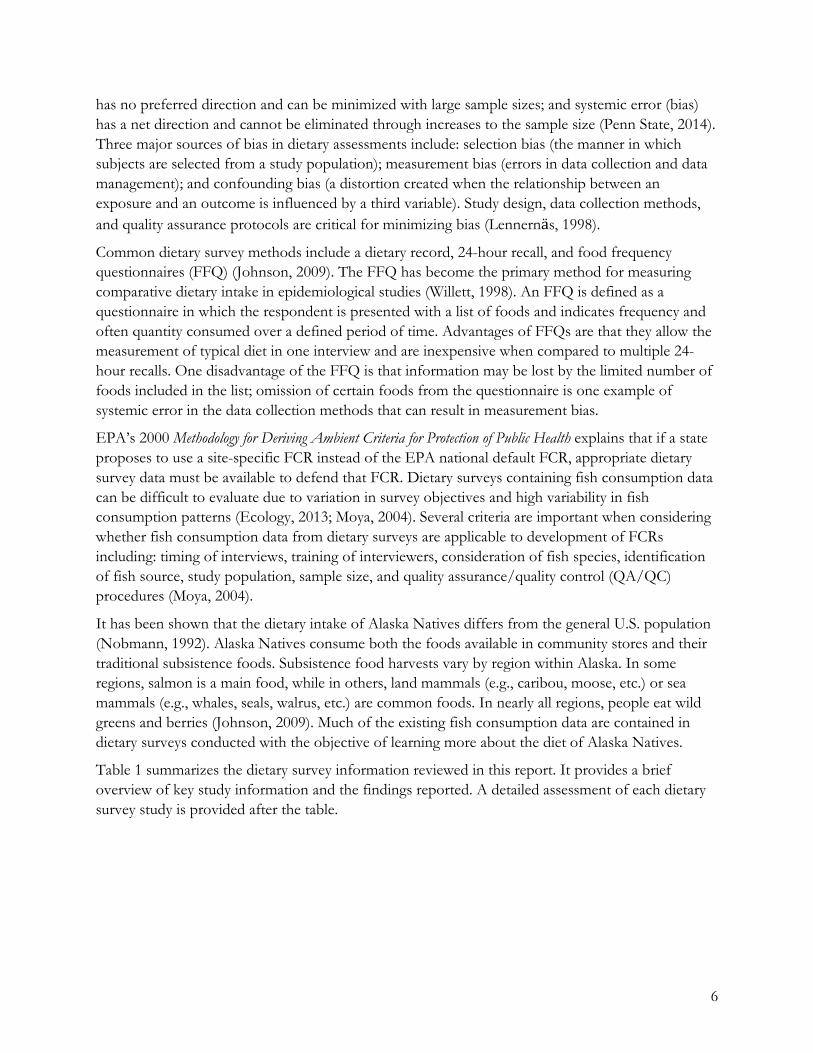
6
has no preferred direction and can be minimized with large sample sizes; and systemic error (bias) has a net direction and cannot be eliminated through increases to the sample size (Penn State, 2014). Three major sources of bias in dietary assessments include: selection bias (the manner in which subjects are selected from a study population); measurement bias (errors in data collection and data management); and confounding bias (a distortion created when the relationship between an exposure and an outcome is influenced by a third variable). Study design, data collection methods, and quality assurance protocols are critical for minimizing bias (Lennernӓs, 1998).
Common dietary survey methods include a dietary record, 24-hour recall, and food frequency questionnaires (FFQ) (Johnson, 2009). The FFQ has become the primary method for measuring comparative dietary intake in epidemiological studies (Willett, 1998). An FFQ is defined as a questionnaire in which the respondent is presented with a list of foods and indicates frequency and often quantity consumed over a defined period of time. Advantages of FFQs are that they allow the measurement of typical diet in one interview and are inexpensive when compared to multiple 24-hour recalls. One disadvantage of the FFQ is that information may be lost by the limited number of foods included in the list; omission of certain foods from the questionnaire is one example of systemic error in the data collection methods that can result in measurement bias.
EPA’s 2000 Methodology for Deriving Ambient Criteria for Protection of Public Health explains that if a state proposes to use a site-specific FCR instead of the EPA national default FCR, appropriate dietary survey data must be available to defend that FCR. Dietary surveys containing fish consumption data can be difficult to evaluate due to variation in survey objectives and high variability in fish consumption patterns (Ecology, 2013; Moya, 2004). Several criteria are important when considering whether fish consumption data from dietary surveys are applicable to development of FCRs including: timing of interviews, training of interviewers, consideration of fish species, identification of fish source, study population, sample size, and quality assurance/quality control (QA/QC) procedures (Moya, 2004).
It has been shown that the dietary intake of Alaska Natives differs from the general U.S. population (Nobmann, 1992). Alaska Natives consume both the foods available in community stores and their traditional subsistence foods. Subsistence food harvests vary by region within Alaska. In some regions, salmon is a main food, while in others, land mammals (e.g., caribou, moose, etc.) or sea mammals (e.g., whales, seals, walrus, etc.) are common foods. In nearly all regions, people eat wild greens and berries (Johnson, 2009). Much of the existing fish consumption data are contained in dietary surveys conducted with the objective of learning more about the diet of Alaska Natives.
Table 1 summarizes the dietary survey information reviewed in this report. It provides a brief overview of key study information and the findings reported. A detailed assessment of each dietary survey study is provided after the table.
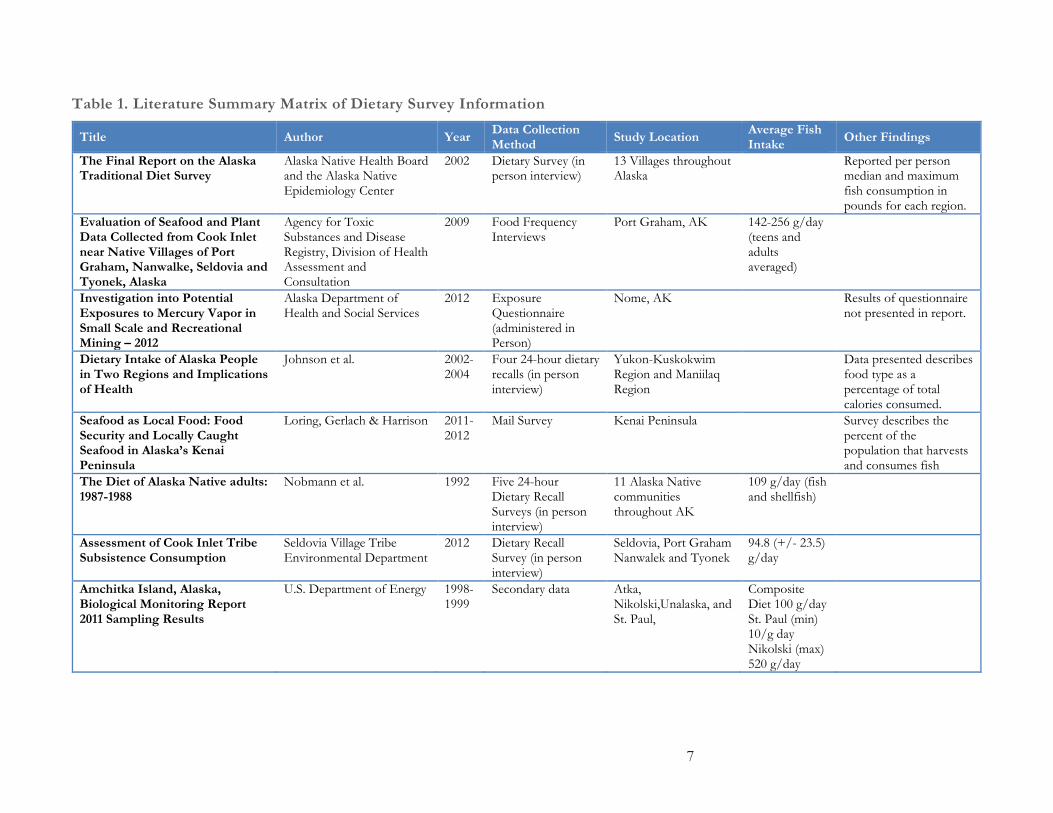
7
Table 1. Literature Summary Matrix of Dietary Survey Information
Title Author Year Data Collection Method Study Location Average Fish
Intake Other Findings
The Final Report on the Alaska Traditional Diet Survey
Alaska Native Health Board and the Alaska Native Epidemiology Center
2002 Dietary Survey (in person interview)
13 Villages throughout Alaska
Reported per person median and maximum fish consumption in pounds for each region.
Evaluation of Seafood and Plant Data Collected from Cook Inlet near Native Villages of Port Graham, Nanwalke, Seldovia and Tyonek, Alaska
Agency for Toxic Substances and Disease Registry, Division of Health Assessment and Consultation
2009 Food Frequency Interviews
Port Graham, AK 142-256 g/day (teens and adults averaged)
Investigation into Potential Exposures to Mercury Vapor in Small Scale and Recreational Mining – 2012
Alaska Department of Health and Social Services
2012 Exposure Questionnaire (administered in Person)
Nome, AK Results of questionnaire not presented in report.
Dietary Intake of Alaska People in Two Regions and Implications of Health
Johnson et al. 2002-2004
Four 24-hour dietary recalls (in person interview)
Yukon-Kuskokwim Region and Maniilaq Region
Data presented describes food type as a percentage of total calories consumed.
Seafood as Local Food: Food Security and Locally Caught Seafood in Alaska’s Kenai Peninsula
Loring, Gerlach & Harrison 2011-2012
Mail Survey Kenai Peninsula Survey describes the percent of the population that harvests and consumes fish
The Diet of Alaska Native adults: 1987-1988
Nobmann et al. 1992 Five 24-hour Dietary Recall Surveys (in person interview)
11 Alaska Native communities throughout AK
109 g/day (fish and shellfish)
Assessment of Cook Inlet Tribe Subsistence Consumption
Seldovia Village Tribe Environmental Department
2012 Dietary Recall Survey (in person interview)
Seldovia, Port Graham Nanwalek and Tyonek
94.8 (+/- 23.5) g/day
Amchitka Island, Alaska, Biological Monitoring Report 2011 Sampling Results
U.S. Department of Energy 1998-1999
Secondary data Atka, Nikolski,Unalaska, and St. Paul,
Composite Diet 100 g/day St. Paul (min) 10/g day Nikolski (max) 520 g/day
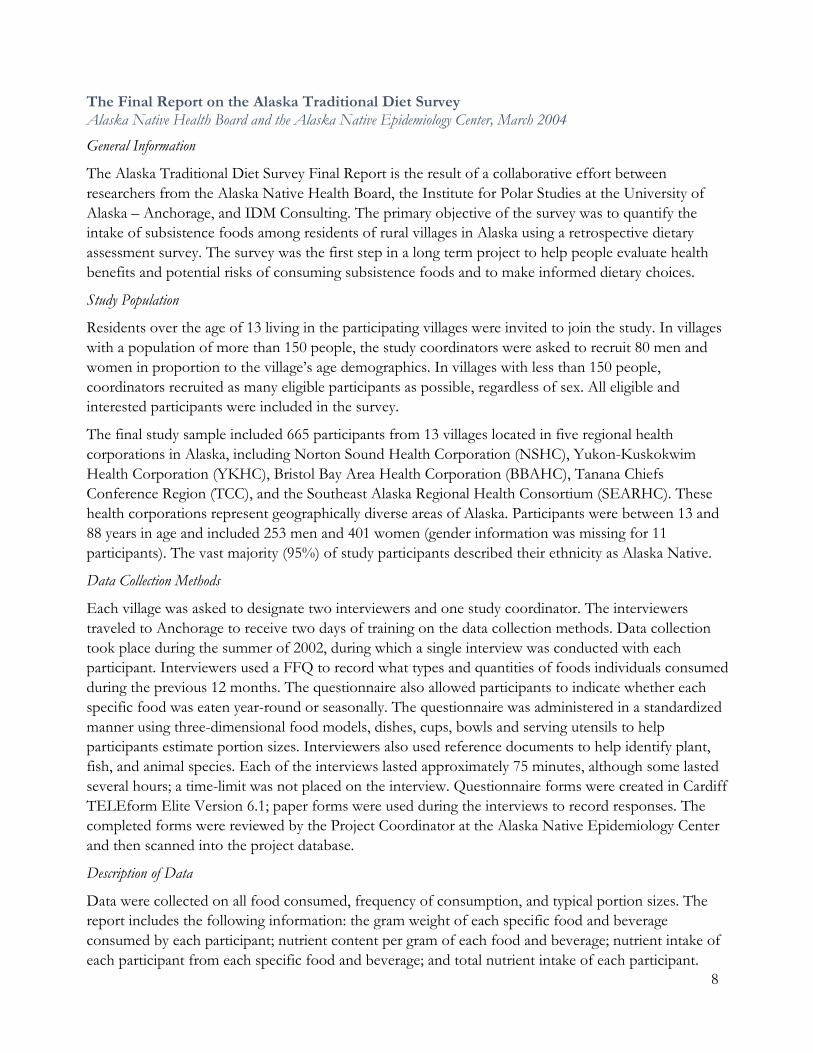
8
The Final Report on the Alaska Traditional Diet Survey Alaska Native Health Board and the Alaska Native Epidemiology Center, March 2004
General Information
The Alaska Traditional Diet Survey Final Report is the result of a collaborative effort between researchers from the Alaska Native Health Board, the Institute for Polar Studies at the University of Alaska – Anchorage, and IDM Consulting. The primary objective of the survey was to quantify the intake of subsistence foods among residents of rural villages in Alaska using a retrospective dietary assessment survey. The survey was the first step in a long term project to help people evaluate health benefits and potential risks of consuming subsistence foods and to make informed dietary choices.
Study Population
Residents over the age of 13 living in the participating villages were invited to join the study. In villages with a population of more than 150 people, the study coordinators were asked to recruit 80 men and women in proportion to the village’s age demographics. In villages with less than 150 people, coordinators recruited as many eligible participants as possible, regardless of sex. All eligible and interested participants were included in the survey.
The final study sample included 665 participants from 13 villages located in five regional health corporations in Alaska, including Norton Sound Health Corporation (NSHC), Yukon-Kuskokwim Health Corporation (YKHC), Bristol Bay Area Health Corporation (BBAHC), Tanana Chiefs Conference Region (TCC), and the Southeast Alaska Regional Health Consortium (SEARHC). These health corporations represent geographically diverse areas of Alaska. Participants were between 13 and 88 years in age and included 253 men and 401 women (gender information was missing for 11 participants). The vast majority (95%) of study participants described their ethnicity as Alaska Native.
Data Collection Methods
Each village was asked to designate two interviewers and one study coordinator. The interviewers traveled to Anchorage to receive two days of training on the data collection methods. Data collection took place during the summer of 2002, during which a single interview was conducted with each participant. Interviewers used a FFQ to record what types and quantities of foods individuals consumed during the previous 12 months. The questionnaire also allowed participants to indicate whether each specific food was eaten year-round or seasonally. The questionnaire was administered in a standardized manner using three-dimensional food models, dishes, cups, bowls and serving utensils to help participants estimate portion sizes. Interviewers also used reference documents to help identify plant, fish, and animal species. Each of the interviews lasted approximately 75 minutes, although some lasted several hours; a time-limit was not placed on the interview. Questionnaire forms were created in Cardiff TELEform Elite Version 6.1; paper forms were used during the interviews to record responses. The completed forms were reviewed by the Project Coordinator at the Alaska Native Epidemiology Center and then scanned into the project database.
Description of Data
Data were collected on all food consumed, frequency of consumption, and typical portion sizes. The report includes the following information: the gram weight of each specific food and beverage consumed by each participant; nutrient content per gram of each food and beverage; nutrient intake of each participant from each specific food and beverage; and total nutrient intake of each participant.
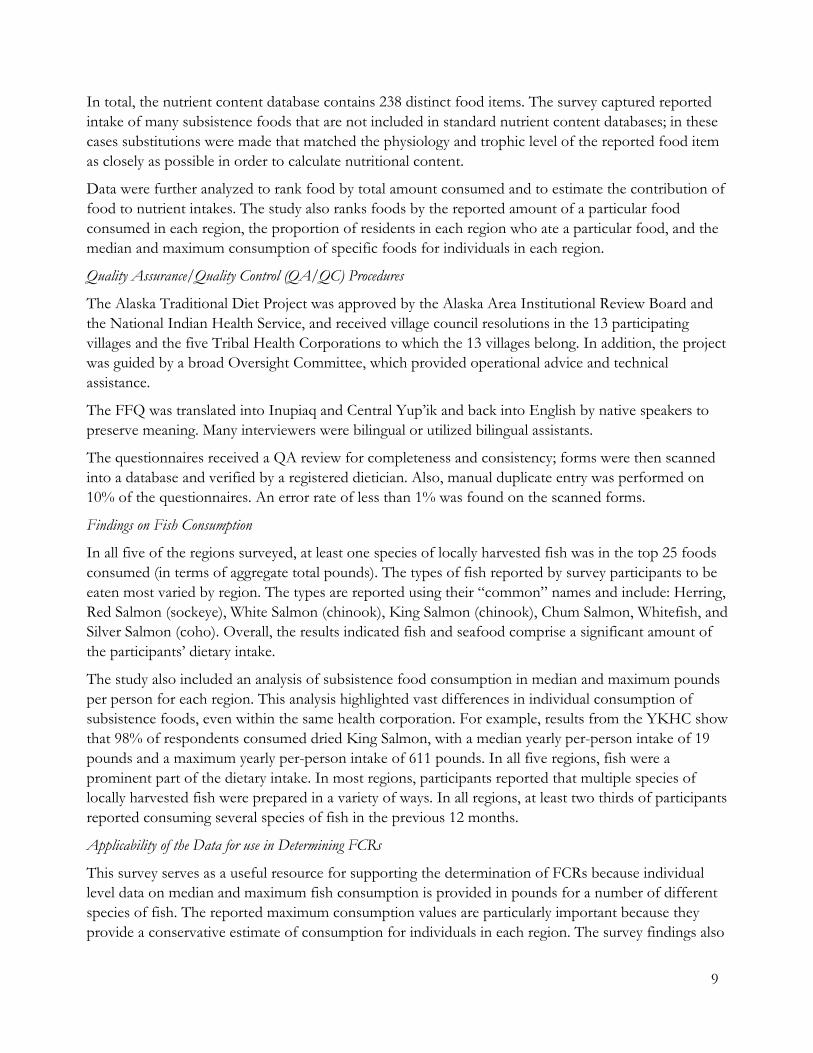
9
In total, the nutrient content database contains 238 distinct food items. The survey captured reported intake of many subsistence foods that are not included in standard nutrient content databases; in these cases substitutions were made that matched the physiology and trophic level of the reported food item as closely as possible in order to calculate nutritional content.
Data were further analyzed to rank food by total amount consumed and to estimate the contribution of food to nutrient intakes. The study also ranks foods by the reported amount of a particular food consumed in each region, the proportion of residents in each region who ate a particular food, and the median and maximum consumption of specific foods for individuals in each region.
Quality Assurance/Quality Control (QA/QC) Procedures
The Alaska Traditional Diet Project was approved by the Alaska Area Institutional Review Board and the National Indian Health Service, and received village council resolutions in the 13 participating villages and the five Tribal Health Corporations to which the 13 villages belong. In addition, the project was guided by a broad Oversight Committee, which provided operational advice and technical assistance.
The FFQ was translated into Inupiaq and Central Yup’ik and back into English by native speakers to preserve meaning. Many interviewers were bilingual or utilized bilingual assistants.
The questionnaires received a QA review for completeness and consistency; forms were then scanned into a database and verified by a registered dietician. Also, manual duplicate entry was performed on 10% of the questionnaires. An error rate of less than 1% was found on the scanned forms.
Findings on Fish Consumption
In all five of the regions surveyed, at least one species of locally harvested fish was in the top 25 foods consumed (in terms of aggregate total pounds). The types of fish reported by survey participants to be eaten most varied by region. The types are reported using their “common” names and include: Herring, Red Salmon (sockeye), White Salmon (chinook), King Salmon (chinook), Chum Salmon, Whitefish, and Silver Salmon (coho). Overall, the results indicated fish and seafood comprise a significant amount of the participants’ dietary intake.
The study also included an analysis of subsistence food consumption in median and maximum pounds per person for each region. This analysis highlighted vast differences in individual consumption of subsistence foods, even within the same health corporation. For example, results from the YKHC show that 98% of respondents consumed dried King Salmon, with a median yearly per-person intake of 19 pounds and a maximum yearly per-person intake of 611 pounds. In all five regions, fish were a prominent part of the dietary intake. In most regions, participants reported that multiple species of locally harvested fish were prepared in a variety of ways. In all regions, at least two thirds of participants reported consuming several species of fish in the previous 12 months.
Applicability of the Data for use in Determining FCRs
This survey serves as a useful resource for supporting the determination of FCRs because individual level data on median and maximum fish consumption is provided in pounds for a number of different species of fish. The reported maximum consumption values are particularly important because they provide a conservative estimate of consumption for individuals in each region. The survey findings also
10
demonstrate the regional and individual differences in fish consumption among several Alaska Native communities.
A limitation of this study is that only a single interview was conducted with each participant. During the interview, participants were asked to recall their dietary habits for the previous 12 months, which could result in incomplete or inaccurate reporting due to the long recall period. The long recall period can also impact information reported on seasonal fluctuations in diet, thereby potentially obscuring important data related to short term increases in fish consumption.
Evaluation of Seafood and Plant Data Collected from Cook Inlet near the Native Villages of Port Graham, Nanwalek, Seldovia, and Tyonek, Alaska. U.S. Agency for Toxic Substances and Disease Registry, Division of Health Assessment and Consultation, 2009
General Information
The Native Villages of Port Graham, Nanwalek, Seldovia, and Tyonek requested assistance from ATSDR in 2003 to assess potential health effects from consumption of subsistence foods by residents of the Cook Inlet region in Southcentral Alaska. Residents had expressed concern that pollutants were potentially released from oil and gas operations into Cook Inlet in quantities that could be harmful to human health.
Following concerns expressed by village residents, the scope of the project was to expanded from evaluating data reported by the EPA for whole fish, mussel/clam, other invertebrate, and plant samples collected from Cook Inlet in 2000 (EPA 2000b). to include an exposure analysis using data from the ADEC fish monitoring study (ADEC, 2005) and the Cook Inlet Regional Citizens Advisory Council Environmental Monitoring Program (Lees, 1999). The EPA datasets provided information on the concentrations of pollutants present in the tissue of sampled fish, bivalves, and other marine invertebrates in the region. Exposure due to the consumption of aquatic life was derived using dietary survey data from the Village of Port Graham that was conducted in 2004. The survey was developed by ATSDR and the Alaskan Native Health Board for use in this consultation. This consumption data was assumed to be representative of the other villages included in the health consultation.
Study Population
Participation in the study was voluntary for residents of Port Graham. Participants included 23 females and 21 males in the following three age groups: elders (65 years of age or older; n = 12); adults (20–64 years; n = 28); and teenagers (n = 4).
Data Collection Methods
A FFQ was used to identify the types and amounts of subsistence foods consumed by study participants during the previous 12 months.
Description of Data
The Village Council provided ATSDR with an Excel database containing responses from the 44 individuals participating in the survey. ATSDR’s Division of Health Studies evaluated the data for the
11
Village Council. ATSDR used the data from the Port Graham dietary survey as a guide in estimating the dose of exposure to pollutants that residents might receive from eating fish caught in Cook Inlet.
The ATSDR Health Consultation Report presents estimated total daily and yearly fish consumption per person for all survey respondents, for each age group.
QA/QC Procedures
No information was provided on the QA/QC procedures utilized during data collection or analysis.
Findings on Fish Consumption
The study found that the primary traditional food consumed was fish, which ranged from 68% of the traditional foods for the teenage age group to 76% of the traditional foods for the elder age group. Overall, fish comprised 70% of traditional native foods consumed. The average fish ingestion rates ranged from 142 g/day to 256 g/day, with an overall village-wide average of 198 g/day. At the request of village residents, ATSDR used a range of daily FCRs to estimate residents’ potential exposure from eating Cook Inlet fish. Specifically, ATSDR used daily fish ingestion rates of 198 g/day, 397 g/day, and 510 g/day for adults. While the average for the village was 198 g/day per day, the upper estimates of 397 g/day and 510 g/day likely represent the FCR for some residents in the village who eat two fish meals a day.
Applicability of the Data for use in Determining FCRs
The survey provides data that can be used to estimate general fish consumption in the Village of Port Graham. The consumption estimates may also be applicable for residents of other villages in close proximity to Cook Inlet. Several limitations to this study should be considered prior to using the data in FCR calculations. The survey size is considered to be small (particularly for some age categories) and the report provides limited detail regarding data collection methods. Additionally, the analyses conducted by ATSDR did not include information on specific fish species consumed. Although information on specific species consumed may have been collected during the initial interviews, in accordance with the data-sharing agreement between the Village Council and ATSDR, all food survey data were returned to the Council. The Port Graham Village Council expressed concern about the quality of the data collected from the survey due to the voluntary nature of participation, and the potential for recall bias (residents were asked to estimate the amount of foods consumed during a 12 month period). The Village Council also noted that the interviewers who collected the information were not familiar with traditional harvesting and gathering practices; therefore, consumption of native foods may have been underreported.
Investigation into Potential Exposures to Mercury Vapor in Small-Scale and Recreational Mining – 2012: Nome Small Scale Mining Areas - Nome, Alaska Alaska Department of Health and Social Services, September, 2013 General Information
The DHSS Section of Epidemiology, in collaboration with federal and state partners, conducted an exposure investigation at the Nome Small-Scale Mining site in Nome, Alaska. Health officials had expressed concerned that miners at the site were potentially exposed to mercury vapor from mining operations, purifying, and heating gold. The exposure investigation assessed urine mercury levels in 18 people who may have been exposed to mercury from gold mining and gold processing activities. In an
12
effort to assess the potential pathways of mercury exposure, a questionnaire was administered to participants, which captured information on fish consumption.
Study Population
Participation in the study was voluntary, and any gold miners who reported contact with mercury or gold amalgams were eligible to participate. Also, people over seven years of age who reported being near miners or others who may have been exposed to mercury in the three weeks prior to testing were eligible. Participants included 15 gold miners, one person who frequently heated gold, and two residents whose homes were in close proximity to a gold heating operation.
Data Collection Methods
The exposure questionnaire was administered in person by the DHSS Section of Epidemiology, and data collected were reviewed by ATSDR personnel. The questionnaire was used to collect information from gold miners, members of their households and residents of the community on their mercury exposure from indoor and outdoor environments in the three weeks prior to the exposure investigation.
Description of Data
Study participants were asked if they had consumed fish (including smoked or dried) that they caught themselves, ate at a restaurant, ate at home, or ate from a can (e.g., canned tuna) within the previous three weeks. Participants who consumed fish during that time were asked to specify the quantity and type of fish consumed at various intervals throughout the previous three weeks (i.e., 24 hours, one week, two weeks, and three weeks).
QA/QC Procedures
The health consultation report notes that the questionnaire was not fully validated or tested prior to administration. Additional detail on QA/QC on collection and analysis of the questionnaire data was not provided.
Findings on Fish Consumption
Data collected on fish consumption were not presented in the report.
Applicability of the Data for use in Determining FCRs
The information collected on fish consumption was not presented in the report, so it is not possible to assess the significance or completeness of the fish consumption data. Additionally, the investigation had a small sample size, and was not intended to be distributed in a representative manner across age and gender. There is likely some bias in the data collected since the investigation primarily recruited miners and members of their households, so the data are not likely representative of the general Nome community or other communities in the region. However, the temporal scale of the data is unique in that the quantity and type of fish consumed is assessed over a series of relatively short periods (24 hours to three weeks). This provides an opportunity to better understand fluctuations in consumption, as well as the potential for acute pollutant exposures through short term increases in fish consumption. Additionally, the potential for recall bias is reduced due to the limited the length of time for which participants are asked to report consumption. Alternatively, there is potential to misclassify a participant’s pollutant exposure if their fish consumption is highly variable between months or seasons. Ultimately,
13
the dataset would need to be obtained from DHSS and reviewed before a determination of applicability for developing FCRs can be made.
Dietary Intake of Alaska Native People in Two Regions and Implications of Health: The Alaska Native Dietary and Subsistence Food Assessment Project Jennifer S. Johnson, Elizabeth D. Nobmann, Elvin Assay & Anne P. Lanier; International Journal of Circumpolar Health, 2009
General Information
Researchers from the Alaska Native Tribal Health Consortium and EDN Nutrition Consulting undertook a study to better understand the energy and nutrient intake from various food types among Alaska Native people in two regions of Alaska. The purpose of the study was to explore the impact of food choices on the development of chronic disease among Alaska Native people.
Study Population
The study drew participants from the Yukon-Kuskokwim Region (population of 20,714) in Southwestern Alaska and the Maniilaq Region (population of 6,876) in northwest Alaska. Both regions are remote and villages are accessible only by plane or boat. A total of 12 Yup’ik/Cup’ik, Athabaskan, and Inupiat Eskimo villages within the two regions were selected for inclusion in the study. Alaska Native residents aged 13 and over were invited to participate in the study. The goal was to enroll a minimum of 20 participants per village with equal numbers in each age category. In total, the survey had 333 participants ages 13 to 88, including 218 women and 115 men.
Data Collection Methods
Between 2002 and 2004, trained interviewers conducted four 24-hour dietary recalls in which participants were asked to describe all food and beverages consumed during the previous 24-hours. The initial recall was conducted during an in-person visit, while the three subsequent recalls were conducted over the telephone. Recalls were conducted in each of the four seasons to capture temporal variability in dietary consumption. The recalls had no predetermined time constraint, allowing participants the opportunity to provide unlimited detail on type of food, food source, food processing method, food preparation, and other relevant information. Participants received a standard set of measuring cups and spoons to assist with description of portion sizes.
Description of Data
Information was collected on all food consumed, including store bought food and locally harvested foods such as fish, wild greens, berries, and wild game, as well as oil and meat from seals, walrus, and whales. Commonly reported fish consumed included sheefish, king salmon, dried chum salmon, and whitefish- all locally harvested. Other types of fish consumed, such as tuna and fish sticks, were categorized as store bought. In total, participants reported consuming 1,818 different foods including more than 100 subsistence foods. Data presented in the report are expressed as proportion of energy and specific nutrients contributed to total diet by defined food groups.
QA/QC Procedures
The study was approved by the Alaska Area Institutional Review Board, the Yukon Kuskokwim Health Center, the Maniilaq Association, and the Tribal Councils of all participating communities. Interviewers
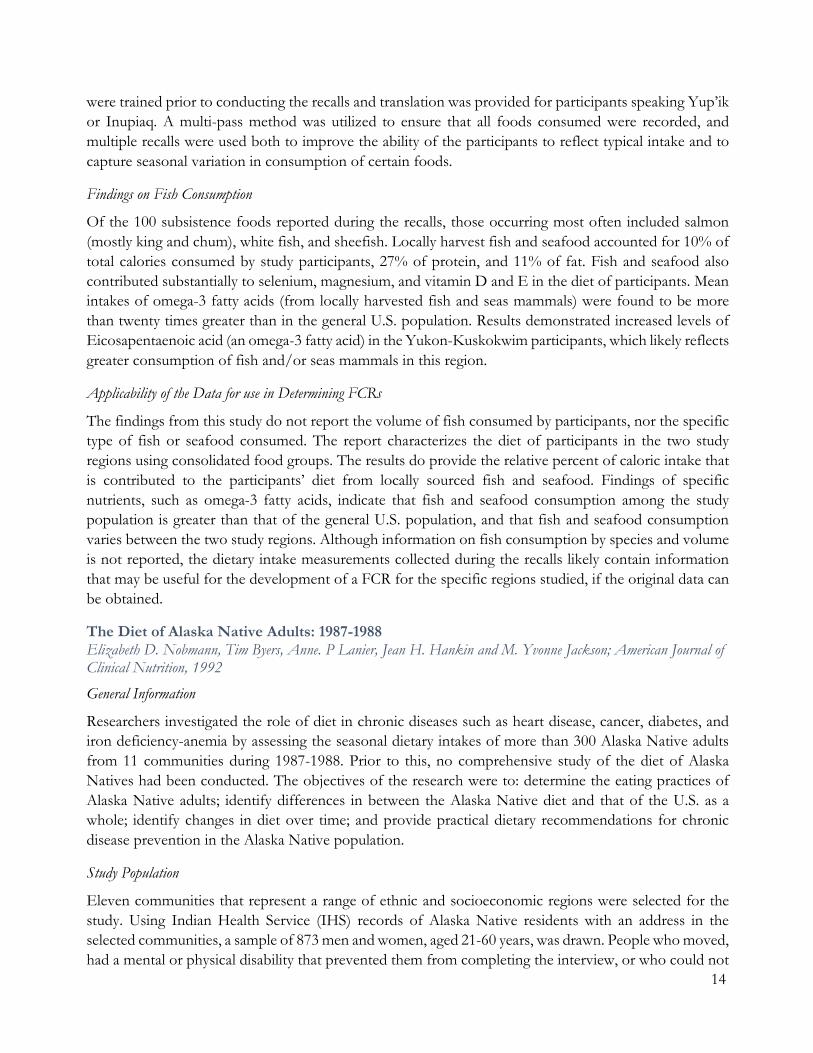
14
were trained prior to conducting the recalls and translation was provided for participants speaking Yup’ik or Inupiaq. A multi-pass method was utilized to ensure that all foods consumed were recorded, and multiple recalls were used both to improve the ability of the participants to reflect typical intake and to capture seasonal variation in consumption of certain foods.
Findings on Fish Consumption
Of the 100 subsistence foods reported during the recalls, those occurring most often included salmon (mostly king and chum), white fish, and sheefish. Locally harvest fish and seafood accounted for 10% of total calories consumed by study participants, 27% of protein, and 11% of fat. Fish and seafood also contributed substantially to selenium, magnesium, and vitamin D and E in the diet of participants. Mean intakes of omega-3 fatty acids (from locally harvested fish and seas mammals) were found to be more than twenty times greater than in the general U.S. population. Results demonstrated increased levels of Eicosapentaenoic acid (an omega-3 fatty acid) in the Yukon-Kuskokwim participants, which likely reflects greater consumption of fish and/or seas mammals in this region.
Applicability of the Data for use in Determining FCRs
The findings from this study do not report the volume of fish consumed by participants, nor the specific type of fish or seafood consumed. The report characterizes the diet of participants in the two study regions using consolidated food groups. The results do provide the relative percent of caloric intake that is contributed to the participants’ diet from locally sourced fish and seafood. Findings of specific nutrients, such as omega-3 fatty acids, indicate that fish and seafood consumption among the study population is greater than that of the general U.S. population, and that fish and seafood consumption varies between the two study regions. Although information on fish consumption by species and volume is not reported, the dietary intake measurements collected during the recalls likely contain information that may be useful for the development of a FCR for the specific regions studied, if the original data can be obtained.
The Diet of Alaska Native Adults: 1987-1988 Elizabeth D. Nobmann, Tim Byers, Anne. P Lanier, Jean H. Hankin and M. Yvonne Jackson; American Journal of Clinical Nutrition, 1992
General Information
Researchers investigated the role of diet in chronic diseases such as heart disease, cancer, diabetes, and iron deficiency-anemia by assessing the seasonal dietary intakes of more than 300 Alaska Native adults from 11 communities during 1987-1988. Prior to this, no comprehensive study of the diet of Alaska Natives had been conducted. The objectives of the research were to: determine the eating practices of Alaska Native adults; identify differences in between the Alaska Native diet and that of the U.S. as a whole; identify changes in diet over time; and provide practical dietary recommendations for chronic disease prevention in the Alaska Native population.
Study Population
Eleven communities that represent a range of ethnic and socioeconomic regions were selected for the study. Using Indian Health Service (IHS) records of Alaska Native residents with an address in the selected communities, a sample of 873 men and women, aged 21-60 years, was drawn. People who moved, had a mental or physical disability that prevented them from completing the interview, or who could not
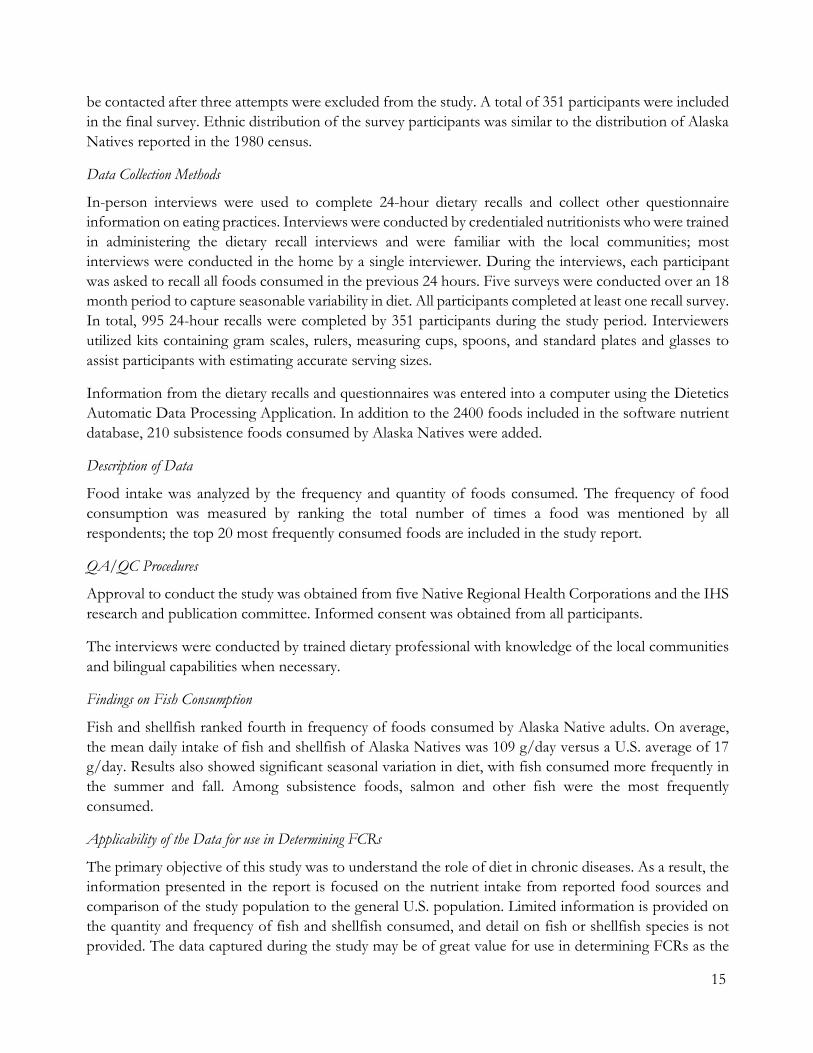
15
be contacted after three attempts were excluded from the study. A total of 351 participants were included in the final survey. Ethnic distribution of the survey participants was similar to the distribution of Alaska Natives reported in the 1980 census.
Data Collection Methods
In-person interviews were used to complete 24-hour dietary recalls and collect other questionnaire information on eating practices. Interviews were conducted by credentialed nutritionists who were trained in administering the dietary recall interviews and were familiar with the local communities; most interviews were conducted in the home by a single interviewer. During the interviews, each participant was asked to recall all foods consumed in the previous 24 hours. Five surveys were conducted over an 18 month period to capture seasonable variability in diet. All participants completed at least one recall survey. In total, 995 24-hour recalls were completed by 351 participants during the study period. Interviewers utilized kits containing gram scales, rulers, measuring cups, spoons, and standard plates and glasses to assist participants with estimating accurate serving sizes.
Information from the dietary recalls and questionnaires was entered into a computer using the Dietetics Automatic Data Processing Application. In addition to the 2400 foods included in the software nutrient database, 210 subsistence foods consumed by Alaska Natives were added.
Description of Data
Food intake was analyzed by the frequency and quantity of foods consumed. The frequency of food consumption was measured by ranking the total number of times a food was mentioned by all respondents; the top 20 most frequently consumed foods are included in the study report.
QA/QC Procedures
Approval to conduct the study was obtained from five Native Regional Health Corporations and the IHS research and publication committee. Informed consent was obtained from all participants.
The interviews were conducted by trained dietary professional with knowledge of the local communities and bilingual capabilities when necessary.
Findings on Fish Consumption
Fish and shellfish ranked fourth in frequency of foods consumed by Alaska Native adults. On average, the mean daily intake of fish and shellfish of Alaska Natives was 109 g/day versus a U.S. average of 17 g/day. Results also showed significant seasonal variation in diet, with fish consumed more frequently in the summer and fall. Among subsistence foods, salmon and other fish were the most frequently consumed.
Applicability of the Data for use in Determining FCRs
The primary objective of this study was to understand the role of diet in chronic diseases. As a result, the information presented in the report is focused on the nutrient intake from reported food sources and comparison of the study population to the general U.S. population. Limited information is provided on the quantity and frequency of fish and shellfish consumed, and detail on fish or shellfish species is not provided. The data captured during the study may be of great value for use in determining FCRs as the
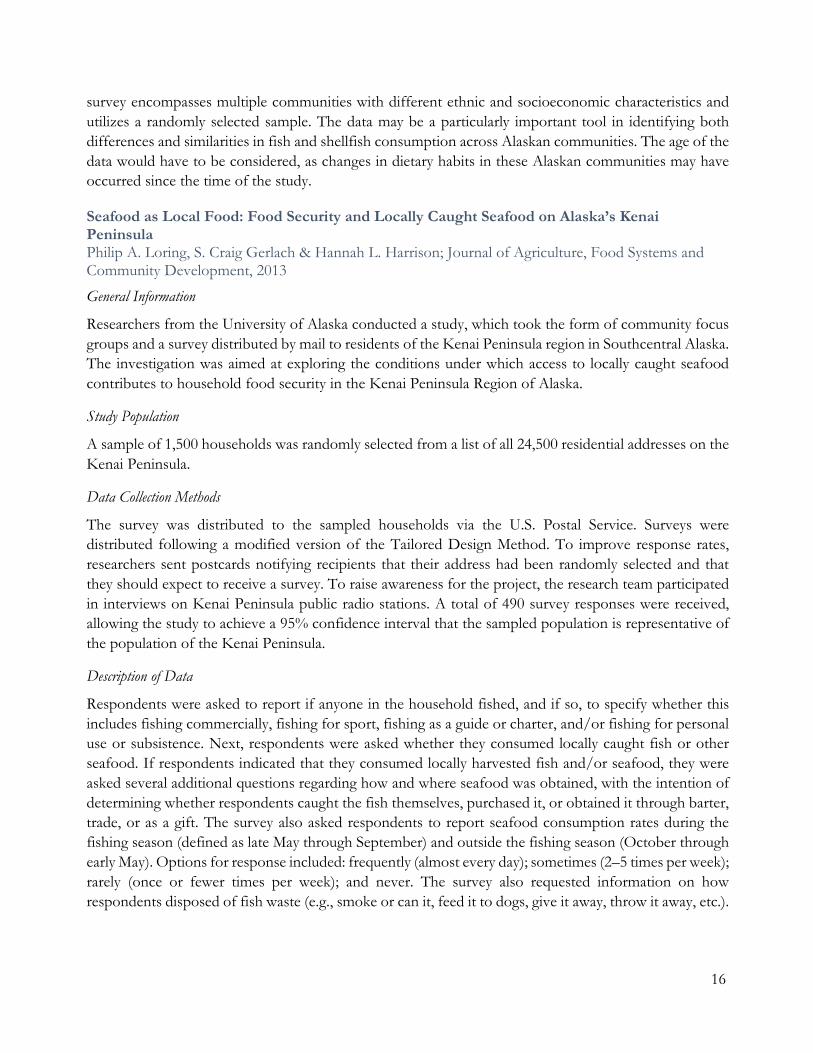
16
survey encompasses multiple communities with different ethnic and socioeconomic characteristics and utilizes a randomly selected sample. The data may be a particularly important tool in identifying both differences and similarities in fish and shellfish consumption across Alaskan communities. The age of the data would have to be considered, as changes in dietary habits in these Alaskan communities may have occurred since the time of the study.
Seafood as Local Food: Food Security and Locally Caught Seafood on Alaska’s Kenai Peninsula Philip A. Loring, S. Craig Gerlach & Hannah L. Harrison; Journal of Agriculture, Food Systems and Community Development, 2013
General Information
Researchers from the University of Alaska conducted a study, which took the form of community focus groups and a survey distributed by mail to residents of the Kenai Peninsula region in Southcentral Alaska. The investigation was aimed at exploring the conditions under which access to locally caught seafood contributes to household food security in the Kenai Peninsula Region of Alaska.
Study Population
A sample of 1,500 households was randomly selected from a list of all 24,500 residential addresses on the Kenai Peninsula.
Data Collection Methods
The survey was distributed to the sampled households via the U.S. Postal Service. Surveys were distributed following a modified version of the Tailored Design Method. To improve response rates, researchers sent postcards notifying recipients that their address had been randomly selected and that they should expect to receive a survey. To raise awareness for the project, the research team participated in interviews on Kenai Peninsula public radio stations. A total of 490 survey responses were received, allowing the study to achieve a 95% confidence interval that the sampled population is representative of the population of the Kenai Peninsula.
Description of Data
Respondents were asked to report if anyone in the household fished, and if so, to specify whether this includes fishing commercially, fishing for sport, fishing as a guide or charter, and/or fishing for personal use or subsistence. Next, respondents were asked whether they consumed locally caught fish or other seafood. If respondents indicated that they consumed locally harvested fish and/or seafood, they were asked several additional questions regarding how and where seafood was obtained, with the intention of determining whether respondents caught the fish themselves, purchased it, or obtained it through barter, trade, or as a gift. The survey also asked respondents to report seafood consumption rates during the fishing season (defined as late May through September) and outside the fishing season (October through early May). Options for response included: frequently (almost every day); sometimes (2–5 times per week); rarely (once or fewer times per week); and never. The survey also requested information on how respondents disposed of fish waste (e.g., smoke or can it, feed it to dogs, give it away, throw it away, etc.).
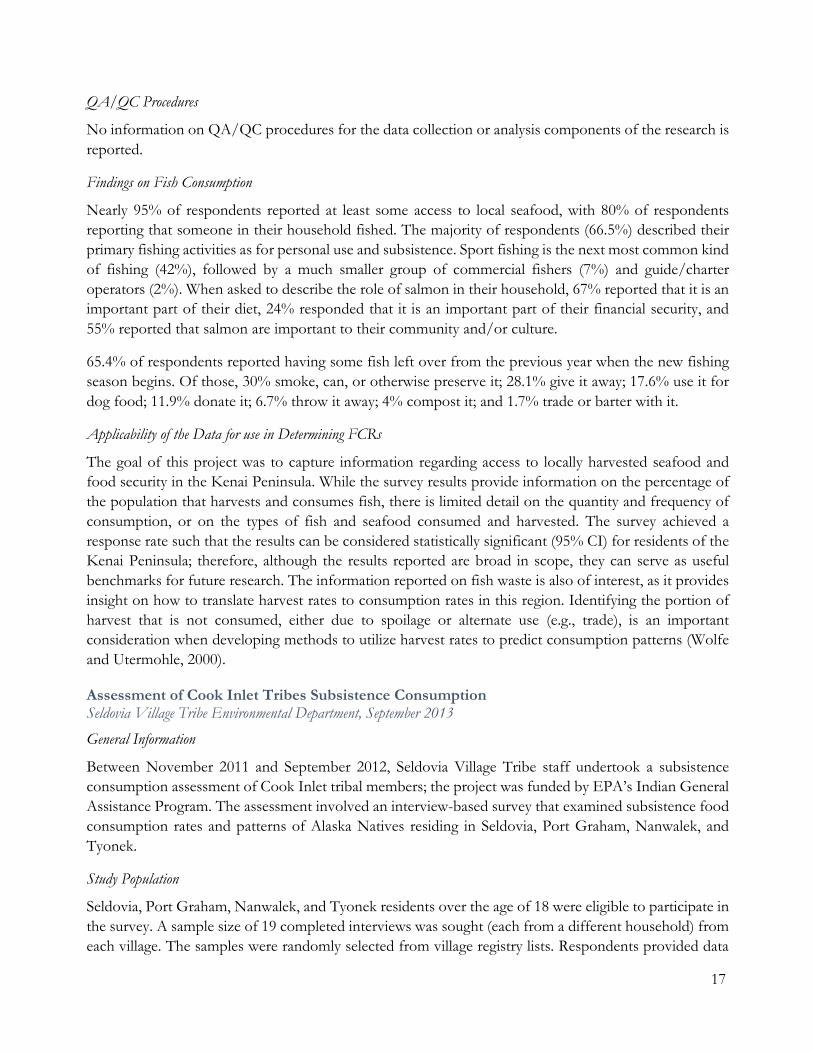
17
QA/QC Procedures
No information on QA/QC procedures for the data collection or analysis components of the research is reported.
Findings on Fish Consumption
Nearly 95% of respondents reported at least some access to local seafood, with 80% of respondents reporting that someone in their household fished. The majority of respondents (66.5%) described their primary fishing activities as for personal use and subsistence. Sport fishing is the next most common kind of fishing (42%), followed by a much smaller group of commercial fishers (7%) and guide/charter operators (2%). When asked to describe the role of salmon in their household, 67% reported that it is an important part of their diet, 24% responded that it is an important part of their financial security, and 55% reported that salmon are important to their community and/or culture.
65.4% of respondents reported having some fish left over from the previous year when the new fishing season begins. Of those, 30% smoke, can, or otherwise preserve it; 28.1% give it away; 17.6% use it for dog food; 11.9% donate it; 6.7% throw it away; 4% compost it; and 1.7% trade or barter with it.
Applicability of the Data for use in Determining FCRs
The goal of this project was to capture information regarding access to locally harvested seafood and food security in the Kenai Peninsula. While the survey results provide information on the percentage of the population that harvests and consumes fish, there is limited detail on the quantity and frequency of consumption, or on the types of fish and seafood consumed and harvested. The survey achieved a response rate such that the results can be considered statistically significant (95% CI) for residents of the Kenai Peninsula; therefore, although the results reported are broad in scope, they can serve as useful benchmarks for future research. The information reported on fish waste is also of interest, as it provides insight on how to translate harvest rates to consumption rates in this region. Identifying the portion of harvest that is not consumed, either due to spoilage or alternate use (e.g., trade), is an important consideration when developing methods to utilize harvest rates to predict consumption patterns (Wolfe and Utermohle, 2000).
Assessment of Cook Inlet Tribes Subsistence Consumption Seldovia Village Tribe Environmental Department, September 2013
General Information
Between November 2011 and September 2012, Seldovia Village Tribe staff undertook a subsistence consumption assessment of Cook Inlet tribal members; the project was funded by EPA’s Indian General Assistance Program. The assessment involved an interview-based survey that examined subsistence food consumption rates and patterns of Alaska Natives residing in Seldovia, Port Graham, Nanwalek, and Tyonek.
Study Population
Seldovia, Port Graham, Nanwalek, and Tyonek residents over the age of 18 were eligible to participate in the survey. A sample size of 19 completed interviews was sought (each from a different household) from each village. The samples were randomly selected from village registry lists. Respondents provided data
18
for themselves and the youngest child living in the household. Compiled data were weighted based upon the number of tribal households in each village. The study procured the sample size necessary to achieve 95% confidence of the mean consumption within a bound of 9 grams, assuming a standard deviation of 30 g/day. The majority of interviews were conducted in May 2012.
Data Collection Methods
Researchers used a single dietary recall survey to obtain information on respondents’ diets. The questionnaire asked for consumption information on 29 species of Cook Inlet fish, specifically chosen because they are known to be traditionally harvested by tribal members and because they all can be found locally at least part of the year. Fish fillet (three ounce and five ounce) models were shown to respondents to help them determine accurate consumption amounts, and interviewers were also equipped with fish reference books to ensure species consumed were correctly identified. The 18-page questionnaire consisted of 36 questions within five sections (memory recall, adult consumption of fish, child consumption of fish, adult consumption of non-fish subsistence foods, and obtaining fish). Respondents were asked about the number of fish meals they consume on a weekly basis, on average, and throughout the year, and about their consumption of different fish species and fish parts.
In addition to the types and quantity of fish consumed, the survey also aimed to capture information on seasonal variation in fish consumption. Respondents were asked to identify the two months of the year they consume the most fish and the two months they consume the least fish. Respondents were then asked to estimate the average number of fish meals per week they consumed during the two months they identified as the highest and least months of consumption.
Additional data collected on the questionnaire included information on the source of fish (self- harvested, grocery store, or gift) and preparation methods. The survey also contained questions on consumption of other types of locally available seafood.
Description of Data
The report presents a substantial amount of information on fish and seafood consumption of adults in children. For adults, results presented include: rates of fish consumption, seasonal consumption rates, consumption of different fish species and parts, fish preparation methods, and the origin of the fish consumed. For children: age when the individual began eating fish, rates of consumption, and consumption of different species and parts.
QA/QC Procedures
Several measures were undertaken to ensure QA/QC during the data collection process. An initial pretest was conducted to identify any potential problems with the delivery of the questions. Interviewers were trained through self-study and a webinar conducted by the Seldovia Village Tribe Environmental Department. For each interview, in addition to the trained interviewer, a monitor was present to ensure the interview was conducted correctly and that the questionnaire was completed. For all participants who consented, the interview was recorded so that responses could later be clarified if needed.
Findings on Fish Consumption
Results revealed that the average daily FCR for Cook Inlet tribal members was 94.8 (± 23.5 SE) g/day. Tribal members in their mid to late thirties through early to mid-sixties consumed the most fish; males consumed more fish than females; fishers consumed more fish than non-fishers; and salmon was one of
19
the top consumed fish. The average daily rate of fish consumption for children 5 years old and younger was 34.9 (± 17.4 SE) g/day. The average daily consumption rate of shellfish for adults was 12.0 (± 3.4 SE) g/day. The two months of highest fish consumption were June and July or July and August for 51.9% of the respondents. For all months identified as high fish consumption months (i.e. months identified by each respondent as their two months of highest fish consumption), respondents consumed an average of 116.4 (± 19.3 SE) g/d of fish. During all low-fish consumption months, respondents consumed an average of 41.0 g/d (± 6.4 SE).
Coho salmon was the fish species eaten by the greatest number of respondents (89.5% of respondents), followed by halibut (83.9% of respondents), chinook salmon (79.0% of respondents), sockeye salmon (75.4% of respondents), and pink salmon (63.8% of respondents). In terms of quantity (g/day), coho salmon had the highest average daily consumption rate by respondents at 31.2 (± 9.7 SE) g/d followed by sockeye salmon at 22.8 (± 5.5 SE) g/d and pink salmon at 17.1 (± 4.6 SE).
Applicability of the Data for use in Determining FCRs
This study was specifically focused on obtaining and presenting information on fish consumption by residents of Alaska Native communities in the Cook Inlet region. The information presented is directly applicable to determining FCRs in the region. The primary limitation of the data is the small sample sizes, which results in a large standard error. There also exists the potential for misclassification of respondents’ consumption due to recall bias, as a single survey was used to analyze consumption over a period of 12 months. Additionally, the surveys were administered at different times throughout the year, which may have impacted reported consumption between respondents. Despite the potential limitations, the data provide detailed information on the type and quantity of fish and seafood consumed by age and gender, as well as detailed information on procurement, food preparation, and seasonal consumption behaviors. The study is likely representative of fish consumption research that can be executed at a local government scale, given the fiscal and human resource constraints experienced by many municipal health and environmental offices.
Amchitka Island, Alaska, Biological Monitoring Report 2011 Sampling Results U.S. Department of Energy, September 2013
General Information
The Long-Term Surveillance and Maintenance Plan for the U.S. Department of Energy (DOE) Office of Legacy Management is an ongoing environmental monitoring effort that has taken place on Amchitka Island, Alaska since before 1965, in an effort to mitigate harmful effects to human health and the environment from three nuclear test sites located on the island. The most recent monitoring report describes data collected from biological and seawater samples from the marine and terrestrial environment of Amchitka Island (adjacent to the three detonation sites) and at a background site, Adak Island, 180 miles to the east.
The first stated objective of the 2011 sampling effort was to collect and analyze marine flora and fauna, lichen, soil, and marine sediments for nuclear test-related radionuclides to determine if subsistence and commercial-catch seafood in the study area is safe to eat. In order to assess exposure, consumption estimates were derived using diet intake surveys previously conducted at three Alaska Native Villages located in the Aleutian Islands:, Atka, Nikolski, and Unalaska; and St. Paul Island (Bartell et al. 1999; Hamrick et al. 2003; Hamrick and Smith 2003). DOE compiled the data and developed a composite Aleut
20
diet used to estimate the potential risk of ingesting seafood harvested (both from a subsistence and commercial basis) from Amchitka.
Study Population
The participants of the diet surveys represented a mix of male and female individuals that were 15 years or older, except for a small number of younger participants in part of the Atka diet survey.
Data Collection Methods
For the Atka diet data, diet information was reported in terms of g/day for three survey periods: June to September 1998; June to December 1998; and January to April 1999. Given that the first period overlapped with the second period, data for the second period were used, whenever available, with those for the third period to determine the average consumption rates. The reported average daily consumption rates for participants were used. Although the diet assessments do not cover an entire year, it was assumed that the diet pattern was applicable for the entire year.
The diet data for St. Paul, Nikolski, and Unalaska were reported as consumption frequency, expressed as the number of portions per year. The results were multiplied by the corresponding amount in grams per portion, and then divided by 365 days per year to obtain the average daily intake rates in grams per day. Similar to the Atka diet data, the reported average frequencies for participants were used in the calculations.
For fish types of which multiple varieties are included in the diet, all species were combined to give the total intake rate for that fish or seafood type. This approach was necessary to provide a common basis for developing ingestion rates of different species within the four sets of diet data because the level of detail regarding the varieties of species consumed was not identical between the different studies.
Description of Data
Average consumption in g/day is presented for each village and as a composite diet for 13 fish, mollusks, and crustaceans. On the basis of these species-specific intake rates, the total seafood intake rate over all species was determined, and the distributions of the total consumption rate among different species were calculated. The consumption rates for the composite diet and those for the four villages represent the seafood diet of an average adult Aleut in Alaska.
QA/QC Procedures
QA/QC procedures utilized in the development of the average daily consumption rates per village and the composite diet were not documented in the report.
Findings on Fish Consumption
The report demonstrates a wide range of average daily consumption between villages and the types of fish eaten in each village. Daily consumption ranged from an average of 10 g/day in St. Paul to 520 g/day in Nikolski. Three of the four villages reported that salmon comprised the highest proportion of their
21
seafood diet, while St. Paul reported halibut as the high proportion of seafood consumed. The composite data of the four villages resulted in an average daily intake rate of 100 g/day including 49 g/day of salmon.
Applicability of the Data for use in Determining FCRs
This report provides a useful example of how data from multiple studies can be used to evaluate consumption rates for a region. The study takes a conservative approach by developing composite consumption values from the four villages, but also retains the village level consumption information to use as a range of potential consumption values. The comparison of the village level data and the composite values highlights the differences in quantity and type of seafood consumed even within a single region, among residents of similar cultural background. One limitation to the aggregate approach is that some specificity on the species of seafood consumed is lost due to variation in the data collection methods.
Harvest Assessment Data Harvest data are another potential source of information that can be used to develop human health WQC. While states often have programs in place to monitor fish catch activity, multiple considerations must be taken into account when using fish harvest data to estimate consumption rates. A determination must be made as to what portion of the fish are kept and consumed, what the usable weight of the harvest is, and how that harvest may be shared among households (Kissinger, 2014).
General Overview
The ADF&G is the principle source of fish and seafood harvest data in Alaska. Harvest data are collected and reported by multiple divisions within the department (Fall, 2011), including the following:
The Division of Commercial Fisheries prepares annual Fishery Management Reports (FMRs) for most fishery management areas in the state. The FMRs focus on commercial fisheries, but also routinely summarize basic data for the programs that collect harvest data for subsistence fisheries and personal use fisheries that the division administers. Annual reports about Subsistence Fishers Harvest Assessment Programs are prepared for the Northwest Alaska, Yukon River, and Kuskokwim River areas. The Division of Sport Fish prepares summaries for the personal use salmon fisheries it administers in the Cook Inlet and Prince William Sound (Upper Copper River) areas. The Division of Subsistence produces three final products: reports in the Technical Paper Series and Special Publications Series, and two databases; the Community Subsistence Information System; and the Alaska Subsistence Fisheries Database. Since 1999, as part of its Technical Paper Series, the Division of Subsistence has published the Annual Subsistence Fisheries Report Series, which compiles subsistence and personal use fisheries harvest data from all management areas.
Data Collection Methods
The ADF&G Division of Subsistence uses a variety of research methods in its collection of subsistence data including: systematic household studies; mapping harvest areas; key respondent interviews; participant observation; database and library research; and harvest monitoring using permits and post-season surveys (Fall, 2011).
22
Description of Data
Alaska Subsistence Fisheries Database: Initiated in 1999 by ADF&G Division of Subsistence, the Alaska Subsidence Fisheries Database (ASFDB) compiles information from annual subsistence salmon harvest monitoring programs and includes information for all fisheries management areas. Most of the annual harvest monitoring programs focus on salmon, however there is also limited information on other types of fish and marine invertebrates. Most harvest monitoring programs in the state collect information on total harvest by species, harvest timing, number of participants in the fishery, location of harvest, and residence of participant fisher (Lemons, 2011).
Community Subsistence Information System: The Community Subsistence Information System (CSIS) is the repository of Alaska community harvest information collected by the ADF&G Division of Subsistence. The database includes harvest information by community, resource category, region, State Subsistence Region, Federal Subsistence Region, and information pertaining to specific game management units. It also contains community information on local demographics and economics, as well as documents the methods used to conduct subsistence research in each community. The CSIS can be found online at: http://www.adfg.alaska.gov/sb/CSIS/.
Technical Paper Series: The Technical Paper Series is the most complete collection of current information about subsistence in Alaska, and represents a substantial portion of the ADF&G Division of Subsistence’s research. The papers cover all regions of the state. Some papers were written in response to specific fish and game management issues, including harvest assessments. Other papers provide detailed data on the subsistence use of particular communities, information that is critical for analysis of multiple scientific and policy issues within Alaska. Analyses of data contained the ASFDB and the CSIS are frequently included in the Technical Paper Series reports. A full description of all the various types of Fishing and Subsistence publications can be found on ADF&G’s website at: http://www.adfg.alaska.gov/sf/publications/index.cfm?ADFG=main.reportTypes
Findings on Fish Harvest Assessment
Technical Paper No. 387 – Alaska Subsistence and Personal Use Salmon Fisheries 2011 Annual Report provides the most recent summary of compiled data on subsistence and personal use salmon harvest data. Using the data collected by the harvest monitoring program, ADF&G estimates that more than 1.63 million pounds of salmon are harvested by more than 60,000 permitted households.
Subsistence in Alaska: A Year 2012 Update estimates that rural Alaskans harvest approximately 295 pounds of wild foods per person each year on average, and approximately 53% (or 156 pounds) of this subsistence harvest is fish. While there is likely variation in fish harvest between communities, ADF&G estimates that 95% of total rural household participating in subsistence activities use fish and 83% harvest fish themselves.
Technical Paper No. 261 by Robert J. Wolfe and Charles J. Utermohle proposes a standardized method for estimating measures of wild food consumption in Alaska using indirect measures based on annual harvest and use of wild resources from household surveys conducted by ADF&G Division of Subsistence. The report discusses the process of extrapolating consumption estimates, but does not provide specific consumption data. However, Ouzinkie, Kodiak Island is used to demonstrate application of the process and results are presented for mean per capita harvest, percentage contribution to total
23
harvest, mean wild food use in g/day, 95% percent upper confidence limit of the mean, 50th percentile use, 95th percentile use, and 100th percentile use. These values are provided for more than 25 species of fish. For fish overall, it is estimated that the mean use per person in Ouzinkie is 367.37 g/day (95% CI).
Applicability of the Data for use in Determining FCRs
The ADF&G has a large amount of data on subsistence harvest of food including data on catch, use, and preparation of fish for different regions throughout the state. Any effort to determine FCRs should be conducted in close consultation with ADF&G to understand what data may be applicable for this purpose. Technical Paper No. 261 provides a potential method that can be applied with ADF&G datasets. The capacity in ADF&G to capture subsistence data is highly developed with monitoring and information gathering programs in place throughout the state. A collaborative effort to understand the systemic differences between use data calculated from harvest data and dietary survey data would be highly beneficial and potentially lead to development of a predictive model of consumption.
Data Gaps and Potential Limitations Potential Limitations
The literature reviewed and summarized in this report provides an overview of existing information and data that may be useful in future efforts to develop a methodology for calculating FCRs for Alaska. In total, eight dietary survey reports were reviewed for potentially applicable data for use in determining FCRs. Of the eight studies, four report FCR findings in g/day including:
Two surveys conducted in the Cook Inlet Region, One study conducted in the Aleutian Region (which used secondary data to create a composite regional FCR) and, One survey with sampled population from throughout Alaska. The following are potential limitations of the studies for use in developing a methodology for calculating FCRs for Alaska:
Small sample sizes; Localized study populations; Potential differences in the way the surveys were administered; and Varying study objectives, rendering it impossible to identify any single data source that meets all the required criteria to adequately determine an FCR appropriate for use in deriving Alaska WQC, especially at a state-wide level. Future surveys conducted in support of efforts to calculate FCRs should be designed specifically to avoid these types of limitations.
Data Gaps
Several data gaps and are discussed below.
Populations Assessed
Data from ADF&G demonstrate that individuals living in rural areas of Alaska are more likely to rely on subsistence fishing and have higher FCRs (ADF&G, 2014). These populations could be prioritized for any potential additional research on fish consumption, as they likely represent maximum FCRs in Alaska;
24
and a potential single statewide consumption rate needs to take into account these populations. If the state determines that a regional approach is preferred, additional research could investigate the FCRs of Alaskans who participate in recreational fishing or consume seafood in a manner that is not defined as subsistence so that the sample is more representative of all groups living or recreating in that region. The results of the eight dietary surveys reviewed are representative primarily of Alaska Natives living in rural, often costal, areas who participate in subsistence harvest practices. Thus, any assumptions of urban consumption patterns were be speculative.
Temporal Variability
Seasonal fluctuations in fish consumption are difficult to capture using typical dietary survey designs and are potentially substantial, with the greatest variation reported among non-subsistence populations (Moya, 2004). Information on seasonal fish consumption is obscured if dietary recall information over a long time span (e.g., 12 months) is used to develop daily averages. Several studies capture information on seasonal fluctuations (Ballew et al. 2004; Johnson et al. 2009; Loring, Gerlach & Harrison 2013; Nobmann et al. 1992; SVT 2013) and contain information on the months of highest consumption, but change in FCR is only specified in one report (SVT, 2013). In that study, estimated average FCR for residents of the Seldovia Village Tribe during the highest two consumption months was almost three times greater than FCR during the lowest two consumption months. Additional information from diverse study populations is needed to further understand the specific fluctuations in amount of fish consumed from month to month among Alaskan consumers.
Regional Variances
Significant variances in consumption patterns are observed within populations of the same ethnicity in similar geographic locations, as well as between individuals in the same village. Further research and analysis would be needed to determine whether the variances are due to differences in the consumption habits, or due to misclassification caused by bias in the survey results.
Recommendations Although the existing data sources reviewed in this report have limitations, they provide findings that can inform preliminary efforts to develop FCRs for Alaska. For instance, Ballew et al. (2004) reports maximum per person consumption in pounds per year in coastal subsistence communities, which provides an estimate of fish consumption for individuals who are likely to be among Alaska’s highest fish consumers. Additionally, findings by Nobmann (1992) and the Seldovia Village Tribe (2013) present statistically significant evidence that within the subsistence communities studied, the average FCR exceeds the current EPA default rate of 22 g/day, even when allowing for a large standard error in the study calculations.
Currently there is no standardized process for states to following when identifying and developing data sources to use in determining FCR for deriving WQC. ADEC may want to consider conducting a review of methodologies used by states to develop FCRs in different regions of the country, and dietary survey methods utilized in various sectors of the scientific community. A comparative analysis of different approaches will be critical in identifying a process that is most compatible with the policy and public health objectives of ADEC.
25
Alaska’s population is diverse and fish consumption practices vary widely. Given, the unique logistical challenges of travel in Alaska, the state may want to explore strategies for capturing fish consumption data that require less fiscal and human resources than a traditional dietary survey effort. One example is a possible harvest-based consumption model that utilizes existing ADF&G data collection capabilities.
Another example of a potential modeling strategy is a statistical method developed by the National Cancer Institute that uses information from two 24-hour dietary recalls to estimate usual intake of episodically-consumed foods. The method accommodates the large number of non-consumption days that arise with foods by separating the probability of consumption from the consumption-day amount, using a two-part model. Covariates, such as sex, age, race, and information from a FFQ, may be used to supplement the information from two or more 24-hour recalls using correlated mixed model regression. The model allows for correlation between the probability of consuming a food on a single day and the consumption-day amount. Percentiles of the distribution of usual intake are computed from the estimated model parameters (Tooze, 2006).The utilization of two 24-hour dietary recalls may serve to reduce the potential for bias that exists with use of FFQs alone; however, conducting the recalls may involve significant resources to implement. The resulting model may also provide insight on consumption patterns in different regions of the state, and could be used to evaluate seasonal fluctuations in fish consumption.
Finally, ADEC could consider collaborating with stakeholders on the development of a standardized dietary questionnaire and survey methodology to ensure that the results of any potential future studies are comparable and capture all of the information needed to support the development of FCRs for Alaska. Doing so will help ensure that resources applied to these efforts result in a reliable and relevant source of data.
26
Resources Alaska Department of Environmental Conservation (ADEC), Division of Water Quality Standards. (2011). 2011-2013 Triennial Review: Fact Sheet – Human Health Criteria for Consumption of Fish and Water. Accessed online at: http://dec.alaska.gov/water/wqsar/trireview/pdfs/fishconsumption_11-29-2011.pdf
Alaska Department of Environmental Conservation. 2005. ADEC Fish Monitoring Project: Average Heavy Metal Concentration. Alaska Fish Tissue Testing Program. Available at http://www.dec.state.ak.us/eh/vet/heavy_metals.htm. Last accessed 23 June 2005.
Alaska Department of Fish and Game (ADF&G). 2014. Subsistence in Alaska: A Year 2012 Update. Division of Subsistence, Alaska Department of Fish and Game. Prepared by James A. Fall, February 2014. Original by Robert J. Wolfe, March 2000.
Alaska Statues, Title 16 Fish and Game, Chapter 16.05 Fish and Game Code and Definitions. Accessed online at: http://www.legis.state.ak.us/basis/statutes.asp#16.05.094
Agency for Toxic Substances and Disease Registry Site and Radiological Assessment Branch, Division of Health Assessment and Consultation. 2009. Evaluation of Seafood and Plant Data Collected from Cook Inlet near the Native Villages of Port Graham, Nanwalke, Seldovia and Tyonek, Alaska.
Ballew, C., Ross, A., Wells, R.S., Hiratsuka, A.B., Hamrick, K.J., Nobmann, E.D. and Bartell, S. 2004. Final Report of the Alaska Traditional Diet Survey. Alaska Native Tribal Health Consortium Report.
Bartell, S.M., Nobmann, E., and Ponce, R.A. 1999. What People Eat: Atka, Alaska, 1998–1999, Final Report, Project PF901329, submitted to University of Alaska and Aleutian/Pribilof Islands Association, Inc., IDM Consulting, Anchorage, Alaska, December, 1999.
Department of Health and Human Services (DHSS), Division of Public Health, Section of Epidemiology, Environmental Public Health Program. 2014 Fish Facts and Consumption Guidelines. Accessed online at: http://www.epi.hss.state.ak.us/eh/fish/
Department of Health and Human Services (DHSS), Division of Public Health, Section of Epidemiology, Environmental Public Health Program. 2013. Health Consultation - Exposure Investigation: Investigation into Potential Exposures to Mercury Vapor in Small-Scale and Recreational Mining- 2012.
Department of Health and Social Services (DHSS). 2007. Fish Consumption Advice for Alaskans: A Risk Management Strategy to Optimize the Public’s Health. Section of Epidemiology, Division of Public Health, Department of Health and Human Services. State of Alaska Epidemiology Bulletin, Vol No. 11(4). October 15, 2007.
EPA. 2014a. Estimated Fish Consumption Rates for the U.S. Population and Selected Subpopulations (NHANES 2003-2010) Final Report. April 2014. EPA-820-R-14-002. Accessed online at: http://water.epa.gov/scitech/swguidance/fishshellfish/fishadvisories/upload/Estimated-Fish-Consumption-Rates-for-the-U-S-Population-and-Selected-Subpopulations-NHANES-2003-2010.pdf
27
EPA. 2014b. DRAFT: Updated National Recommended Water Criteria – Human Health. May 21, 2014. Accessed online at: http://water.epa.gov/scitech/swguidance/standards/criteria/current/hhdraft.cfm
EPA. 2013. Human Health Ambient Water Quality Criteria and Fish Consumption Rates Frequently Asked Questions. Accessed online at: http://water.epa.gov/scitech/swguidance/standards/criteria/health/methodology/upload/hhfaqs.pdf
EPA. 2012.. Persistent Organic Pollutants: A Global Issue, A Global Response. U.S. Environmental Protection Agency – International Programs. July 30, 2012. Web. June, 2014. Accessed online at: http://www.epa.gov/oia/toxics/pop.html#pops
EPA. 2011. Technical Support Document for Action on the State of Oregon’s New and Revised Human Health Water Quality Criteria for Toxics and Associated Implementation Provisions Submitted July 12 and 21, 2011. Washington, DC: U.S. Environmental Protection Agency (17 October 2011). Accessed online at: http://goo.gl/9nP7dV
EPA. 2000a. Methodology for Deriving Ambient Water Quality Criteria for the Protection of Human Health – Revised Methodology (2000) Factsheet. Accessed online at: http://water.epa.gov/scitech/swguidance/standards/criteria/health/methodology/factsheet.cfm
EPA. 2000b. Human Health Risk Assessment of Chemical Contaminates in Seafood from Cook Inlet, Alaska (Draft Report Version 2.) U.S. Environmental Protection Agency, Washington, D.C. September 2000
EPA. 1992. Water Quality Standards; Establishment of Numeric Criteria for Priority Toxic Pollutants; States' Compliances. Federal Register, Volume: 57, Issue: 246, Page: 60848 (57 FR 60848), Tuesday, December 22, 1992.
Fall, J., Brenner, A.R., Evans, S.S., Holen, D., Scarbrough-Hutchinson, L., Jones, B., La Vine, R., Lemons, T., Marchioni, M.A., Mikow, E., Ream, J.T., Sill, L.A. and Trainor, A. 2013. Alaska Subsistence and Personal Use Salmon Fisheries 2011 Annual Report. Alaska Department of Fish and Game, Division of Subsistence -Technical Paper No. 387. October 2013.
Fall, J. 2011. An Updated Overview of its Research, Program and Findings. Poster presentation prepared for 27th Lowell Wakefield Fisheries Symposium Series, Fishing People of the North: Cultures, Economies and Management Responding to Change, September 14-17, 2011. Accessed online at: https://seagrant.uaf.edu/conferences/2011/wakefield-people/presentations/fall-division-subsistence.pdf
Hamrick, K. and Smith, J. 2003. Subsistence food use in Unalaska and Nikolski. Anchorage, AK: Aleutian/Pribilof Island Association; 2003. Hamrick, K., Smith, J., Doucette, S., Nichols, R., Taylor, A., and Smith, S. 2003. Dietary Benefits and Risks in Alaska Native Villages, St. Paul Dietary Survey Results, prepared for Aleutian/Pribilof Islands Association, Institute for Circumpolar Health Studies, University of Alaska Anchorage, March.
28
Johnson, J.S., Nobmann, E.D., Asay, E., and Lanier A.P. 2009. Dietary Intake of Alaska Native People in Two Regions and Implications for Health: The Alaska Native Dietary and Subsistence Food Assessment Project. International Journal of Circumpolar Health 68(2): 109-122.
Kissinger, Lon. 2014. A Conceptual Approach for Relating Fish Populations, Harvest and Consumption. EPA Region 10, Office of Environmental Assessment, Risk Evaluation Unit. Accessed online at: http://www.critfc.org/wp-content/uploads/2014/04/FOOS-tech3-kissinger.pdf
Lees, D., Payne, J., and Driskell, W. 1999. Technical Evaluation of the Environmental Monitoring Program for Cook Inlet Regional Citizens Advisory Council. Cook Inlet Regional Citizens Advisory Council [CIRCAC]. 23 January 1999.
Lemons, T. 2011. Alaska Subsistence Fisheries Database. Poster presentation prepared for 27th Lowell Wakefield Fisheries Symposium Series, Fishing People of the North: Cultures, Economies and Management Responding to Change, September 14-17, 2011. Accessed online at: http://seagrant.uaf.edu/conferences/2011/wakefield-people/presentations/lemons-alaska-subsistence-fisheries-database.pdf
Lennernӓs, M. 1998. Dietary Assessment and Validity: To measure what is meant to measure. Scandinavian Journal of Nutrition 42:63-65.
Loring, P.A., Gerlach, S.C. & Harrison, H.L. 2013. Seafood as local food: Food Security and locally caught seafood on Alaska's Kenai Peninsula. Journal of Agriculture, Food Systems and Community Development 3(3):13-30
McDowell Group Inc. 2013. Economic Value of the Alaska Seafood Industry. Accessed on line at: http://pressroom.alaskaseafood.org/wp-content/uploads/2013/08/AK-Seafood-Impact-Report.pdf
Moya, J. 2004. Overview of fish consumption rates in the United States. Human and Ecological Risk Assessment 10: 1195-1211.
Nobmann, E.D., Byers, T., Lanier, A.P., Hankin, J.H. and Jackson, M.Y. 1992. The diet of Alaska Native adults: 1987-1988. American Journal of Clinical Nutrition 55: 1024-1032.
Oregon Department of Environmental Quality (DEQ). 2011. Human Health Water Quality Standards for Toxic Pollutants and Implementation Policies Rulemaking (2008-2011). Accessed online at: http://www.deq.state.or.us/wq/standards/humanhealthrule.htm
Pennsylvania State University (Penn State). 2014. STAT 509 – Design and Analysis of Clinical Trials: Lesson 4 Bias and Random Error. Department of Statistics. Accessed online at: https://onlinecourses.science.psu.edu/stat509/node/26
Seldovia Village Tribe. 2013. Assessment of Cook Inlet Tribes Subsistence Consumption.
State of Washington, Department of Ecology (Ecology). 2013. Fish Consumption Rates – Technical Support Document: A Review of Data and Information about Fish Consumption in Washington. Version 2.0 Final. Publication No. 12-09-058.
29
Southwick Associates Inc. and W.J. Romberg, A.E. Bingham, G.b. Jennings, and R.A. Clark. 2008. Economic Impacts and contributions of sportfishing in Alaska, 2007. Alaska Department of Fish and Game, Professional Paper No. 08-01, Anchorage
Tooze, J.A., Midthune, D., Dodd, K.W., Freedman, L.S., Krebs-Smith, S.M., Subar, A.F., Guenther, P.M., Carroll, R.J. and Kipnis, V. 2006. A new method for estimating the usual intake of episodically-consumed foods with application to their distribution. Journal of the American Dietetic Association. 106(10):1575-1587.
U.S. Department of Energy. 2013. Amchitka Island, Alaska, Biological Monitoring Report 2011 Sampling Results.
Willett, W. 1998. Nutritional epidemiology. 2nd ed. New York: Oxford University Press; 1998. 514 pp.
Wolfe, R.J. & Utermohle, C.J. 2000. Wild Food Consumption Rate Estimates for Rural Alaska Populations. Alaska Department of Fish and Game, Division of Subsistence - Technical Paper No. 261. Prepared for the Alaska Department of Conservation, Contaminated Sites Program. ADN No. 1800086. June 2000.
30
APPENDIX E: Preliminary Regional Analysis of Fish Consumption Rate Estimates for Rural Alaska Populations (Draft Final November 2018)
Prepared by Alaska Department of Fish & Game Division of Subsistence for the Department of Environmental Conservation’s Human Health Criteria Technical Workgroup discussion, September 2018. Contact: Jim Fall ([email protected]), Marylynne Kostick ([email protected]);
Overview of Methodology
Survey
The Alaska Department of Fish and Game Division of Subsistence (ADF&G) collects information on community harvest and use patterns of wild resources through a series of standardized questions that are administered at the household level by ADF&G staff and trained local research assistants. Survey questions relevant to this report pertain to amounts of resources harvested by the household and, regardless of any household harvest, if a household used, received, or gave away a given resource. Survey designs take the form of either comprehensive surveys (including all resource categories: salmon, non-salmon fish, marine invertebrates, land mammals, marine mammals, and vegetation) or targeted surveys (i.e. salmon only). Harvests reported to and recorded by ADF&G during household surveys are not limited to subsistence harvests as defined by state regulations and recorded through permit returns; all reported harvests of resources taken by methods defined under sport, personal use, and subsistence regulations, as well as resources procured through commercial home-packs, are recorded and used to develop the harvest and use profiles for each study community. Depending on community size, a 70-100% sample achievement is often sought and attained. Each community is unique and specific sampling methodology can be found within Division Technical Papers that report study findings (http://www.adfg.alaska.gov/sf/publications/).
Study Communities
Communities surveyed by ADF&G representing 2008-2015 harvest (study) years were considered for inclusion in this preliminary analysis. Communities deemed rural by State definition (refer to Fall, 2016) were included in this analysis, thus eliminating the following communities that were also surveyed by ADF&G during the time period under consideration: Healy (2014), Denali Park Village (2015), Talkeetna (2012), Trapper Creek (2012), Ferry (2015), and Mentasta Pass (2010). The resource categories salmon, non-marine fish (non-salmon), halibut, herring, marine invertebrates, and marine mammals were selected for the analyses in this report in response to the needs of the Alaska Department of Environmental Conservation’s (ADEC) request for fish consumption rate estimates to be considered for updates to the human health criteria portion of the water quality criteria. As a result, any resource harvested for dog food was removed prior to analysis as were spotted seals, which are primarily used for dogfood and crafts (e.g. the skins for sewing). The study community Allakaket (2011) was not included in this analysis despite it being classified as rural due
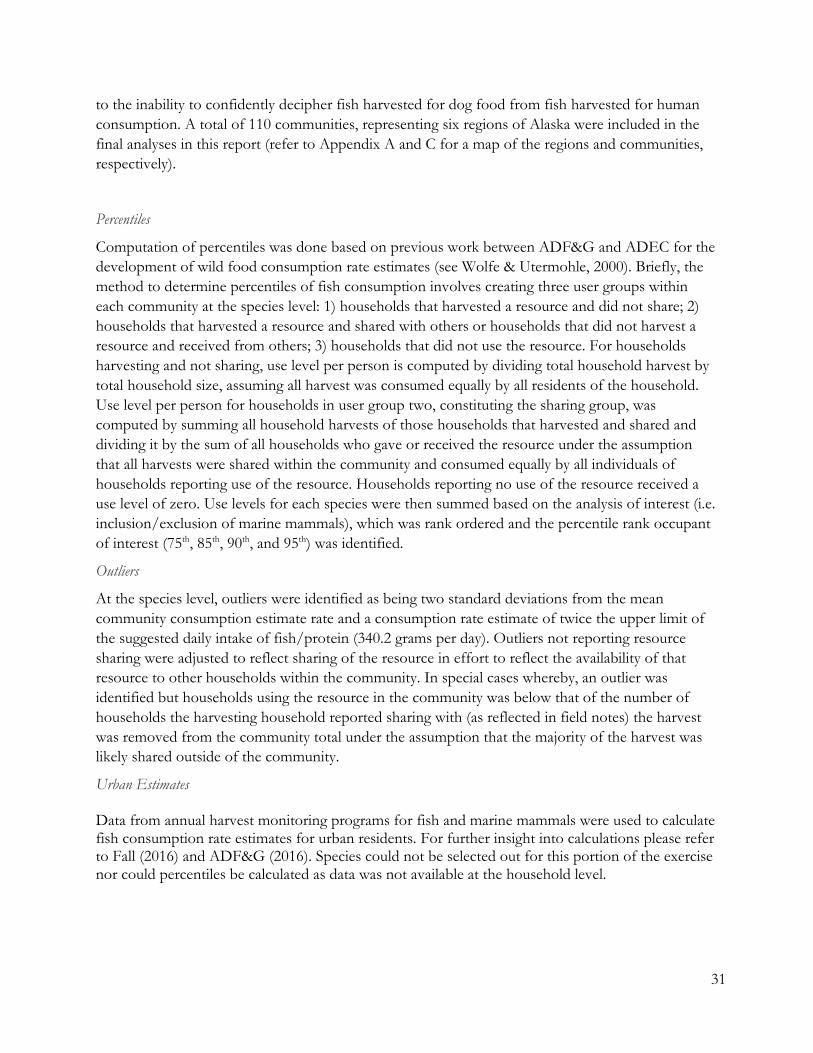
31
to the inability to confidently decipher fish harvested for dog food from fish harvested for human consumption. A total of 110 communities, representing six regions of Alaska were included in the final analyses in this report (refer to Appendix A and C for a map of the regions and communities, respectively).
Percentiles
Computation of percentiles was done based on previous work between ADF&G and ADEC for the development of wild food consumption rate estimates (see Wolfe & Utermohle, 2000). Briefly, the method to determine percentiles of fish consumption involves creating three user groups within each community at the species level: 1) households that harvested a resource and did not share; 2) households that harvested a resource and shared with others or households that did not harvest a resource and received from others; 3) households that did not use the resource. For households harvesting and not sharing, use level per person is computed by dividing total household harvest by total household size, assuming all harvest was consumed equally by all residents of the household. Use level per person for households in user group two, constituting the sharing group, was computed by summing all household harvests of those households that harvested and shared and dividing it by the sum of all households who gave or received the resource under the assumption that all harvests were shared within the community and consumed equally by all individuals of households reporting use of the resource. Households reporting no use of the resource received a use level of zero. Use levels for each species were then summed based on the analysis of interest (i.e. inclusion/exclusion of marine mammals), which was rank ordered and the percentile rank occupant of interest (75th, 85th, 90th, and 95th) was identified.
Outliers
At the species level, outliers were identified as being two standard deviations from the mean community consumption estimate rate and a consumption rate estimate of twice the upper limit of the suggested daily intake of fish/protein (340.2 grams per day). Outliers not reporting resource sharing were adjusted to reflect sharing of the resource in effort to reflect the availability of that resource to other households within the community. In special cases whereby, an outlier was identified but households using the resource in the community was below that of the number of households the harvesting household reported sharing with (as reflected in field notes) the harvest was removed from the community total under the assumption that the majority of the harvest was likely shared outside of the community.
Urban Estimates Data from annual harvest monitoring programs for fish and marine mammals were used to calculate fish consumption rate estimates for urban residents. For further insight into calculations please refer to Fall (2016) and ADF&G (2016). Species could not be selected out for this portion of the exercise nor could percentiles be calculated as data was not available at the household level.
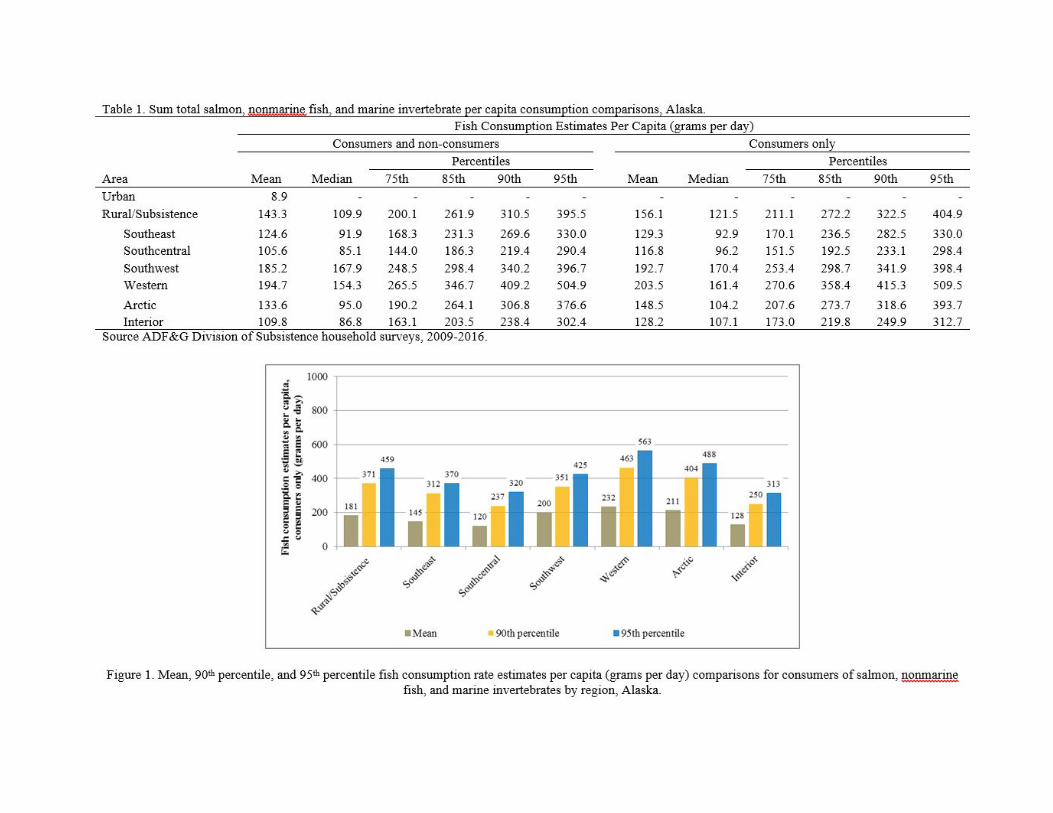
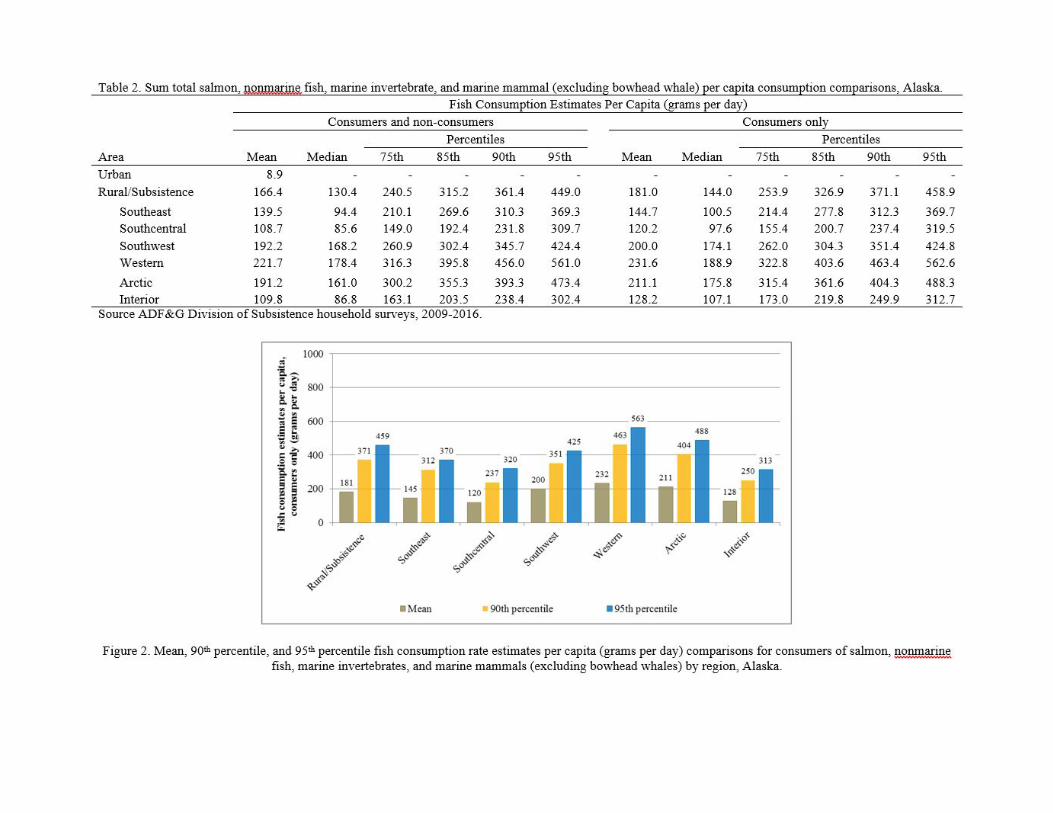
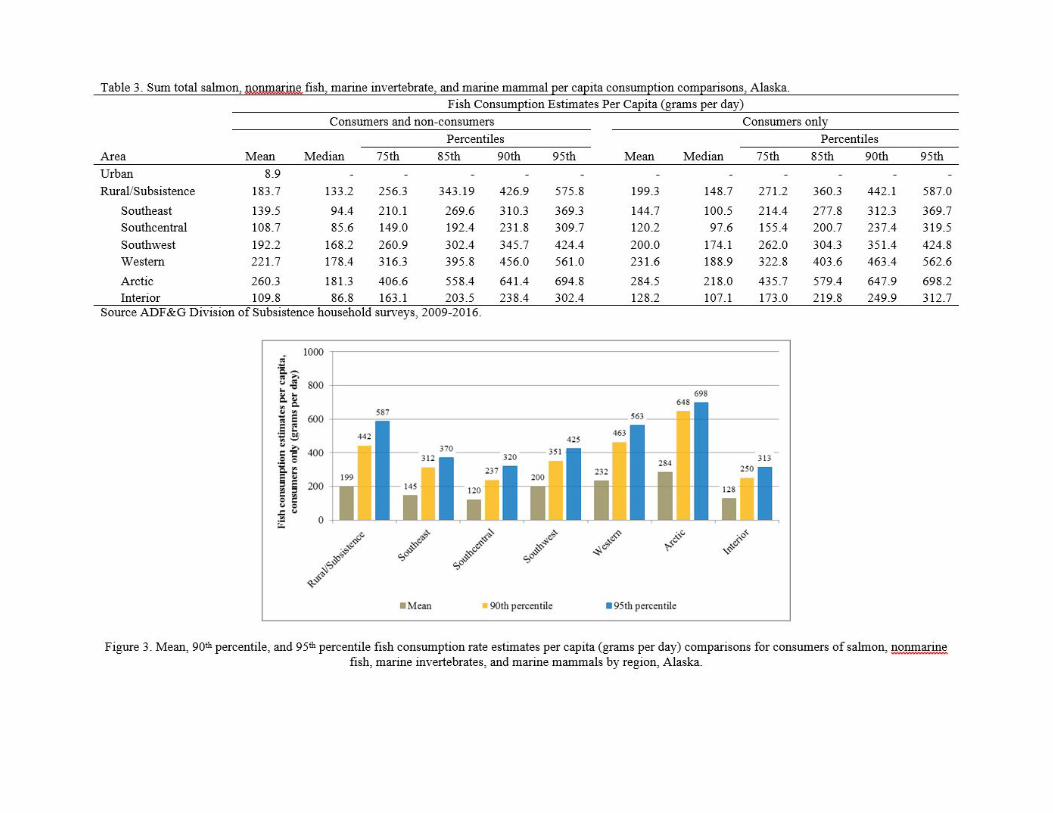
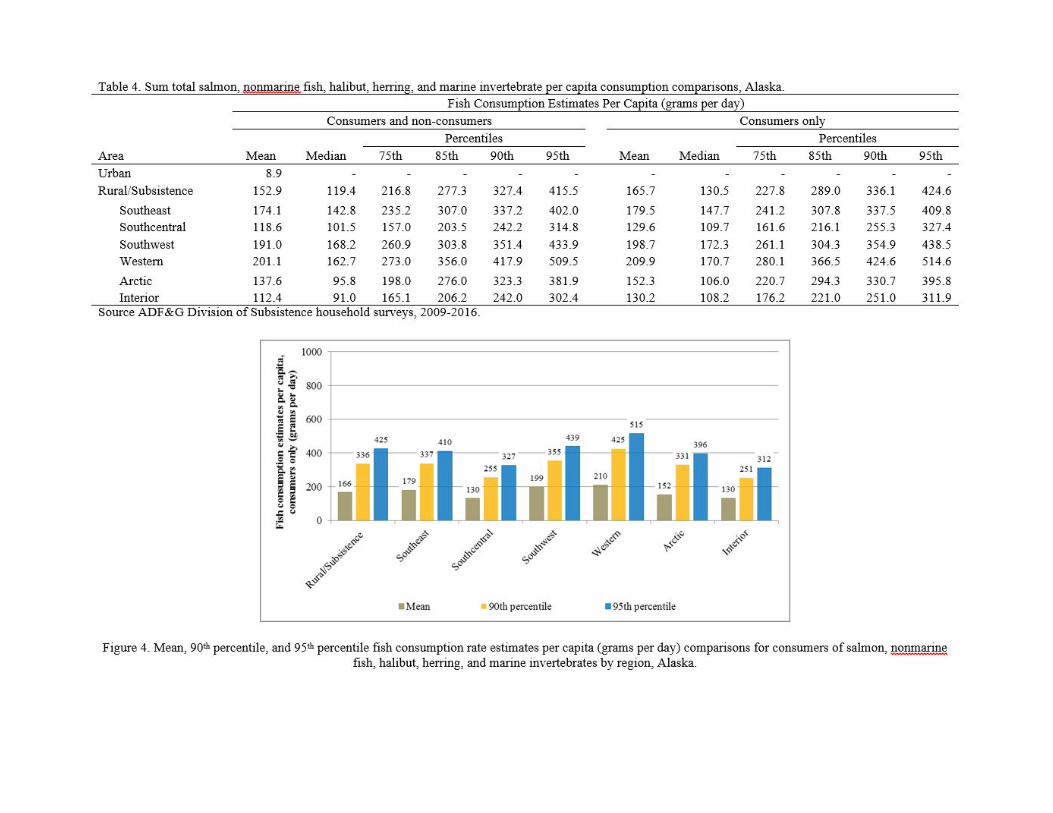
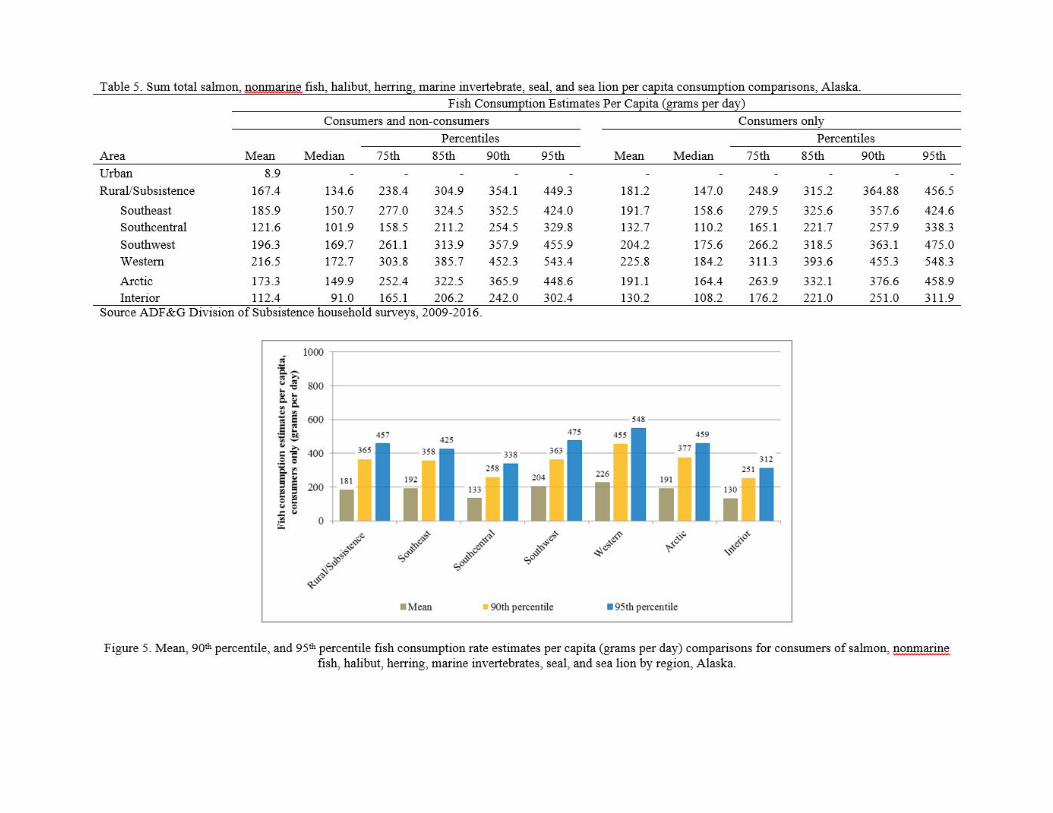
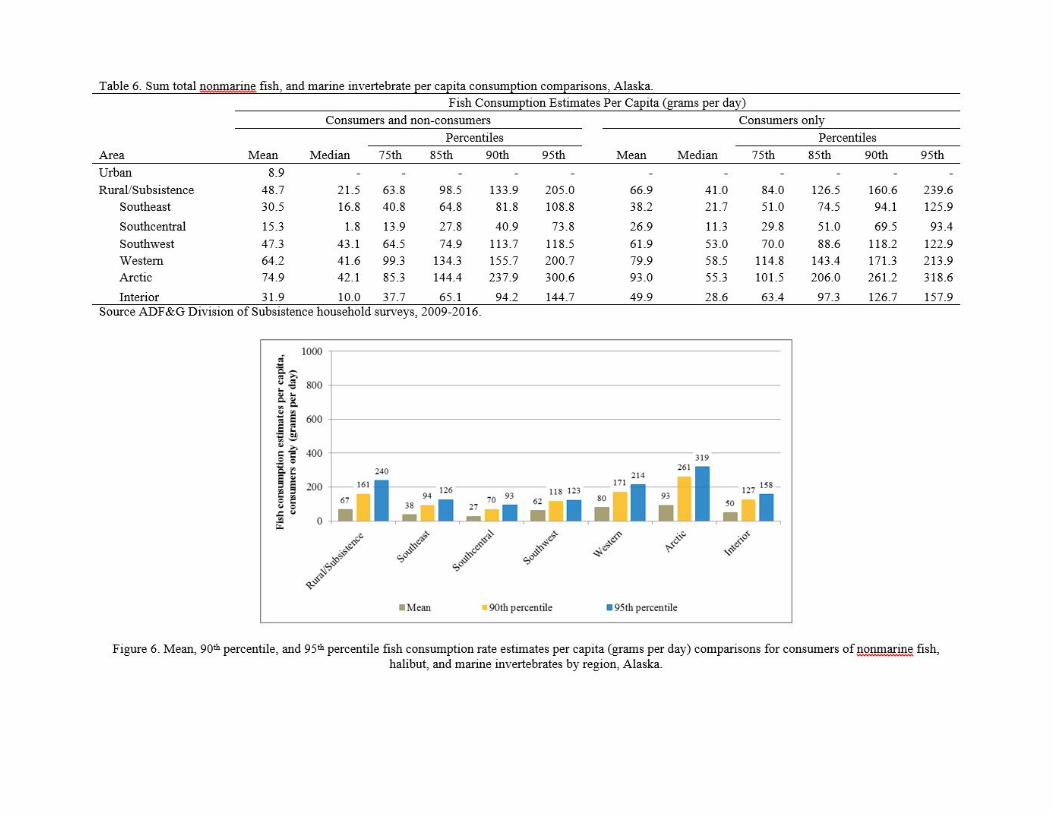
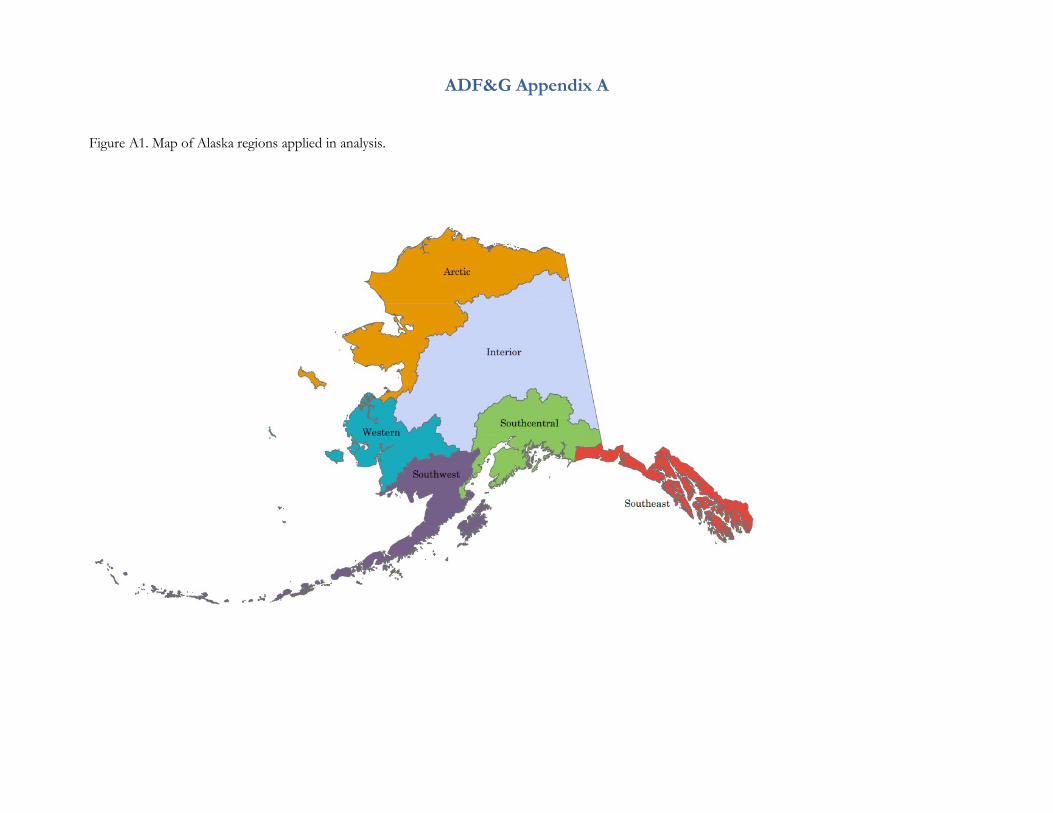
ADF&G Appendix A Figure A1. Map of Alaska regions applied in analysis.
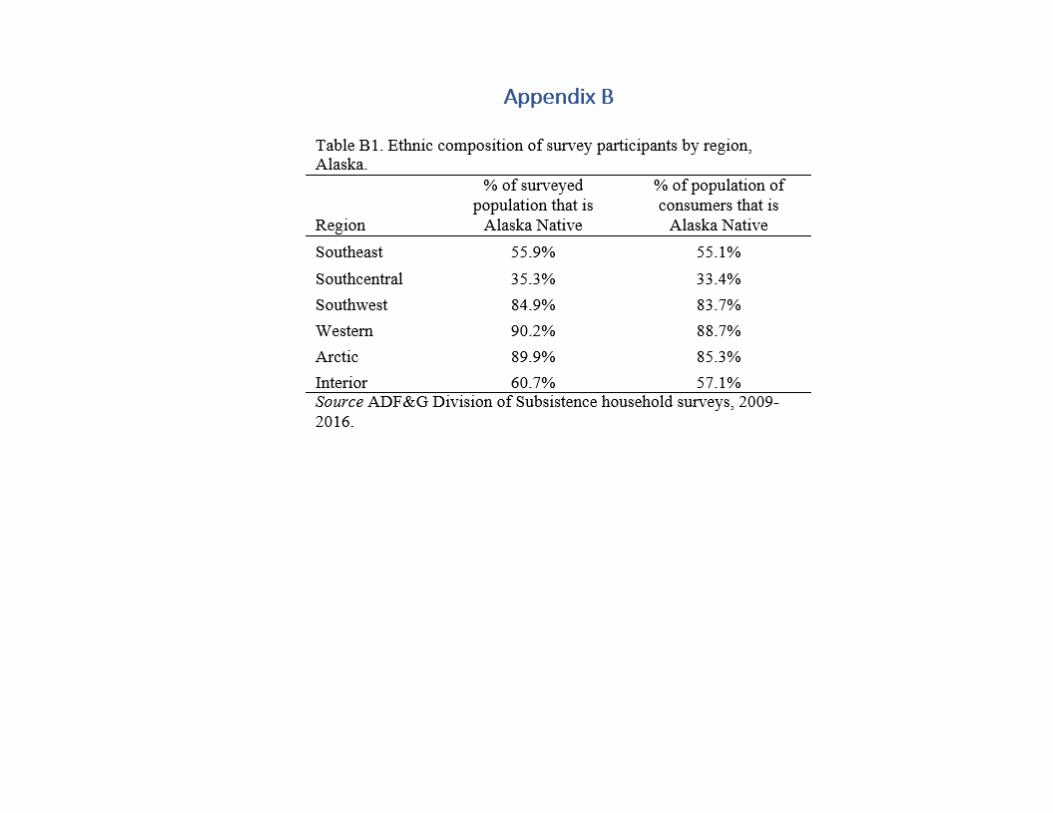
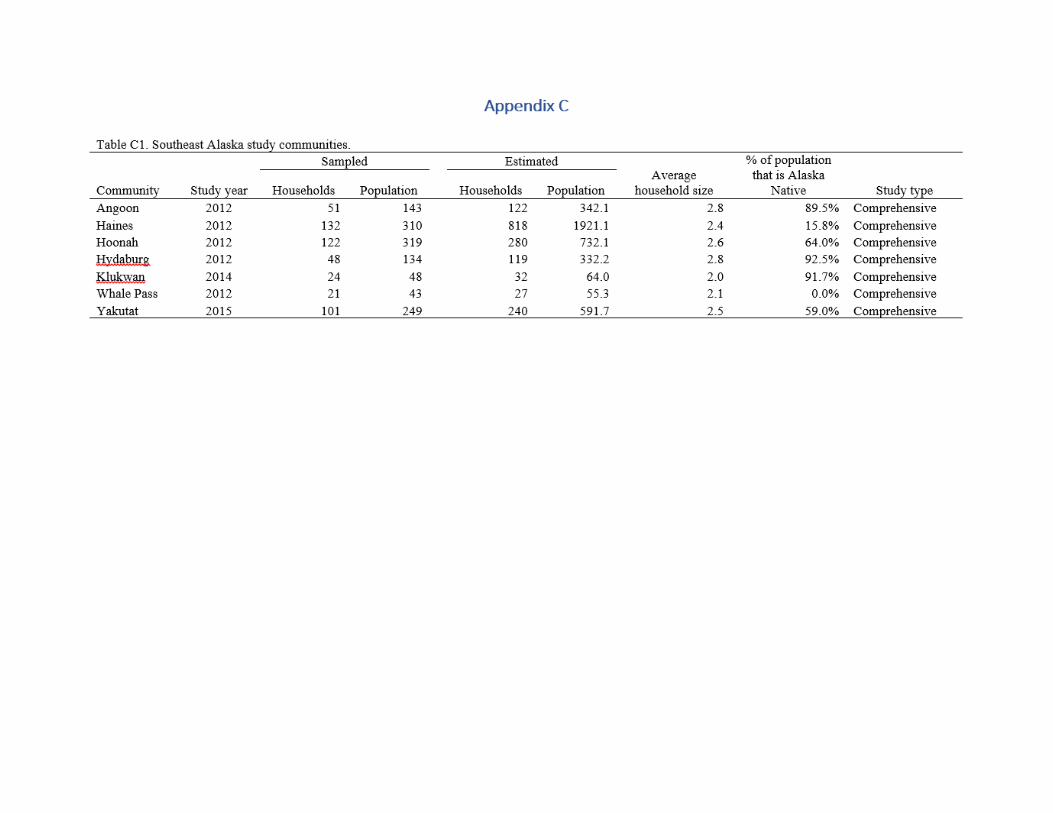
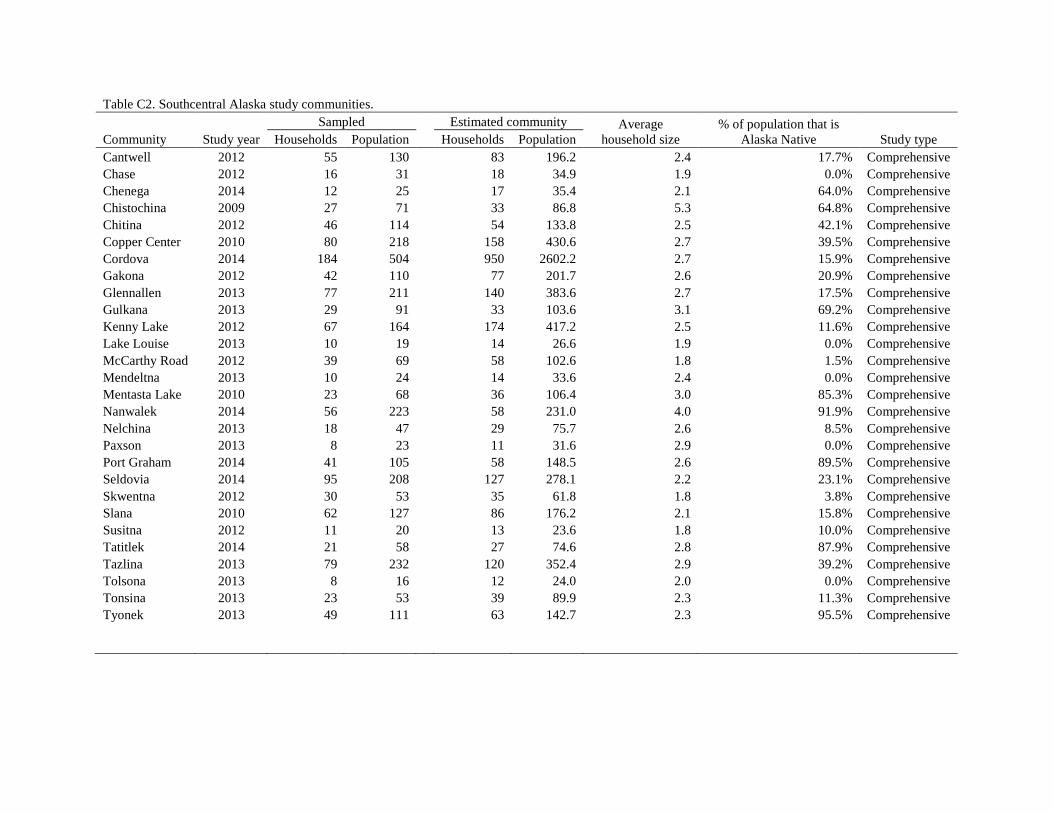
Table C2. Southcentral Alaska study communities.
Community Study year Sampled Estimated community Average
household size % of population that is
Alaska Native Study type Households Population Households Population Cantwell 2012 55 130 83 196.2 2.4 17.7% Comprehensive Chase 2012 16 31 18 34.9 1.9 0.0% Comprehensive Chenega 2014 12 25 17 35.4 2.1 64.0% Comprehensive Chistochina 2009 27 71 33 86.8 5.3 64.8% Comprehensive Chitina 2012 46 114 54 133.8 2.5 42.1% Comprehensive Copper Center 2010 80 218 158 430.6 2.7 39.5% Comprehensive Cordova 2014 184 504 950 2602.2 2.7 15.9% Comprehensive Gakona 2012 42 110 77 201.7 2.6 20.9% Comprehensive Glennallen 2013 77 211 140 383.6 2.7 17.5% Comprehensive Gulkana 2013 29 91 33 103.6 3.1 69.2% Comprehensive Kenny Lake 2012 67 164 174 417.2 2.5 11.6% Comprehensive Lake Louise 2013 10 19 14 26.6 1.9 0.0% Comprehensive McCarthy Road 2012 39 69 58 102.6 1.8 1.5% Comprehensive Mendeltna 2013 10 24 14 33.6 2.4 0.0% Comprehensive Mentasta Lake 2010 23 68 36 106.4 3.0 85.3% Comprehensive Nanwalek 2014 56 223 58 231.0 4.0 91.9% Comprehensive Nelchina 2013 18 47 29 75.7 2.6 8.5% Comprehensive Paxson 2013 8 23 11 31.6 2.9 0.0% Comprehensive Port Graham 2014 41 105 58 148.5 2.6 89.5% Comprehensive Seldovia 2014 95 208 127 278.1 2.2 23.1% Comprehensive Skwentna 2012 30 53 35 61.8 1.8 3.8% Comprehensive Slana 2010 62 127 86 176.2 2.1 15.8% Comprehensive Susitna 2012 11 20 13 23.6 1.8 10.0% Comprehensive Tatitlek 2014 21 58 27 74.6 2.8 87.9% Comprehensive Tazlina 2013 79 232 120 352.4 2.9 39.2% Comprehensive Tolsona 2013 8 16 12 24.0 2.0 0.0% Comprehensive Tonsina 2013 23 53 39 89.9 2.3 11.3% Comprehensive Tyonek 2013 49 111 63 142.7 2.3 95.5% Comprehensive
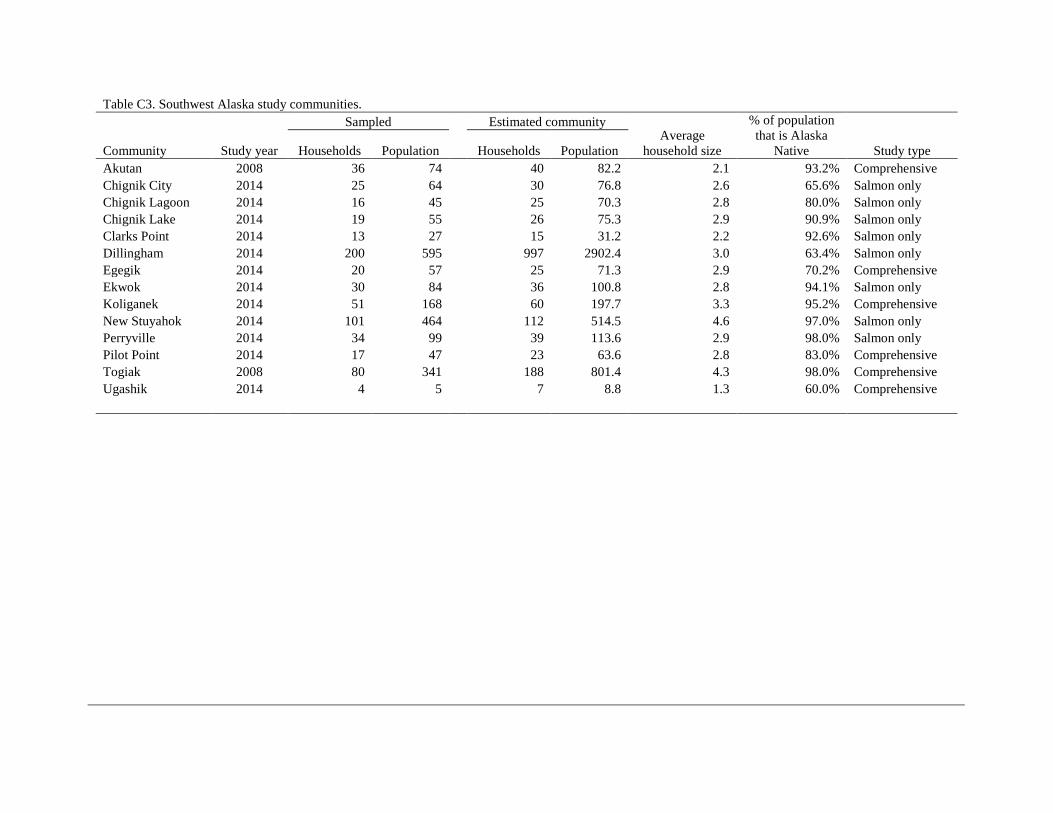
Table C3. Southwest Alaska study communities.
Community Study year
Sampled Estimated community Average
household size
% of population that is Alaska
Native Study type Households Population Households Population Akutan 2008 36 74 40 82.2 2.1 93.2% Comprehensive Chignik City 2014 25 64 30 76.8 2.6 65.6% Salmon only Chignik Lagoon 2014 16 45 25 70.3 2.8 80.0% Salmon only Chignik Lake 2014 19 55 26 75.3 2.9 90.9% Salmon only Clarks Point 2014 13 27 15 31.2 2.2 92.6% Salmon only Dillingham 2014 200 595 997 2902.4 3.0 63.4% Salmon only Egegik 2014 20 57 25 71.3 2.9 70.2% Comprehensive Ekwok 2014 30 84 36 100.8 2.8 94.1% Salmon only Koliganek 2014 51 168 60 197.7 3.3 95.2% Comprehensive New Stuyahok 2014 101 464 112 514.5 4.6 97.0% Salmon only Perryville 2014 34 99 39 113.6 2.9 98.0% Salmon only Pilot Point 2014 17 47 23 63.6 2.8 83.0% Comprehensive Togiak 2008 80 341 188 801.4 4.3 98.0% Comprehensive Ugashik 2014 4 5 7 8.8 1.3 60.0% Comprehensive
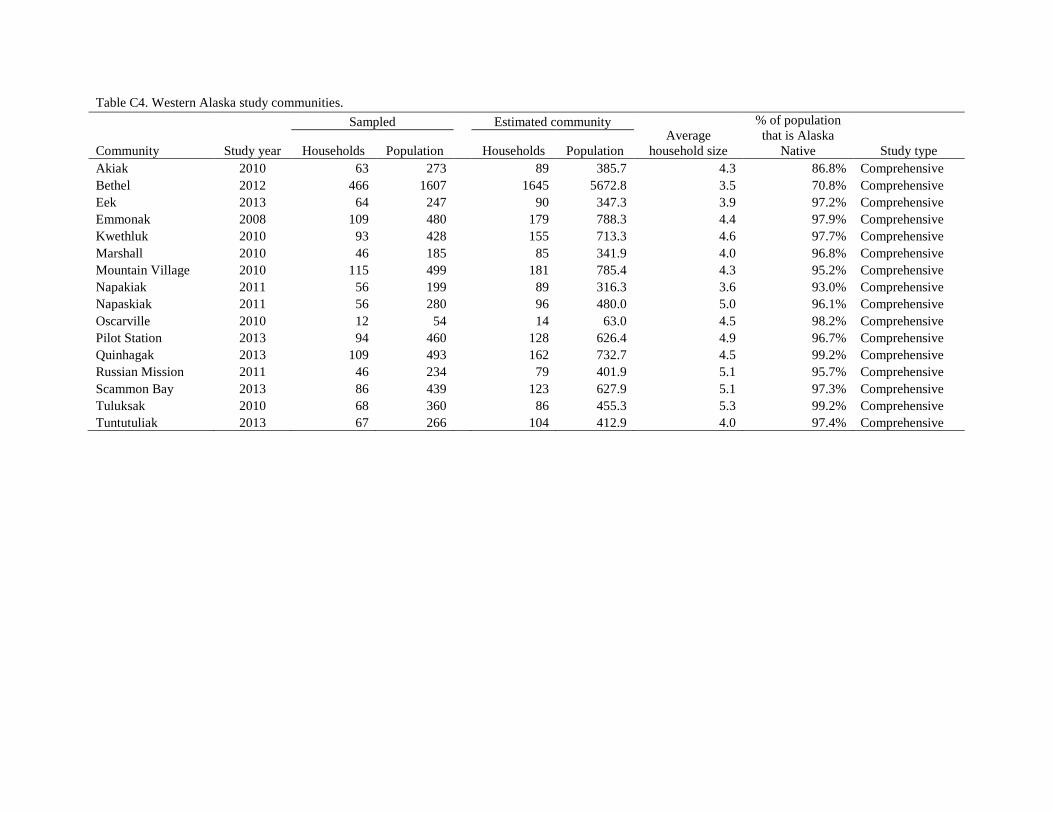
Table C4. Western Alaska study communities.
Community Study year
Sampled Estimated community Average
household size
% of population that is Alaska
Native Study type Households Population Households Population Akiak 2010 63 273 89 385.7 4.3 86.8% Comprehensive Bethel 2012 466 1607 1645 5672.8 3.5 70.8% Comprehensive Eek 2013 64 247 90 347.3 3.9 97.2% Comprehensive Emmonak 2008 109 480 179 788.3 4.4 97.9% Comprehensive Kwethluk 2010 93 428 155 713.3 4.6 97.7% Comprehensive Marshall 2010 46 185 85 341.9 4.0 96.8% Comprehensive Mountain Village 2010 115 499 181 785.4 4.3 95.2% Comprehensive Napakiak 2011 56 199 89 316.3 3.6 93.0% Comprehensive Napaskiak 2011 56 280 96 480.0 5.0 96.1% Comprehensive Oscarville 2010 12 54 14 63.0 4.5 98.2% Comprehensive Pilot Station 2013 94 460 128 626.4 4.9 96.7% Comprehensive Quinhagak 2013 109 493 162 732.7 4.5 99.2% Comprehensive Russian Mission 2011 46 234 79 401.9 5.1 95.7% Comprehensive Scammon Bay 2013 86 439 123 627.9 5.1 97.3% Comprehensive Tuluksak 2010 68 360 86 455.3 5.3 99.2% Comprehensive Tuntutuliak 2013 67 266 104 412.9 4.0 97.4% Comprehensive
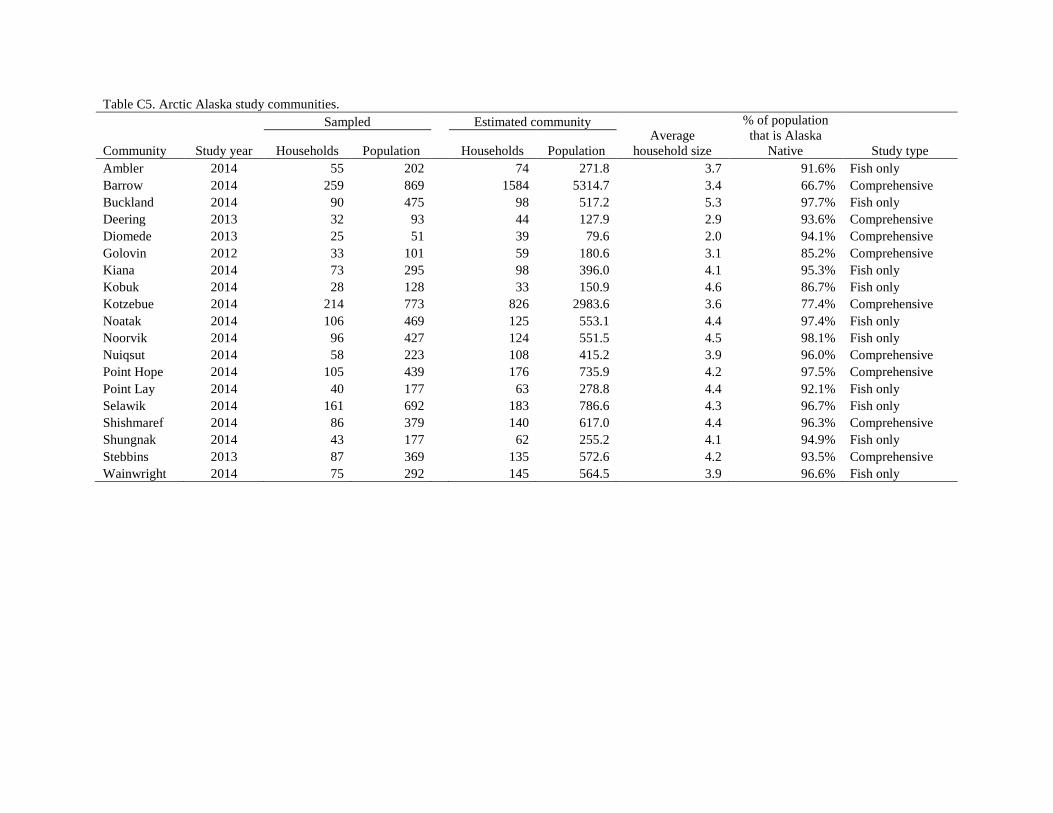
Table C5. Arctic Alaska study communities.
Community Study year
Sampled Estimated community Average
household size
% of population that is Alaska
Native Study type Households Population Households Population Ambler 2014 55 202 74 271.8 3.7 91.6% Fish only Barrow 2014 259 869 1584 5314.7 3.4 66.7% Comprehensive Buckland 2014 90 475 98 517.2 5.3 97.7% Fish only Deering 2013 32 93 44 127.9 2.9 93.6% Comprehensive Diomede 2013 25 51 39 79.6 2.0 94.1% Comprehensive Golovin 2012 33 101 59 180.6 3.1 85.2% Comprehensive Kiana 2014 73 295 98 396.0 4.1 95.3% Fish only Kobuk 2014 28 128 33 150.9 4.6 86.7% Fish only Kotzebue 2014 214 773 826 2983.6 3.6 77.4% Comprehensive Noatak 2014 106 469 125 553.1 4.4 97.4% Fish only Noorvik 2014 96 427 124 551.5 4.5 98.1% Fish only Nuiqsut 2014 58 223 108 415.2 3.9 96.0% Comprehensive Point Hope 2014 105 439 176 735.9 4.2 97.5% Comprehensive Point Lay 2014 40 177 63 278.8 4.4 92.1% Fish only Selawik 2014 161 692 183 786.6 4.3 96.7% Fish only Shishmaref 2014 86 379 140 617.0 4.4 96.3% Comprehensive Shungnak 2014 43 177 62 255.2 4.1 94.9% Fish only Stebbins 2013 87 369 135 572.6 4.2 93.5% Comprehensive Wainwright 2014 75 292 145 564.5 3.9 96.6% Fish only
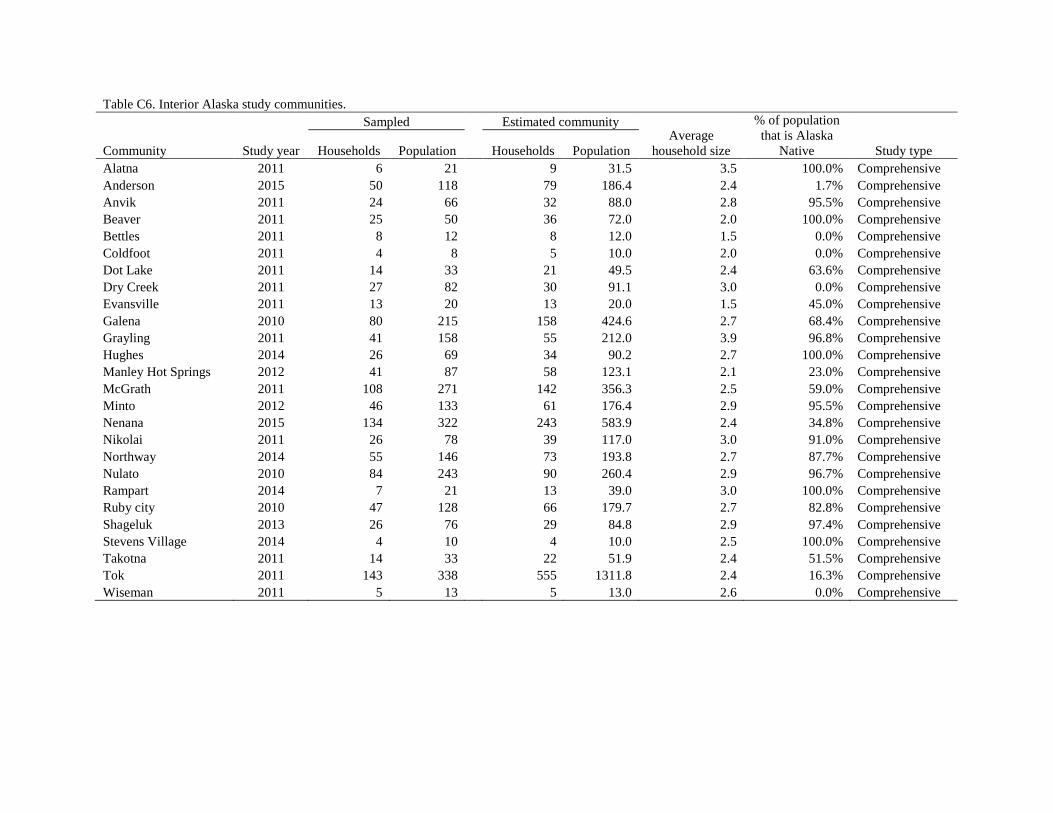
Table C6. Interior Alaska study communities.
Community Study year
Sampled Estimated community Average
household size
% of population that is Alaska
Native Study type Households Population Households Population Alatna 2011 6 21 9 31.5 3.5 100.0% Comprehensive Anderson 2015 50 118 79 186.4 2.4 1.7% Comprehensive Anvik 2011 24 66 32 88.0 2.8 95.5% Comprehensive Beaver 2011 25 50 36 72.0 2.0 100.0% Comprehensive Bettles 2011 8 12 8 12.0 1.5 0.0% Comprehensive Coldfoot 2011 4 8 5 10.0 2.0 0.0% Comprehensive Dot Lake 2011 14 33 21 49.5 2.4 63.6% Comprehensive Dry Creek 2011 27 82 30 91.1 3.0 0.0% Comprehensive Evansville 2011 13 20 13 20.0 1.5 45.0% Comprehensive Galena 2010 80 215 158 424.6 2.7 68.4% Comprehensive Grayling 2011 41 158 55 212.0 3.9 96.8% Comprehensive Hughes 2014 26 69 34 90.2 2.7 100.0% Comprehensive Manley Hot Springs 2012 41 87 58 123.1 2.1 23.0% Comprehensive McGrath 2011 108 271 142 356.3 2.5 59.0% Comprehensive Minto 2012 46 133 61 176.4 2.9 95.5% Comprehensive Nenana 2015 134 322 243 583.9 2.4 34.8% Comprehensive Nikolai 2011 26 78 39 117.0 3.0 91.0% Comprehensive Northway 2014 55 146 73 193.8 2.7 87.7% Comprehensive Nulato 2010 84 243 90 260.4 2.9 96.7% Comprehensive Rampart 2014 7 21 13 39.0 3.0 100.0% Comprehensive Ruby city 2010 47 128 66 179.7 2.7 82.8% Comprehensive Shageluk 2013 26 76 29 84.8 2.9 97.4% Comprehensive Stevens Village 2014 4 10 4 10.0 2.5 100.0% Comprehensive Takotna 2011 14 33 22 51.9 2.4 51.5% Comprehensive Tok 2011 143 338 555 1311.8 2.4 16.3% Comprehensive Wiseman 2011 5 13 5 13.0 2.6 0.0% Comprehensive
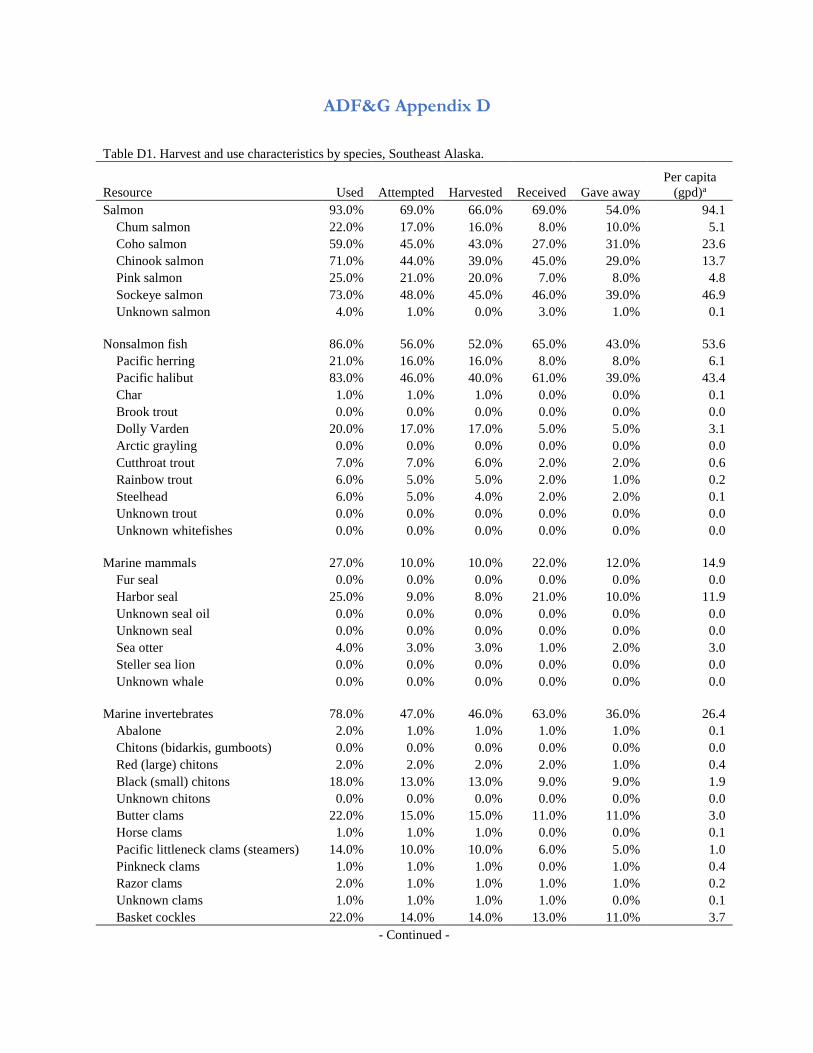
ADF&G Appendix D
Table D1. Harvest and use characteristics by species, Southeast Alaska.
Resource Used Attempted Harvested Received Gave away Per capita
(gpd)a Salmon 93.0% 69.0% 66.0% 69.0% 54.0% 94.1
Chum salmon 22.0% 17.0% 16.0% 8.0% 10.0% 5.1 Coho salmon 59.0% 45.0% 43.0% 27.0% 31.0% 23.6 Chinook salmon 71.0% 44.0% 39.0% 45.0% 29.0% 13.7 Pink salmon 25.0% 21.0% 20.0% 7.0% 8.0% 4.8 Sockeye salmon 73.0% 48.0% 45.0% 46.0% 39.0% 46.9 Unknown salmon 4.0% 1.0% 0.0% 3.0% 1.0% 0.1
Nonsalmon fish 86.0% 56.0% 52.0% 65.0% 43.0% 53.6
Pacific herring 21.0% 16.0% 16.0% 8.0% 8.0% 6.1 Pacific halibut 83.0% 46.0% 40.0% 61.0% 39.0% 43.4 Char 1.0% 1.0% 1.0% 0.0% 0.0% 0.1 Brook trout 0.0% 0.0% 0.0% 0.0% 0.0% 0.0 Dolly Varden 20.0% 17.0% 17.0% 5.0% 5.0% 3.1 Arctic grayling 0.0% 0.0% 0.0% 0.0% 0.0% 0.0 Cutthroat trout 7.0% 7.0% 6.0% 2.0% 2.0% 0.6 Rainbow trout 6.0% 5.0% 5.0% 2.0% 1.0% 0.2 Steelhead 6.0% 5.0% 4.0% 2.0% 2.0% 0.1 Unknown trout 0.0% 0.0% 0.0% 0.0% 0.0% 0.0 Unknown whitefishes 0.0% 0.0% 0.0% 0.0% 0.0% 0.0
Marine mammals 27.0% 10.0% 10.0% 22.0% 12.0% 14.9
Fur seal 0.0% 0.0% 0.0% 0.0% 0.0% 0.0 Harbor seal 25.0% 9.0% 8.0% 21.0% 10.0% 11.9 Unknown seal oil 0.0% 0.0% 0.0% 0.0% 0.0% 0.0 Unknown seal 0.0% 0.0% 0.0% 0.0% 0.0% 0.0 Sea otter 4.0% 3.0% 3.0% 1.0% 2.0% 3.0 Steller sea lion 0.0% 0.0% 0.0% 0.0% 0.0% 0.0 Unknown whale 0.0% 0.0% 0.0% 0.0% 0.0% 0.0
Marine invertebrates 78.0% 47.0% 46.0% 63.0% 36.0% 26.4
Abalone 2.0% 1.0% 1.0% 1.0% 1.0% 0.1 Chitons (bidarkis, gumboots) 0.0% 0.0% 0.0% 0.0% 0.0% 0.0 Red (large) chitons 2.0% 2.0% 2.0% 2.0% 1.0% 0.4 Black (small) chitons 18.0% 13.0% 13.0% 9.0% 9.0% 1.9 Unknown chitons 0.0% 0.0% 0.0% 0.0% 0.0% 0.0 Butter clams 22.0% 15.0% 15.0% 11.0% 11.0% 3.0 Horse clams 1.0% 1.0% 1.0% 0.0% 0.0% 0.1 Pacific littleneck clams (steamers) 14.0% 10.0% 10.0% 6.0% 5.0% 1.0 Pinkneck clams 1.0% 1.0% 1.0% 0.0% 1.0% 0.4 Razor clams 2.0% 1.0% 1.0% 1.0% 1.0% 0.2 Unknown clams 1.0% 1.0% 1.0% 1.0% 0.0% 0.1 Basket cockles 22.0% 14.0% 14.0% 13.0% 11.0% 3.7
- Continued -
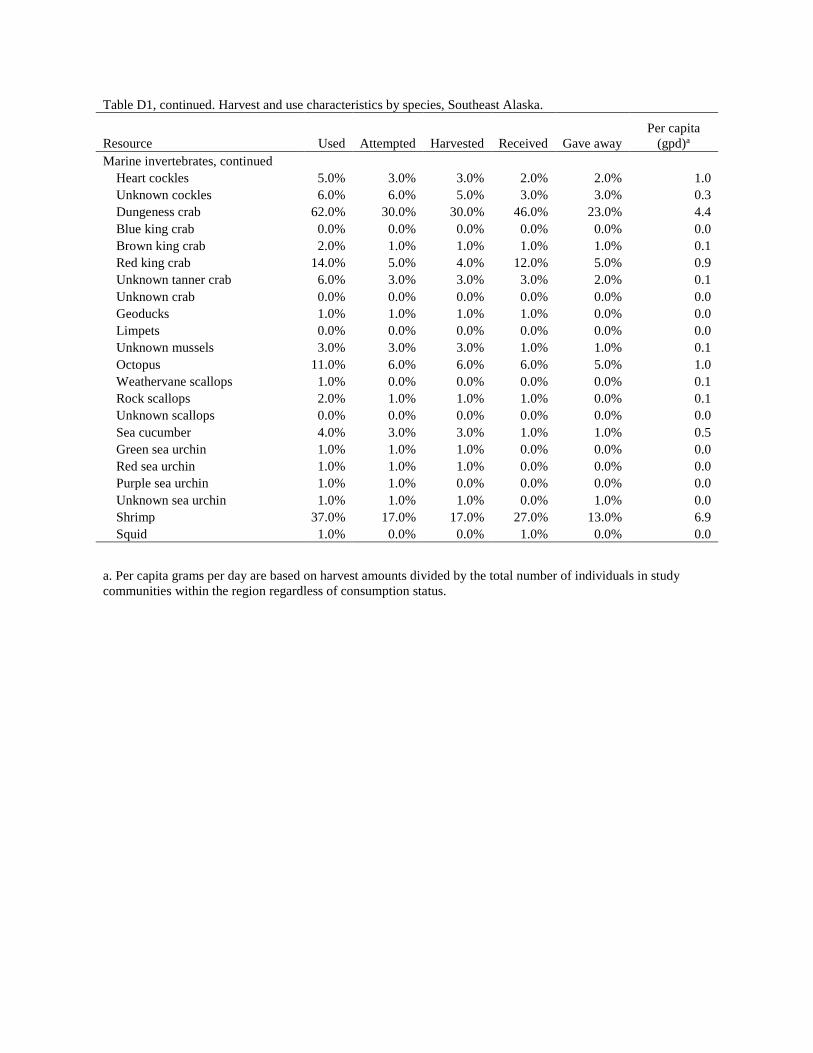
Table D1, continued. Harvest and use characteristics by species, Southeast Alaska.
Resource Used Attempted Harvested Received Gave away Per capita
(gpd)a Marine invertebrates, continued
Heart cockles 5.0% 3.0% 3.0% 2.0% 2.0% 1.0 Unknown cockles 6.0% 6.0% 5.0% 3.0% 3.0% 0.3 Dungeness crab 62.0% 30.0% 30.0% 46.0% 23.0% 4.4 Blue king crab 0.0% 0.0% 0.0% 0.0% 0.0% 0.0 Brown king crab 2.0% 1.0% 1.0% 1.0% 1.0% 0.1 Red king crab 14.0% 5.0% 4.0% 12.0% 5.0% 0.9 Unknown tanner crab 6.0% 3.0% 3.0% 3.0% 2.0% 0.1 Unknown crab 0.0% 0.0% 0.0% 0.0% 0.0% 0.0 Geoducks 1.0% 1.0% 1.0% 1.0% 0.0% 0.0 Limpets 0.0% 0.0% 0.0% 0.0% 0.0% 0.0 Unknown mussels 3.0% 3.0% 3.0% 1.0% 1.0% 0.1 Octopus 11.0% 6.0% 6.0% 6.0% 5.0% 1.0 Weathervane scallops 1.0% 0.0% 0.0% 0.0% 0.0% 0.1 Rock scallops 2.0% 1.0% 1.0% 1.0% 0.0% 0.1 Unknown scallops 0.0% 0.0% 0.0% 0.0% 0.0% 0.0 Sea cucumber 4.0% 3.0% 3.0% 1.0% 1.0% 0.5 Green sea urchin 1.0% 1.0% 1.0% 0.0% 0.0% 0.0 Red sea urchin 1.0% 1.0% 1.0% 0.0% 0.0% 0.0 Purple sea urchin 1.0% 1.0% 0.0% 0.0% 0.0% 0.0 Unknown sea urchin 1.0% 1.0% 1.0% 0.0% 1.0% 0.0 Shrimp 37.0% 17.0% 17.0% 27.0% 13.0% 6.9 Squid 1.0% 0.0% 0.0% 1.0% 0.0% 0.0
a. Per capita grams per day are based on harvest amounts divided by the total number of individuals in study communities within the region regardless of consumption status.
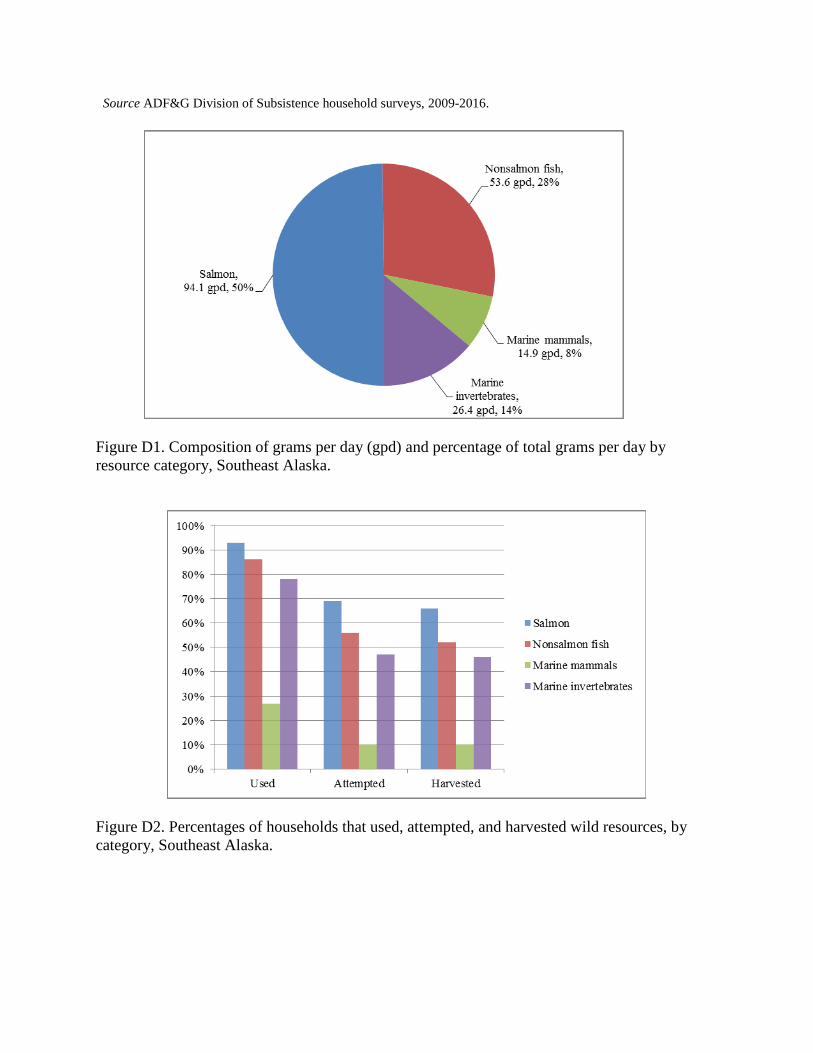
Source ADF&G Division of Subsistence household surveys, 2009-2016.
Figure D1. Composition of grams per day (gpd) and percentage of total grams per day by resource category, Southeast Alaska.
Figure D2. Percentages of households that used, attempted, and harvested wild resources, by category, Southeast Alaska.
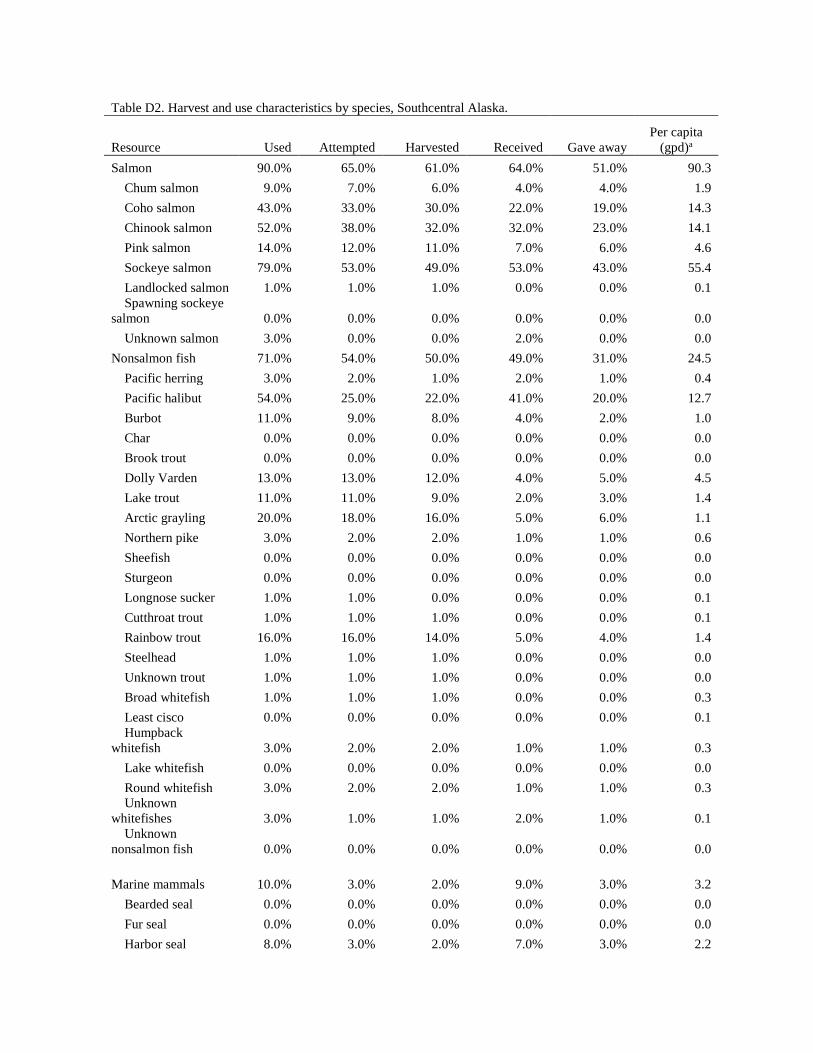
Table D2. Harvest and use characteristics by species, Southcentral Alaska.
Resource Used Attempted Harvested Received Gave away Per capita
(gpd)a Salmon 90.0% 65.0% 61.0% 64.0% 51.0% 90.3
Chum salmon 9.0% 7.0% 6.0% 4.0% 4.0% 1.9 Coho salmon 43.0% 33.0% 30.0% 22.0% 19.0% 14.3 Chinook salmon 52.0% 38.0% 32.0% 32.0% 23.0% 14.1 Pink salmon 14.0% 12.0% 11.0% 7.0% 6.0% 4.6 Sockeye salmon 79.0% 53.0% 49.0% 53.0% 43.0% 55.4 Landlocked salmon 1.0% 1.0% 1.0% 0.0% 0.0% 0.1 Spawning sockeye
salmon 0.0% 0.0% 0.0% 0.0% 0.0% 0.0 Unknown salmon 3.0% 0.0% 0.0% 2.0% 0.0% 0.0
Nonsalmon fish 71.0% 54.0% 50.0% 49.0% 31.0% 24.5 Pacific herring 3.0% 2.0% 1.0% 2.0% 1.0% 0.4 Pacific halibut 54.0% 25.0% 22.0% 41.0% 20.0% 12.7 Burbot 11.0% 9.0% 8.0% 4.0% 2.0% 1.0 Char 0.0% 0.0% 0.0% 0.0% 0.0% 0.0 Brook trout 0.0% 0.0% 0.0% 0.0% 0.0% 0.0 Dolly Varden 13.0% 13.0% 12.0% 4.0% 5.0% 4.5 Lake trout 11.0% 11.0% 9.0% 2.0% 3.0% 1.4 Arctic grayling 20.0% 18.0% 16.0% 5.0% 6.0% 1.1 Northern pike 3.0% 2.0% 2.0% 1.0% 1.0% 0.6 Sheefish 0.0% 0.0% 0.0% 0.0% 0.0% 0.0 Sturgeon 0.0% 0.0% 0.0% 0.0% 0.0% 0.0 Longnose sucker 1.0% 1.0% 0.0% 0.0% 0.0% 0.1 Cutthroat trout 1.0% 1.0% 1.0% 0.0% 0.0% 0.1 Rainbow trout 16.0% 16.0% 14.0% 5.0% 4.0% 1.4 Steelhead 1.0% 1.0% 1.0% 0.0% 0.0% 0.0 Unknown trout 1.0% 1.0% 1.0% 0.0% 0.0% 0.0 Broad whitefish 1.0% 1.0% 1.0% 0.0% 0.0% 0.3 Least cisco 0.0% 0.0% 0.0% 0.0% 0.0% 0.1 Humpback
whitefish 3.0% 2.0% 2.0% 1.0% 1.0% 0.3 Lake whitefish 0.0% 0.0% 0.0% 0.0% 0.0% 0.0 Round whitefish 3.0% 2.0% 2.0% 1.0% 1.0% 0.3 Unknown
whitefishes 3.0% 1.0% 1.0% 2.0% 1.0% 0.1 Unknown
nonsalmon fish 0.0% 0.0% 0.0% 0.0% 0.0% 0.0 Marine mammals 10.0% 3.0% 2.0% 9.0% 3.0% 3.2
Bearded seal 0.0% 0.0% 0.0% 0.0% 0.0% 0.0 Fur seal 0.0% 0.0% 0.0% 0.0% 0.0% 0.0 Harbor seal 8.0% 3.0% 2.0% 7.0% 3.0% 2.2
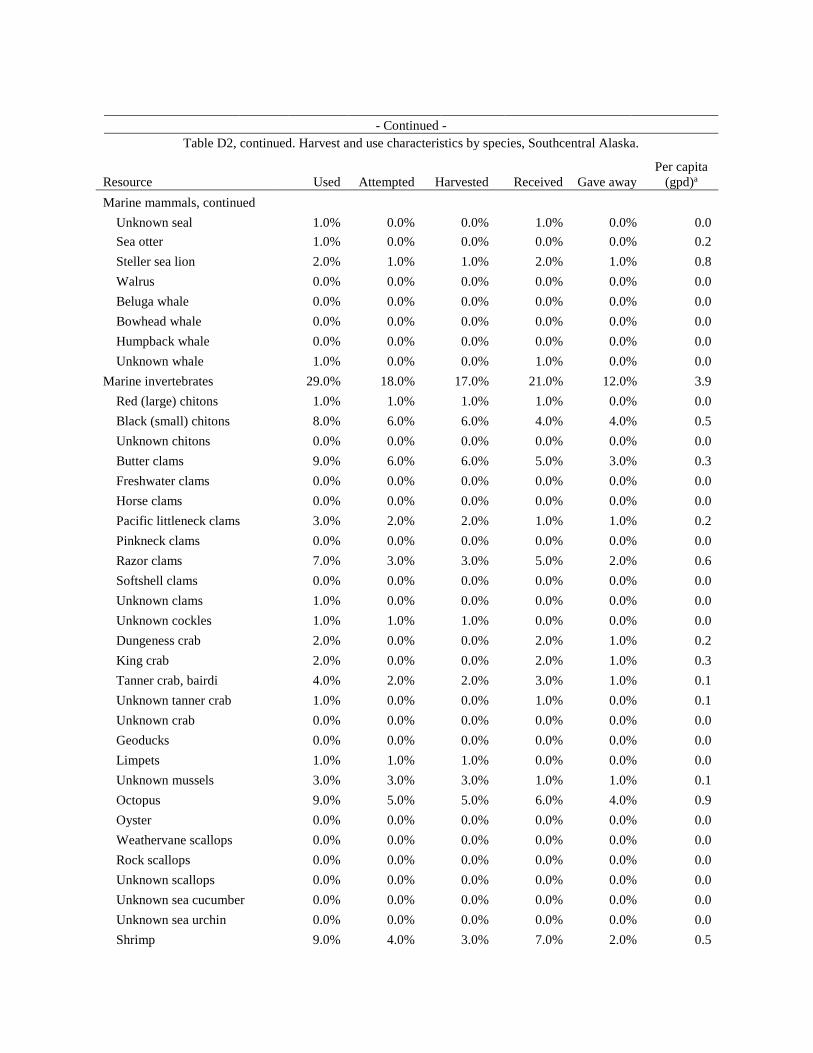
- Continued -
Table D2, continued. Harvest and use characteristics by species, Southcentral Alaska.
Resource Used Attempted Harvested Received Gave away Per capita
(gpd)a Marine mammals, continued
Unknown seal 1.0% 0.0% 0.0% 1.0% 0.0% 0.0 Sea otter 1.0% 0.0% 0.0% 0.0% 0.0% 0.2 Steller sea lion 2.0% 1.0% 1.0% 2.0% 1.0% 0.8 Walrus 0.0% 0.0% 0.0% 0.0% 0.0% 0.0 Beluga whale 0.0% 0.0% 0.0% 0.0% 0.0% 0.0 Bowhead whale 0.0% 0.0% 0.0% 0.0% 0.0% 0.0 Humpback whale 0.0% 0.0% 0.0% 0.0% 0.0% 0.0 Unknown whale 1.0% 0.0% 0.0% 1.0% 0.0% 0.0
Marine invertebrates 29.0% 18.0% 17.0% 21.0% 12.0% 3.9 Red (large) chitons 1.0% 1.0% 1.0% 1.0% 0.0% 0.0 Black (small) chitons 8.0% 6.0% 6.0% 4.0% 4.0% 0.5 Unknown chitons 0.0% 0.0% 0.0% 0.0% 0.0% 0.0 Butter clams 9.0% 6.0% 6.0% 5.0% 3.0% 0.3 Freshwater clams 0.0% 0.0% 0.0% 0.0% 0.0% 0.0 Horse clams 0.0% 0.0% 0.0% 0.0% 0.0% 0.0 Pacific littleneck clams 3.0% 2.0% 2.0% 1.0% 1.0% 0.2 Pinkneck clams 0.0% 0.0% 0.0% 0.0% 0.0% 0.0 Razor clams 7.0% 3.0% 3.0% 5.0% 2.0% 0.6 Softshell clams 0.0% 0.0% 0.0% 0.0% 0.0% 0.0 Unknown clams 1.0% 0.0% 0.0% 0.0% 0.0% 0.0 Unknown cockles 1.0% 1.0% 1.0% 0.0% 0.0% 0.0 Dungeness crab 2.0% 0.0% 0.0% 2.0% 1.0% 0.2 King crab 2.0% 0.0% 0.0% 2.0% 1.0% 0.3 Tanner crab, bairdi 4.0% 2.0% 2.0% 3.0% 1.0% 0.1 Unknown tanner crab 1.0% 0.0% 0.0% 1.0% 0.0% 0.1 Unknown crab 0.0% 0.0% 0.0% 0.0% 0.0% 0.0 Geoducks 0.0% 0.0% 0.0% 0.0% 0.0% 0.0 Limpets 1.0% 1.0% 1.0% 0.0% 0.0% 0.0 Unknown mussels 3.0% 3.0% 3.0% 1.0% 1.0% 0.1 Octopus 9.0% 5.0% 5.0% 6.0% 4.0% 0.9 Oyster 0.0% 0.0% 0.0% 0.0% 0.0% 0.0 Weathervane scallops 0.0% 0.0% 0.0% 0.0% 0.0% 0.0 Rock scallops 0.0% 0.0% 0.0% 0.0% 0.0% 0.0 Unknown scallops 0.0% 0.0% 0.0% 0.0% 0.0% 0.0 Unknown sea cucumber 0.0% 0.0% 0.0% 0.0% 0.0% 0.0 Unknown sea urchin 0.0% 0.0% 0.0% 0.0% 0.0% 0.0 Shrimp 9.0% 4.0% 3.0% 7.0% 2.0% 0.5
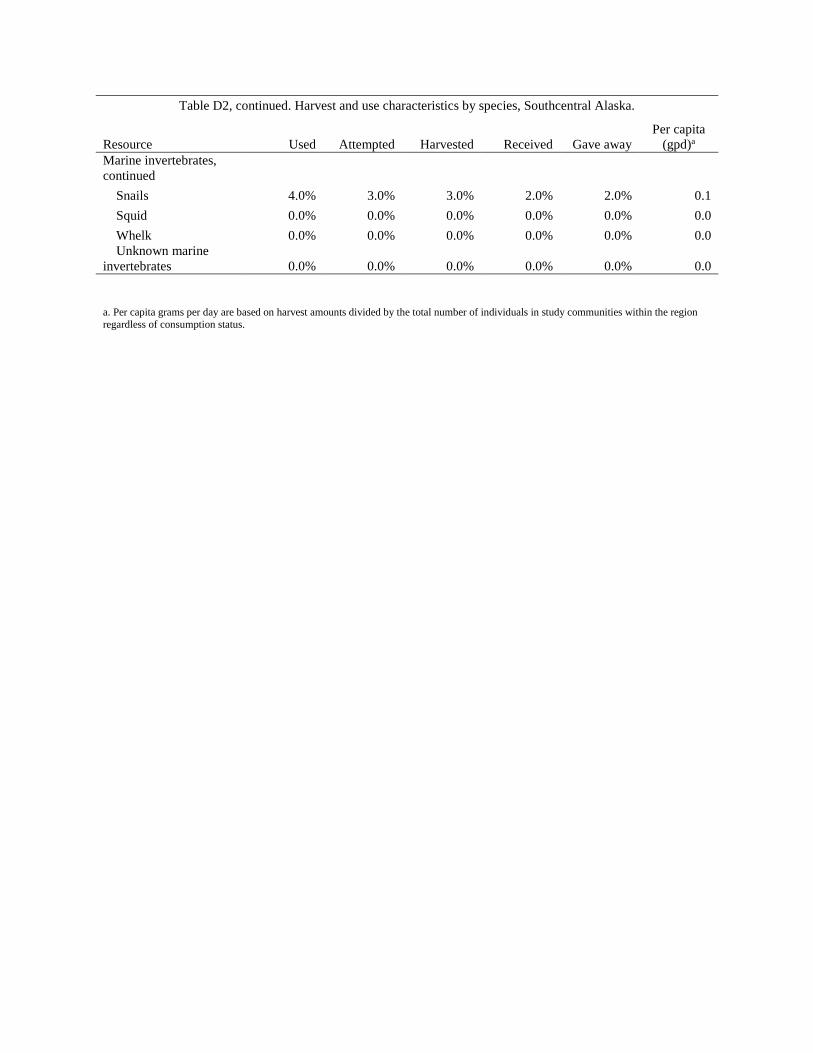
Table D2, continued. Harvest and use characteristics by species, Southcentral Alaska.
Resource Used Attempted Harvested Received Gave away Per capita
(gpd)a Marine invertebrates, continued
Snails 4.0% 3.0% 3.0% 2.0% 2.0% 0.1 Squid 0.0% 0.0% 0.0% 0.0% 0.0% 0.0 Whelk 0.0% 0.0% 0.0% 0.0% 0.0% 0.0 Unknown marine
invertebrates 0.0% 0.0% 0.0% 0.0% 0.0% 0.0
a. Per capita grams per day are based on harvest amounts divided by the total number of individuals in study communities within the region regardless of consumption status.
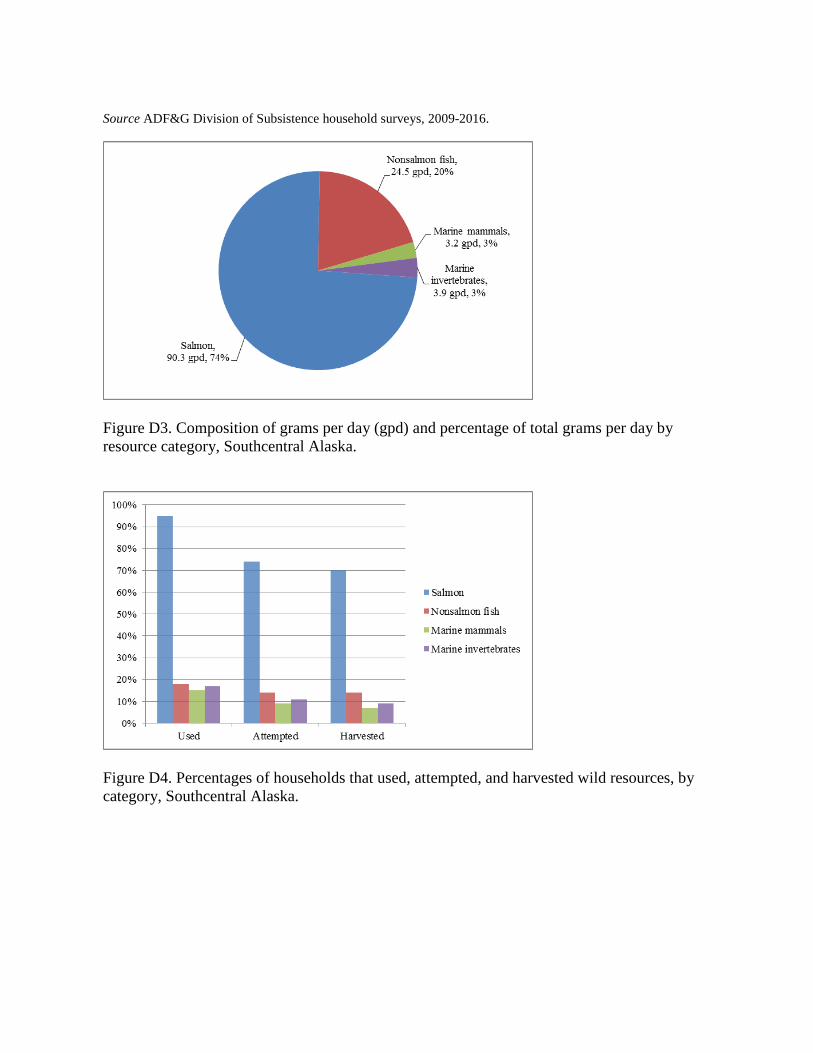
Source ADF&G Division of Subsistence household surveys, 2009-2016.
Figure D3. Composition of grams per day (gpd) and percentage of total grams per day by resource category, Southcentral Alaska.
Figure D4. Percentages of households that used, attempted, and harvested wild resources, by category, Southcentral Alaska.
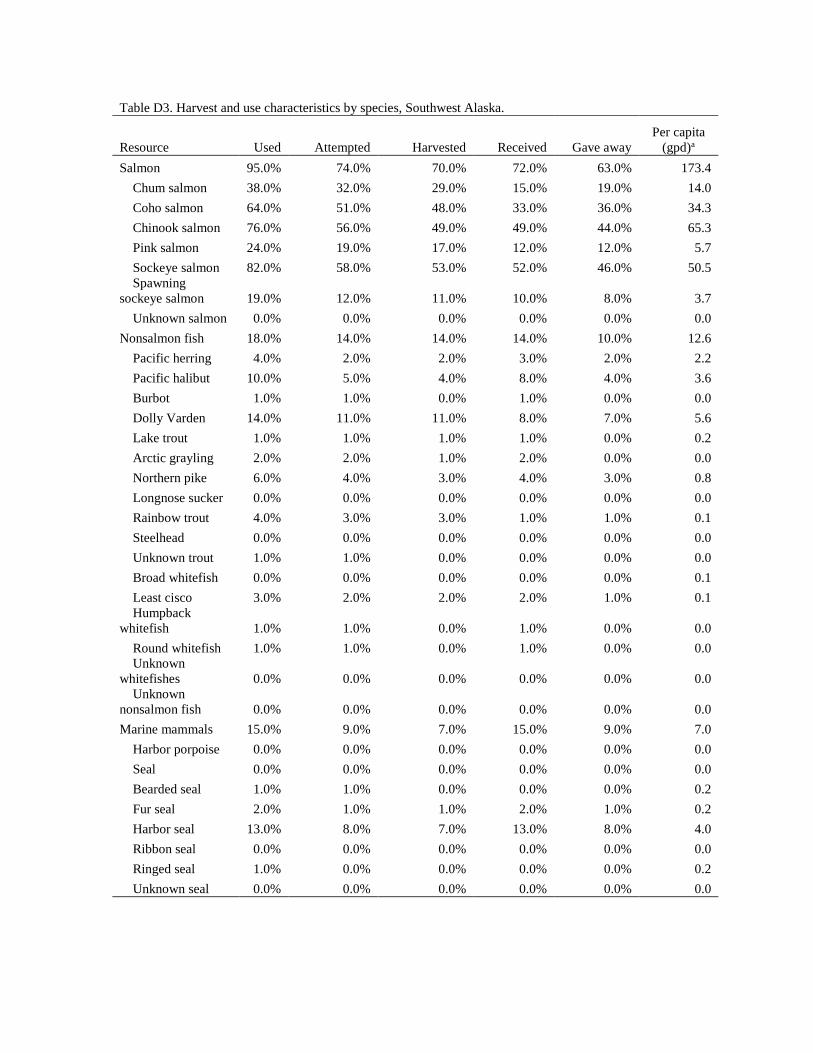
Table D3. Harvest and use characteristics by species, Southwest Alaska.
Resource Used Attempted Harvested Received Gave away Per capita
(gpd)a Salmon 95.0% 74.0% 70.0% 72.0% 63.0% 173.4
Chum salmon 38.0% 32.0% 29.0% 15.0% 19.0% 14.0 Coho salmon 64.0% 51.0% 48.0% 33.0% 36.0% 34.3 Chinook salmon 76.0% 56.0% 49.0% 49.0% 44.0% 65.3 Pink salmon 24.0% 19.0% 17.0% 12.0% 12.0% 5.7 Sockeye salmon 82.0% 58.0% 53.0% 52.0% 46.0% 50.5 Spawning
sockeye salmon 19.0% 12.0% 11.0% 10.0% 8.0% 3.7 Unknown salmon 0.0% 0.0% 0.0% 0.0% 0.0% 0.0
Nonsalmon fish 18.0% 14.0% 14.0% 14.0% 10.0% 12.6 Pacific herring 4.0% 2.0% 2.0% 3.0% 2.0% 2.2 Pacific halibut 10.0% 5.0% 4.0% 8.0% 4.0% 3.6 Burbot 1.0% 1.0% 0.0% 1.0% 0.0% 0.0 Dolly Varden 14.0% 11.0% 11.0% 8.0% 7.0% 5.6 Lake trout 1.0% 1.0% 1.0% 1.0% 0.0% 0.2 Arctic grayling 2.0% 2.0% 1.0% 2.0% 0.0% 0.0 Northern pike 6.0% 4.0% 3.0% 4.0% 3.0% 0.8 Longnose sucker 0.0% 0.0% 0.0% 0.0% 0.0% 0.0 Rainbow trout 4.0% 3.0% 3.0% 1.0% 1.0% 0.1 Steelhead 0.0% 0.0% 0.0% 0.0% 0.0% 0.0 Unknown trout 1.0% 1.0% 0.0% 0.0% 0.0% 0.0 Broad whitefish 0.0% 0.0% 0.0% 0.0% 0.0% 0.1 Least cisco 3.0% 2.0% 2.0% 2.0% 1.0% 0.1 Humpback
whitefish 1.0% 1.0% 0.0% 1.0% 0.0% 0.0 Round whitefish 1.0% 1.0% 0.0% 1.0% 0.0% 0.0 Unknown
whitefishes 0.0% 0.0% 0.0% 0.0% 0.0% 0.0 Unknown
nonsalmon fish 0.0% 0.0% 0.0% 0.0% 0.0% 0.0 Marine mammals 15.0% 9.0% 7.0% 15.0% 9.0% 7.0
Harbor porpoise 0.0% 0.0% 0.0% 0.0% 0.0% 0.0 Seal 0.0% 0.0% 0.0% 0.0% 0.0% 0.0 Bearded seal 1.0% 1.0% 0.0% 0.0% 0.0% 0.2 Fur seal 2.0% 1.0% 1.0% 2.0% 1.0% 0.2 Harbor seal 13.0% 8.0% 7.0% 13.0% 8.0% 4.0 Ribbon seal 0.0% 0.0% 0.0% 0.0% 0.0% 0.0 Ringed seal 1.0% 0.0% 0.0% 0.0% 0.0% 0.2 Unknown seal 0.0% 0.0% 0.0% 0.0% 0.0% 0.0
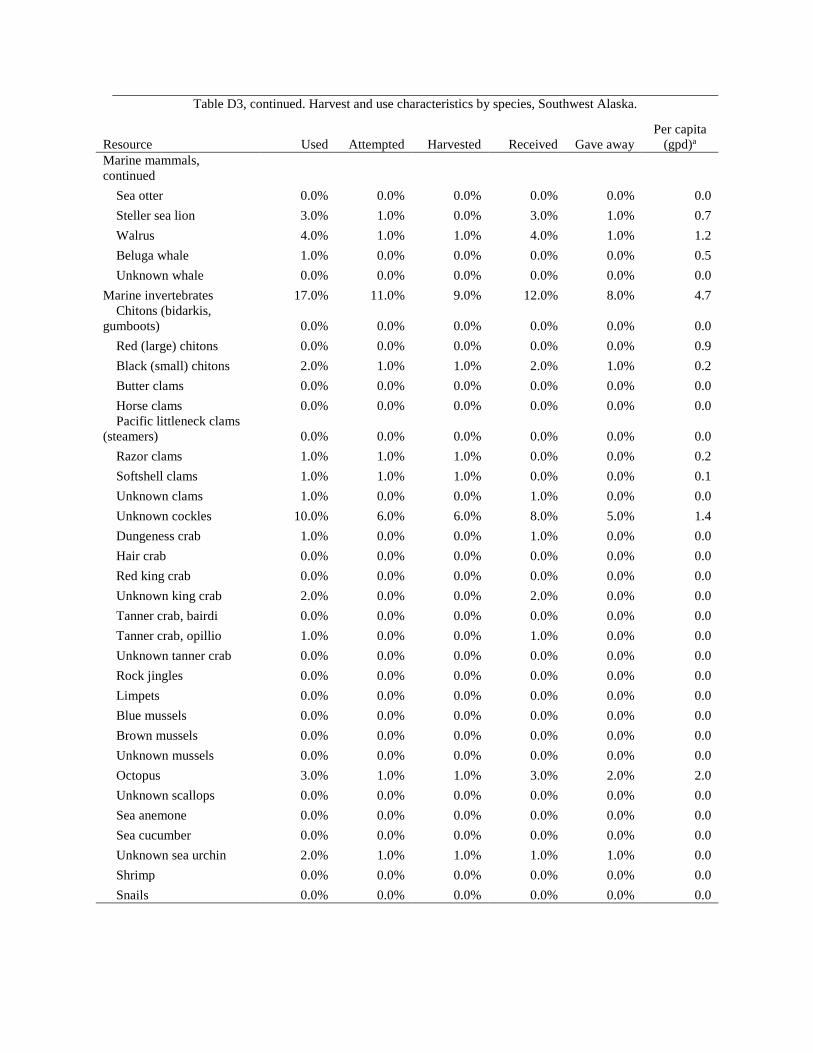
Table D3, continued. Harvest and use characteristics by species, Southwest Alaska.
Resource Used Attempted Harvested Received Gave away Per capita
(gpd)a Marine mammals, continued
Sea otter 0.0% 0.0% 0.0% 0.0% 0.0% 0.0 Steller sea lion 3.0% 1.0% 0.0% 3.0% 1.0% 0.7 Walrus 4.0% 1.0% 1.0% 4.0% 1.0% 1.2 Beluga whale 1.0% 0.0% 0.0% 0.0% 0.0% 0.5 Unknown whale 0.0% 0.0% 0.0% 0.0% 0.0% 0.0
Marine invertebrates 17.0% 11.0% 9.0% 12.0% 8.0% 4.7 Chitons (bidarkis,
gumboots) 0.0% 0.0% 0.0% 0.0% 0.0% 0.0 Red (large) chitons 0.0% 0.0% 0.0% 0.0% 0.0% 0.9 Black (small) chitons 2.0% 1.0% 1.0% 2.0% 1.0% 0.2 Butter clams 0.0% 0.0% 0.0% 0.0% 0.0% 0.0 Horse clams 0.0% 0.0% 0.0% 0.0% 0.0% 0.0 Pacific littleneck clams
(steamers) 0.0% 0.0% 0.0% 0.0% 0.0% 0.0 Razor clams 1.0% 1.0% 1.0% 0.0% 0.0% 0.2 Softshell clams 1.0% 1.0% 1.0% 0.0% 0.0% 0.1 Unknown clams 1.0% 0.0% 0.0% 1.0% 0.0% 0.0 Unknown cockles 10.0% 6.0% 6.0% 8.0% 5.0% 1.4 Dungeness crab 1.0% 0.0% 0.0% 1.0% 0.0% 0.0 Hair crab 0.0% 0.0% 0.0% 0.0% 0.0% 0.0 Red king crab 0.0% 0.0% 0.0% 0.0% 0.0% 0.0 Unknown king crab 2.0% 0.0% 0.0% 2.0% 0.0% 0.0 Tanner crab, bairdi 0.0% 0.0% 0.0% 0.0% 0.0% 0.0 Tanner crab, opillio 1.0% 0.0% 0.0% 1.0% 0.0% 0.0 Unknown tanner crab 0.0% 0.0% 0.0% 0.0% 0.0% 0.0 Rock jingles 0.0% 0.0% 0.0% 0.0% 0.0% 0.0 Limpets 0.0% 0.0% 0.0% 0.0% 0.0% 0.0 Blue mussels 0.0% 0.0% 0.0% 0.0% 0.0% 0.0 Brown mussels 0.0% 0.0% 0.0% 0.0% 0.0% 0.0 Unknown mussels 0.0% 0.0% 0.0% 0.0% 0.0% 0.0 Octopus 3.0% 1.0% 1.0% 3.0% 2.0% 2.0 Unknown scallops 0.0% 0.0% 0.0% 0.0% 0.0% 0.0 Sea anemone 0.0% 0.0% 0.0% 0.0% 0.0% 0.0 Sea cucumber 0.0% 0.0% 0.0% 0.0% 0.0% 0.0 Unknown sea urchin 2.0% 1.0% 1.0% 1.0% 1.0% 0.0 Shrimp 0.0% 0.0% 0.0% 0.0% 0.0% 0.0 Snails 0.0% 0.0% 0.0% 0.0% 0.0% 0.0
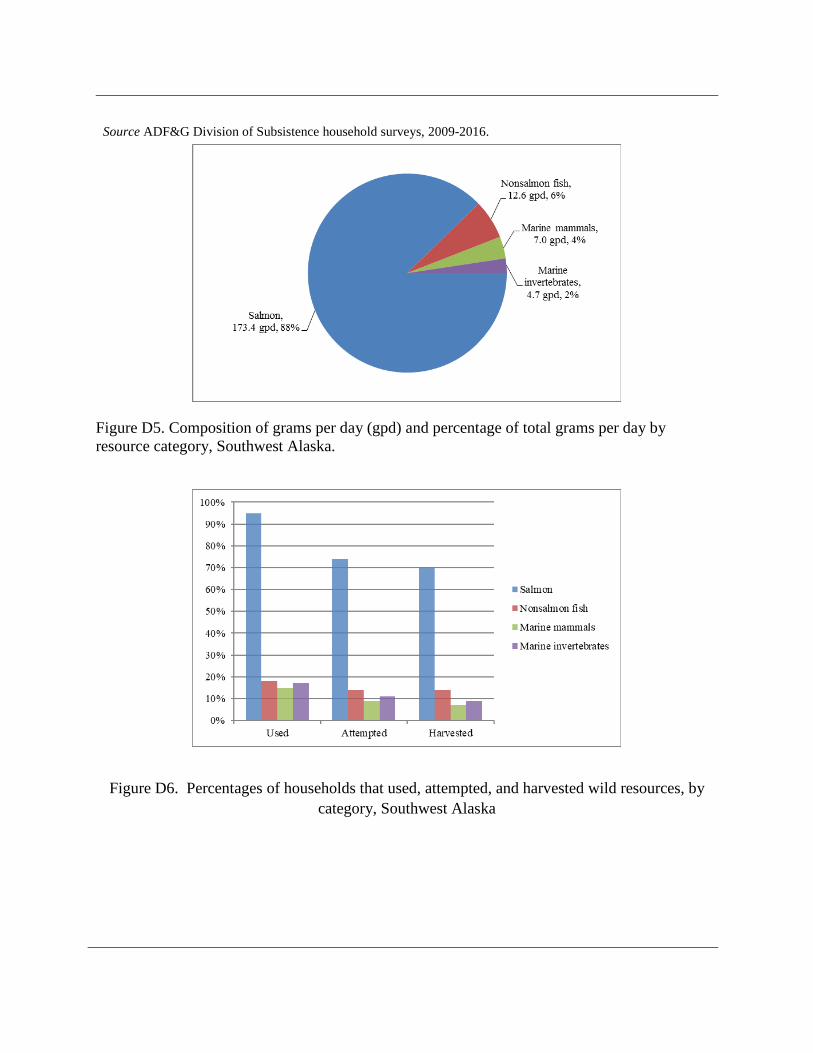
Source ADF&G Division of Subsistence household surveys, 2009-2016.
Figure D5. Composition of grams per day (gpd) and percentage of total grams per day by resource category, Southwest Alaska.
Figure D6. Percentages of households that used, attempted, and harvested wild resources, by category, Southwest Alaska
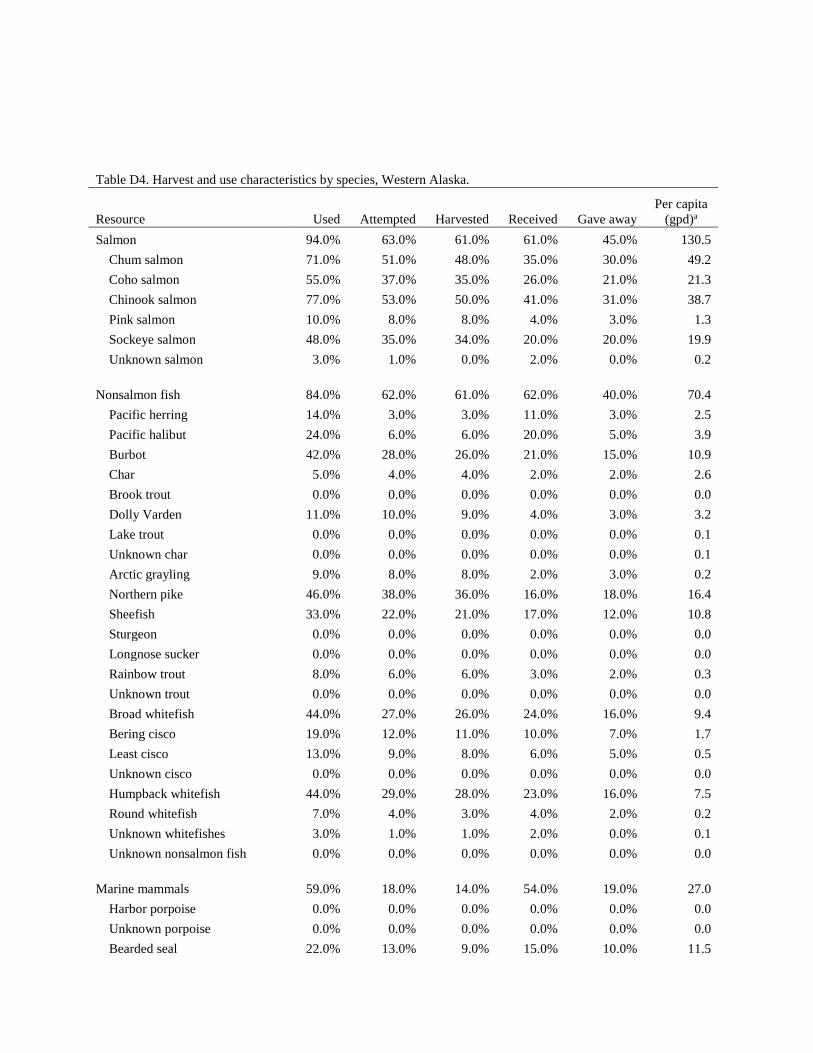
Table D4. Harvest and use characteristics by species, Western Alaska.
Resource Used Attempted Harvested Received Gave away Per capita
(gpd)a Salmon 94.0% 63.0% 61.0% 61.0% 45.0% 130.5
Chum salmon 71.0% 51.0% 48.0% 35.0% 30.0% 49.2 Coho salmon 55.0% 37.0% 35.0% 26.0% 21.0% 21.3 Chinook salmon 77.0% 53.0% 50.0% 41.0% 31.0% 38.7 Pink salmon 10.0% 8.0% 8.0% 4.0% 3.0% 1.3 Sockeye salmon 48.0% 35.0% 34.0% 20.0% 20.0% 19.9 Unknown salmon 3.0% 1.0% 0.0% 2.0% 0.0% 0.2
Nonsalmon fish 84.0% 62.0% 61.0% 62.0% 40.0% 70.4
Pacific herring 14.0% 3.0% 3.0% 11.0% 3.0% 2.5 Pacific halibut 24.0% 6.0% 6.0% 20.0% 5.0% 3.9 Burbot 42.0% 28.0% 26.0% 21.0% 15.0% 10.9 Char 5.0% 4.0% 4.0% 2.0% 2.0% 2.6 Brook trout 0.0% 0.0% 0.0% 0.0% 0.0% 0.0 Dolly Varden 11.0% 10.0% 9.0% 4.0% 3.0% 3.2 Lake trout 0.0% 0.0% 0.0% 0.0% 0.0% 0.1 Unknown char 0.0% 0.0% 0.0% 0.0% 0.0% 0.1 Arctic grayling 9.0% 8.0% 8.0% 2.0% 3.0% 0.2 Northern pike 46.0% 38.0% 36.0% 16.0% 18.0% 16.4 Sheefish 33.0% 22.0% 21.0% 17.0% 12.0% 10.8 Sturgeon 0.0% 0.0% 0.0% 0.0% 0.0% 0.0 Longnose sucker 0.0% 0.0% 0.0% 0.0% 0.0% 0.0 Rainbow trout 8.0% 6.0% 6.0% 3.0% 2.0% 0.3 Unknown trout 0.0% 0.0% 0.0% 0.0% 0.0% 0.0 Broad whitefish 44.0% 27.0% 26.0% 24.0% 16.0% 9.4 Bering cisco 19.0% 12.0% 11.0% 10.0% 7.0% 1.7 Least cisco 13.0% 9.0% 8.0% 6.0% 5.0% 0.5 Unknown cisco 0.0% 0.0% 0.0% 0.0% 0.0% 0.0 Humpback whitefish 44.0% 29.0% 28.0% 23.0% 16.0% 7.5 Round whitefish 7.0% 4.0% 3.0% 4.0% 2.0% 0.2 Unknown whitefishes 3.0% 1.0% 1.0% 2.0% 0.0% 0.1 Unknown nonsalmon fish 0.0% 0.0% 0.0% 0.0% 0.0% 0.0
Marine mammals 59.0% 18.0% 14.0% 54.0% 19.0% 27.0
Harbor porpoise 0.0% 0.0% 0.0% 0.0% 0.0% 0.0 Unknown porpoise 0.0% 0.0% 0.0% 0.0% 0.0% 0.0 Bearded seal 22.0% 13.0% 9.0% 15.0% 10.0% 11.5
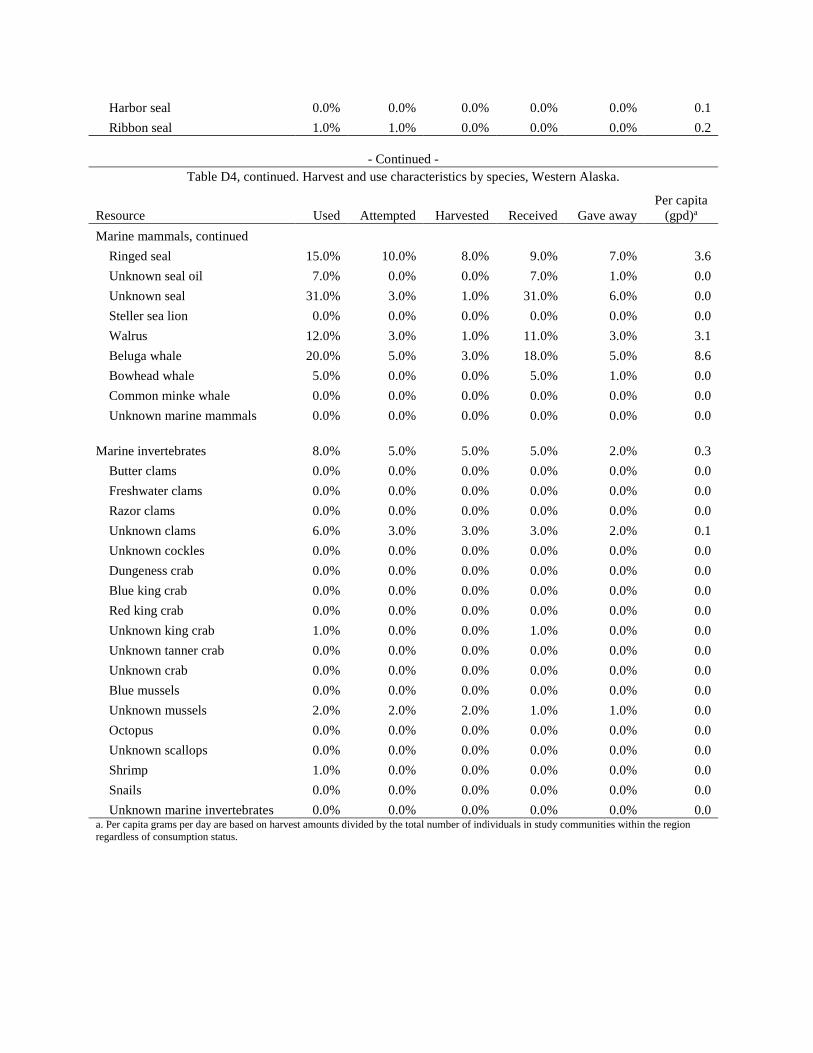
Harbor seal 0.0% 0.0% 0.0% 0.0% 0.0% 0.1 Ribbon seal 1.0% 1.0% 0.0% 0.0% 0.0% 0.2
- Continued -
Table D4, continued. Harvest and use characteristics by species, Western Alaska.
Resource Used Attempted Harvested Received Gave away Per capita
(gpd)a Marine mammals, continued
Ringed seal 15.0% 10.0% 8.0% 9.0% 7.0% 3.6 Unknown seal oil 7.0% 0.0% 0.0% 7.0% 1.0% 0.0 Unknown seal 31.0% 3.0% 1.0% 31.0% 6.0% 0.0 Steller sea lion 0.0% 0.0% 0.0% 0.0% 0.0% 0.0 Walrus 12.0% 3.0% 1.0% 11.0% 3.0% 3.1 Beluga whale 20.0% 5.0% 3.0% 18.0% 5.0% 8.6 Bowhead whale 5.0% 0.0% 0.0% 5.0% 1.0% 0.0 Common minke whale 0.0% 0.0% 0.0% 0.0% 0.0% 0.0 Unknown marine mammals 0.0% 0.0% 0.0% 0.0% 0.0% 0.0
Marine invertebrates 8.0% 5.0% 5.0% 5.0% 2.0% 0.3
Butter clams 0.0% 0.0% 0.0% 0.0% 0.0% 0.0 Freshwater clams 0.0% 0.0% 0.0% 0.0% 0.0% 0.0 Razor clams 0.0% 0.0% 0.0% 0.0% 0.0% 0.0 Unknown clams 6.0% 3.0% 3.0% 3.0% 2.0% 0.1 Unknown cockles 0.0% 0.0% 0.0% 0.0% 0.0% 0.0 Dungeness crab 0.0% 0.0% 0.0% 0.0% 0.0% 0.0 Blue king crab 0.0% 0.0% 0.0% 0.0% 0.0% 0.0 Red king crab 0.0% 0.0% 0.0% 0.0% 0.0% 0.0 Unknown king crab 1.0% 0.0% 0.0% 1.0% 0.0% 0.0 Unknown tanner crab 0.0% 0.0% 0.0% 0.0% 0.0% 0.0 Unknown crab 0.0% 0.0% 0.0% 0.0% 0.0% 0.0 Blue mussels 0.0% 0.0% 0.0% 0.0% 0.0% 0.0 Unknown mussels 2.0% 2.0% 2.0% 1.0% 1.0% 0.0 Octopus 0.0% 0.0% 0.0% 0.0% 0.0% 0.0 Unknown scallops 0.0% 0.0% 0.0% 0.0% 0.0% 0.0 Shrimp 1.0% 0.0% 0.0% 0.0% 0.0% 0.0 Snails 0.0% 0.0% 0.0% 0.0% 0.0% 0.0 Unknown marine invertebrates 0.0% 0.0% 0.0% 0.0% 0.0% 0.0
a. Per capita grams per day are based on harvest amounts divided by the total number of individuals in study communities within the region regardless of consumption status.
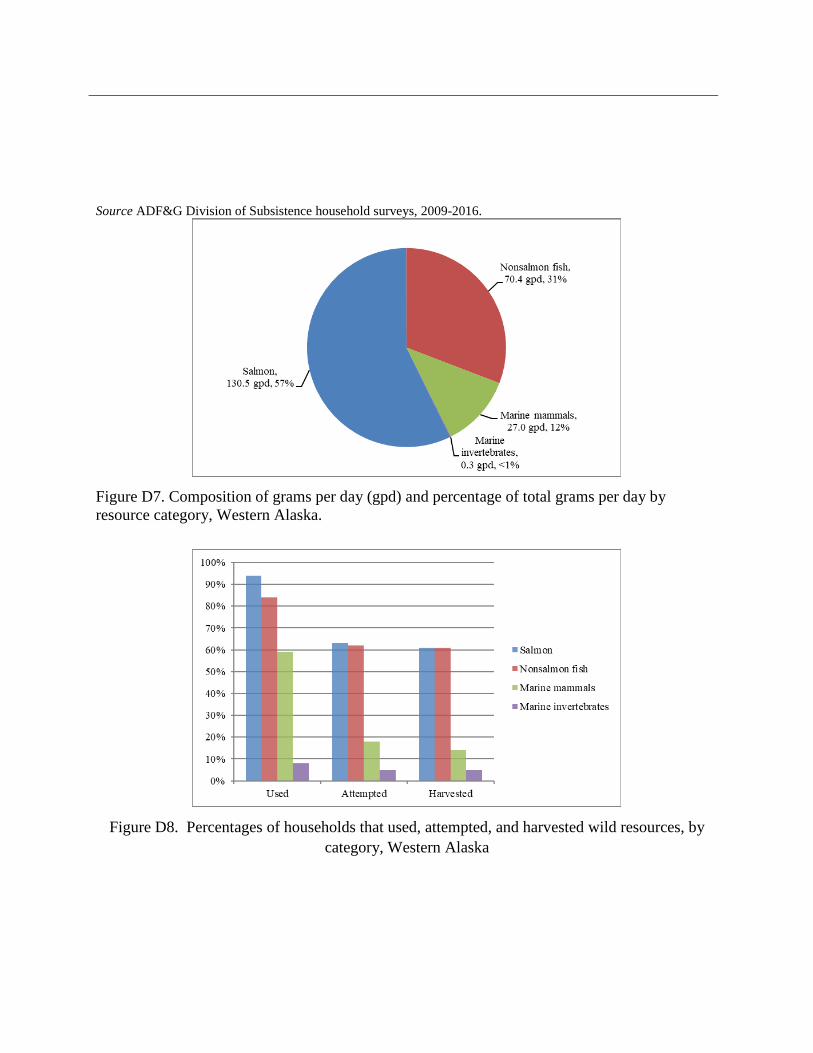
Source ADF&G Division of Subsistence household surveys, 2009-2016.
Figure D7. Composition of grams per day (gpd) and percentage of total grams per day by resource category, Western Alaska.
Figure D8. Percentages of households that used, attempted, and harvested wild resources, by category, Western Alaska
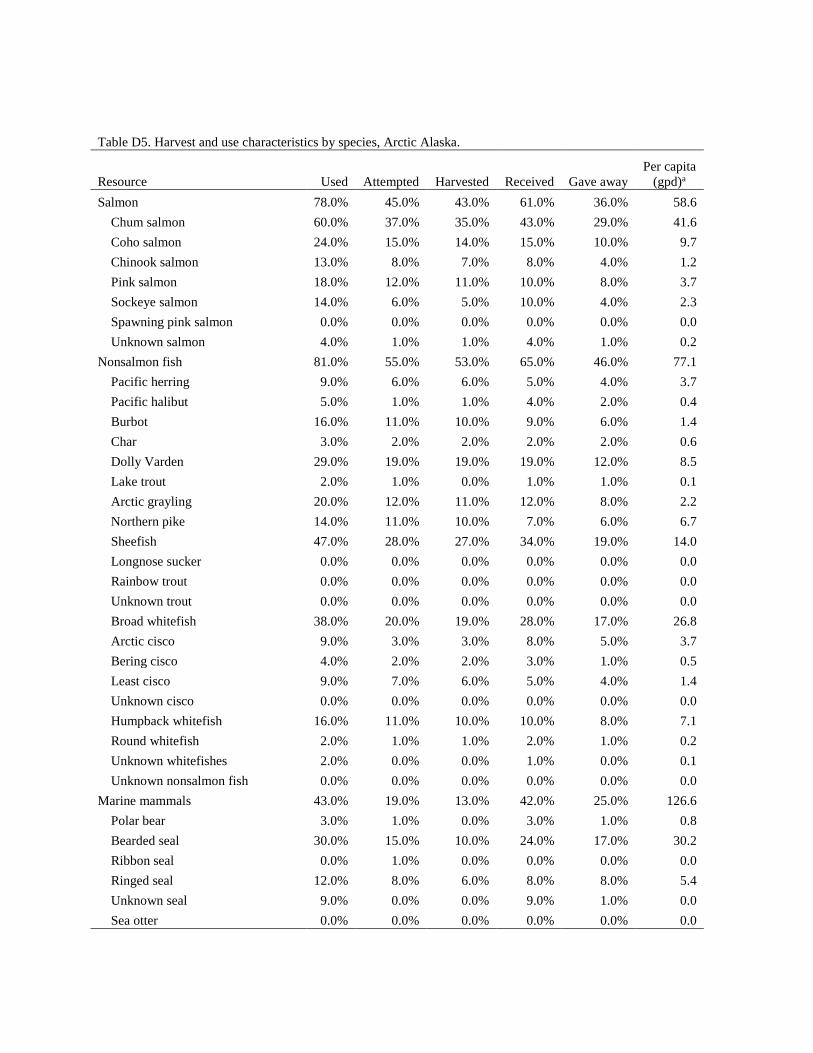
Table D5. Harvest and use characteristics by species, Arctic Alaska.
Resource Used Attempted Harvested Received Gave away Per capita
(gpd)a Salmon 78.0% 45.0% 43.0% 61.0% 36.0% 58.6
Chum salmon 60.0% 37.0% 35.0% 43.0% 29.0% 41.6 Coho salmon 24.0% 15.0% 14.0% 15.0% 10.0% 9.7 Chinook salmon 13.0% 8.0% 7.0% 8.0% 4.0% 1.2 Pink salmon 18.0% 12.0% 11.0% 10.0% 8.0% 3.7 Sockeye salmon 14.0% 6.0% 5.0% 10.0% 4.0% 2.3 Spawning pink salmon 0.0% 0.0% 0.0% 0.0% 0.0% 0.0 Unknown salmon 4.0% 1.0% 1.0% 4.0% 1.0% 0.2
Nonsalmon fish 81.0% 55.0% 53.0% 65.0% 46.0% 77.1 Pacific herring 9.0% 6.0% 6.0% 5.0% 4.0% 3.7 Pacific halibut 5.0% 1.0% 1.0% 4.0% 2.0% 0.4 Burbot 16.0% 11.0% 10.0% 9.0% 6.0% 1.4 Char 3.0% 2.0% 2.0% 2.0% 2.0% 0.6 Dolly Varden 29.0% 19.0% 19.0% 19.0% 12.0% 8.5 Lake trout 2.0% 1.0% 0.0% 1.0% 1.0% 0.1 Arctic grayling 20.0% 12.0% 11.0% 12.0% 8.0% 2.2 Northern pike 14.0% 11.0% 10.0% 7.0% 6.0% 6.7 Sheefish 47.0% 28.0% 27.0% 34.0% 19.0% 14.0 Longnose sucker 0.0% 0.0% 0.0% 0.0% 0.0% 0.0 Rainbow trout 0.0% 0.0% 0.0% 0.0% 0.0% 0.0 Unknown trout 0.0% 0.0% 0.0% 0.0% 0.0% 0.0 Broad whitefish 38.0% 20.0% 19.0% 28.0% 17.0% 26.8 Arctic cisco 9.0% 3.0% 3.0% 8.0% 5.0% 3.7 Bering cisco 4.0% 2.0% 2.0% 3.0% 1.0% 0.5 Least cisco 9.0% 7.0% 6.0% 5.0% 4.0% 1.4 Unknown cisco 0.0% 0.0% 0.0% 0.0% 0.0% 0.0 Humpback whitefish 16.0% 11.0% 10.0% 10.0% 8.0% 7.1 Round whitefish 2.0% 1.0% 1.0% 2.0% 1.0% 0.2 Unknown whitefishes 2.0% 0.0% 0.0% 1.0% 0.0% 0.1 Unknown nonsalmon fish 0.0% 0.0% 0.0% 0.0% 0.0% 0.0
Marine mammals 43.0% 19.0% 13.0% 42.0% 25.0% 126.6 Polar bear 3.0% 1.0% 0.0% 3.0% 1.0% 0.8 Bearded seal 30.0% 15.0% 10.0% 24.0% 17.0% 30.2 Ribbon seal 0.0% 1.0% 0.0% 0.0% 0.0% 0.0 Ringed seal 12.0% 8.0% 6.0% 8.0% 8.0% 5.4 Unknown seal 9.0% 0.0% 0.0% 9.0% 1.0% 0.0 Sea otter 0.0% 0.0% 0.0% 0.0% 0.0% 0.0
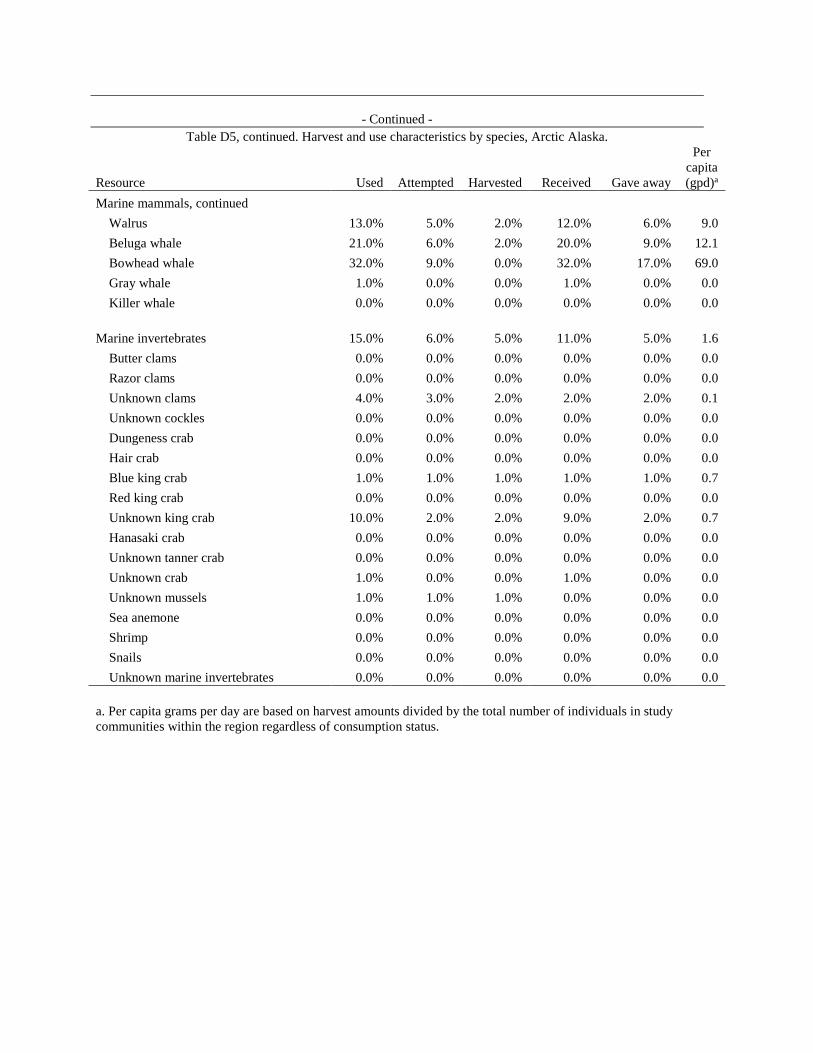
- Continued -
Table D5, continued. Harvest and use characteristics by species, Arctic Alaska.
Resource Used Attempted Harvested Received Gave away
Per capita (gpd)a
Marine mammals, continued Walrus 13.0% 5.0% 2.0% 12.0% 6.0% 9.0 Beluga whale 21.0% 6.0% 2.0% 20.0% 9.0% 12.1 Bowhead whale 32.0% 9.0% 0.0% 32.0% 17.0% 69.0 Gray whale 1.0% 0.0% 0.0% 1.0% 0.0% 0.0 Killer whale 0.0% 0.0% 0.0% 0.0% 0.0% 0.0
Marine invertebrates 15.0% 6.0% 5.0% 11.0% 5.0% 1.6
Butter clams 0.0% 0.0% 0.0% 0.0% 0.0% 0.0 Razor clams 0.0% 0.0% 0.0% 0.0% 0.0% 0.0 Unknown clams 4.0% 3.0% 2.0% 2.0% 2.0% 0.1 Unknown cockles 0.0% 0.0% 0.0% 0.0% 0.0% 0.0 Dungeness crab 0.0% 0.0% 0.0% 0.0% 0.0% 0.0 Hair crab 0.0% 0.0% 0.0% 0.0% 0.0% 0.0 Blue king crab 1.0% 1.0% 1.0% 1.0% 1.0% 0.7 Red king crab 0.0% 0.0% 0.0% 0.0% 0.0% 0.0 Unknown king crab 10.0% 2.0% 2.0% 9.0% 2.0% 0.7 Hanasaki crab 0.0% 0.0% 0.0% 0.0% 0.0% 0.0 Unknown tanner crab 0.0% 0.0% 0.0% 0.0% 0.0% 0.0 Unknown crab 1.0% 0.0% 0.0% 1.0% 0.0% 0.0 Unknown mussels 1.0% 1.0% 1.0% 0.0% 0.0% 0.0 Sea anemone 0.0% 0.0% 0.0% 0.0% 0.0% 0.0 Shrimp 0.0% 0.0% 0.0% 0.0% 0.0% 0.0 Snails 0.0% 0.0% 0.0% 0.0% 0.0% 0.0 Unknown marine invertebrates 0.0% 0.0% 0.0% 0.0% 0.0% 0.0
a. Per capita grams per day are based on harvest amounts divided by the total number of individuals in study communities within the region regardless of consumption status.
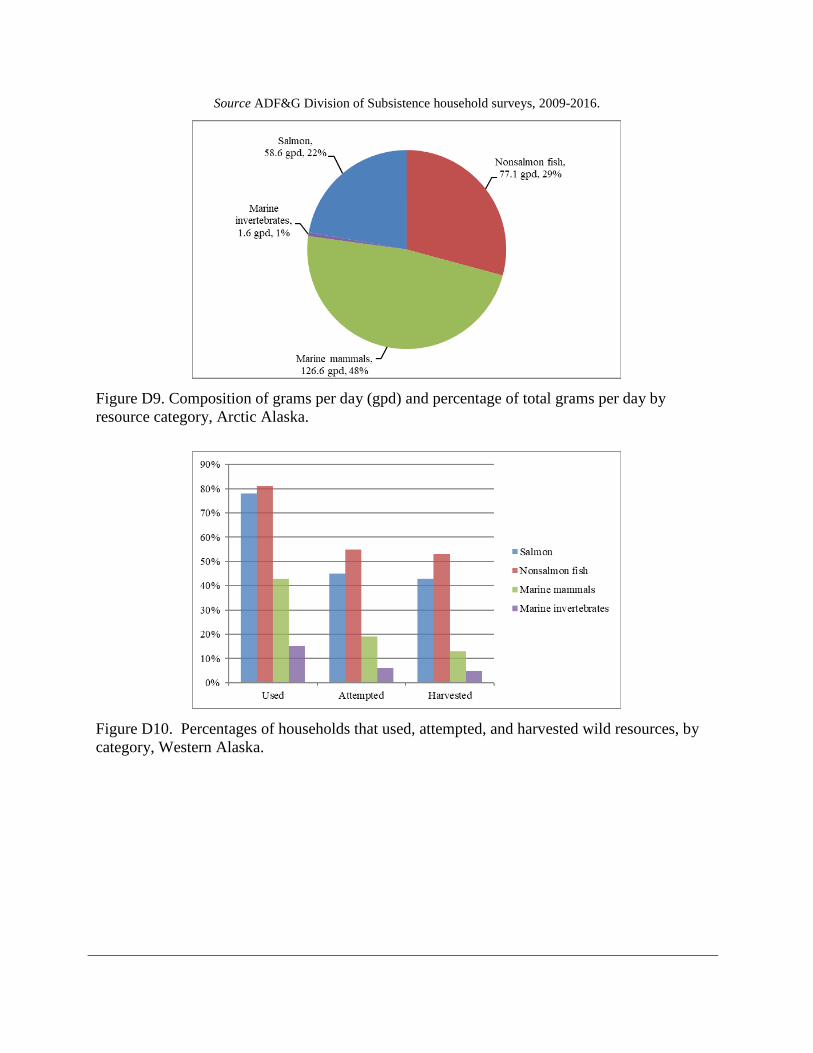
Source ADF&G Division of Subsistence household surveys, 2009-2016.
Figure D9. Composition of grams per day (gpd) and percentage of total grams per day by resource category, Arctic Alaska.
Figure D10. Percentages of households that used, attempted, and harvested wild resources, by category, Western Alaska.
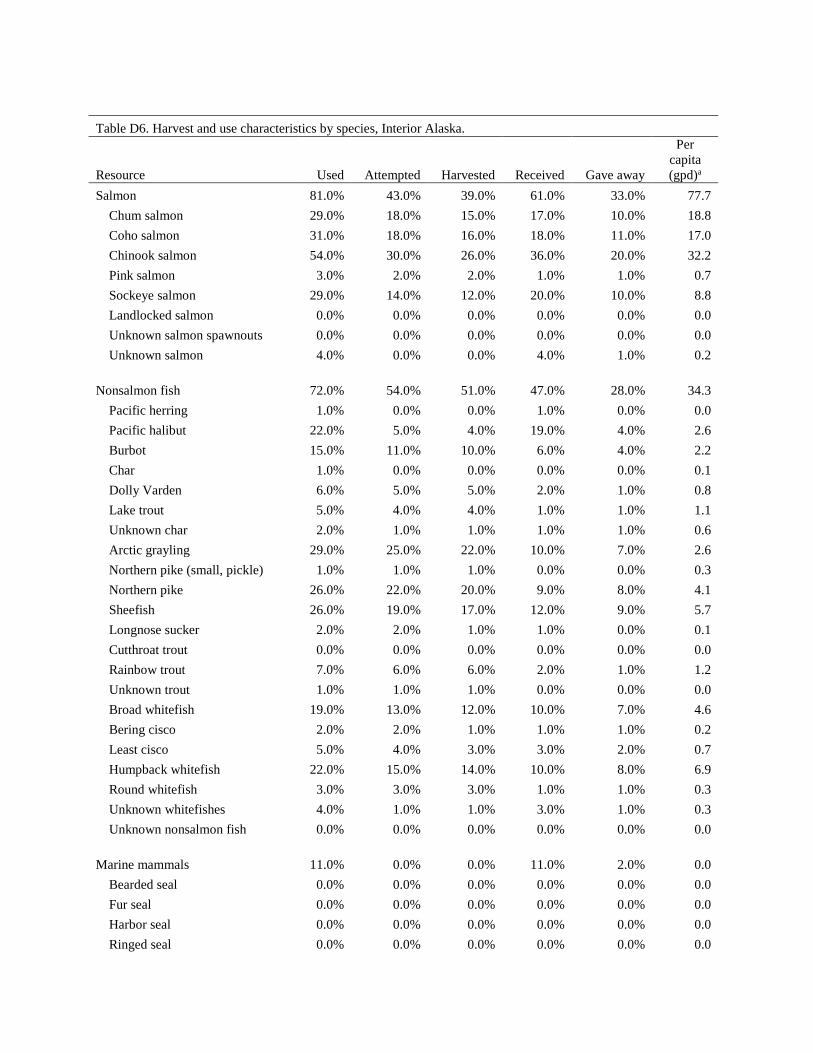
Table D6. Harvest and use characteristics by species, Interior Alaska.
Resource Used Attempted Harvested Received Gave away
Per capita (gpd)a
Salmon 81.0% 43.0% 39.0% 61.0% 33.0% 77.7 Chum salmon 29.0% 18.0% 15.0% 17.0% 10.0% 18.8 Coho salmon 31.0% 18.0% 16.0% 18.0% 11.0% 17.0 Chinook salmon 54.0% 30.0% 26.0% 36.0% 20.0% 32.2 Pink salmon 3.0% 2.0% 2.0% 1.0% 1.0% 0.7 Sockeye salmon 29.0% 14.0% 12.0% 20.0% 10.0% 8.8 Landlocked salmon 0.0% 0.0% 0.0% 0.0% 0.0% 0.0 Unknown salmon spawnouts 0.0% 0.0% 0.0% 0.0% 0.0% 0.0 Unknown salmon 4.0% 0.0% 0.0% 4.0% 1.0% 0.2
Nonsalmon fish 72.0% 54.0% 51.0% 47.0% 28.0% 34.3
Pacific herring 1.0% 0.0% 0.0% 1.0% 0.0% 0.0 Pacific halibut 22.0% 5.0% 4.0% 19.0% 4.0% 2.6 Burbot 15.0% 11.0% 10.0% 6.0% 4.0% 2.2 Char 1.0% 0.0% 0.0% 0.0% 0.0% 0.1 Dolly Varden 6.0% 5.0% 5.0% 2.0% 1.0% 0.8 Lake trout 5.0% 4.0% 4.0% 1.0% 1.0% 1.1 Unknown char 2.0% 1.0% 1.0% 1.0% 1.0% 0.6 Arctic grayling 29.0% 25.0% 22.0% 10.0% 7.0% 2.6 Northern pike (small, pickle) 1.0% 1.0% 1.0% 0.0% 0.0% 0.3 Northern pike 26.0% 22.0% 20.0% 9.0% 8.0% 4.1 Sheefish 26.0% 19.0% 17.0% 12.0% 9.0% 5.7 Longnose sucker 2.0% 2.0% 1.0% 1.0% 0.0% 0.1 Cutthroat trout 0.0% 0.0% 0.0% 0.0% 0.0% 0.0 Rainbow trout 7.0% 6.0% 6.0% 2.0% 1.0% 1.2 Unknown trout 1.0% 1.0% 1.0% 0.0% 0.0% 0.0 Broad whitefish 19.0% 13.0% 12.0% 10.0% 7.0% 4.6 Bering cisco 2.0% 2.0% 1.0% 1.0% 1.0% 0.2 Least cisco 5.0% 4.0% 3.0% 3.0% 2.0% 0.7 Humpback whitefish 22.0% 15.0% 14.0% 10.0% 8.0% 6.9 Round whitefish 3.0% 3.0% 3.0% 1.0% 1.0% 0.3 Unknown whitefishes 4.0% 1.0% 1.0% 3.0% 1.0% 0.3 Unknown nonsalmon fish 0.0% 0.0% 0.0% 0.0% 0.0% 0.0
Marine mammals 11.0% 0.0% 0.0% 11.0% 2.0% 0.0
Bearded seal 0.0% 0.0% 0.0% 0.0% 0.0% 0.0 Fur seal 0.0% 0.0% 0.0% 0.0% 0.0% 0.0 Harbor seal 0.0% 0.0% 0.0% 0.0% 0.0% 0.0 Ringed seal 0.0% 0.0% 0.0% 0.0% 0.0% 0.0
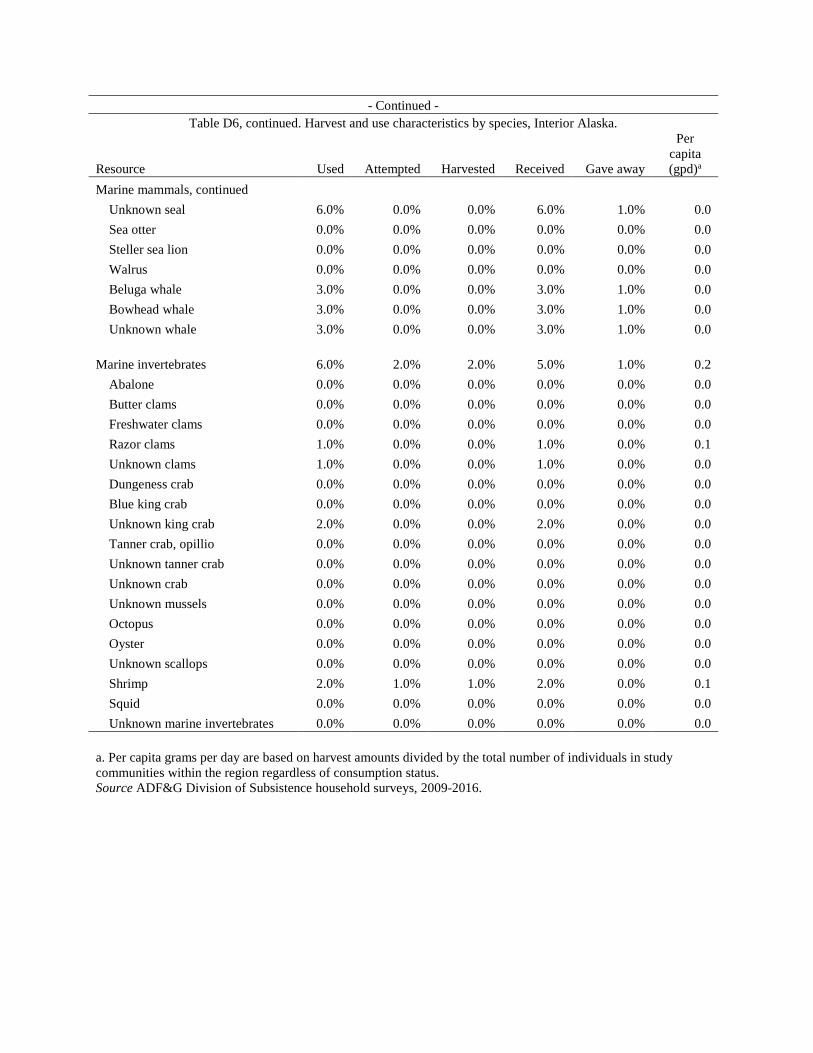
- Continued - Table D6, continued. Harvest and use characteristics by species, Interior Alaska.
Resource Used Attempted Harvested Received Gave away
Per capita (gpd)a
Marine mammals, continued Unknown seal 6.0% 0.0% 0.0% 6.0% 1.0% 0.0 Sea otter 0.0% 0.0% 0.0% 0.0% 0.0% 0.0 Steller sea lion 0.0% 0.0% 0.0% 0.0% 0.0% 0.0 Walrus 0.0% 0.0% 0.0% 0.0% 0.0% 0.0 Beluga whale 3.0% 0.0% 0.0% 3.0% 1.0% 0.0 Bowhead whale 3.0% 0.0% 0.0% 3.0% 1.0% 0.0 Unknown whale 3.0% 0.0% 0.0% 3.0% 1.0% 0.0
Marine invertebrates 6.0% 2.0% 2.0% 5.0% 1.0% 0.2
Abalone 0.0% 0.0% 0.0% 0.0% 0.0% 0.0 Butter clams 0.0% 0.0% 0.0% 0.0% 0.0% 0.0 Freshwater clams 0.0% 0.0% 0.0% 0.0% 0.0% 0.0 Razor clams 1.0% 0.0% 0.0% 1.0% 0.0% 0.1 Unknown clams 1.0% 0.0% 0.0% 1.0% 0.0% 0.0 Dungeness crab 0.0% 0.0% 0.0% 0.0% 0.0% 0.0 Blue king crab 0.0% 0.0% 0.0% 0.0% 0.0% 0.0 Unknown king crab 2.0% 0.0% 0.0% 2.0% 0.0% 0.0 Tanner crab, opillio 0.0% 0.0% 0.0% 0.0% 0.0% 0.0 Unknown tanner crab 0.0% 0.0% 0.0% 0.0% 0.0% 0.0 Unknown crab 0.0% 0.0% 0.0% 0.0% 0.0% 0.0 Unknown mussels 0.0% 0.0% 0.0% 0.0% 0.0% 0.0 Octopus 0.0% 0.0% 0.0% 0.0% 0.0% 0.0 Oyster 0.0% 0.0% 0.0% 0.0% 0.0% 0.0 Unknown scallops 0.0% 0.0% 0.0% 0.0% 0.0% 0.0 Shrimp 2.0% 1.0% 1.0% 2.0% 0.0% 0.1 Squid 0.0% 0.0% 0.0% 0.0% 0.0% 0.0 Unknown marine invertebrates 0.0% 0.0% 0.0% 0.0% 0.0% 0.0
a. Per capita grams per day are based on harvest amounts divided by the total number of individuals in study communities within the region regardless of consumption status. Source ADF&G Division of Subsistence household surveys, 2009-2016.
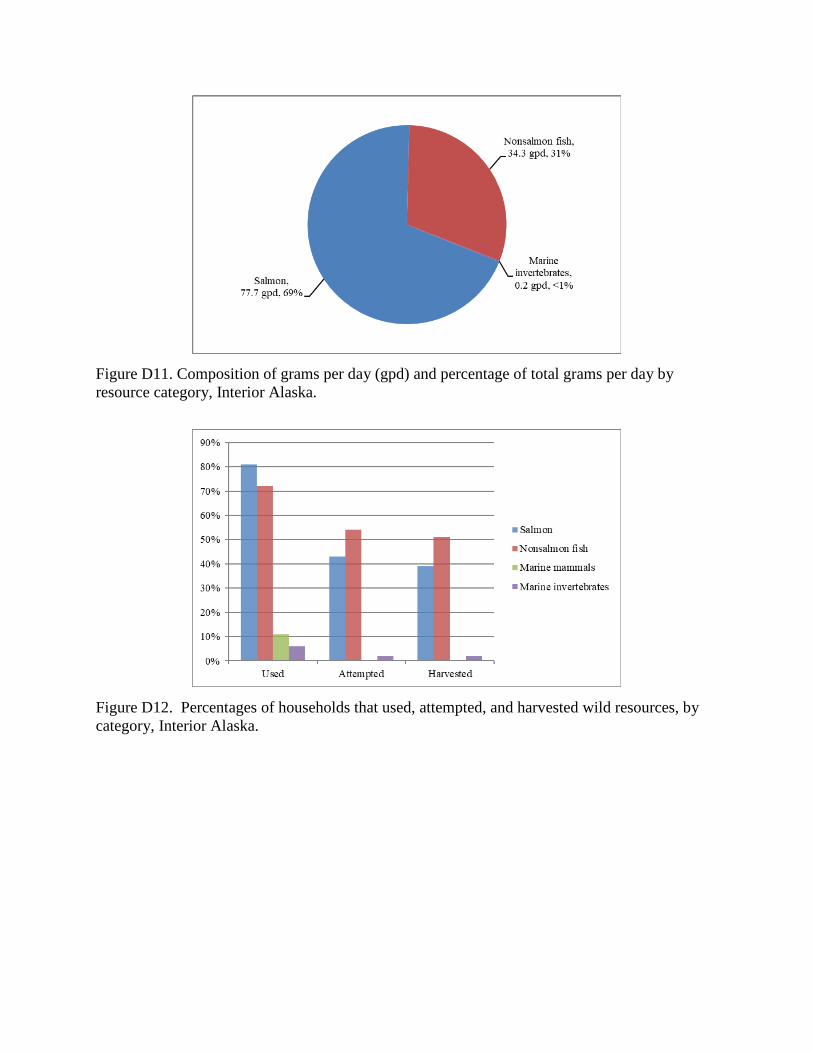
Figure D11. Composition of grams per day (gpd) and percentage of total grams per day by resource category, Interior Alaska.
Figure D12. Percentages of households that used, attempted, and harvested wild resources, by category, Interior Alaska.
ADF&G Appendix E References Alaska Department of Fish and Game (ADF&G). (2016). Subsistence in Alaska: A Year 2014
Update. Division of Subsistence, Alaska Department of Fish and Game, http://www.adfg.alaska.gov/static/home/subsistence/pdfs/subsistence_update_2014.pdf
Fall, JA. (2016). Regional patterns of fish and wildlife harvests in contemporary Alaska.
ARCTIC, 69(1), 47-64. http://dx.doi.org/10.14430/arctic4547 Wolfe, RJ & Utermohle, CJ. (2000). Wild food consumption rate estimates for rural Alaska
populations. Alaska Department of Fish and Game, Division of Subsistence, Technical Paper No. 261
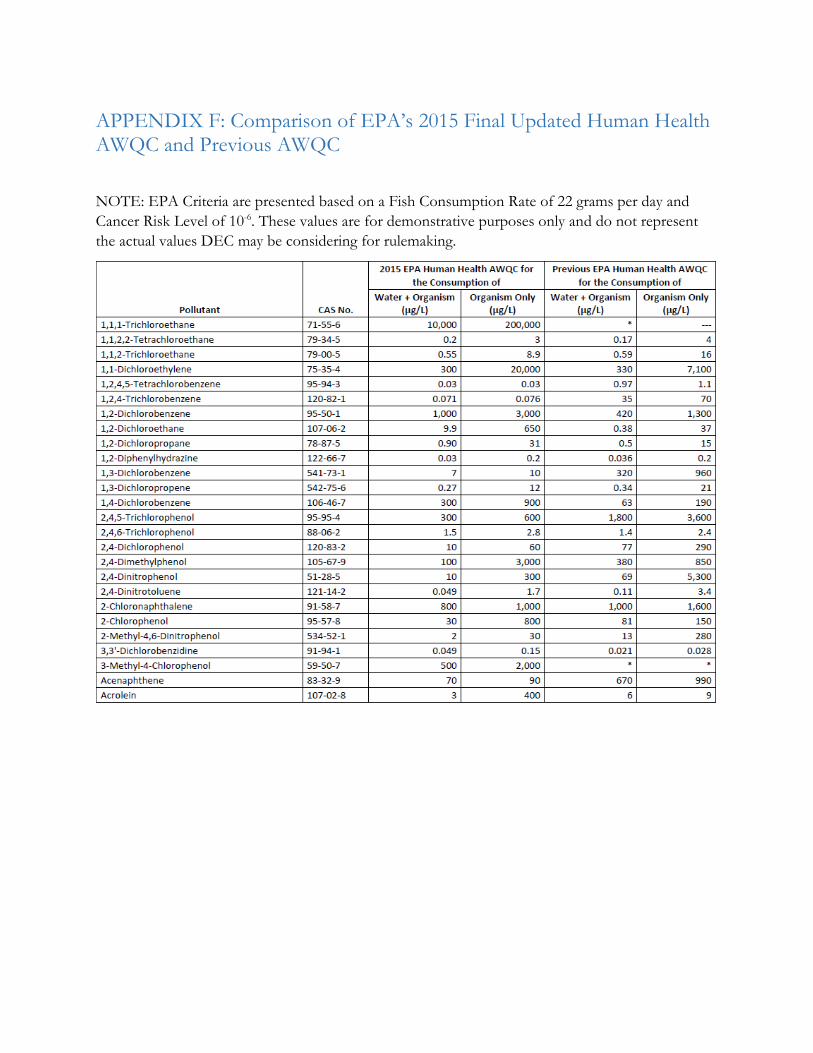
APPENDIX F: Comparison of EPA’s 2015 Final Updated Human Health AWQC and Previous AWQC
NOTE: EPA Criteria are presented based on a Fish Consumption Rate of 22 grams per day and Cancer Risk Level of 10-6. These values are for demonstrative purposes only and do not represent the actual values DEC may be considering for rulemaking.
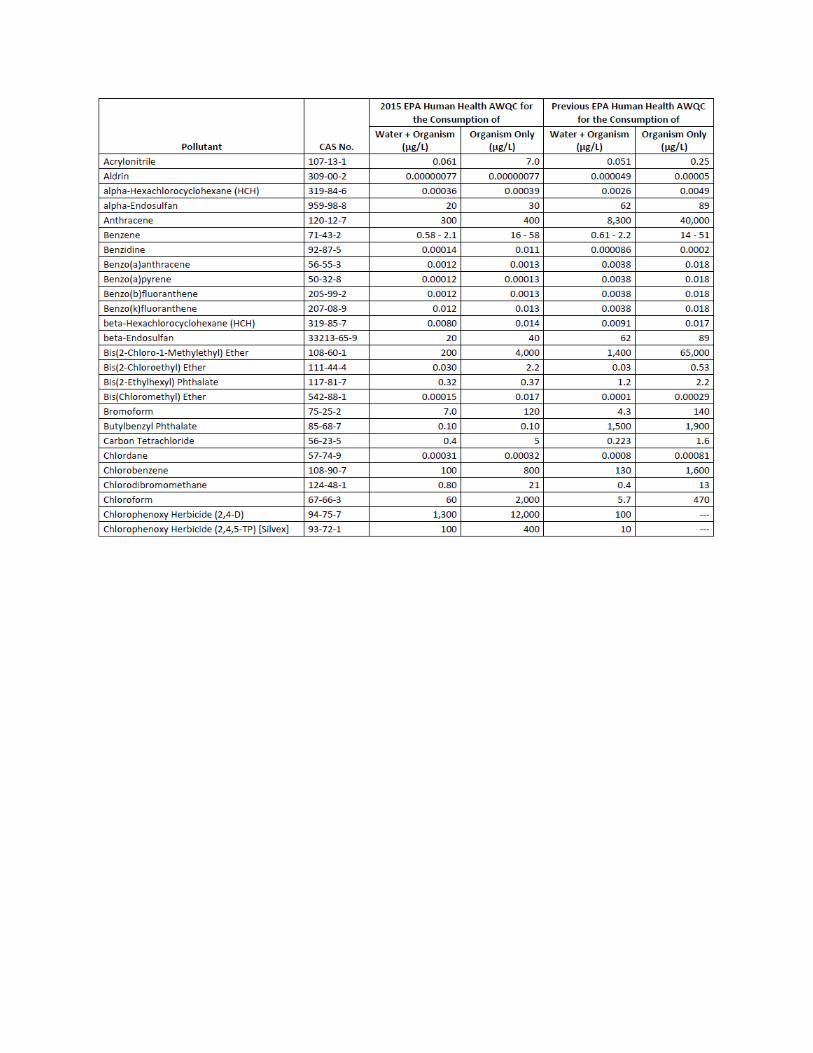
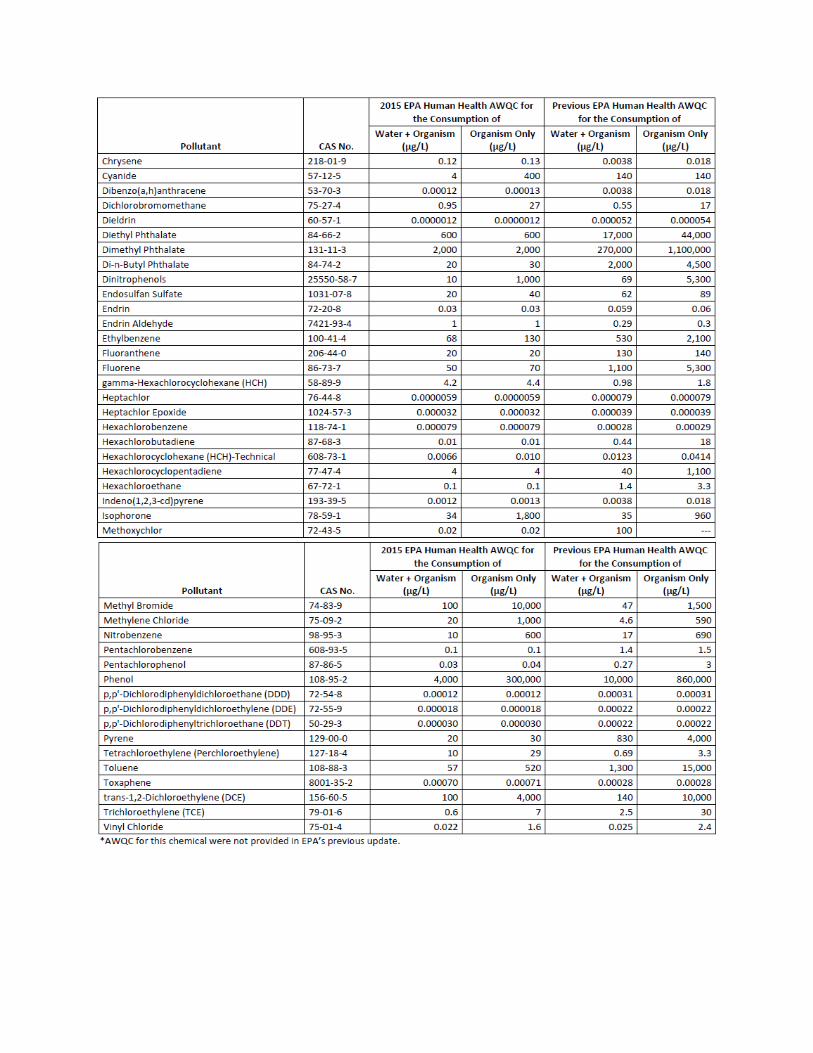
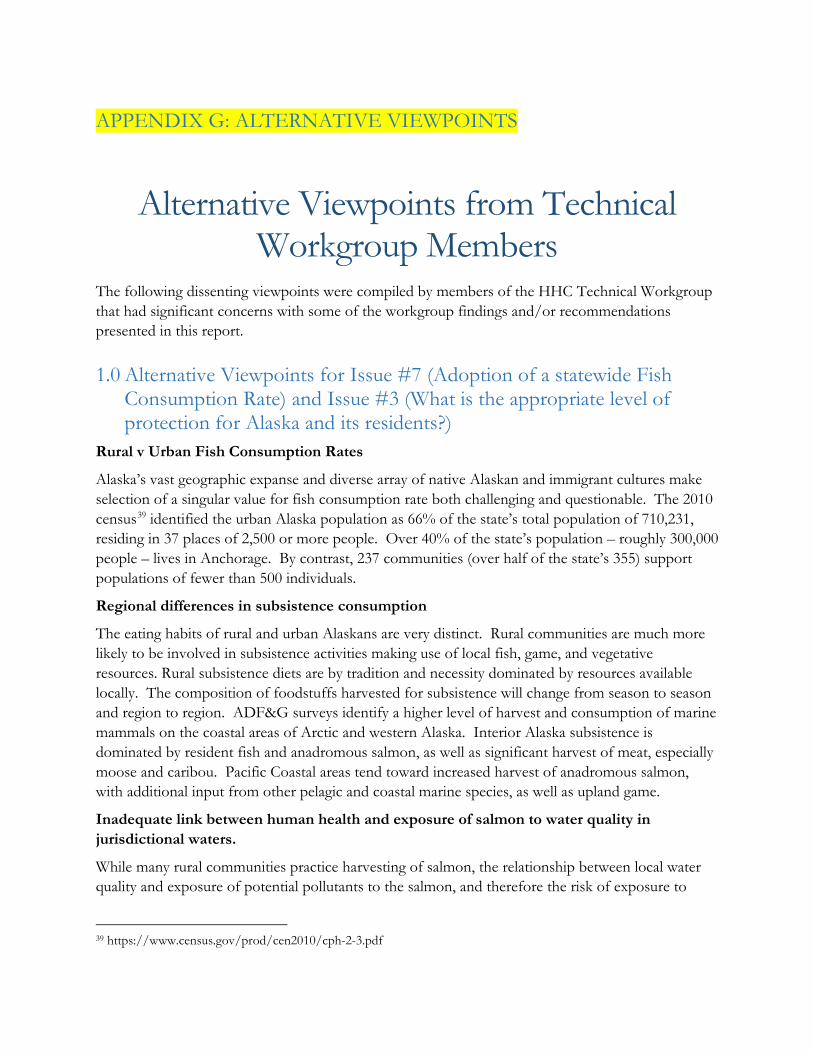
APPENDIX G: ALTERNATIVE VIEWPOINTS
Alternative Viewpoints from Technical
Workgroup Members The following dissenting viewpoints were compiled by members of the HHC Technical Workgroup that had significant concerns with some of the workgroup findings and/or recommendations presented in this report.
1.0 Alternative Viewpoints for Issue #7 (Adoption of a statewide Fish Consumption Rate) and Issue #3 (What is the appropriate level of protection for Alaska and its residents?)
Rural v Urban Fish Consumption Rates
Alaska’s vast geographic expanse and diverse array of native Alaskan and immigrant cultures make selection of a singular value for fish consumption rate both challenging and questionable. The 2010 census39 identified the urban Alaska population as 66% of the state’s total population of 710,231, residing in 37 places of 2,500 or more people. Over 40% of the state’s population – roughly 300,000 people – lives in Anchorage. By contrast, 237 communities (over half of the state’s 355) support populations of fewer than 500 individuals.
Regional differences in subsistence consumption
The eating habits of rural and urban Alaskans are very distinct. Rural communities are much more likely to be involved in subsistence activities making use of local fish, game, and vegetative resources. Rural subsistence diets are by tradition and necessity dominated by resources available locally. The composition of foodstuffs harvested for subsistence will change from season to season and region to region. ADF&G surveys identify a higher level of harvest and consumption of marine mammals on the coastal areas of Arctic and western Alaska. Interior Alaska subsistence is dominated by resident fish and anadromous salmon, as well as significant harvest of meat, especially moose and caribou. Pacific Coastal areas tend toward increased harvest of anadromous salmon, with additional input from other pelagic and coastal marine species, as well as upland game.
Inadequate link between human health and exposure of salmon to water quality in jurisdictional waters.
While many rural communities practice harvesting of salmon, the relationship between local water quality and exposure of potential pollutants to the salmon, and therefore the risk of exposure to
39 https://www.census.gov/prod/cen2010/cph-2-3.pdf
salmon consumers is obscure. Juvenile salmon and smolt will be exposed to fresh waters under the jurisdiction of the Clean Water Act for only a small portion of their lives. A Pacific salmon smolt might grow to, say, 50 grams in fresh water, then leave the watershed only to return 2 to 5 years later with a mass of 1 kilogram to more than 20 kilograms, depending on species. The ratio of mass derived from feeding in jurisdictional waters to total body mass upon return is in the range from 1:20 to as little as 1:400. Even if salmon retained pollutants accumulated from exposure in freshwater early on, after a life at sea that contamination would be overwhelmed by exposure to marine waters and consumption of prey in the marine environment. The link between pollutants found in freshwater salmon habitats and risk of exposure of subsistence salmon users to those pollutants through the pathway of salmon consumption is tenuous, at best. The inability to effectively associate water quality in juvenile salmon habitat with exposure to humans through consumption of adult salmon suggests that the rate of consumption of salmon cannot be meaningful in determining human health risk. Salmon consumption, therefore should NOT be considered as a component of the fish consumption rate in the human health criteria calculations.
2.0 Alternative Viewpoints for Issue #2 (What species should Alaska include to derive a Fish Consumption Rate) and Issue #5 (What is the role of Relative Source Contribution (RSC) and what are Alaska’s options?)
The inclusion of salmon in the Relative Source Contribution (RSC) vs. the Fish Consumption Rate (FCR)
EPA methodology excludes fish and shellfish species designated as marine species from the FCR since, that exposure is addressed by the relative source contribution (RSC). EPA will not consider a relative source contribution above 0.8., so the inclusion of salmon in the fish consumption rate poses a potential “double counting” effect in the RSC.
Salmon constitutes a large portion of Alaskans’ diet, but the inclusion of salmon in the FCR would not provide additional human health protection. The inclusion of salmon, which includes species that may spend a significant portion of the life cycle in non-regulated and international waters, would result in significantly lower HHC. However, the lower HHC would not reduce Alaskan’s exposure to pollutants from consuming fish that spend a significant portion of the life cycle, and therefore take up pollutants, in non-regulated waters. Nor would stricter HHC address the documented risk from the importation of pollutants from non-regulated and international waters, via fish, into jurisdictional waters. Infrastructure and development projects might not be able to meet the HHC, or the costs to do so might be prohibitive, yet Alaskans would remain at risk from pollutants taken up by fish from non-regulated and international waters. The inclusion of salmon in the FCR may present to the public the appearance of reduced risk from pollutants but is unlikely to actually reduce that risk.
Health exposure from pollutants in non-regulated and international waters can only be addressed by source control. The Clean Water Act is not intended to address nor can it reduce pollution and human health risk from pollutants in non-regulated and international waters. Therefore, to ensure that the HHC sufficiently protect Alaskans from exposure to pollutants from fish in jurisdictional
waters and to remain consistent with EPA recommendations, DEC should retain salmon in the relative source contribution. If the State develops statistically robust data on salmon residence time within jurisdictional waters and pollutants exposure and uptake routes, the data may support the inclusion of a weighted fraction of salmon in the FCR, but should resolve the double-counting risk within the relative source contribution.
The state of Washington proposed to include salmon in its FCR and concurrently establish an RSC equal to one. This still attempts to address pollutants in salmon by regulating discharges in jurisdictional waters, but by establishing an RSC of 1, it may reduce the potential over-counting error described above. However, EPA accepted the inclusion of salmon in the FCR, but rejected the proposed RSC value of 1. This ultra-conservative approach limits the state’s ability to establish HHC that effectively protect human health and to support infrastructure and development throughout the state.
The inclusion of salmon in the FCR, as opposed to the RSC, is:
1) inconsistent with EPA’s past recommendations and current approach to deriving national HHC;
2) could result in significantly lower HHC and significantly higher compliance costs without a measureable reduction in risk from pollutants; and
3) could result in “double-counting,” since the RSC already accounts for marine fish species yet salmon would be captured by the FCR as well.
The inclusion of marine mammals in the Fish Consumption Rate (FCR)
HHC are developed to regulate the discharge of pollutants into jurisdictional waters. As previously discussed, marine mammal consumption is significant in some regions but the data on marine mammal life cycle and pollutant uptake in jurisdictional waters is currently inconclusive or unavailable. Including marine mammals in the FCR without sufficient data to support their inclusion may not reduce the risk of human exposure to pollutants in marine mammal tissue and may ignore the importance of source control outside regulated waters. The potential for human exposure to pollutants in marine mammal tissue is an important issue that should be addressed with a systematic approach to identify marine mammal pollutant uptake exposure and control the pollutants at the source. The relative source contribution can addresses the risk for those pollutants known to accumulate in marine mammals (e.g., PCBs). DEC should exclude marine mammals from the FCR unless and until sufficient life cycle and pollutant data are developed to demonstrate the risks within jurisdictional waters.
There are three marine mammal species known to spend all or most of their life in state CWA waters: harbor seals, Cook Inlet beluga whales, and Lake Iliamna seals. These species should be included fully in the FCR, rather than in the RSC. By including them in the FCR, both carcinogenic and non-carcinogenic pollutants would be considered. In the RSC, only non-carcinogenic pollutants are considered. Harbor seals in particular are harvested throughout Alaska’s coastline as subsistence food.
3.0 Alternative Viewpoints Issue #7 (What Are Alaska’s Options for Implementing the Proposed Criteria?)
Implementation
Some of the methods proposed to derive the FCR may result in very low HHC without demonstrating additional protection for human health. This could significantly increase the number of water bodies listed as “impaired,” even if the waters pose no actual human health risk. There are significant challenges and costs to permitting discharges to impaired waters such that projects that require discharges to “impaired” waters could be delayed or prohibited. Without an analysis of which waterbodies would likely become impaired for specific HHC and the associated State and discharger costs required to develop and implement total maximum daily loads, the State cannot reasonably make informed decisions regarding the proposed methods to derive the HHC.
For other (“non-impaired”) waters, the revised HHC will likely pose hurdles to permitting discharges for community infrastructure and industry if the criteria cannot be met. DEC suggested dischargers could use existing implementation tools, such as mixing zones and compliance schedules, to permit discharges. Compliance schedules provide a limited extension to adopt technology to meet the HHC, which can temporarily defer some of the costs to comply but is unlikely to reduce the overall cost. All mixing zones are prohibited in anadromous fish spawning waters, so they provide no benefits in much of Alaska. The revised HHC may make some projects uneconomical and limit community and industrial development. In addition, for the reasons stated above, it is not clear that the additional treatment and associated cost to meet these more stringent HHC derived would provide a reduction in human health risk from consumption of fish caught in fresh water. It is recognized that the state has an obligation to establish HHC based on reasonable assumptions to address human health risk. However, the state has wide discretion in determining how to establish and implement HHC that are protective of human health while at the same time not imposing extremely burdensome and unnecessary costs on industry and public infrastructure. Given the real potential that the methods being considered by the state to derive HHC could lead to prohibitive costs without tangible reductions in risk, the state should conduct a thorough and transparent cost-benefit analysis prior to promulgating draft HHC. Each element/assumption in deriving the criteria should be considered in terms of how it actually minimizes risk The cost-benefit analysis should determine the likely costs of HHC implementation to municipal and industrial dischargers and other affected parties.


