Enabling Carbon Flux Studies at the Regional and Ecosystem Scale
Deborah Agarwal
BWC technical team
16 July 2007

microbesrootswoodleafnetstoragec RRRRPNEEFF 1. Applications of eddy covariance measurements, Part 1: Lecture on Analyzing
and Interpreting CO2 Flux Measurements, Dennis Baldocchi, CarboEurope Summer Course, 2006, Namur, Belgium (http://nature.berkeley.edu/biometlab/lectures/)

Carbon-Climate Analysis GoalsTowers measure consistent carbon flux
and micrometeorological parametersTower researchers quality check data
and then provide the data to regional archives.
Regional and global carbon-climate analysis activities rely on data from regional archives
Recent La Thuile workshop is gathering over 700 site-years of data available from over 200 sites around the world.

Measurements Are Often Not Simple or Complete
Gaps in the data Quiet nightsBird poopHigh winds….
Difficult to make measurementsLeaf area indexWood respirationSoil respiration…
Localized measurements – tower footprintLocal investigator knowledge importantPIs’ science goals are not uniform across the towers

Typical Data Analysis Flow TodayValidate & Quality
Check data
Perform Analysis
Identify Data
Issues & Retrieve Missing
Data
Retrieve Data from
Source
Matlab, Excel, S-Plus, PV-Wave, R, …
Web page, e-mail, web service, phone,Student, Post-doc, Friend, . . .

Target Data Analysis Flow
Scientific
Data Server
Validate &
Quality Check data
Perform
AnalysisIdentif
y Data Issues
& Obtain Missing Data
Obtain Data from
Source
Track versions, results, andprovenance
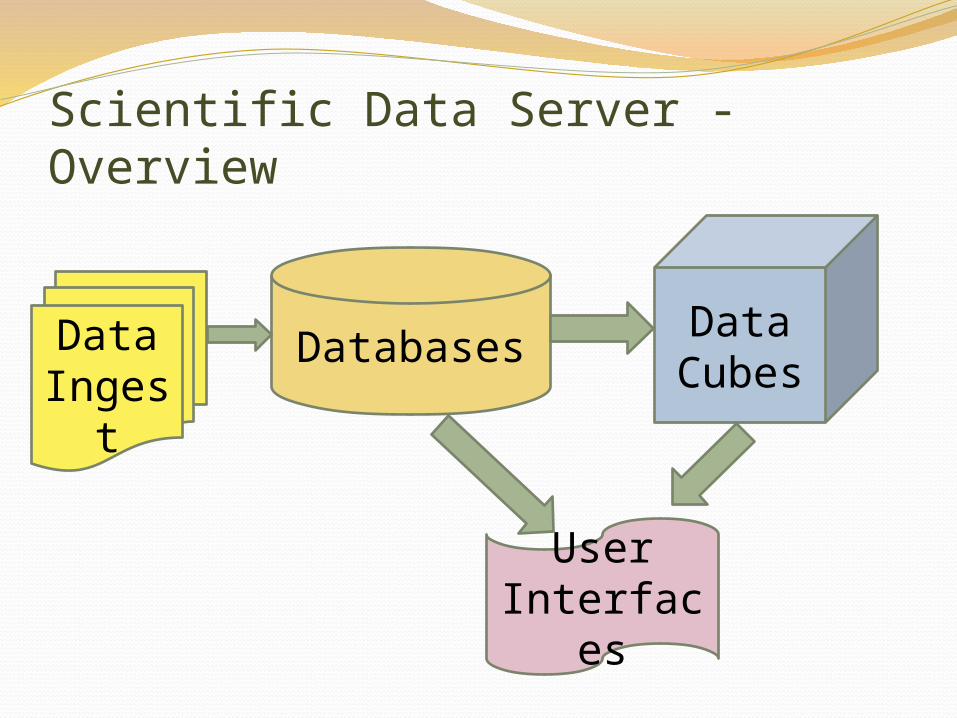
Scientific Data Server - Overview
DatabasesData
Cubes
User Interfaces
Data Ingest

DatabaseAll descriptive metadata and data held
in relational databasesMetadata is important too!
While separate databases are shown, the datasets may actually reside in a single databaseMapping is transparent to the
scientistSeparate databases used for
performanceUnified databases used for simplicity
New metadata and data are staged with a temporary databaseMinimal quality checks appliedAll name and unit conversions
Data may be exported to flat file, copied to a private MyDb database, directly accessed programmatically, or ?
Latest DatasetDatabase
Last Known Good Dataset(s)
Database
Older Dataset(s)Archive
Database
MyDbAnalysis
Database
Staging Database

Data CubesA data cube is a database specifically
for data mining (OLAP)Simple aggregations (sum, min, or
max) can be pre-computed for speedAdditional calculations can be
computed dynamically or pre-computed
Both operate along dimensions such as time, site, or datumtype
Constructed from a relational database
A specialized query language (MDX) is used
Client tool integration is evolvingExcel PivotTables allow simple data
viewingMore powerful analysis and plotting
using Matlab and statistics software

Scientific Data Server – User Interface
ORNL AmerifluxWeb Site
CSV Files
BWC SQL Server Database
Data Cube
Reports, Web Services, Excel Pivot Table and Pivot Chart

Browsing For Data AvailabilitySites Reporting Data Colored by Year
Ameriflux Data Availability : All Data
Bra
zil -
- T
apaj
os (
San
tare
m,K
mB
razi
l --
Tap
ajos
(S
anta
rem
,Km
Can
ada
- B
orea
s 18
50C
anad
a --
BO
RE
AS
NS
A -
193
0 bu
Can
ada
-- B
OR
EA
S N
SA
- 1
963
buC
anad
a --
BO
RE
AS
NS
A -
198
1 bu
Can
ada
-- B
OR
EA
S N
SA
- 1
989
buC
anad
a --
BO
RE
AS
NS
A -
199
8 bu
Can
ada
-- B
OR
EA
S N
SA
- O
ld B
laC
anad
a --
Brit
ish
Col
., C
ampb
eC
anad
a --
Let
hbrid
geU
SA
--
AK
Atq
asuk
, A
lask
aU
SA
--
AK
Bar
row
, A
lask
aU
SA
--
AK
Hap
py V
alle
y, A
lask
aU
SA
--
AK
Upa
d, A
lask
aU
SA
--
AZ
Aud
ubon
Res
earc
h R
anU
SA
--
CA
Blo
dget
t F
ores
t, C
alU
SA
--
CA
Sky
Oak
s, O
ld S
tand
,U
SA
--
CA
Sky
Oak
s, Y
oung
Sta
nU
SA
--
CA
Ton
zi R
anch
, C
alifo
rU
SA
--
CA
Vai
ra R
anch
, Io
ne,
CU
SA
--
CO
Niw
ot R
idge
For
est,
U
SA
--
CT
Gre
at M
ount
ain
For
esU
SA
--
FL
Flo
rida-
Ken
nedy
Spa
cU
SA
--
FL
Flo
rida-
Ken
nedy
Spa
cU
SA
--
FL
Sla
shpi
ne-A
ustin
Car
US
A -
- F
L S
lash
pine
-Don
alds
on,
US
A -
- F
L S
lash
pine
-Miz
e,cl
ear
US
A -
- F
L S
lash
pine
-Ray
onie
r,m
US
A -
- IL
Bon
dvill
e, I
llino
isU
SA
--
IN M
orga
n M
onro
e S
tate
U
SA
--
KS
Wal
nut
Riv
er W
ater
shU
SA
--
MA
Har
vard
For
est
EM
S T
US
A -
- M
A H
arva
rd F
ores
t he
mlo
US
A -
- M
A L
ittle
Pro
spec
t H
illU
SA
--
ME
How
land
For
est
(mai
nU
SA
--
MI
Syl
vani
a W
ilder
ness
U
SA
--
MI
Uni
v. o
f M
ich.
Bio
loU
SA
--
MO
Mis
sour
i Oza
rk S
iteU
SA
--
MS
Goo
dwin
Cre
ek,
Mis
siU
SA
--
MT
For
t P
eck,
Mon
tana
US
A -
- N
C D
uke
For
est
- lo
blol
US
A -
- N
C D
uke
For
est-
hard
woo
dU
SA
--
NE
Mea
d -
irrig
ated
con
US
A -
- N
E M
ead
- irr
igat
ed m
aiU
SA
--
NE
Mea
d -
rain
fed
mai
zeU
SA
--
OK
Litt
le W
ashi
ta W
ater
US
A -
- O
K P
onca
City
, O
klah
oma
US
A -
- O
K S
hidl
er,
Okl
ahom
aU
SA
--
OK
Sou
ther
n G
reat
Pla
inU
SA
--
OR
Met
oliu
s-fir
st y
oung
US
A -
- O
R M
etol
ius-
inte
rmed
iat
US
A -
- O
R M
etol
ius-
old
aged
po
US
A -
- S
D B
lack
Hill
s, S
outh
DU
SA
--
SD
Bro
okin
gs,
Sou
th D
akU
SA
--
TN
Wal
ker
Bra
nch
Wat
ers
US
A -
- W
A W
ind
Riv
er C
rane
Sit
US
A -
- W
I Lo
st C
reek
, W
isco
nsi
US
A -
- W
I P
ark
Fal
ls/W
LEF
, W
isU
SA
--
WI
Will
ow C
reek
, W
isco
nU
SA
--
WV
Can
aan
Val
ley,
Wes
t
2006
2005
2004
2003
2002
2001
2000
1999
1998
1997
1996
1995
1994
1993
1992
1991

Required variable reporting by site by year Each row corresponds to one site-
year Each cell corresponds to one site
year of (FC, CO2 or SCO2, UST, PAR or Rg, TA, and Rh or H2O).
Color indicates: Red – likely not enough for
processing - % < .3 reported (roughly less than 5K of 17.5K)
Green – likely not enough for processing .3<%<.999
Yellow – may not be good for processing due to gap-filling - % > .999
Red CO2 (second column) can be ignored for cropland/grassland sites
Sites shown are just a sampleOf the 285 site years with good FC, 50 site years are missing one of (UST, PAR/Rg, and TA) and 79 sites have likely gap-filled data.

Obviously bad annual averages
Data cube used to browse average yearly Rg values across all site-years16 additional likely problematic site-years at 5 sites

Drill down to consistent (bad) daily values
Data cube used to browse 2005 Rg values shows consistently high reporting (not just a few very large spikes) at Duke Forest sites

Drill down to Mead sites
Daily average FC at each site shows likely units and/or sign issues

Simple check: the same FC value reported too often
Database query returns count by (site, year, value) where count >= 500
Graph shows sum of (returned counts) by site and year
Sites with high sums likely report very few unique FC values

Project StatusAmeriflux data
• ~145 million daily values in cube• Advanced calculations and statistics in cube• Methods of providing ½ hourly data access efficiently• Data quality assessment• Collection and incorporation of biological data
Fluxnet data• ~210 million daily values in cube• Waiting on gap filling and quality checking operations• Data server, cubes, and reports will likely be the primary repository
and access for researchers using the data
Russian River Data• ~23 million values in cube• Integration with Matlab and GIS • Additional of data from other sources (fish, sediment size, …)

On-going and Future Challenges
•Versioning of data and collection of data provenance•Improved performance of database and cube•Handling of biological data•Advanced plotting capabilities•Integration of collaborative tools•Automation of data ingest, cube building, and report building•MyDB and MyCube capabilities•Integration of workflow capabilities•Data server in a box•Sociological change

Summary•Ameriflux collaboration is adopting the Data Server architecture for the data repository•BWC Data Server will be hosting the Fluxnet dataset which is expected to be the foundation for a broad range of research investigations•Ecological measurements are often “messy”•Applying the Data Server to watersheds introduces many additional challenges
AcknowledgementsBerkeley Water Center, University of California, Berkeley, Lawrence Berkeley Laboratory
Jim HuntMatt RodriguezMonte GoodRebecca Leonardson (student)Carolyn RemickSusan HubbardYoram Rubin
MicrosoftCatharine van IngenJayant Gupchup (student)Nolan Li (student)Tony HeyDan FayStuart OzerSQL product teamJim Gray
Ameriflux CollaborationDennis BaldocchiBeverly LawTara Stiefl (student)Youngryel Ryu (postdoc)Gretchen Miller (student)Mattias Falk Tom BodenBob Cook
CarboEurope CollaborationDario PapaleMarkus Reichstein
*Project funded by Microsoft


