1
Debate Brief | Capital Gains Tax
February, 2018
Resolved: The United States should abolish the capital gains tax.
“I have no disposition to tax wealth unnecessarily or unjustly, but I do believe that the wealth of
the country should bear its just share of the burden of taxation and that it should not be permitted
to shirk that duty.” -Congressman Cordell Hull, 1909, Father of modern taxation
“The collection of any taxes which are not absolutely required, which do not beyond reasonable
doubt contribute to the public welfare, is only a species of legalized larceny.” - President Calvin
Coolidge, 1925 Inaugural Address
"Any man of energy and initiative in this country can get what he wants out of life," he wrote. "But
when initiative is crippled by legislation or by a tax system which denies him the right to receive a
reasonable share of his earnings, then he will no longer exert himself and the country will be
deprived of the energy on which its continued greatness depends.”--Andrew Mellon, Treasury
Secretary in the 1920s
“A capital tax is the most appropriate response to the inequality “R” [returns from capital
investment] > “G” [general economic growth]...” -Economist Thomas Piketty
2
KEY TERMS
Asset - An asset is something that holds value. An asset could be a stock, a home, a factory, a car
-- anything that has value can be considered an asset.
Capital - Within the context of the capital gains tax, capital mostly refers to stocks and other
financial assets, but within the study of economics capital is much more broadly defined as an
asset that produces surplus value when put to productive use.
Capital gain - A capital gain is the profit one makes when he or she sells a stock, a bond, a
home, or another asset. For instance, if you bought a stock for $100 and the stock increased in
value to $150 over the year, then your capital gain on the stock would $50 ($150 - $100 = $50).
Compounding - Compound returns are returns calculated on the initial “base” of an investment
and also on the accumulated returns from previous periods. An example is helpful in
understanding compounding. Imagine you invest $100 in year 1 and your investment increases in
value by 5% ($5). If you add the $5 to your initial investment of $100, then the base of the
investment grows from $100 to $105. In year two, you again make a return of 5%, but this time
the 5% return is calculated from a base of $105 rather than $100. This makes your return greater
- $5.25 in year two. While this may not seem like a large increase, in each subsequent year
returns become greater and greater as they continue pulling from a larger and larger base.
Rule of 72 - The Rule of 72 is a simple way to determine how long an investment will take to
double in value - assuming that the investment is making the same rate of return each year. The
Rule of 72 is calculated by taking 72 and dividing it by the rate of return (with the rate of return
expressed as a whole number rather than a percent or decimal). Using the same example from
above of a $100 investment with a 5% rate of return, we can see that the $100 will double in
value to $200 after approximately 14.4 years (72 divided by 5 = 14.4). A investment with a
10% return doubles in about 7 Years. An investment with a 2% return doubles in about 36
years.
Tax - A tax is a payment an individual or company is required to pay to the government. The
most obvious reason taxes exist is that they provide revenue to the government. After all, the
government needs funds to carry out its duties. However, taxes have the unintended consequence
of reducing the incentive for an individual to sell whatever it is that is being taxed because the
tax reduces the profit from sale.
“Levy a tax” - Impose and collect a tax on a person, or group of people.

3
Realized Capital Gain: - A realized capital gain refers to an asset that was sold for more than
what was paid for it. Capital gains taxes are only levied when assets are sold.
Unrealized Capital Gain: - An unrealized capital gain refers to an asset that has increased in
value since its purchase but has not yet been sold. Thus, unrealized capital gains are not paid
until the asset at issue is sold.
Lock-in effect - Because the capital gains tax is only levied when capital gains are realized, the
tax creates an incentive for investors to hold onto their assets rather than sell them. This creates a
“lock-in” effect on capital -- money doesn’t flow as it should to good projects or from
suboptimal projects.
Short-Term Capital Gain - Short-term capital gains are (generally) capital gains that are
realized less than one year after the date of their purchase. Short-term capital gains are taxed at a
higher rate than capital gains that are held for more than a year (long-term capital gains).
Long-Term Capital Gain - Long-term capital gains are capital gains that are realized after more
than one year from their purchase date. Long-term capital gains are taxed at a lower rate than
short-term capital gains.
Income - Income refers to money earned by a person or business. There is a long standing debate
as to whether capital gains should be taxed just as ordinary income or whether they should be
taxed separately. Currently, short-term capital gains are taxed at the same rate as income and
long-term capital gains are taxed at a different, lower rate.
Stocks - Stocks are shares in of a company. When a company issues stocks they are issuing a
claim on part of the company’s assets and earnings. People invest in the stocks of companies that
they expect to have future success. Companies issue stocks in order to raise money, which they
then use to invest in and expand their business. The price of a stock is tied to the the anticipated
future earnings of the company. When a stock increases in value, the increase is considered a
capital gain. Stocks are sometimes called “equity” or “shares.”
INTRODUCTION AND BACKGROUND
In America we have different taxes on income (“labor” or “work”) and taxes on capital. When
you earn $100 from your job, that is income. When you make money from selling a house, a
stock, or a bond, that is a gain in your capital. That gain can be taxed.

4
While the phrase “capital-gains tax” might sound rather intimidating, the capital-gains tax is
really quite simple. A “capital gain” occurs when you buy something and then sell it for profit.
The “something” that you are buying or selling is called an “asset.” The “capital gain” is the
difference between the price you paid for the asset and the price at which you sold the asset. If
you buy an antique car for $100,000 and then sell it for $120,000 three years later, then your
capital gain on the car would be $20,000 ($120,000 - $100,000). The capital-gains tax is not
applied to the full value of the asset. You do not pay tax on the whole $120,000. The tax is
applied only to the increase in value of the asset, $20,000. If you can sell the car only for less
than your purchase price $100,000 that is a “capital loss.” Capital losses are treated differently --
a subject for another day.
Capital-gains taxes are only collected when an asset is sold and a gain is “realized.” You will
often see the phrases “realized” and “unrealized” capital gains. A capital gain is realized when
the asset is sold. A capital gain is unrealized when the asset has increased in value since its
purchase, but has not yet been sold. For instance, in the car example, before the car is sold for
$120,000 the increase of $20,000 in value is considered an unrealized capital gain, but after the
car is sold that $20,000 is considered a realized capital gain. If you decide not to sell the car,
even though it had increased in value by $20,000, the government will not make you pay tax.
That gives you a basic idea of how the capital gains tax is levied, but how much is the capital
gains tax? That question is bit more complicated. Like the income tax, the capital gains tax is
progressive, meaning citizens earning higher incomes are taxed at higher rates than citizens
earning lower incomes. Capital gains can either be “short-term” or “long-term.” Short-term
capital gains (when you buy and sell within a year) are taxed as income is. Long-term capital-
gains rates are usually applied to assets held for more than a year (there are exceptions).
Currently the long-term capital gains rate for lower earners is 0% --no tax. The tax is 15% for
middle earners, and 20% for the wealthy. On top of that 20% is a 3.8% surtax, imposed
beginning in 2013 to help fund provisions of the Affordable Care Act. So the actual top rate is
23.8%. The long-term rate is determined by the taxpayer’s own income level rather than the
value of the capital gain itself. Regarding the specific tax brackets and rates for both short-term
and long-term capital gains, please see Appendix A.
The capital gains tax has changed quite a bit over the years. It’s been a hot political topic. The
breakdown isn’t always what you’d expect. President Clinton joined Congress in lowering the
capital gains tax, on the theory that America needed to unburden business. President Reagan
signed off on both a capital-gains rate cut (1981) AND an increase (1986).
When considering whether to alter the capital gains tax it is useful to look at times in history
when it was changed and observe the impact of the change. See Appendix B for a list of capital
gains rates, positive realized capital gains, taxes paid on positive capital gains, and realized

5
capital gains as a percent of GDP from 1954 to 2014. Looking at capital gains rates between
countries can also be informative. Compared with other countries in the Organization for
Economic Co-Operation and Development (OECD), the United States imposes a relatively high
capital gains rate. In 2015 America’s top capital gains tax rate was the sixth highest out of the 28
OECD countries.1 For specific country data see Appendix C.
Finally, it is important to note that the capital gains tax is different from other taxes such as the
income tax and the corporate tax. When a company earns profits from its operations, those
profits are subject to the corporate tax, not the capital gains tax.
1 Pomerleau, Kyle. “U.S. Taxpayers Face the 6th Highest Top Marginal Capital Gains Tax Rate in the OECD.” Tax
Foundation, 16 Jan. 2017, taxfoundation.org/us-taxpayers-face-6th-highest-top-marginal-capital-gains-tax-rate-
oecd/.

6
AFFIRMATIVE ARGUMENTS
1. The capital gains tax should be abolished because the tax discourages investment. There
are several reasons discouraging investment hurts Americans and the U.S. economy. In
fact, lack of investment dooms our future, including the future of poor people and strivers.
a. Investment creates new companies, which create jobs. When the capital gains tax is
levied on a return on investment, the dollar amount of the return is reduced. This reduces
the incentive to invest at all. A society that discourages its members from investing
jeopardizes its future economic growth-- and, again, jobs for all.
A 2002 report from the Congressional Budget Office makes the case that reducing taxes
on capital benefits the entire economy:
In general, there is significant consensus that broad-based reductions in taxes on
capital have the potential to boost economic growth over the long run. Reductions
in capital taxation increase the return on investment and therefore the formation
of capital. The resulting increase in the capital stock yields greater output and
higher incomes throughout much of the economy.2
b. Americans need to save more, everyone agrees. The government-run pension
program, Social Security, does not have enough money to fund the retirement obligations
it will owe younger workers in the future. Yet Americans don’t save for themselves. At
3.4%, the personal saving rate for 2017 was nearly the lowest it has ever been since
1960 (it was lower in 2005, 2006, and 2007).3 Abolishing the capital gains tax would
encourage more Americans to save for the future through investment.
c. America’s capital gains rate is not competitive. America’s top capital gains rate is
higher than that of many other developed countries, including major economies like the
U.K., Germany, Japan, Israel, Canada and Switzerland. Switzerland, in fact, does not tax
capital gains at all. Recently the U.S. corporate tax was lowered significantly in the name
of competitiveness. The capital gains tax should be eliminated to gain a competitive
advantage and help boost U.S. markets.
2. The capital gains tax erodes the benefits of compounding. Albert Einstein purportedly once
said that “compound interest is the eighth wonder of the world.” The “Rule of 72” helps
2 Woodward, G. Thomas, Congressional Budget Office, “Capital Gains Taxes and Federal Revenues,” 9 Oct 2002,
https://www.cbo.gov/sites/default/files/107th-congress-2001-2002/reports/taxbrief2.pdf. 3 “Personal Saving Rate.” FRED, 29 Jan. 2018, fred.stlouisfed.org/series/PSAVERT.

7
illustrates why. This “Rule” is a common calculation used to quickly estimate the approximate
amount of time it takes for the value of an investment to double. To calculate, you simply divide
72 by the rate of return (percent earned each year) on the investment.
The “Rule of 72” also helps illuminate the harm of the capital gains tax. Imagine someone
invests $10,000 and each year the investment makes a 5% return. While in the first year the 5%
return is not a huge amount - only $500. That $500 is added to the original $10,000. In year two,
the annual 5% return is calculated from the base of $10,500, rather than $10,000, for return of
$525.00, which brings the base up to $11,525.00. As the base grows each year, so do the yearly
returns because they are drawing from a larger base. From the “Rule of 72,” we know that in
14.4 years the investment's value will double.
Now let’s examine how the the capital gains tax impacts compounding via the Rule of 72. The
capital gains tax erodes compounding returns when an investor sells one asset in order to buy a
new one. Let’s say in year one the investor thinks the current investment is not going to hit the
5% annual rate of return the investor is aiming for and wants to shift the money to a more
profitable investment which will make 5%. To do this, the investor sells the original asset, which
is now worth $10,500, and revinests it in the new asset. Through the sale, the investor realizes a
capital gain of $500 (the sale amount, $10,500, minus the original $10,000.00). That $500 gain
is taxed. The tax cuts into the base of the investment, reducing all of its future returns.
While the tax collected in any given year may not seem like a large amount, over time when
investors are frequently selling and reinvesting their assets, the reduction in value to the base of
the asset becomes huge.
Consider the following chart which tracks the value of the $10,000 investment over the 18-year
period. To keep things simple, we assume that each year the investment has a 5% realized
capital gain and a 20% capital-gains tax is levied on the realized gain.
Year
Value without
Tax
Value If Tax is
Paid
Amount of
Investor’s Loss
0 $10,000.00
1 $10,500.00 $10,400.00 -$100.00
2 $11,025.00 $10,816.00 -$209.00
3 $11,576.25 $11,248.64 -$327.61
4 $12,155.06 $11,698.59 -$456.48
5 $12,762.82 $12,166.53 -$596.29
6 $13,400.96 $12,653.19 -$747.77
7 $14,071.00 $13,159.32 -$911.69

8
8 $14,774.55 $13,685.69 -$1,088.86
9 $15,513.28 $14,233.12 -$1,280.16
10 $16,288.95 $14,802.44 -$1,486.50
11 $17,103.39 $15,394.54 -$1,708.85
12 $17,958.56 $16,010.32 -$1,948.24
13 $18,856.49 $16,650.74 -$2,205.76
14 $19,799.32 $17,316.76 -$2,482.55
15 $20,789.28 $18,009.44 -$2,779.85
16 $21,828.75 $18,729.81 -$3,098.93
17 $22,920.18 $19,479.00 -$3,441.18
18 $24,066.19 $20,258.17 -$3,808.03
SOURCE: Author calculations
Notice that while in any given year the amount of tax that is levied is relatively small, over time
the total value of the asset is dramatically impacted due to the tax eroding the base each year -
restricting its future ability to grow. $100 taken from asset’s $10,500 base in year one means that
in every following year the 5% return on the investment will always be less. This means that a
tax levied even just once, will continue to exert a tax burden on the asset every time the
asset makes a return - forever. This in itself compounds over the years. Notice that while the
“Rule of 72” calculates that the value of the asset in this example should double in 14.4 years,
the capital gains tax makes it so it takes between 17 and 18 years to double.
3. The capital gains tax creates a lock-in effect which negatively skews investment decisions
and capital allocation. The lock in effect can make the stock market “depressed” and prevent
growth in prices. For the economy to grow fastest, investors need to place their money in the best
investments. However, the capital gains tax “locks-in” existing investments. This means that the
tax incentivizes investors to hold onto an asset. The investor does not want to sell an asset
because doing so would make their capital gain subject to the tax. So rather than sell their asset
and reinvest the money in another potentially better and more worthy investment, investors often
hold on to an underperforming investment to avoid (or delay) having to pay the capital gains tax.
New innovations and startup companies are essential for economic growth, but they need
investment in order to get off the ground and thrive. When investors are locked-in to their
existing investments, they are less able to invest in these new firms. Capital should be allowed to
follow the best investments. When it doesn’t, that hurts everyone.

9
How big is the impact of the lock-in effect? One way to check its magnitude is by looking at
what has happened historically when the capital gains tax is high. From the late 1960s until the
1980s, the capital gains tax was high. Good companies that needed new investment didn’t get
that investment. Bad companies had the cash. Today we always assume the stock market will go
up in a year or two. But between 1966 and 1982, the stock market stayed in the same place -- for
half a generation, the Dow Jones Industrial Average, a big market measure, stayed at 1000 or
lower. What a contrast to today. You can argue that a flat market can be good because the market
avoids going too high -- a bubble. But the effect was dramatic.
When the capital gains tax is low, there is another effect. After all, a lower capital gains tax rate
provides a strong incentive for investors to sell investments they had been holding on to
previously to avoid paying the capital gains tax. The chart below highlights a 10-year period
from 1977 to 1987. In 1978, Congress passed a law that reduced the capital gains tax by close to
half. All of a sudden, people started selling existing assets and reinvesting in new ones, and soon
enough, the stock market went up. The Dow Jones Industrial Average, which had stayed flat for
so long around the 1000 level, rose to 5,000.
Year
Maximum Tax Rate on
Long-Term Capital
Gains Realized Capital Gains
1977 39.875%* $45.3 billion
1978 39.875%/33.85%** $50.5 billion
1979 28% $73.4 billion
1980 28% $74.1 billion
1981 28%/20% $80.9 billion
1982 20% $90.2 billion
1983 20% $122.8 billion
1984 20% $140.5 billion
1985 20% $172.0 billion
1986 20% $327.7 billion
1987 28% $148.4 billion
SOURCE: U.S Treasury; Tax Policy Center4
4 U.S. Department of the Treasury, Office of Tax Analysis, “Taxes Paid on Capital Gains for Returns with Positive
Net Capital Gains, 1954-2014,” 20 Dec 2016, https://www.treasury.gov/resource-center/tax-policy/tax-
analysis/Documents/Taxes-Paid-on-Capital-Gains-for-Returns-with-Positive-Net-Capital-Gains.pdf; Tax Policy

10
* The effective, or actual, share of tax paid on the last dollar of capital gains was closer to 50% in
reality, because of the interactions with other taxes.
**Indicates that the maximum long-term capital gains rate changed mid-year.
As you can see from the graph, each time the capital gains tax was reduced there was more
economic activity. The opposite happened in 1986-87, when Ronald Reagan and Congress
increased the capital gains tax rate. In 1986, anticipating the coming capital gains tax rate hike,
investors realized their capital gains at nearly twice the rate as the year before (realized capital
gains in 1986 totaled $327.7 billion compared to $172 billion in 1985). That is to say they sold
their investments before the tax rate went up. The next year, 1987, with the higher capital gains
tax rate now in place, realized gains were reduced sharply to only $148.4 billion.5
4. The capital gains tax does not generate much revenue. In 2014, federal revenues from the
capital gains tax totaled around $139 billion.6 While that may sound like a lot of money, relative
to the size of the federal budget it is a very small amount. Indeed, in 2014, revenues from the
capital gains tax accounted for only around 4.6% of total federal revenues.7 It is true that
capital gains tax revenues fluctuate from year to year. Even so, reviewing data for the period
from the mid-1970s to 2000, shows that revenues from the capital gains tax are generally less
than 10% of total federal revenues.8
If the capital gains tax is not generating much revenue to begin with, abolishing it will have a
relatively small fiscal impact on the federal government. In light of all the negative consequences
associated with the capital gains tax, a small reduction in federal revenue is a beneficial trade off
to avoid the economic harm it causes.
NEGATIVE ARGUMENTS
1. Inequality is America’s biggest problem. The capital gains tax combats inequality.
According to data from the United States Census Bureau, 51.5% of all household income is held
by the top 20% of households. Even more striking: 22.6% of household wealth is held by the top
5% of households.9 Compared to the other 28 countries in the OECD, the United States has the
Center, “Historical Capital Gains and Taxes: 1954 to 2014,” 4 May 2017,
http://www.taxpolicycenter.org/statistics/historical-capital-gains-and-taxes. 5 Ibid.
6 U.S. Department of the Treasury, Office of Tax Analysis, “Taxes Paid on Capital Gains for Returns with Positive
Net Capital Gains, 1954-2014,” 20 Dec 2016, https://www.treasury.gov/resource-center/tax-policy/tax-
analysis/Documents/Taxes-Paid-on-Capital-Gains-for-Returns-with-Positive-Net-Capital-Gains.pdf. 7 Author’s calculations. Data from U.S. Treasury and Office of Management and Budget, Table 2.1, “Receipts by
Source: 1934-2021,”: https://obamawhitehouse.archives.gov/omb/budget/Historicals. 8 Woodward, G. Thomas, Congressional Budget Office, “Capital Gains Taxes and Federal Revenues,” 9 Oct 2002,
https://www.cbo.gov/sites/default/files/107th-congress-2001-2002/reports/taxbrief2.pdf. 9 U.S. Census Bureau, Table H-2, “Aggregate Income Received by Each Fifth and Top 5 Percent of Households, All
Races,” https://www.census.gov/data/tables/time-series/demo/income-poverty/historical-income-households.html.

11
fourth most unequal income distribution. The only more unequal OECD countries are Mexico,
Chile, and Turkey.10
Clearly, inequality is a problem in America.
The capital gains tax helps combat inequality. Recent polling by Gallup finds that only around
54% of U.S. adults have money invested in the stock market.11
Those who do own stock are likely to
be wealthy already. Economist Edward N. Wolff of New York University finds that in 2016, the
wealthiest 10% of families in the U.S. “as a group accounted for about 85 to 90 percent of stock
shares, bonds, trusts, and business equity.”12
Given this data, it is not surprising that income from capital gains disproportionately goes to the
wealthiest in U.S. Data from the U.S. Treasury show that the top 10% of households receive
a full 78.4% of all income derived from capital. Meanwhile, the bottom 50% of households
receive a measly 2.4% of all income from capital gains.13
Given that capital income accounts
for more than a third of the total cash income of the top 10% of households, the capital gains tax
is an important policy tool that helps reduce inequality in the United States.
Distribution of Income by Source, 2017
Family Cash
Income Decile Total Capital Income
Share of Total Capital
Income
0 to 10 $4.1 billion 0.15%
10 to 20 $8.0 billion 0.29%
20 to 30 $9.1 billion 0.33%
30 to 40 $15.7 billion 0.56%
40 to 50 $30.6 billion 1.09%
50 to 60 $54.6 billion 1.95%
60 to 70 $89.2 billion 3.19%
70 to 80 $145.7 billion 5.21%
80 to 90 $248.1 billion 8.87%
10
Organisation for Cooperation and Development, OECD Income Distribution Database, “Table 1. Key Indicators
on the distribution of household disposable income and Poverty, 2007, 2014, and 2015 or most recent year,”
http://www.oecd.org/social/income-distribution-database.htm. 11
Gallup, “U.S. Stock Ownership Down Among All but Older, Higher-Income,” 24 May 2017,
http://news.gallup.com/poll/211052/stock-ownership-down-among-older-higher-income.aspx. 12
Wolff, Edward N., National Bureau of Economic Research, Working Paper 24085: “Household Wealth Trends in
the United States, 1962 to 2016: Has Middle Class Wealth Recovered?,” http://www.nber.org/papers/w24085. 13
U.S. Treasury, Distribution Table 2017 002, “Distribution of Income by Source,”
https://www.treasury.gov/resource-center/tax-policy/tax-analysis/Documents/Distribution-of-Income-by-Source-
2017.pdf.

12
90 to 100 $2.19 trillion 78.36%
Total $2.797 trillion 100.00%
Source: U.S. Treasury14
The French economist Thomas Piketty argues in his influential book, Capital in the Twenty-
First Century, that the returns on the investment of capital have outpaced economic growth and
the growth in the wages earned by workers. The miracle of compounding benefits -- the rich!
Since the rich are by far the most likely to earn income from capital gains, this means their
incomes or savings are growing faster than the middle- and lower-class workers who earn most
or all of their income from wages paid in exchange for work performed. This disparity has been a
key driver in the increasing inequality in the U.S.
Since it is mostly the wealthy who profit from investment, the negative impacts of the capital
gains tax affect them most directly. Therefore this is a very progressive tax. Abolishing the
capital gains tax would help the rich but have very little direct impact on the vast majority of
Americans. Most Americans would not see their tax burdens decrease from the abolition of the
capital gains tax and might even see their tax burden increase if eliminating the capital gains tax
coincided with the implementation of new taxes to make up for lost government revenues.
2. The federal government cannot afford the lost revenue that would result from an
elimination of the capital gains tax. In 2014, federal revenues from the capital gains tax totaled
around $139 billion,15
the equivalent of approximately 4.6% of total federal revenues that year.16
Eliminating the capital gains tax would mean foregoing this revenue, and that’s something we
cannot afford.
After all, according to the Congressional Budget Office (CBO), total outstanding federal debt
currently stands around $20.5 trillion,17
or the equivalent of more than $62,000 for every
person in the U.S. That’s an amount at least $1 trillion greater than the total annual output of the
U.S. economy. And the debt continues to grow larger since the federal government continues to
14
U.S. Treasury, Distribution Table 2017 002, “Distribution of Income by Source,”
https://www.treasury.gov/resource-center/tax-policy/tax-analysis/Documents/Distribution-of-Income-by-Source-
2017.pdf. 15
U.S. Department of the Treasury, Office of Tax Analysis, “Taxes Paid on Capital Gains for Returns with Positive
Net Capital Gains, 1954-2014,” 20 Dec 2016, https://www.treasury.gov/resource-center/tax-policy/tax-
analysis/Documents/Taxes-Paid-on-Capital-Gains-for-Returns-with-Positive-Net-Capital-Gains.pdf. 16
Author’s calculations. Data from U.S. Treasury and Office of Management and Budget, Table 2.1, “Receipts by
Source: 1934-2021,”: https://obamawhitehouse.archives.gov/omb/budget/Historicals. 17
https://www.cbo.gov/system/files/115th-congress-2017-2018/reports/53514-debtlimit.pdf

13
run budget deficits. In fiscal year 2017 the federal government ran a deficit of $666 billion.18
Without revenue from the capital gains tax, this deficit would be even larger.
The revenue from the capital gains tax is even more critical in the wake of the “Tax Cuts and
Jobs Act,” which was signed into law on December 22, 2017. The Congressional Budget Office
estimates that the Act will result in a widening of the federal government’s deficit over a 10-year
window by $1.46 trillion, compared to what it would have been prior to the tax reform.19
Eliminating the capital gains tax would widen this budget hole even further.
Why does government debt matter? One main reason is that economists, most notably Kenneth
Rogoff of Harvard University and Carmen Reinhart of The American Enterprise Institute, have
shown statistically that debt-strapped countries tend to suffer from lower economic growth.20
This is logical since people are more likely to constrain their spending and investing when they
know that someday they will likely have to foot the bill to help pay off the national debt. When
the Affirmative argues that eliminating the capital gains tax will increase economic growth, they
likely are not taking government debt into account.
3. The capital gains tax is not the worst tax. Other, more damaging, taxes should be
prioritized in tax reform. The federal income tax has a much higher top marginal rate, 37%
(plus an additional 3.8% Medicare surcharge), than the capital gains tax. A much larger share of
Americans pay the income tax than pay the plutocratic capital gains tax. Furthermore, the income
tax has more damaging incentive effects than does the capital gains tax. While the capital gains
tax may impact some investment decisions, the income tax makes getting up in the morning and
working less attractive. Why should a worker take on extra hours or an entrepreneur pursue new
clients when the extra income such work would generate is significantly reduced by the income
tax? For all these reasons, efforts would be much better directed at further reducing income tax
rates rather than eliminating the capital gains tax.
4. The capital gains tax should be reduced, not abolished. Evidence suggests that reducing
the capital gains tax rate would lead to increased revenue for the federal government. In
1978 there was a significant cut to the tax rate on capital gains--the tax was effectively cut by
nearly half. Yet even though the tax rate was reduced, the government actually received more
revenue from the capital gains tax. (See the chart below for the evidence.) In 1978, the year of
the cut, capital gains tax revenues were $9.1 billion. The year after the cut, in 1979, revenues
18
“Budget.” Congressional Budget Office, 7 Dec. 2017, www.cbo.gov/topics/budget. 19
Hall, Keith. Congressional Budget Office, “Cost Estimate for the Conference Agreement on H.R. 1,” 15 Dec
2017, https://www.cbo.gov/system/files/115th-congress-2017-2018/costestimate/53415-
hr1conferenceagreement.pdf. 20
Reinhart, Carmen M., and Kenneth G. Rogoff. “GROWTH IN A TIME OF DEBT.” NBER WORKING PAPER
SERIES, Jan. 2010.

14
were $11.8 billion and they increased to $12.5 billion in 1980 and $12.9 billion in 1981. The tax
rate was cut again in 1981 and revenues grew further to $18.7 billion in 1983, and $52.9 billion
by 1986. Yet after 1986, when the capital gains rate was increased, revenues fell.21
It seems counter-intuitive that a lower tax rate would yield more revenue. But it actually makes
sense since high capital gains tax rates discourage investors from selling their assets, which
means the government cannot tax them (remember, capital gains are taxed only when the asset is
sold).
The resolution of this debate calls for eliminating the capital gains tax altogether. Without any
tax at all on capital gains, this revenue would be completely lost. It would be much better to keep
the capital gains tax in existence and reduce its rate so as to generate more revenue. Eliminating
the tax as the resolution calls for would force the government to forego valuable revenue it
so badly needs.
Year
Max Tax Rate on
Long-Term Gains
Government Revenue
from Capital Gains
1974 36.50% $4.2 billion
1975 36.50% $4.5 billion
1976 39.90% $6.6 billion
1977 39.90%* $8.2 billion
1978 39.8%/33.8%** $9.1 billion
1979 28.00% $11.8 billion
1980 28.00% $12.5 billion
1981 28%/20%** $12.9 billion
1982 20.00% $12.9 billion
1983 20.00% $18.7 billion
1984 20.00% $21.5 billion
1985 20.00% $26.5 billion
1986 20.00% $52.9 billion
1987 28.0% $33.7 billion
21 U.S. Department of the Treasury, Office of Tax Analysis, “Taxes Paid on Capital Gains for Returns with Positive
Net Capital Gains, 1954-2014,” 20 Dec 2016, https://www.treasury.gov/resource-center/tax-policy/tax-
analysis/Documents/Taxes-Paid-on-Capital-Gains-for-Returns-with-Positive-Net-Capital-Gains.pdf; Tax Policy
Center, “Historical Capital Gains and Taxes: 1954 to 2014,” 4 May 2017,
http://www.taxpolicycenter.org/statistics/historical-capital-gains-and-taxes.

15
1988 28.0% $38.9 billion
1989 28.0% $35.3 billion
1990 28.0% $27.8 billion
1991 28.9% $24.9 billion
SOURCE: U.S. Treasury; Tax Policy Center22
* The effective rate in 1977, what top investors actually paid, was 49.125.
**Indicates that the maximum long-term capital gains rate changed mid-year.
22
U.S. Department of the Treasury, Office of Tax Analysis, “Taxes Paid on Capital Gains for Returns with Positive
Net Capital Gains, 1954-2014,” 20 Dec 2016, https://www.treasury.gov/resource-center/tax-policy/tax-
analysis/Documents/Taxes-Paid-on-Capital-Gains-for-Returns-with-Positive-Net-Capital-Gains.pdf; Tax Policy
Center, “Historical Capital Gains and Taxes: 1954 to 2014,” 4 May 2017,
http://www.taxpolicycenter.org/statistics/historical-capital-gains-and-taxes.

16
Appendix A
Short-Term Capital Gains Tax Rate
Capital
Gains
Tax Rate Single Income
Married Filing Jointly
Income
Head of Household
Income
Married Filing
Separately Income
10% $0-$9,525 $0-$19,050 $0-$13,600 $0-$9,525
12% $9,525-$38,700 $19,050-$77,400 $13,600-$51,800 $9,525-$38,700
22% $38,700-$82,500 $77,400-$165,000 $51,800-$82,500 $38,700-$82,500
24% $82,500-$157,500 $165,000-$315,000 $82,500-$157,500 $82,500-$157,500
32% $157,500-$200,000 $315,000-$400,000 $157,500-$200,000 $157,500-$200,000
35% $200,000-$500,000 $400,000-$600,000 $200,000-$500,000 $200,000-$300,000
37% Over $500,000 Over $600,000 Over $500,000 Over $600,000
SOURCE: Joint Explanatory Statement of the Committee of Conference23
Long-Term Capital Gains Tax Rate
Capital
Gains
Tax Rate
Single Taxpayers
Income
Married Filing Jointly
Income
Head of Household
Income
Married Filing Separately
Income
0% Up to $38,600 Up to $77,200 Up to $51,700 Up to $38,600
15% $38,600-$425,800 $77,200-$479,000 $51,700-$452,400 $38,600-$239,500
20%* Over $425,800 Over $479,000 Over $452,400 Over $239,500
*This figure is really higher because there has been, since 2013, a capital gains surtax of 3.8%, making a total top
rate of 3.8%. SOURCE: Joint Explanatory Statement of the Committee of Conference24
23
Frankel, Matthew. “Your Guide to Capital Gains Taxes in 2018.” The Motley Fool, The Motley Fool, 22 Dec.
2017, www.fool.com/taxes/2017/12/22/your-guide-to-capital-gains-taxes-in-2018.aspx. 24
Frankel, Matthew. “Your Guide to Capital Gains Taxes in 2018.” The Motley Fool, The Motley Fool, 22 Dec.
2017, www.fool.com/taxes/2017/12/22/your-guide-to-capital-gains-taxes-in-2018.aspx.

17
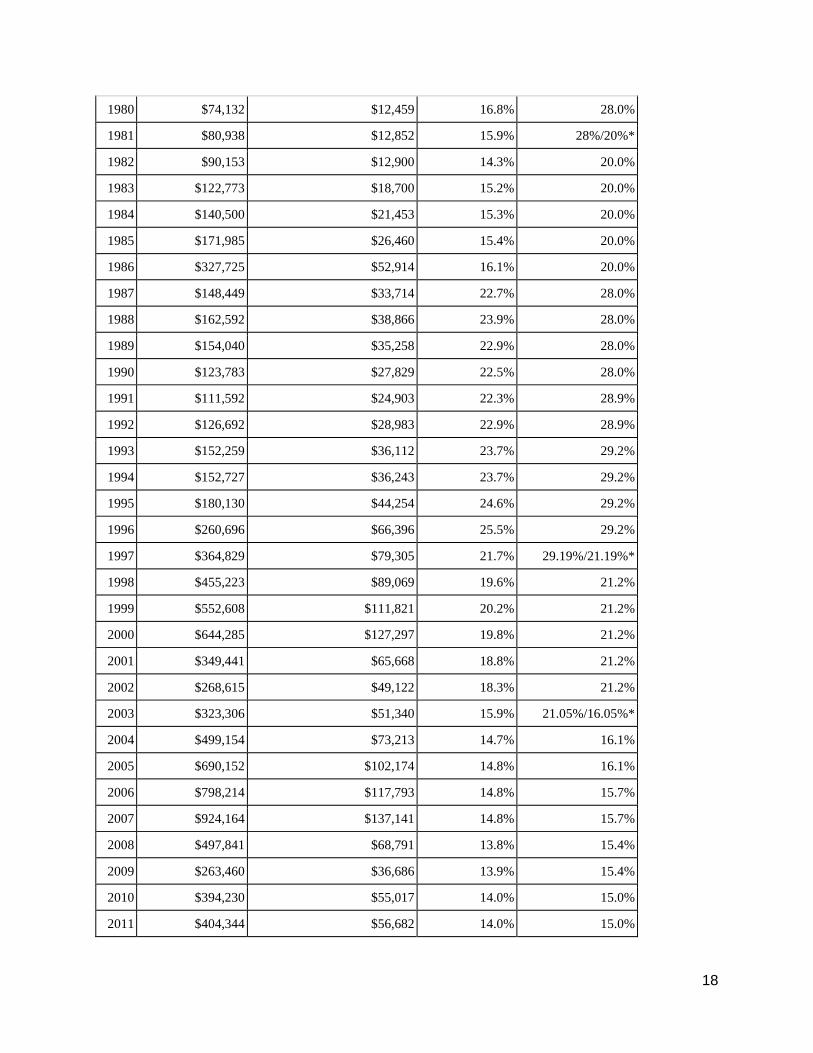
Appendix B25
Capital Gains and Taxes Paid on Capital Gains (all dollar amounts in millions)
Year
Total Realized
Capital Gains Taxes Paid on Capital Gains
Average
Effective Tax
Rate
Max Tax Rate on
Long-Term Gains
1954 $7,157 $1,010 14.1% 25.0%
1955 $9,881 $1,465 14.8% 25.0%
1956 $9,683 $1,402 14.5% 25.0%
1957 $8,110 $1,115 13.7% 25.0%
1958 $9,440 $1,309 13.9% 25.0%
1959 $13,137 $1,920 14.6% 25.0%
1960 $11,747 $1,687 14.4% 25.0%
1961 $16,001 $2,481 15.5% 25.0%
1962 $13,451 $1,954 14.5% 25.0%
1963 $14,579 $2,143 14.7% 25.0%
1964 $17,431 $2,482 14.2% 25.0%
1965 $21,484 $3,003 14.0% 25.0%
1966 $21,348 $2,905 13.6% 25.0%
1967 $27,535 $4,112 14.9% 25.0%
1968 $35,607 $5,943 16.7% 26.9%
1969 $31,439 $5,275 16.8% 27.5%
1970 $20,848 $3,161 15.2% 32.2%
1971 $28,341 $4,350 15.3% 34.3%
1972 $35,869 $5,708 15.9% 36.5%
1973 $35,757 $5,366 15.0% 36.5%
1974 $30,217 $4,253 14.1% 36.5%
1975 $30,903 $4,534 14.7% 36.5%
1976 $39,492 $6,621 16.8% 39.9%
1977 $45,338 $8,232 18.2% 39.9%**
1978 $50,526 $9,104 18.0% 39.8%/33.8%*
1979 $73,443 $11,753 16.0% 28.0%
25
“Historical Capital Gains and Taxes.” Tax Policy Center, 4 May 2017,
www.taxpolicycenter.org/statistics/historical-capital-gains-and-taxes.
18
1980 $74,132 $12,459 16.8% 28.0%
1981 $80,938 $12,852 15.9% 28%/20%*
1982 $90,153 $12,900 14.3% 20.0%
1983 $122,773 $18,700 15.2% 20.0%
1984 $140,500 $21,453 15.3% 20.0%
1985 $171,985 $26,460 15.4% 20.0%
1986 $327,725 $52,914 16.1% 20.0%
1987 $148,449 $33,714 22.7% 28.0%
1988 $162,592 $38,866 23.9% 28.0%
1989 $154,040 $35,258 22.9% 28.0%
1990 $123,783 $27,829 22.5% 28.0%
1991 $111,592 $24,903 22.3% 28.9%
1992 $126,692 $28,983 22.9% 28.9%
1993 $152,259 $36,112 23.7% 29.2%
1994 $152,727 $36,243 23.7% 29.2%
1995 $180,130 $44,254 24.6% 29.2%
1996 $260,696 $66,396 25.5% 29.2%
1997 $364,829 $79,305 21.7% 29.19%/21.19%*
1998 $455,223 $89,069 19.6% 21.2%
1999 $552,608 $111,821 20.2% 21.2%
2000 $644,285 $127,297 19.8% 21.2%
2001 $349,441 $65,668 18.8% 21.2%
2002 $268,615 $49,122 18.3% 21.2%
2003 $323,306 $51,340 15.9% 21.05%/16.05%*
2004 $499,154 $73,213 14.7% 16.1%
2005 $690,152 $102,174 14.8% 16.1%
2006 $798,214 $117,793 14.8% 15.7%
2007 $924,164 $137,141 14.8% 15.7%
2008 $497,841 $68,791 13.8% 15.4%
2009 $263,460 $36,686 13.9% 15.4%
2010 $394,230 $55,017 14.0% 15.0%
2011 $404,344 $56,682 14.0% 15.0%

19
2012 $647,073 $91,178 14.1% 15.0%
2013 $510,530 $98,798 19.4% 25.1%
2014 $716,162 $139,127 19.4% 25.1%
SOURCE: Tax Policy Center26
*Indicates that the maximum long-term capital gains rate changed mid-year rather than on Jan 1st.
**The top rate in 1977 was actually higher, 49.125%, when you consider the interaction of other taxes. A big
political debate ensued: how could America survive when the government took away half your profit from capital
gains?
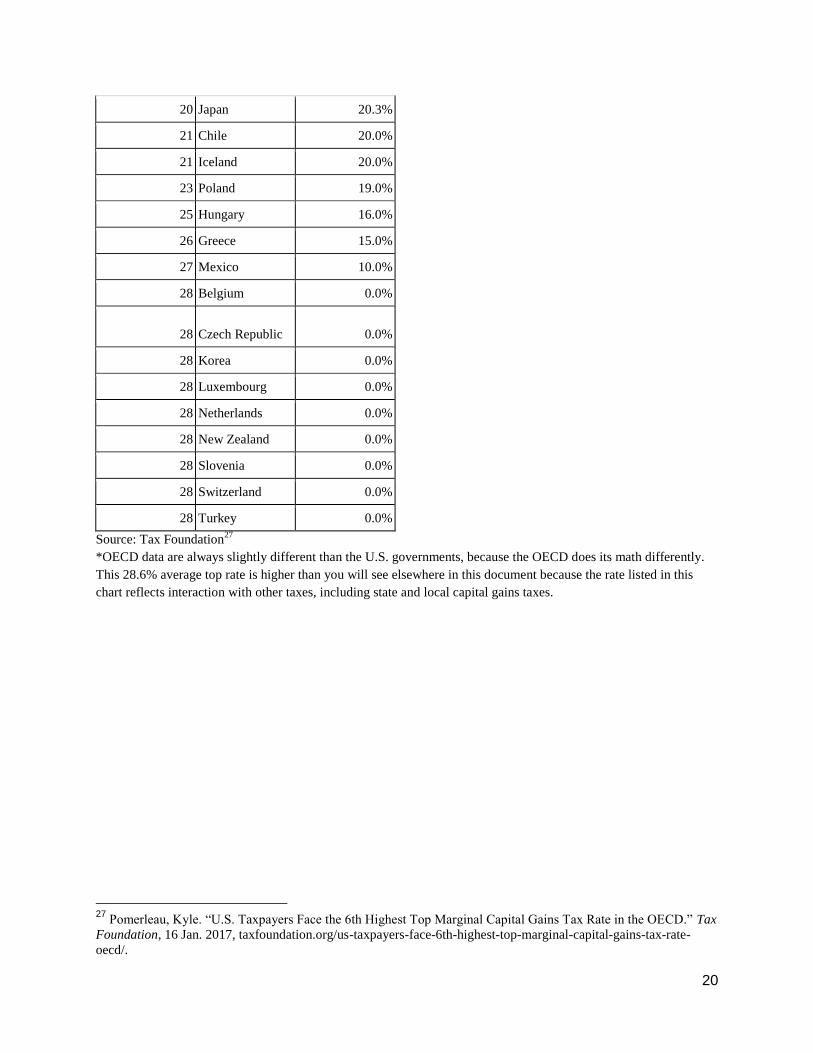
Appendix C
Top Marginal Tax Rate on Capital Gains, by OECD
Country, 2015
Rank Country Rate
1 Denmark 42.0%
2 France 34.4%
3 Finland 33.0%
3 Ireland 33.0%
5 Sweden 30.0%
6 United States 28.6%*
7 Portugal 28.0%
7 United Kingdom 28.0%
9 Norway 27.0%
9 Spain 27.0%
11 Italy 26.0%
12 Austria 25.0%
12 Germany 25.0%
12 Israel 25.0%
12 Slovak Republic 25.0%
16 Australia 24.5%
18 Canada 22.6%
19 Estonia 21.0%
26
“Historical Capital Gains and Taxes.” Tax Policy Center, 4 May 2017, www.taxpolicycenter.org/statistics/historical-capital-gains-and-taxes.
20
20 Japan 20.3%
21 Chile 20.0%
21 Iceland 20.0%
23 Poland 19.0%
25 Hungary 16.0%
26 Greece 15.0%
27 Mexico 10.0%
28 Belgium 0.0%
28 Czech Republic 0.0%
28 Korea 0.0%
28 Luxembourg 0.0%
28 Netherlands 0.0%
28 New Zealand 0.0%
28 Slovenia 0.0%
28 Switzerland 0.0%
28 Turkey 0.0%
Source: Tax Foundation27
*OECD data are always slightly different than the U.S. governments, because the OECD does its math differently.
This 28.6% average top rate is higher than you will see elsewhere in this document because the rate listed in this
chart reflects interaction with other taxes, including state and local capital gains taxes.
27
Pomerleau, Kyle. “U.S. Taxpayers Face the 6th Highest Top Marginal Capital Gains Tax Rate in the OECD.” Tax
Foundation, 16 Jan. 2017, taxfoundation.org/us-taxpayers-face-6th-highest-top-marginal-capital-gains-tax-rate-
oecd/.


