
David HerringNOAA Climate Program Office
March 13, 2013
NOAA Climate.govA brief overview and next steps

NOAA Climate.gov Portal Prototypehttp://www.climate.gov
The Climate Portal Prototype provides a well-integrated, online presentation of NOAA’s climate data & services.
The prototype features four audience-focused sections:
• ClimateWatch for the public
• Data & Services for scientists and data users
• Understanding Climate for policy leaders
• Education for educators & students
The Dashboard is a data-driven synoptic overview of the state of the global climate system.
Past Weather allows users to easily retrieve weather data for any given location & date.

3
Decision Makers
Science Policy Leaders
Educators & Students
Science Attentive Public, Citizen Scientists
Scientists & Data Users
Science Interested PublicsResidual Public
Museums, Science Centers, and After School & Community-based Programs
NOAA Internal
Public Media
Public Continuum
NOAA’s four initial target audience groupings

The who: start at the audience interface and work backward into the agency
Public Continuum Educators Data Users Policy / Decision Makers
NOAA Climate Science
NOAA Virtual Teams
Target Audiences
Climate Science
Community
NOAA Coastal
Marine Fisheries
National Weather Service
NOAA

Our 3-pronged strategy for building relationships with target audiences
NOAA Science Communication
Personnel
Engagements for Dialog & Feedback
Climate.gov & Social Media
Partners & Trusted Sources
Target Audiences

6
Climate.gov growth in visits compared to target
MONTHS
NU
MBE
R O
F VI
SITS
Locke & Lubchenco announce Climate Service
& Climate Portal
Locke & Lubchenco announce Climate Service
& Climate Portal
Record low Arctic sea ice, Hurricane Sandy, historic
drought, & Arctic Report Card
Record low Arctic sea ice, Hurricane Sandy, historic
drought, & Arctic Report Card
FY10 average = 26,196 FY11 average = 35,035
FY12 average = 56,932 FY13 Q1 average = 141,407

Quality of Relationship Score = 3.63 (72.6) (scale of 1 to 5, n=525) based on 5 core questions common to all target audiences that measure functionality and quality of relationships1) Satisfaction (based on reasons for visiting),
2) ease of navigation, 3) likelihood of recommending, 4) search engine, and 5) response confidence level
72.6100 point scale

Measuring ‘Quality of Relationship’
Awareness:
To what extent do the various target audiences know that NOAA exists &/or what NOAA does
Trust:
Perceptions of accuracy, credibility, and authority
Satisfaction:
Perceptions of relevance, reliability, & completeness
Usability & Use:
How easy is it to use Climate.gov? How useful are the resources? Are the resources being used? And, if so, how often / widely?
Control Mutuality:
Do users believe they can ask questions, or offer criticisms & recommendations, and get a timely response? Do they perceive opportunity for 2-way interactions? Do they feel they can influence us as we influence them?

5 Lessons learned after extensive evaluation, and resulting next steps
1. Our navigation structure is confusing » simplify & improve
2. Some of our terms are confusing » use plain English terms to contextualize content & enhance navigation
3. People want “actionable” climate information » produce timely & topical content that is relevant to people’s motivations
» Information about significant climate-related events
» Information about significant NOAA releases & new findings
4. People expect different content types to be thematically aggregated » build curated frames with topical, sectoral &/or regional foci
5. People want more & easier access to climate data » format and interpret data for usability & extensibility
» Our focus groups, usability studies, and Quality of Relationship survey revealed…

Simplify & improve site’s structural hierarchyS
earc
h &
B
row
se

NOAA Climate.gov Portal getting a facelifthttp://www.climate.gov
The Climate.gov project began as a rapid prototyping effort that was first published in February 2010 so that NOAA could gather feedback to develop and evolve Climate.gov in user-driven ways.
Plans are to transition the portal from a prototype to an operational status in early 2013.

ClimateWatch Magazine—soon to be “News & Features”
An online magazine written and designed in a popular style. Goal is to grow an attentive public to NOAA & climate.
Contains 3 types of content:
• Articles and stories
• Images with captions & annotations
• Videos with scientists’ commentaries
Features social media tools for subscriptions & RSS feeds, content rating, forward to a friend, and forms for facilitated feedback.

Understanding Climate renamed Decision Support
Peer-reviewed resources for policy leaders & decision makers to help them manage their climate-related risks & opportunities
Content aggregated into categories:
- Society & Environment (i.e., sectors)
- Topics
- Regions
- Agencies & Organizations
Content types:
- Reports & Assessments
- Decision Support Tools
- Datasets
- Fact Sheets & Presentations
- Professional Development Opportunities
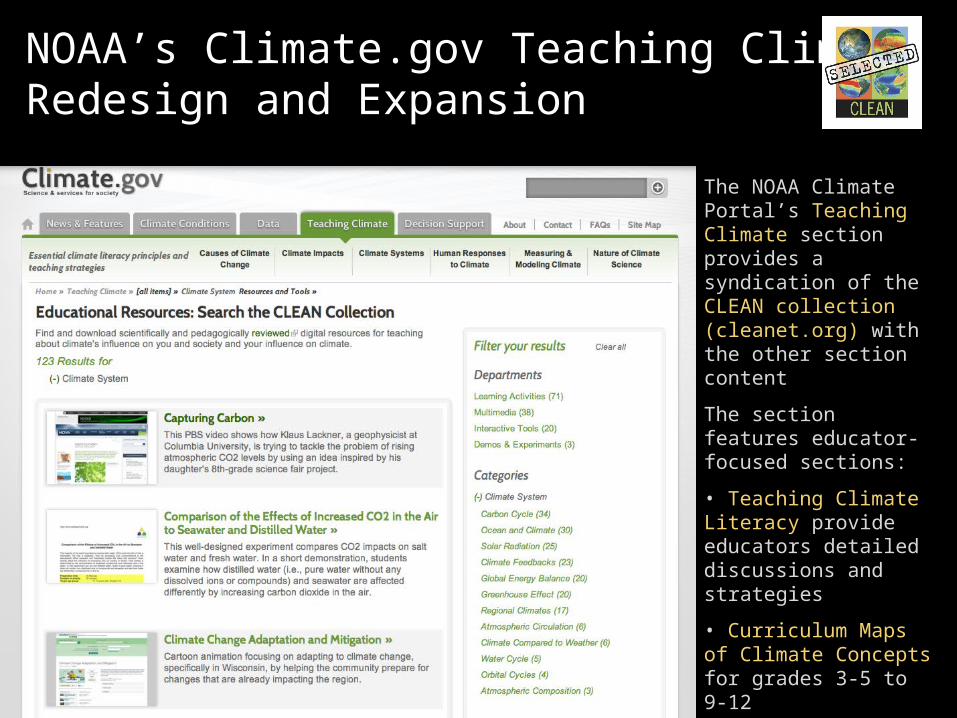
NOAA’s Climate.gov Teaching Climate Redesign and Expansion
The NOAA Climate Portal’s Teaching Climate section provides a syndication of the CLEAN collection (cleanet.org) with the other section content
The section features educator-focused sections:
• Teaching Climate Literacy provide educators detailed discussions and strategies
• Curriculum Maps of Climate Concepts for grades 3-5 to 9-12
• Professional Development Resources and Opportunities
• Reviewed Educational Resources on Climate and Energy topics from the CLEAN Collection

Content sortable by categories:
- Global Maps
- Regional Maps
- United States Maps
- Global Climate Dashboard
Search types:
- Integrated Maps Application
- Text Search for data sets and services
- Browse Library
NOAA’s Climate.gov Data Section Redesign and Expansion

Plans for new ‘Climate Conditions’ section
Public-friendly digest of recent & near-future climate conditions.
Initial emphasis on ‘mature’ products of high public interest & relevance
Will provide extensible maps & trends with links to source providers.
Will give entrée to subject experts to provide value-added interpretation.

Plans for new, interactive ‘Climate Explorer’

Just as a dashboard gives instant information on the status of a vehicle’s various systems, NOAA’s Global Climate Dashboard presents an overview of the current state of Earth’s climate system in historical context.
The Dashboard is designed for people seeking a synoptic view about what we know about climate variability and change, particularly policy leaders.
Global Climate Dashboard
Adjustable sliders allow users to focus on the time period of interest.
Hover cursor over graphs to see specific values for each data point .
Click on “Learn More” to jump to more detailed landing pages with more details produced in a popular style.

19
If you have feedback &/or would like to be a contributor to any section of Climate.gov, please contact the sections team leaders:If you have feedback &/or would like to be a contributor to any section of Climate.gov, please contact the sections team leaders:
Climate Conditions:[email protected]
News & Features:[email protected]
Teaching [email protected]
[email protected]@noaa.gov
Decision [email protected]
Climate Dashboard:[email protected]
Climate.gov in general:[email protected]
Gathering Feedback & Enhancing Collaborations


