Project no. 289578 Claim
Supporting the role of the Common agricultural policy in LAndscape valorisation: Improving the knowledge base of the contribution of landscape Management to the rural economy
Call identifier: FP7-‐KBBE.2011.1.4-‐04 Funding scheme: Collaborative project
Thematic task 5.2: Landscape as a driver of competitiveness
Deliverable D5.22
Second draft: 06.06.2014 Final version: 24.07.2014
Start date of project: 01 January 2012 Duration: 36 months
Organisation name of lead beneficiary for this deliverable: ZALF
Lena Schaller, Martin Kapfer & Jochen Kantelhardt
Vienna, 24. 07. 2014
Project funded by the European Commission within the Seventh Framework Programme (2007-‐ 2013) Dissemination Level
PU Public X PP Restricted to other programme participants (Including the Commission Services) RE Restricted to a group specified by the consortium (Including the Commission Services) CO Confidential, only for members of the consortium (Including the Commission Services)

1
Contents Contents ............................................................................................................................................................ 1
1 Introduction .............................................................................................................................................. 2
1.1 Landscape, landscape services, socio-‐economic benefits and regional competitiveness ................. 2
1.2 Regional competitiveness ................................................................................................................. 3
2 The expected role of agricultural landscape as a driver of competitiveness in CLAIM ............................. 5
3 The importance and impact of actors, landscape services, socioeconomic benefits and regional competitiveness in the landscape valorisation framework .............................................................................. 8
3.1 Conceptual understanding ................................................................................................................ 8
3.2 Horizontal empirical case study evidence ......................................................................................... 8
4 Landscape service use, beneficiaries and benefits .................................................................................. 11
4.1 Conceptual understanding .............................................................................................................. 11
4.2 Empirical case study evidence ......................................................................................................... 11
5 The contribution of landscape service valorisation to regional competitiveness ................................... 15
5.1 Conceptual understanding .............................................................................................................. 15
5.2 Empirical case study evidence ......................................................................................................... 15
5.2.1 The values of landscapes and landscape services ................................................................... 16
5.2.2 Landscape values, landscape valorization: link or gap? .......................................................... 17
5.2.3 Modelling socioeconomic benefits of landscape services ....................................................... 18
5.2.4 Landscape and regional competitiveness: Is there a connection at all? ................................. 19
6 Socio-‐economic “second order” effects of the valorisation of landscape services ................................. 20
7 Synthesis: Discussion, Conclusion and lessons learned for the final framework .................................... 26
8 References ............................................................................................................................................... 29
2
WP5, Task 2: Landscape as a driver of competitiveness
1 Introduction One of the main objectives in the CLAIM project is to explain the extent to which agricultural landscape and the valorisation of landscape services contribute to the development and competitiveness of rural regions. To this aim, in deliverable 3.14 a theoretical introduction to the possible interlinkages between landscape services, beneficiaries of landscape services, socioeconomic benefits of services’ use and finally, the contribution of the valorisation of landscape services’-‐use to regional competitiveness has been given. On this basis, in WP3 particularly the upper right-‐hand part of the preliminary CLAIM framework has been elaborated by van Zanten et al. (2014).
In WP5, task 5.2, the theoretical basis is enriched by empirical evidence that has been gathered in the nine ad-‐hoc studies carried out in the single CLAIM case study areas. In this report a synthesis of the case study results obtained in activities a, b, c and d of WP4 is drawn to support the revision of the upper right hand part of the conceptual framework, namely, the expected role of landscape as a driver of competitiveness.
The structure of the paper at hand is as follows:
In the next 2 sections of the introduction, an overview over the most relevant literature is given. In Chapter 2 the expected role of agricultural landscapes as a driver of regional competitiveness in the CLAIM framework is explained. Chapter 3 presents the empirical evidence collected to support and evidence the general understanding on the importance and impact of actors, landscape services, socioeconomic benefits and regional competitiveness in CLAIMs landscape valorisation framework. Chapter 4 provides general case study evidence regarding the use of landscape services, the beneficiaries of services use and the overall benefits generated by services use. Chapter 5 provides specific ad-‐hoc case study evidence on the contribution of landscape service valorisation to regional competitiveness. Chapter 6 provides a summary on the findings on socioeconomic second order benefits. In Chapter 7, main conclusions for the further development of the framework are drawn.
1.1 Landscape, landscape services, socio-‐economic benefits and regional competitiveness
The question of how agricultural landscape and the valorisation of landscape services contribute to the development and competitiveness of rural regions gains increasing importance in recent years. In particular the concept is discussed that agricultural landscapes hold the potential to provide private as well as public good-‐type (ecosystem) services which represent a resource not only for local inhabitants but also for different sectors of the rural economy, such as agriculture, forestry, tourism or the trade and services sector (van Zanten et al., 2014; Fieldsend, 2011; TEEB, 2010; De Groot et al., 2010; Haines-‐Young and Potschin, 2010; ENRD, 2010; Cooper et al., 2009). Depending on the valorisation of the goods provided, landscapes can support the rural economy and the quality of life in rural areas and can become a factor of territorial development and competitiveness in terms of agricultural income, population growth, employment creation, etc. (e.g. van Zanten et al. 2014; De Groot et al., 2010; Cooper et al. 2009; Courtney et al. 2006; van der Meulen et al. 2011; Courtney et al. 2013; Dissart & Vollet, 2011).
However, the cause-‐effect chains between the supply of goods and services from landscapes and the development and competitiveness of rural regions still remain mostly unclear. In particular this is due to the fact that the socioeconomic effects (benefits) resulting from the use of landscape services often are multi-‐staged and multi-‐faceted and therefore difficult to assess (Dissart & Vollet, 2011; ENRD, 2010; Cooper
3
et al., 2009). On the one hand, the use of private and public good-‐type services from agricultural landscapes can create “direct” and “linear” socioeconomic benefits, e.g. from the production and marketing of agricultural goods or from the direct use of recreation possibilities by both local population or tourists (Cooper et al., 2009, Hein et al., 2006). Here, at least as regards the benefits of the direct use of private good-‐type services, the assessment of the monetary impact on the development and competitiveness of a region appears comparatively easy (Power, 2010; Hein et al., 2006). In contrast, already the assessment of economic benefits from the direct use of public good–type services is often complicated due to the mostly missing market price for such services (Hein et al., 2006; Rudd, 2009; Schaeffer, 2008; Diaz-‐Balteiro and Romero, 2008). So have marginal values of public goods to be established by using non-‐market valuation techniques, such as stated and revealed preference approaches (Hein et al. 2006). Moreover, the use of services provided by a landscape can also create “indirect” and “non-‐linear” socioeconomic benefits (Cooper et al., 2009; Fieldsend, 2011; ENRD, 2010; van der Meulen, 2011): For example, the use of the beauty of a landscape in combination with the agricultural products supplied in a landscape can enable new marketing concepts of regional speciality products (Cooper et al., 2009). In the same way, the landscapes’ function of moderating extreme events, or again even the beauty of a landscape, can lead to the establishment of businesses in a special area (Fieldsend & Kerekes, 2011; Balderjahn & Schnurrenberger, 1999). Such economic activities in turn can create, influence or alter other economic activities, for example by developing the regional income side due to creating jobs for the local population or by developing the supplier side due to enhanced demand. Here, one can speak of “multiplier effects”, whereas “multiplication” can go through various stages before it dies out (van der Meulen, 2011; Domanski & Gwosdz, 2010; ENRD, 2010).
The assessment of the links between nature and the goods and services nature provides for human society, has been subject to intensive scientific discourse particularly during the last decade (Costanza et al., 1997; MA, 2005; TEEB, 2010; Haines-‐Young & Potschin, 2010; Müller et al., 2010; De Groot et al., 2010). At present, several frameworks have been developed targeting to capture mainly the supply side of goods and services from ecosystems and the (positive) influence of such goods and services on human society. Particularly the “Ecosystem Services” (ES) approach is widely accepted, defining ecosystem services as the benefits human populations derive, directly or indirectly, from ecosystems (Costanza et al., 1997; MA, 2005) or, more complex, as the “flows of value to human societies as a result of the state and quantity of natural capital” (TEEB, 2010). Based on the general understanding of ES, Haines-‐Young and Potschin (2010) and De Groot et al. (2010) frame the relations between biodiversity, ecosystem functions and human well-‐being in a service cascade of flows, running from the biophysical structures and processes within an ecosystem to the services provided and finally to the – both monetary or non-‐monetary valoriseable -‐ benefits for humans.
1.2 Regional competitiveness
Also the question, how to measure ‘regional competitiveness’ is subject to a rather long-‐standing, yet still ongoing discussion – both on scientific and political level (EUROPEAN COMMISSION, 1999a, 1999b and 2010; THOMSON & WARD, 2005; PORTER & KETALS, 2003; KRUGMANN, 1994a and 1994b; PORTER, 1992; KRUGMANN, 1990). There is broad consensus that the crux of measuring ‘regional competitiveness’ lies in the sound definition of the term itself and in finding indicators which are fully suitable and – moreover – available on regional level, to conduct a reliable and comprehensive assessment. Literature reveals that a strictly economic definition of competitiveness has clear shortages as economic factors alone can’t represent all assets characterizing a region (KRUGMANN, 1990; PORTER, 1992; KRUGMANN, 1994; EUROPEAN COMMISSION, 1999a, 1999b, and 2010; PORTER & KETALS, 2003; THOMSON & WARD, 2005). For a deeper insight and a
4
comprehensive assessment of regional competitiveness, it becomes clear that social and sustainability factors must also be taken into account (KRUGMANN, 1990; PORTER, 1992; KRUGMANN, 1994; EUROPEAN COMMISSION, 1999a, 1999b, and 2010; PORTER & KETALS, 2003; THOMSON & WARD, 2005). Many of the approaches of measuring competitiveness, aim at considering and implementing this understanding (SCHWAB AND PORTER, 2007).
In general, “competitiveness” can be defined as the ability “to withstand market competition” (EU, 1999b). On micro-‐economic level, e.g. for firms or companies, “competitiveness” as a measure of economic viability is broadly accepted. Here, “competitiveness is the ability to produce the right goods and services of the right quality, at the right price, at the right time” in a competitive market, while “meeting customers’ needs more efficiently and more effectively than other firms do” (THOMSON & WARD, 2005). Moreover, micro-‐economically, competitiveness is the sustainable ability of a company or a sector, to gain or save profit-‐making market shares (MARTIN ET AL., 1991), or, very straight forward, the capacity of a company or sector to compete, grow and be profitable (MARTIN et al., 2006).
However, in a territorial context, that is, for nations or regions, the reasonableness of measuring competitiveness is intensively discussed (e.g. PORTER, 1992, KRUGMANN, 1994A, B; KRUGMANN 1996; EUROPEAN COMISSION, 1999a): KRUGMANN (1996) points out that applying the concept of competitiveness on regions or nations implies an intern competition between them. Nations or regions, failing to achieve the productivity of competing nations or regions, will face the same kind of crisis as a company that cannot match the productivity of its rivals. However, such a comparison is problematic, since goals and circumstances of nations, regions and companies differ significantly and, furthermore, a nation or region that does “not compete” will still not cease to exist and go out of business – like a non-‐competitive company (KRUGMANN, 1996; KRUGMANN 1994a, THOMSON & WARD, 2005). Nevertheless, to measure competitiveness of nations or regions still appears useful, as quantitative and comparable assessment could help to identify regional weaknesses and uncover factors mainly driving these weaknesses. This can, assumedly, support regions in the catching up process (EUROPEAN COMMISSION, 2010).
Until now, various definitions of competitiveness have been formulated in order to more comprehensively describe the “competitive” potential of nations or regions: On macro-‐economic, national level one of the most important definitions for sure is given by the World Economic Forum in line with the development of the Global Competitiveness Index (GCI): Here, competitiveness is defined as the “set of institutions, policies, and factors determining the level of productivity of a country” (SCHWAB & PORTER, 2007; OECD, 2013, 4). On regional level, e.g. the EU’s Sixth Periodic Report on the Regions defines competitiveness as “the ability […] to generate, while being exposed to international competition, relatively high levels of income and employment (EUROPEAN COMMISSION, 1999a). Another approach, introducing the term “territorial competitiveness” (EU, 1999b), goes beyond this still rather “productivity-‐driven” definition and describes an area’s competitiveness by the ability “to face up to market competition whilst at the same time ensuring environmental, social and cultural sustainability, based on the dual approach of networking and inter-‐territorial relationships” (EU, 1999b). Also more recent definitions go beyond the sole productivity meaning of competitiveness by including social and sustainability aspects: Here the focus is on the link between regional competitiveness and regional prosperity while competitiveness is characterised by the ability of a locality or a region to generate high and rising incomes, enhancing the overall standards of living and improving the livelihoods of the people living there (BRISTOW, 2005, HUGGINS, 2003, MEYER-‐STAMER, 2008, EUROPEAN COMMISSION, 2009).
5
A practical problem of measuring ‘regional’ or even ‘local’ competitiveness is the establishment of appropriate indicators. On national level a range of widely accepted indicator systems and competiveness indices exists, such as the IMD’s World Competitiveness Yearbook (IMD, 2000), the World Economic Forum’s Global Competitiveness Index (SCHWAB & PORTER, 2007), the OECD’s New Economy Report (OECD, 2001) or the European Competitiveness Index (HUGGINS & DAVIES, 2006). However, national indices cannot be easily transferred to a regional scale, since information is often unavailable or meaningless on regional level (HUOVARI et al., 2001). MARTIN (2004) describes two approaches to assess competitiveness on regional level. The first approach explores the influence of particular single drivers on competitiveness, such as demographical development [Florida, 2000], business environment and innovative milieu [RITSILÄ, 1999], governance and institutional capacity [Moers, 2002] or industrial structure [EUROPEAN COMMISSION, 1999A; EUROPEAN COMMISSION, 2001] (MARTIN 2004). The second approach analyses competitiveness as a cumulative outcome of factors (MARTIN, 2004). Prominent examples for this approach are the UK’s regional and local competitiveness index [HUGGINS & DAY, 2006; HUGGINS & THOMPSON, 2010]; the European Commission’s reports on economic, social and territorial cohesion (EUROPEAN COMMISSION, 2002 – 2013), or the recently developed European, regional-‐based competitiveness index (RCI) on NUTS 2 level (DIJKSTRA et al., 2011). Here, the different approaches use a variety of different factors and indicators to describe and measure competitiveness on a rather small scale. Depending on the approach, strictly “economic” factors like GDP, income levels and labour productivity, “efficiency factors” like labour market efficiency, education and training or market size, “innovation” factors like, innovation, business sophistication or technological readiness, or other “basic” factors like infrastructure, investments, institutions or also health or quality of life are considered and combined. However, it becomes obvious that many of these “regional” indicators are still not necessarily suitable for measuring regional competitiveness – at least not for all regional “basic-‐conditions” and also not necessarily on really small-‐scale levels such as municipalities. For example, many of the regional competitiveness factors in use focus on urban and not on rural areas. For instance, to describe the factor “Innovation” DIJKSTRA et al., (2011) uses the number of patents as indicator. Yet, the number of patents will be of minor importance in rural areas as larger companies or research centres are mainly located in urban areas. Also, the availability of data on LAU2 might not be given for all factors. For instance data on GDP per Head or Household is often only available on LAU2 level. Consequently, to measure the competiveness of rural areas on municipality level specific competitiveness factors and related indicators are required.
2 The expected role of agricultural landscape as a driver of competitiveness in CLAIM
On basis of the existing “ecosystem” frameworks on the links between nature and the goods and services it provides for human society (MA, 2005; TEEB, 2010; Haines-‐Young & Potschin, 2010; De Groot et al., 2010), however going an important step further, in CLAIM’s WP3 van Zanten et al. (2014) developed a framework, which – in its upper right hand part – particularly takes into account the role of agricultural landscape as a driver of competitiveness by addressing the relations between the (1) supply of landscape services, the (2) socio-‐economic benefits created by the consumption of landscape services, the (3) valuation of such benefits, and the contribution of these valued benefits to (4) regional competitiveness. Moreover, the framework includes the economic actors and mechanisms influencing and driving the system (c.f.Figure 1).
(1) Supply of landscape services The framework takes a “landscape” perspective by adapting the ecosystem services frameworks (MA, 2005; TEEB, 2010; Haines-‐Young & Potschin, 2010; De Groot et al., 2010) and addressing “landscape services” as the benefits human populations derive, directly or indirectly, from landscapes (van Zanten et al., 2014).

6
Here, particularly the ecosystem services of TEEB (2010) are taken into account. Consequently “landscape services” represent services in the categories “provisioning services”, “regulating services”, “cultural services” and “supporting services”. By including the landscape services of all categories, the CLAIM framework explicitly follows the approach that not only “private good-‐type services” in agricultural landscapes, (such as provisioning services like agricultural products or raw materials) and their valorisation can contribute to competitiveness, but also the existence of more “public good-‐type services”, like many of the regulating, cultural and supporting services (see e.g. OECD, 2001, p.80), are to be seen as basis for the occurrence of a range of social and economic benefits that enhance the competitiveness of a region.
Figure 1: The CLAIM analytical framework as presented in van Zanten et al., (2013)
As regards the consideration of how the different “landscape services” are generated, van Zanten et al.s’ (2014) framework represents a novelty: it explicitly distinguishes between service-‐supply and service-‐demand as the determinants of the services’ potential to create valuable socio-‐economic benefits for society. The inclusion of the demand side allows for addressing the potential impact of a variety of economic actors and consumers of landscape services on the supply of such services (van Huylenbroeck and Vanslembrouck 2001; Cooper et al. 2009): the framework particularly follows the assumption that the provision of goods and services in agricultural landscapes is affected not only by such actors directly “managing” and “producing” landscape and therefore steering the potential of a landscape to supply services (e.g. agriculture or forestry), but also by a variety of other stakeholders and consumers demanding goods and services from landscapes to the aim of deriving personal and societal socio-‐economic benefits. Furthermore, van Zanten et al’s (2014) framework hypothesises that the creation of socio-‐economic benefits has feedbacks on the demand side and, consequently, also further feedbacks on the supply side.
(2) Socio-‐economic benefits Literature reveals that the identification of beneficiaries, the measurement of benefits and in particular the translation of benefits to competitiveness represent difficult tasks in answering the question of the contribution of landscape to regional competitiveness (Fieldsend, 2011). As regards the benefits from the
7
supply of landscape services, CLAIM’s framework aims at including economic as well social benefits that are potentially realised by the use of both “private-‐” as well as “public good-‐type services” provided in agricultural landscapes. The “benefits”-‐box in the framework addresses “direct” and “indirect” socio-‐economic benefits of service use – for the agricultural sector as well as for all possible economic actors within the whole regional economy. As regards economic actors, six mainl groups of beneficiaries have been suggested in the framework, namely the (1) global society and global economy, (2) local agriculture, (3) local forestry, (4) local tourism, (5) local trade and industries and (6) local society. As regards “indirect” socio-‐economic benefits, of particular interest in CLAIM are so-‐called socio-‐economic “second order effects”, yielding economic benefits downstream the use of public good type services in agricultural landscapes. Here, for listing and classification of such benefits, the CLAIM framework on the one hand refers to the studies of Cooper et al. (2009) and ENRD (2010). Intersecting Cooper et al. (2009) and ENRD’s (2010) understanding of second order effects of agricultural landscapes, the list of effects in CLAIM include: (1) tourism and recreation opportunities, (2) employment opportunities, (3) opportunities for adding value to food/other products (4) social and cultural benefits, (5) investment being attracted to the local area, (6) businesses relocating to the area (7), and impacts on population levels (in-‐ and outmigration) in rural areas. Moreover, CLAIM’s understanding of socio-‐economic benefits of agricultural landscapes includes multiplier effects (Domanski & Gwosdz, 2010) and feedback loops in the system:
As regards multiplier effects (supply side effects and income effects), positive and negative effects are addressed: Positive multiplier effects describe the situation where the (increased) use of a public good type service creates new economic activities or enhances/develops/alters existing economic activities: o The new or enhanced economic activity creates additional demand, which allows the suppliers of the
activity to grow (supply side effects). o The new or enhanced economic activity creates additional income that allows the providers of
consumer products to grow (Income effects) Negative multiplier effects describe the situation where, the (decreased/finished) use of a public good type service decreases or even eliminates existing economic activities: o The decreased economic activity decreases demand, the suppliers activities decrease. o The decreased economic activity lowers income, providers of consumer products decrease. The “multiplication” of effects can go on and on and lead to further effects like increase construction activities, higher tax revenues, development of infrastructure, etc.
As regards feedback loops (the effects of the use of public good type services on the provision of public good type services and private good type services) again positive and negative loops are taken into account: Positive feedback loop refer to the situation where The expansion of the usage of a special public good type service leads to economic activities that enhance the demand for the provision of the same or other public good or private good type services which again enhances economic activities. Negative feedback loop refer the situation where the expansion of the usage of a special public good type service leads to economic activities that enhance the demand for the provision of some public good or private good type services on the cost of other public or private good type services. Furthermore, negative feedback loops occur when the decrease of the usage of a special public good type decreases the demand for the provision of the same or other public good type services.
(3) Valuation of benefits The approach of valuation in the CLAIM framework is described in detail by van Zanten et al. (2014). Basically, the approach of landscape service valuation in CLAIM includes and allows for all classical

8
economic and social valuation techniques such as Total Economic Valuation (TEV) and perception based valuation (van Zanten et al., 2014).
(4) Regional competitiveness The approach of “competitiveness” in van Zanten et al.s’ (2014) framework meets literature’s demand to include social competitiveness and sustainability into the definition of competitiveness. Also taken into account are the results of the CLAIM’S plenary stakeholder laboratory, where it was stressed that addressing competitiveness in a classical “economic” way will most likely not bring innovative results within the project. According to the plenary stakeholders, the analysis of regional competitiveness has to also consider topics like knowledge, innovation, or entrepreneurial capacity. Indicators of “regional competitiveness” should therefore include economic “facts” like the income of the population, GDP, etc. as well as “social parameters” like demography, education, social capital, human capital and human-‐wellbeing in general. In response to this appraisal, “regional competitiveness” in CLAIM is rather to be understood as a combination of “Welfare” and “Competitiveness”. This concept aims at addressing competitiveness not only in the economic sense but also by considering social and sustainability components. To this end, “economic competitiveness” in CLAIM can be defined by productivity and economic indicators such as GDP, GVA, wage levels, etc. while “social competitiveness” addresses the contribution of valued benefits of landscape-‐service consumption to the wellbeing of the local population, to the quality of life, to the development of human capital, and to the sustainable use of resources, etc.
3 The importance and impact of actors, landscape services, socioeconomic benefits and regional competitiveness in the landscape valorisation framework
3.1 Conceptual understanding The general conceptual understanding on the impact of agricultural landscape on regional competitiveness in CLAIM’s preliminary framework (van Zanten et al. 2014), is that (i) economic actors, due to their activities (both demand and supply) influence the delivery of private and public good type services, that (ii) the private and public good type services create socio-‐economic benefits in the regions, that (iii) these benefits have an impact on regional welfare and competitiveness and that (iiii) different feedback and loop effects within the system have an impact on supply and demand of services. It is further assumed, that, depending on the valorisation of the different services, they will have varying impact on different socioeconomic benefits. The valorisation of landscape services will therefore have differing influence on regional competitiveness.
3.2 Horizontal empirical case study evidence To analyse if the assumed causal connections within the CLAIM framework’s upper right hand box hold true and to clarify the impact of the different framework elements in different regional contexts, in Activity d of WP4 an Analytical Network Process (ANP) is carried out throughout all nine CLAIM’s case study areas. Here, the priority of actors, private and public good-‐type landscape services, socioeconomic benefits and regional competitiveness in the system of landscape valorisation are tested in a comprehensive expert panel exercise, including key-‐agents from different sectors of the rural economy (CLAIM, 2014). Figure 2 shows the particular part and elements of the framework being addressed by the ANP while table 1 gives an overview on the experts taking part in the exercise.
Figure 2 shows the particular part and elements of the framework being addressed by the ANP.

9
Figure 2: The CLAIM analytical framework as presented in van Zanten et al., (2013). The highlighted boxes and relations are addressed and tested by the ANP exercise.
Table 1: Key-‐figures expert panel (number of participants)
Expertgroup: Case study areas:
CSA 1 (IT)
CSA 2 (DE)
CSA 3 (AT)
CSA 4 (NE)
CSA 5 (ES)
CSA 6 (PL)
CSA 7 (TK)
CSA 8 (BG)
CSA 9 (FR)
Agriculture 1 1 2 1 3 2 3 7 2 Economy -‐ -‐ 2 -‐ 3 -‐ 2 -‐ -‐ Environment/ landscape 3 2 1 2 1 4 -‐ -‐ 3
Policy/rural development 1 3 2 5 3 1 1 4 1
Research 1 2 2 -‐ -‐ 1 3 -‐ Tourism 2 2 1 2 -‐ -‐ -‐ -‐ 1 Others -‐ -‐ -‐ -‐ -‐ 2 -‐ -‐ -‐
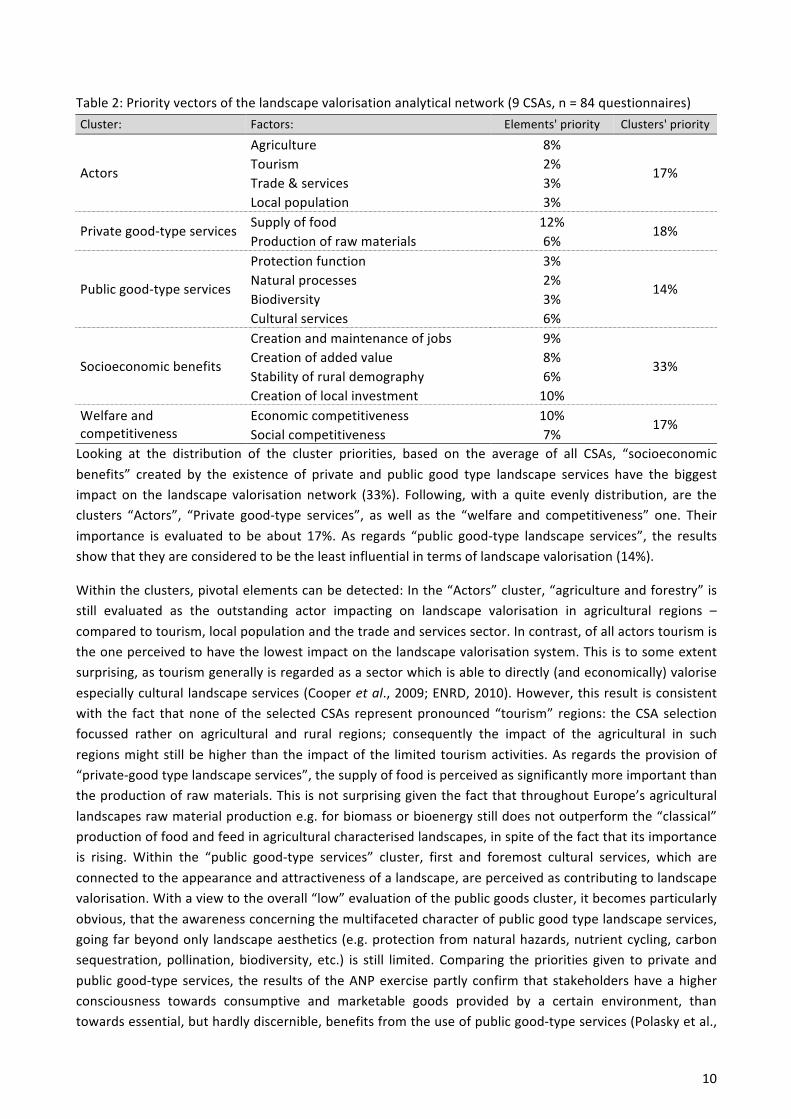
The results of the ANP exercise provide evidence to the importance of the elements of the framework boxes driving the system of landscape valorisation. It can be seen that landscape valorisation is only in part driven by single, “outstanding” elements or clusters of elements within the framework. It rather becomes obvious, that all clusters play important roles in the system investigated. Table 2 shows the priority vectors of the clusters and clusters’ elements of the landscape valorisation network.
10
Table 2: Priority vectors of the landscape valorisation analytical network (9 CSAs, n = 84 questionnaires) Cluster: Factors: Elements' priority Clusters' priority
Actors
Agriculture 8%
17% Tourism 2% Trade & services 3% Local population 3%
Private good-‐type services Supply of food 12% 18% Production of raw materials 6%
Public good-‐type services
Protection function 3%
14% Natural processes 2% Biodiversity 3% Cultural services 6%
Socioeconomic benefits
Creation and maintenance of jobs 9%
33% Creation of added value 8% Stability of rural demography 6% Creation of local investment 10%
Welfare and competitiveness
Economic competitiveness 10% 17% Social competitiveness 7%
Looking at the distribution of the cluster priorities, based on the average of all CSAs, “socioeconomic benefits” created by the existence of private and public good type landscape services have the biggest impact on the landscape valorisation network (33%). Following, with a quite evenly distribution, are the clusters “Actors”, “Private good-‐type services”, as well as the “welfare and competitiveness” one. Their importance is evaluated to be about 17%. As regards “public good-‐type landscape services”, the results show that they are considered to be the least influential in terms of landscape valorisation (14%).
Within the clusters, pivotal elements can be detected: In the “Actors” cluster, “agriculture and forestry” is still evaluated as the outstanding actor impacting on landscape valorisation in agricultural regions – compared to tourism, local population and the trade and services sector. In contrast, of all actors tourism is the one perceived to have the lowest impact on the landscape valorisation system. This is to some extent surprising, as tourism generally is regarded as a sector which is able to directly (and economically) valorise especially cultural landscape services (Cooper et al., 2009; ENRD, 2010). However, this result is consistent with the fact that none of the selected CSAs represent pronounced “tourism” regions: the CSA selection focussed rather on agricultural and rural regions; consequently the impact of the agricultural in such regions might still be higher than the impact of the limited tourism activities. As regards the provision of “private-‐good type landscape services”, the supply of food is perceived as significantly more important than the production of raw materials. This is not surprising given the fact that throughout Europe’s agricultural landscapes raw material production e.g. for biomass or bioenergy still does not outperform the “classical” production of food and feed in agricultural characterised landscapes, in spite of the fact that its importance is rising. Within the “public good-‐type services” cluster, first and foremost cultural services, which are connected to the appearance and attractiveness of a landscape, are perceived as contributing to landscape valorisation. With a view to the overall “low” evaluation of the public goods cluster, it becomes particularly obvious, that the awareness concerning the multifaceted character of public good type landscape services, going far beyond only landscape aesthetics (e.g. protection from natural hazards, nutrient cycling, carbon sequestration, pollination, biodiversity, etc.) is still limited. Comparing the priorities given to private and public good-‐type services, the results of the ANP exercise partly confirm that stakeholders have a higher consciousness towards consumptive and marketable goods provided by a certain environment, than towards essential, but hardly discernible, benefits from the use of public good-‐type services (Polasky et al.,

11
2010). Looking at the different socio-‐economic benefits impacting on the system of landscape valorisation, the influence of the single elements is rather evenly distributed. However, the creation of jobs and the creation of local investments appear to have a slightly higher impact than the generation of added value and the stability of the demography of rural areas. Within the cluster “welfare and competitiveness”, economic competitiveness in general is evaluated to be a more important driver in the system of landscape valorisation. If ANP results are compared on the level of the single study regions, it becomes obvious, that differing regional basis conditions can induce shifts of the importance of single elements playing a role in the system (CLAIM, 2014).
4 Landscape service use, beneficiaries and benefits
4.1 Conceptual understanding
In the understanding of CLAIMs conceptual framework, the potentials of the landscape to provide private and public good type landscape services are realised if a ‘consumer’ demand for these services exists. Here, a variety of economic actors is assumed to be potential “consumers” of landscape services. For the “consumers” of landscape services, consumption can lead to benefits. In the ANP exercise described in section 3.2, only 4 groups of economic actors have been tested, as being assumed to be the most important actors in a rural economic society in the local stakeholder workshops. However, it becomes clear that these main groups comprise different actors/stakeholders in the single CSAs or that there can be further groups of beneficiaries that are important
4.2 Empirical case study evidence This section gives an overview on the empirical evidence collected in Activity a) and Activity b), describing generally the main beneficiaries of landscape services as well as the individual benefits from landscape services use on basis of existing literature and expert knowledge in the 9 different CLAIM CSA. Figure 2 shows the particular part and elements of the framework being addressed in this section.
Figure 2: The CLAIM analytical framework as presented in van Zanten et al., (2013). The boxes and relations in the area within the dashed line are addressed in this section.
12
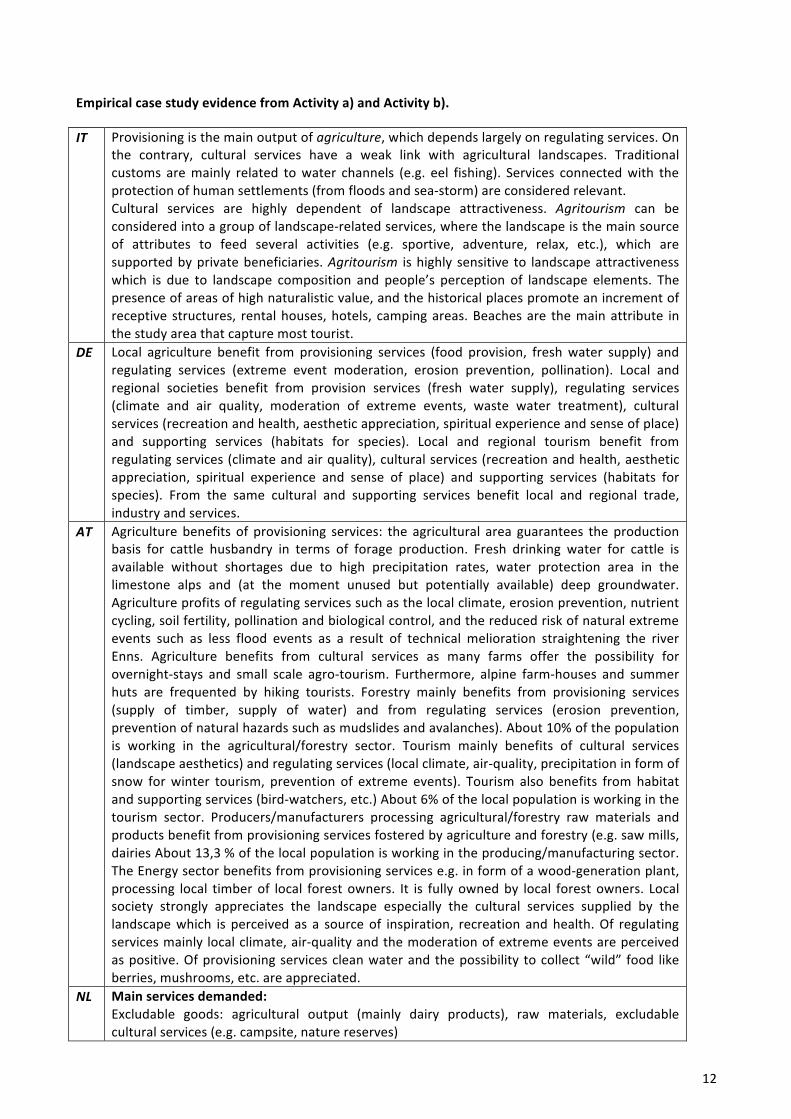
Empirical case study evidence from Activity a) and Activity b).
IT Provisioning is the main output of agriculture, which depends largely on regulating services. On the contrary, cultural services have a weak link with agricultural landscapes. Traditional customs are mainly related to water channels (e.g. eel fishing). Services connected with the protection of human settlements (from floods and sea-‐storm) are considered relevant. Cultural services are highly dependent of landscape attractiveness. Agritourism can be considered into a group of landscape-‐related services, where the landscape is the main source of attributes to feed several activities (e.g. sportive, adventure, relax, etc.), which are supported by private beneficiaries. Agritourism is highly sensitive to landscape attractiveness which is due to landscape composition and people’s perception of landscape elements. The presence of areas of high naturalistic value, and the historical places promote an increment of receptive structures, rental houses, hotels, camping areas. Beaches are the main attribute in the study area that capture most tourist.
DE Local agriculture benefit from provisioning services (food provision, fresh water supply) and regulating services (extreme event moderation, erosion prevention, pollination). Local and regional societies benefit from provision services (fresh water supply), regulating services (climate and air quality, moderation of extreme events, waste water treatment), cultural services (recreation and health, aesthetic appreciation, spiritual experience and sense of place) and supporting services (habitats for species). Local and regional tourism benefit from regulating services (climate and air quality), cultural services (recreation and health, aesthetic appreciation, spiritual experience and sense of place) and supporting services (habitats for species). From the same cultural and supporting services benefit local and regional trade, industry and services.
AT Agriculture benefits of provisioning services: the agricultural area guarantees the production basis for cattle husbandry in terms of forage production. Fresh drinking water for cattle is available without shortages due to high precipitation rates, water protection area in the limestone alps and (at the moment unused but potentially available) deep groundwater. Agriculture profits of regulating services such as the local climate, erosion prevention, nutrient cycling, soil fertility, pollination and biological control, and the reduced risk of natural extreme events such as less flood events as a result of technical melioration straightening the river Enns. Agriculture benefits from cultural services as many farms offer the possibility for overnight-‐stays and small scale agro-‐tourism. Furthermore, alpine farm-‐houses and summer huts are frequented by hiking tourists. Forestry mainly benefits from provisioning services (supply of timber, supply of water) and from regulating services (erosion prevention, prevention of natural hazards such as mudslides and avalanches). About 10% of the population is working in the agricultural/forestry sector. Tourism mainly benefits of cultural services (landscape aesthetics) and regulating services (local climate, air-‐quality, precipitation in form of snow for winter tourism, prevention of extreme events). Tourism also benefits from habitat and supporting services (bird-‐watchers, etc.) About 6% of the local population is working in the tourism sector. Producers/manufacturers processing agricultural/forestry raw materials and products benefit from provisioning services fostered by agriculture and forestry (e.g. saw mills, dairies About 13,3 % of the local population is working in the producing/manufacturing sector. The Energy sector benefits from provisioning services e.g. in form of a wood-‐generation plant, processing local timber of local forest owners. It is fully owned by local forest owners. Local society strongly appreciates the landscape especially the cultural services supplied by the landscape which is perceived as a source of inspiration, recreation and health. Of regulating services mainly local climate, air-‐quality and the moderation of extreme events are perceived as positive. Of provisioning services clean water and the possibility to collect “wild” food like berries, mushrooms, etc. are appreciated.
NL Main services demanded: Excludable goods: agricultural output (mainly dairy products), raw materials, excludable cultural services (e.g. campsite, nature reserves)
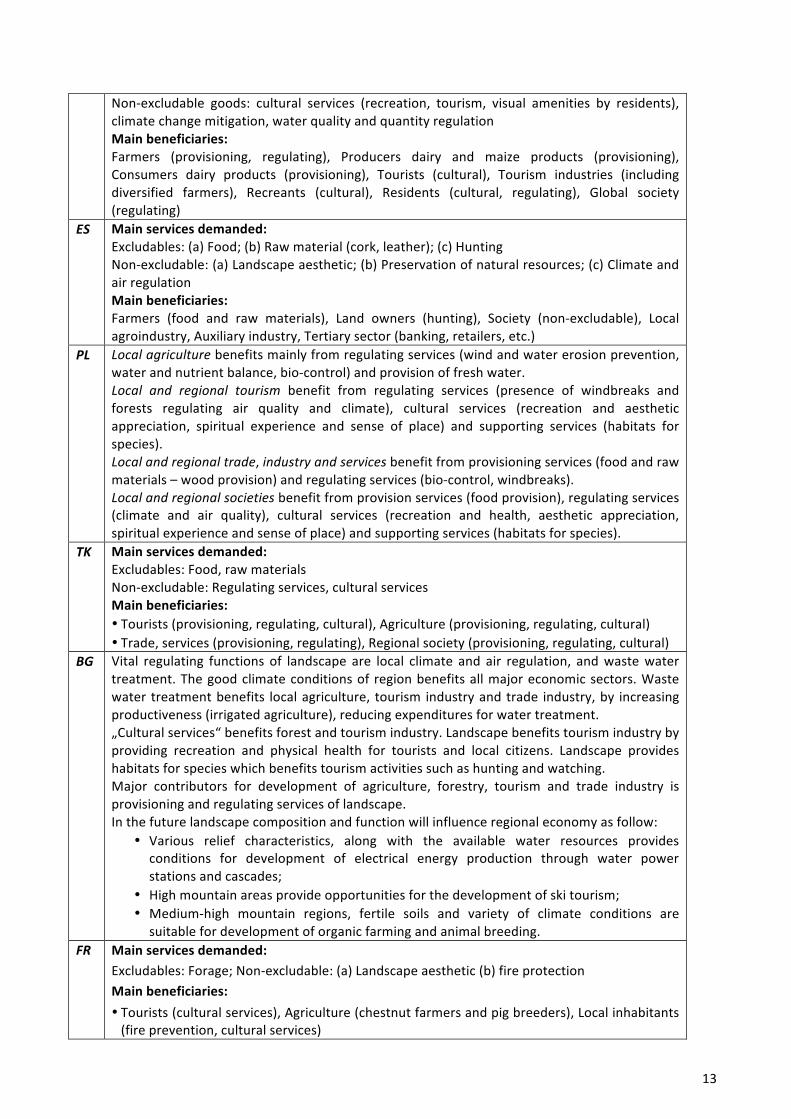
13
Non-‐excludable goods: cultural services (recreation, tourism, visual amenities by residents), climate change mitigation, water quality and quantity regulation Main beneficiaries: Farmers (provisioning, regulating), Producers dairy and maize products (provisioning), Consumers dairy products (provisioning), Tourists (cultural), Tourism industries (including diversified farmers), Recreants (cultural), Residents (cultural, regulating), Global society (regulating)
ES Main services demanded: Excludables: (a) Food; (b) Raw material (cork, leather); (c) Hunting Non-‐excludable: (a) Landscape aesthetic; (b) Preservation of natural resources; (c) Climate and air regulation Main beneficiaries: Farmers (food and raw materials), Land owners (hunting), Society (non-‐excludable), Local agroindustry, Auxiliary industry, Tertiary sector (banking, retailers, etc.)
PL Local agriculture benefits mainly from regulating services (wind and water erosion prevention, water and nutrient balance, bio-‐control) and provision of fresh water. Local and regional tourism benefit from regulating services (presence of windbreaks and forests regulating air quality and climate), cultural services (recreation and aesthetic appreciation, spiritual experience and sense of place) and supporting services (habitats for species). Local and regional trade, industry and services benefit from provisioning services (food and raw materials – wood provision) and regulating services (bio-‐control, windbreaks). Local and regional societies benefit from provision services (food provision), regulating services (climate and air quality), cultural services (recreation and health, aesthetic appreciation, spiritual experience and sense of place) and supporting services (habitats for species).
TK Main services demanded: Excludables: Food, raw materials Non-‐excludable: Regulating services, cultural services Main beneficiaries: • Tourists (provisioning, regulating, cultural), Agriculture (provisioning, regulating, cultural) • Trade, services (provisioning, regulating), Regional society (provisioning, regulating, cultural)
BG Vital regulating functions of landscape are local climate and air regulation, and waste water treatment. The good climate conditions of region benefits all major economic sectors. Waste water treatment benefits local agriculture, tourism industry and trade industry, by increasing productiveness (irrigated agriculture), reducing expenditures for water treatment. „Cultural services“ benefits forest and tourism industry. Landscape benefits tourism industry by providing recreation and physical health for tourists and local citizens. Landscape provides habitats for species which benefits tourism activities such as hunting and watching. Major contributors for development of agriculture, forestry, tourism and trade industry is provisioning and regulating services of landscape. In the future landscape composition and function will influence regional economy as follow:
• Various relief characteristics, along with the available water resources provides conditions for development of electrical energy production through water power stations and cascades;
• High mountain areas provide opportunities for the development of ski tourism; • Medium-‐high mountain regions, fertile soils and variety of climate conditions are
suitable for development of organic farming and animal breeding. FR Main services demanded:
Excludables: Forage; Non-‐excludable: (a) Landscape aesthetic (b) fire protection Main beneficiaries: • Tourists (cultural services), Agriculture (chestnut farmers and pig breeders), Local inhabitants (fire prevention, cultural services)

14
From the results of the literature and expert knowledge based overview in 9 CSA in Activity a), which has been validated by the stakeholder process in Activity b), it becomes apparent that the main beneficiaries of agricultural landscape services are local agriculture, local tourism and local inhabitants (see also Table 3). It also becomes obvious, that the beneficiary impact of landscape services on sectors, which profit of services not directly, but rather “second order” (Local trade/industry/services) is considerably lower. While agriculture mainly benefits from provisioning and regulating landscape services, tourism mainly benefits from cultural services such as, landscape aesthetics. Local inhabitants appear to be the mayor beneficiaries of the broadest range of landscape services.
Table 3: Overview on landscape services and beneficiaries
CSA Landscape services Local agriculture
Local Forestry
Local Tourism
Local trade/ industry/services Local society
IT Provisioning services + Regulating services + + Cultural services + Supporting services
DE Provisioning services + + Regulating services + + + Cultural services + + + Supporting services + + +
AT Provisioning services + + + + Regulating services + + + + Cultural services + + + Supporting services +
NL Provisioning services + Regulating services + + Cultural services + + Supporting services
ES Provisioning services + + Regulating services + Cultural services + + Supporting services +
PL Provisioning services + + + Regulating services + + + + Cultural services + + Supporting services + +
TK Provisioning services + + + + Regulating services + + + + Cultural services + + + Supporting services BG Provisioning services + + + +
Regulating services + + + + + Cultural services + + Supporting services +
FR Provisioning services + Regulating services + Cultural services + Supporting services
Overall: Local
agriculture Local
Forestry Local
Tourism Local trade/
industry/ services Local society
Provisioning services +++++++++ ++ ++ +++++ ++++ Regulating services +++++++ ++ +++++ +++ +++++++++ Cultural services ++ +++++++++ + +++++++ Supporting services ++++ + +++
15
In general, the services groups provisioning, regulating and cultural all appear to generate benefits which are of similar importance. Supporting services are those creating the least perceivable socioeconomic benefits. This finding is in line with the general understanding that supporting services, such as soil formation, photosynthesis, and nutrient cycling, do not directly provide benefits but are the basis for provisioning, regulating and cultural services which more directly provide benefits for the local economy (see e.g. MEA, 2005a, p. vi; Haynes-‐Young & Potschin, 2010))
5 The contribution of landscape service valorisation to regional competitiveness
5.1 Conceptual understanding The outcome of Activity a), and b) show, that the services groups provisioning, regulating and cultural all are perceived as valuable by the respective beneficiaries and also assumed to create benefits that potentially can contribute to the development and competitiveness of the regions where benefits are created. The results of the ANP in Activity d) show, that the behaviour of economic actors, the socioeconomic benefits created by the use of landscape services as well as the contribution of these benefits to regional competitiveness strongly impact on the demand and supply of landscape services. All results of Activity a) b) and d) together evidence an understanding, that the socio-‐economic benefits of the use and valorisation of landscape services directly and/or indirectly contribute to the economic performance and the societal welfare of the region.
On basis of the results of WP4’s activity a), and in line with the validation process in WP4’s activity b), it becomes clear that the main knowledge gaps within the CLAIM framework are the cause-‐effect chains between the supply of private and public good-‐type landscape services, the valorisation of these services and the effects that finally lead to the development and competitiveness of rural regions as a result of the use and valorisation of landscape services.
5.2 Empirical case study evidence
To assess the cause-‐effect relations that potentially transform landscape into a driver of regional competitiveness, in WP4s Activity c) specific original studies on the effects of landscape on economic activities and society welfare have been carried out in the different CSAs. This section gives an overview over particular studies which evidence cause-‐effect chains between landscape, its valorisation and regional competitiveness. Figure 3 shows the part and elements of the framework being addressed in this section.

16
Figure 3: The CLAIM analytical framework as presented in van Zanten et al., (2013). The boxes and relations in the area within the dashed line are addressed and tested by specific ad-‐hoc studies in Activity c).
5.2.1 The values of landscapes and landscape services
Different ad hoc studies have been conducted to assess the values of landscapes and landscape services for different economic actors in different regional contexts:
NL AH1
Evidences the relation Landscape structure ! preferences/(use of services)!values
Non-‐monetary and monetary choice experiment: “Visitors’ landscape preference for a set of specific landscape attributes using visualized choice experiments” The study estimates qualitative preferences and willingness to pay of visitors for different landscape alternatives (landscape aesthetics).
Landscape elements: Livestock, diversity of agricultural land, extent green linear elements, extent point elements WTPs monetary attribute: Extra costs for overnight stays
FS Beneficiaries/ benefits Visitors, tourists
Main Results Landscape elements of high importance for economic activity tourism (preference as well as WTP) (esp. high and medium levels of linear elements and the presence of livestock)
PL AH2 /3
Evidences the relation Landscape structure/ elements ! values
Thurstone model of statistical judgement: “What are the preferences of stakeholders towards landscape components and how good is awareness of landscape services among different groups of stakeholders” The study evaluates the preferences and importance of economic and environmental functions and benefits of shelterbelts in the Chlapowski landscape park. Economic functions: habitat for beneficial insects and nectar plants, source of raw materials, prevention against wind erosion, water storage, attraction for tourists. Environmental functions: habitat for species, habitat for nectar plants, protection against wind, shelter from the sun, water treatment and sequestration, climate and air quality regulation
FS Beneficiaries/ benefits
Main Results • Farmers’ preference dependent on economic utility: fields and pastures.

17
Farmers Inhabitants inside park, Inhabitants outside park, visitors
• Inhabitants/visitors preference focuses on “aesthetic” elements. • Visitors overvalue the environmental and economic value of all landscape elements. • Farmers can estimate value of landscape elements the best. • Economically shelterbelts would not be established voluntarily.
BG AH4
Evidences the relation Landscape structure/ elements ! values
Choice experiment: “Consumers preferences to the landscape composition in wine tourism – Results of a choice experiment” Landscape elements: vineyard; hill; mountain; wine restaurant /enoteka/; building of winery; cellar with barrels; traditions; history; village; location/short destination
Beneficiaries/ benefits wine tourism
Main Results Landscape elements, which are created by man hand (such as wine cellar, vineyard, and restaurant), are more important to the wine tourists than natural ones (mountain, hill, landscape). In this context, management can control the first landscape elements and combines them successfully with natural resources. As a result, it achieves an attractive and competitive product. Also can be achieved second order effects such as the development of related industries, preserving local traditions and promotion of historic remains in the region
5.2.2 Landscape values, landscape valorization: link or gap?
One of the Italian ad-‐hoc studies gives strong evidence to the link/gap between the values that are attributed to landscape elements and the “valorization” of landscape services:
IT AH1
Evidences the relation Landscape structure/elements ! Benefits and valorisation !(Landscape service use)
Latent class factor Model: “Landscape perception and ecosystem service uses: Results from surveys and latent variable models” The study investigates the relationship between the relevance attributed to relevant components of agricultural landscape in the CSA and the behaviour in ecosystem service use. Survey on inhabitants: Relevance of landscape components for the economic actors agriculture, tourism, inhabitants, commercial sector. Valorisation criteria of landscape elements: advantage or disadvantage for the respective sector Survey on tourists: Relevance of landscape components for holiday location choice
Beneficiaries/ benefits inhabitants, agricultural sector and tourism
Main Results landscape values • Landscape elements are mainly considered as an advantage. • For agricultural sector as long as they are not too natural or protected (rare flora/fauna is rather disadvantageous)
• For tourism the same while mainly tourism targeted LS elements (pathways, protection areas) are advantageous
• For inhabitants also mainly targeted LS elements are relevant Main Results landscape service valorisation • awareness/importance attributed to landscape is in general positively associated to the attitude to use landscape services.
• The relevance of these results is mitigated by the low dimension of the groups identified. The results show that only 9% of the residents appreciate landscape elements associated to a high use of landscape services (both recreational activities and local product purchases. This percentage increases to 19% considering the tourist model. This opens the question on choosing the best strategy to exploit the agricultural landscape in order to improve local competiveness, which may involve increase the knowledge on positive landscape aspects, acting on landscape management in order to improve further landscape features, valorise local landscape services towards a wider population
18
!, no “direct link” can be discovered between the awareness/importance attributed to landscape and attitude to consume local products
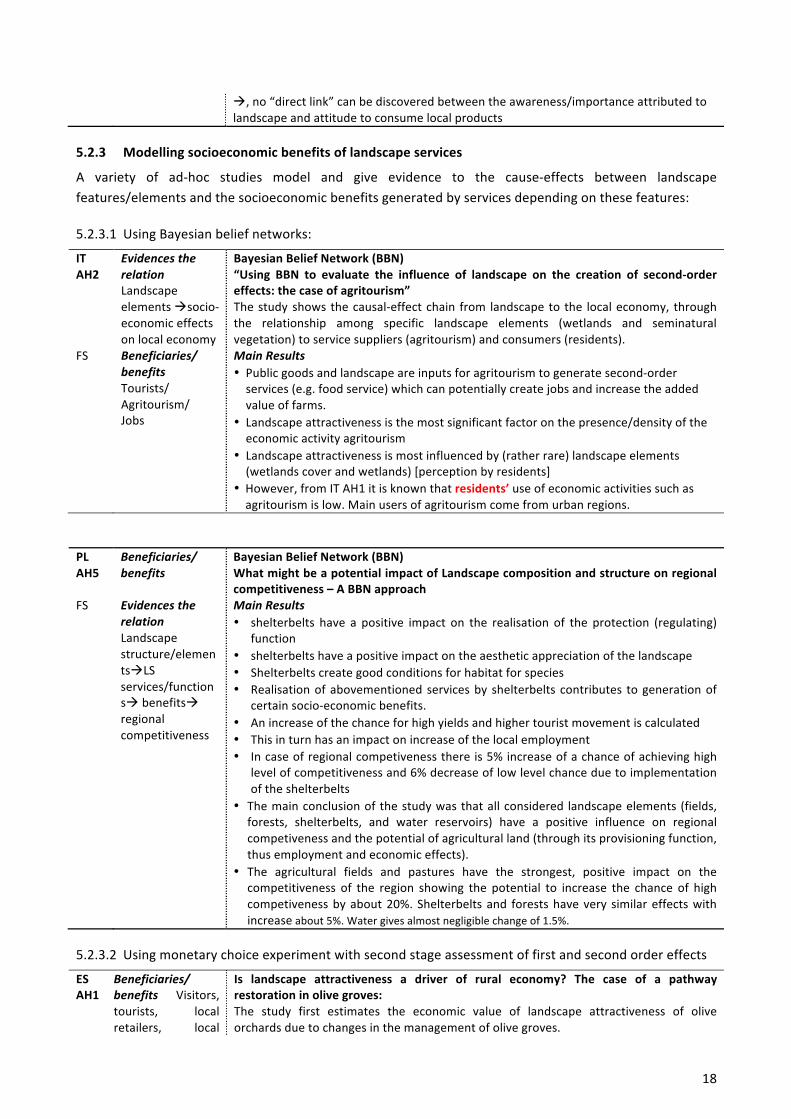
5.2.3 Modelling socioeconomic benefits of landscape services
A variety of ad-‐hoc studies model and give evidence to the cause-‐effects between landscape features/elements and the socioeconomic benefits generated by services depending on these features:
5.2.3.1 Using Bayesian belief networks:
IT AH2
Evidences the relation Landscape elements !socio-‐economic effects on local economy
Bayesian Belief Network (BBN) “Using BBN to evaluate the influence of landscape on the creation of second-‐order effects: the case of agritourism” The study shows the causal-‐effect chain from landscape to the local economy, through the relationship among specific landscape elements (wetlands and seminatural vegetation) to service suppliers (agritourism) and consumers (residents).
FS Beneficiaries/ benefits Tourists/ Agritourism/ Jobs
Main Results • Public goods and landscape are inputs for agritourism to generate second-‐order services (e.g. food service) which can potentially create jobs and increase the added value of farms.
• Landscape attractiveness is the most significant factor on the presence/density of the economic activity agritourism
• Landscape attractiveness is most influenced by (rather rare) landscape elements (wetlands cover and wetlands) [perception by residents]
• However, from IT AH1 it is known that residents’ use of economic activities such as agritourism is low. Main users of agritourism come from urban regions.
PL AH5
Beneficiaries/ benefits
Bayesian Belief Network (BBN) What might be a potential impact of Landscape composition and structure on regional competitiveness – A BBN approach
FS Evidences the relation Landscape structure/elements!LS services/functions! benefits! regional competitiveness
Main Results • shelterbelts have a positive impact on the realisation of the protection (regulating)
function • shelterbelts have a positive impact on the aesthetic appreciation of the landscape • Shelterbelts create good conditions for habitat for species • Realisation of abovementioned services by shelterbelts contributes to generation of
certain socio-‐economic benefits. • An increase of the chance for high yields and higher tourist movement is calculated • This in turn has an impact on increase of the local employment • In case of regional competiveness there is 5% increase of a chance of achieving high
level of competitiveness and 6% decrease of low level chance due to implementation of the shelterbelts
• The main conclusion of the study was that all considered landscape elements (fields, forests, shelterbelts, and water reservoirs) have a positive influence on regional competiveness and the potential of agricultural land (through its provisioning function, thus employment and economic effects).
• The agricultural fields and pastures have the strongest, positive impact on the competitiveness of the region showing the potential to increase the chance of high competiveness by about 20%. Shelterbelts and forests have very similar effects with increase about 5%. Water gives almost negligible change of 1.5%.
5.2.3.2 Using monetary choice experiment with second stage assessment of first and second order effects
ES AH1
Beneficiaries/ benefits Visitors, tourists, local retailers, local
Is landscape attractiveness a driver of rural economy? The case of a pathway restoration in olive groves: The study first estimates the economic value of landscape attractiveness of olive orchards due to changes in the management of olive groves.

19
society It further analyses the increase in the recreational demand which arises from the improved landscape attractiveness by gathering information about the probability of visiting the agricultural landscapes as a function of the visual elements investigated. It estimate the economic impact that the recreation demand associated to landscape attractiveness has on local economy and rural development (SOEs) via a benefit transfer and using a Social Account Matrix (SAM) to provide evidences between the linkage of landscape features, local development and social welfare
FS Evidences the relation Landscape structure/elements ! preferences ! demand for services !competitiveness
Main Results • the presence of specific landscape features (green cover, stonewalls and woodland
islets) originates a set of benefits to the rural areas where they are located: • they generate revenues related to the use of the landscape. • they contribute to the conservation of the environment by reducing the soil erosion,
preserving the biodiversity and reducing the agriculture contribution to climatic change.
• they produce an improvement in the rural economies by triggering a set of second order effects which are related to the visitors’ expenditure and to the economic activities which originates to satisfy the increasing marginal touristic demand (income or employment in a local or regional economy)
5.2.3.3 Modelling the influence of landscape elements on farm performance with farm optimization model
PL Beneficiaries/ benefits farmers
Farm optimisation model “The impact of shelterbelts and CAP’s greening measures on landscape composition and farm performance in the Chlapowski landscape park” • Assessment of 6 policy scenarios
AH6 Evidences the relation Landscape structure/ elements ! farm performance
Main Results • maintaining shelterbelts has a positive impact on productivity and profitability of agricultural sector
• CAP scenarios that assume removal of the shelterbelts show the strong negative influence on the level of Net Farm Incomes. Even relatively small decrease of the share of high profit cash crops in the cropping structure (due to reduction of wind-‐protection) could, have a strong negative influence on the economic performance of farms in the case study area
5.2.4 Landscape and regional competitiveness: Is there a connection at all?
Two Austrian ad-‐hoc studies address the question of measuring competitiveness and assessing the potential impact of landscape and landscape management on second-‐order benefits (factors of competitiveness).
AT AH2
Evidences the relation Welfare and competitiveness ! back to possible drivers: non-‐landscape and landscape related factors
Data Envelopment Analysis: Measuring the influence of landscape on the competitiveness of rural areas – an Austrian case study on municipality level (DEA)
Measuring regional competitiveness and finding the influence of landscape and non-‐ landscape related factors on indicators of regional competitiveness (demography, employment, education, tax revenues)
Beneficiaries Population
Benefits Education, economic performance,
Main Results • Remoteness of an area hinders competitiveness • Landscape’s influence is weak, rationality is the stronger factor (closeness to urban areas, infrastructure)
• Strong tourism fosters competitiveness

20
jobs, demography
AT AH3 First part
Evidences the relation First part of the study: Landscape structure, composition, services! socioeconomic benefits
Expert evaluation The impact of agricultural landscapes on rural development and regional competitiveness – Results of a short expert evaluation
How much is agricultural landscape perceived to impact on different factors of competitiveness and which actors within a rural society mainly benefit from landscape-‐valorisation. Furthermore, being assumed to have the strongest influence on agricultural landscape management and consequently on the landscape services provided, the study targets to assess the impact of different agro-‐environmental measures on regional competitiveness. Finally, the study addresses the question, if the actual development of the agricultural landscape management in the study region corresponds to a management which would be fostering regional development and competitiveness
Beneficiaries/ benefits Population, regional economy, tourism
Main Results • Landscape is evaluated to have mainly impacts on “soft” competitiveness factors (wellbeing, cultural heritage)
• “Economically” mainly regional products profit from landscape • Other economic factors such as labour market, local investments, etc. are only weakly influenced by landscape and its services
6 Socio-‐economic “second order” effects of the valorisation of landscape services
The use of services provided by a landscape can lead to economic activities which can create, influence or alter further economic activities, for example by developing the regional income side due to creating jobs for the local population or by developing the supplier side due to enhanced demand. In CLAIM’s WP4, major focus has been laid on the assessment of socio-‐economic effects through which the use of landscape services by different economic actors can contribute to the development and competitiveness of rural, agriculturally characterised regions. Through the experiences collected and the studies conducted in the nine CLAIM CSA, a broad knowledge on socio-‐economic benefits have been gathered.
The following table gives an overview on the main results of region specific socioeconomic effects of landscape service use: IT In the case study accommodation and food consumption are considered second-‐order services
produced by agritourisms as a consequence of an indirect use of ES and public goods, in such case agritourism act as a convertor of public goods into private goods, which contribute directly to local economy. Analysis of the emergence by means of an Agent Based Model (ABM) of second order effects resulting from the interactions among i) agri-‐environmental policies, ii) farmers and iii) “consumers”. In this context, the latent class models highlight that both residents and tourists tend to “attach” value to landscape quality by associating their positive perception of landscape features to an increased level of ES uses. IT Evidences the relation
Policy ! landscape attractiveness ! economic return for farmers ! valorisation of landscape potential
An Agent Based Model approach to the CSA 1 Ferrara Lowlands The model analyses the possibility to trigger “self-‐sustained” processes of landscape valorisation promoted by agri-‐environmental policies.
Beneficiaries/ benefits agricultural sector and tourism
Main Results • Agri-‐environmental policies might follow path-‐dependent patterns. Payments creates an attractive landscape that triggers rural tourism. If the area with

21
high environmental quality is sufficiently clusterized, the process of landscape valorization can be sustained even in the absence of agri-‐environmental payments..
The described models represent an exercise to create a virtual laboratory that can be used to test in which conditions the conservation and promotion of landscape features (e.g. wetlands, hedges, wild fauna) triggered by agri-‐environmental policies can become a “self-‐sustainable” process. Positive Multiplier effects: Agri-‐environmental measures aimed at landscape valorisation could help the take-‐off of multiplier effects. The awareness of farmers towards the economic opportunities underneath landscape valorisation can trigger new behaviours and new market products Positive Feedback loops: a high landscape attractiveness impulse the use of public goods and ES through both recreational activities (e.g. agritourism) and provisional services (e.g. local products). Raising awareness about landscape as an economic asset may drive landscape valorisation mechanisms and further develop consumers’ appreciation. Positive/Negative feedback loops: Intensive food production diminish the potential of landscape to offer other ES and public goods, influencing private activities such as agritourism. On the contrary, the attractiveness of landscape and high value of public goods could affect food production and promote the development of agritourism (diversification).
DE A. Provisioning services (agricultural production): through scale enlargement going along with land accumulation and ownership change it comes to intensification of management and uniformization of cropping pattern, what leads to an increase of added value generated by land used for food or biomass provisioning services, i.e. agricultural production. However, land owners are not necessarily inhabitants and tax payers of the region.
B. Trees and point elements are contributing to regulating (e.g. local climate), habitat (e.g. birds) and cultural (e.g. traditional landscape) services. The higher their removal (due to scale enlargement), the less is the appreciation of the landscape by visitors. There is indication for negative effects on tourism general, and on preferred location of visits and spendings (restaurants etc).
Keeping landscape open, and maintaining diversity and abundance of single point elements, but preventing natural succession and afforestation, contributes to habitat diversity and touristic attractiveness, which again leads to added value in the region. Grazing livestock (sheep, extensive cattle) is a management form that contributes to C., particularly in case of organic farming.
Positive Multiplier effects: • Provisioning services – capital market – land market prices: referring to A., in case of stock
market noted companies, the positive capital return attracts new investors and generates stock growth, what leads to increased competiveness on the land market and land purchase success of the big players.
• Provisioning services – habitat services – cultural services – tourism – diversification into non agricultural sector – added value in regional trade: In contrast to A. and B., in C. a high diversity of landscape elements with related provison of multiple services occurs, e.g. in case of organic farming. Increased related services enhance touristic demand and organic farmers and/or local trade take up direct marketing of further processed goods or gastronomic services at farm stead, or marketing of regional goods, what increases income in the non-‐agricultural sector.
Positive Feedback loops: • Provisioning services – habitat services – cultural services – tourism – diversification into non
agricultural sector – added value in regional trade – positive impact on health sector and tourism sector – added value generation: Positive feedback loops can in case C also result from

22
organic farming and its diversity in provision of cultural services, which increases tourist attraction, what again acts as a driver for investments into agro tourism and related incomes sources of other economic sectors (regional health sector with spa and specialised hospitals as well as touristic and gastronomic sector in general).
Positive/Negative feedback loops: • Provisioning services – capital market – land market prices -‐ habitat removal – relocation of
tourism – loss of added value in villages with intensive agriculture -‐ investments in new habitats): Positive/ negative(/positive) feedback loops related to case A. scale enlargement and the related income generation of large scale (even organic) agriculture however can generate additional costs for habitat substitution (generation of new habitats) in case of removal of previous naturally occurred but removed ones, and can put risk on economic efficiency of investments into tourism
Negative feedback loops: • Negative feedback loops due to agricultural intensification (case A) arise as visual appreciation
of the landscape by visitors decreases, what is probable to lead to tourist concentration in other , non-‐agriculturally used landscape compartments (e.g. forests , Buckower Kessel) , and related spendings by tourists (in restaurants, hotels, shops) will move out from predominantly agriculturally used areas.
AT • Effects of “non-‐landscape” and “landscape” related factors on the competitiveness of rural regions. The competitiveness is measured via DEA in form of efficiency scores taking into account the input-‐factor “population” and the socio-‐economic output-‐factors ”demographical chance”, “educational attainment”, “municipal tax” and “number of jobs”. All “Non-‐landscape” related factors (“Tourism”, “Closeness to semi-‐urban and urban regions”, “property tax”) influence the efficiency of rural regions significantly, but with rather low R². The influence of “landscape” related factors (“openness of landscape”, “existence of alpine pastures”, “attractive natural area”, “existence and character of mountains”) is far lower than non-‐landscape related factors and furthermore lower significance.
• Influence of agricultural landscape on single factors of competitiveness: Well-‐being of local population; preservation of cultural heritage; Marketing possibilities of regional products; jobs; Demography; infrastructural development; investments; the influence of landscape is only high on soft socioeconomic benefits
• Use of Provisioning services (agricultural production) in combination with cultural services: ! regional products ! added Value ! jobs ! enhanced production: The concept of dairy “Landgenossenschaft Ennstal”; The concept of enterprise “Heimatgold”
• Provisioning services (agricultural production): intensification and scale enlargement on the river valley area: on costs of cultural and supporting services; in favour for provisioning services by enhancing agricultural productivity
• Provisioning services (agricultural production): abandonment of alpine pastures on cost of cultural services, on cost of existing habitats or in favour for new forest habitats;
Positive Multiplier effects: Use of cultural services for marketing of regional products: !new economic activity (example “Heimatgold”): “Marketing of regional products”!1st step “supply side” multiplier: development of supplier side (enhanced production of regional product on local farms)! 2nd step supply side multiplier: development of second stage supplier (enhanced demand/supply of extern ingredients for regional product) Use of cultural services for marketing of regional products: !Maintenance/ enhancement of economic activity /Example “Landgenossenschaft Ennstal”): “Marketing of regional products”! 1st step “income side” multiplier: creation of jobs and income !2nd step supplier side multiplier: energy cogeneration plant for e.g. the dairy! 2nd step income side: income for forest owners Use of cultural landscape services for fostering of tourism ! in our study low impact

23
Negative Multiplier effects: Abandonment of high alpine meadows and pastures leads to decline of provisioning and cultural services
Positive Feedback loops: Regional products maintain/increase agricultural production (Landgenossenschaft Ennstal/Heimatgold)
NL Positive Multiplier effects: The attraction of the landscape with respect to recreation and tourism has positive multiplier effects with respect to the development of a tourism industry, construction works and creating a stable demand for a shopping centre, restaurants and cafes. The increased use of cultural services leads to an expanding tourism industry. Subsequently, tourists also explore the shops in Winterswijk.
Negative Multiplier effects:
There is only a decrease in provisioning services in the area, but this is a private type services according to the typology. No decrease in use of public landscape type services has been witnessed.
In addition, cultural services are used through ex-‐urbanization of retirees, which leads to an improved position of the real estate market and an increased demand for the local trade and services industries
Positive” feedback loops:
Use of cultural services – tourism industry – increased demand for regional products from agriculture
The use of cultural services by visitors benefits the tourism industries, but also contributes to the sale of regional products on farms. These services can be qualified as provisioning or cultural services.
“Negative” feedback loop:
The decrease of the use of cultural services related to recreation could decrease the demand for regional products.
ES In the area of study the rural tourism plays an important role in the economy of the region. The Natural Park Sierra de Cardeña y Montoro, where the Iberian lynx lives, is the main tourist attraction. The olive groves near the park have potential for other tourist activities (biking, hiking and horse riding) for inhabitants of the nearest city (43 km). Positive Multiplier effects: Developing of existing activity (rural tourism) Negative Multiplier effects: Pollution risk from visitors Positive Feedback loops: Increase of rural employment and trade: from new activities in the pathway, e.g. hiring bikes, and in the village (restaurants and local products shops). Third order effects: Higher economic activity implies higher tax revenues and increase of auxiliary companies (banking, manufacturing, etc). Positive/Negative feedback loops: Positive environmental impact. The three elements (stonewalls, cover crops and islets) has a positive impact on biodiversity and soil erosion prevention
PL • Income effects on the economy: additional income which derives from agricultural activity (food provision services) and from regulating function of the characteristic landscape element – shelterbelts (rows of trees). This effect was measured in Ad-‐hoc study 2, by the model simulating effects of shelterbelts on the farm level within different CAP policy scenarios including CAP after 2014 and also in Belief Network Approach is the Ad-‐hoc study 1.
• Maintenance and creation employment. Strong agricultural sector provides employment for
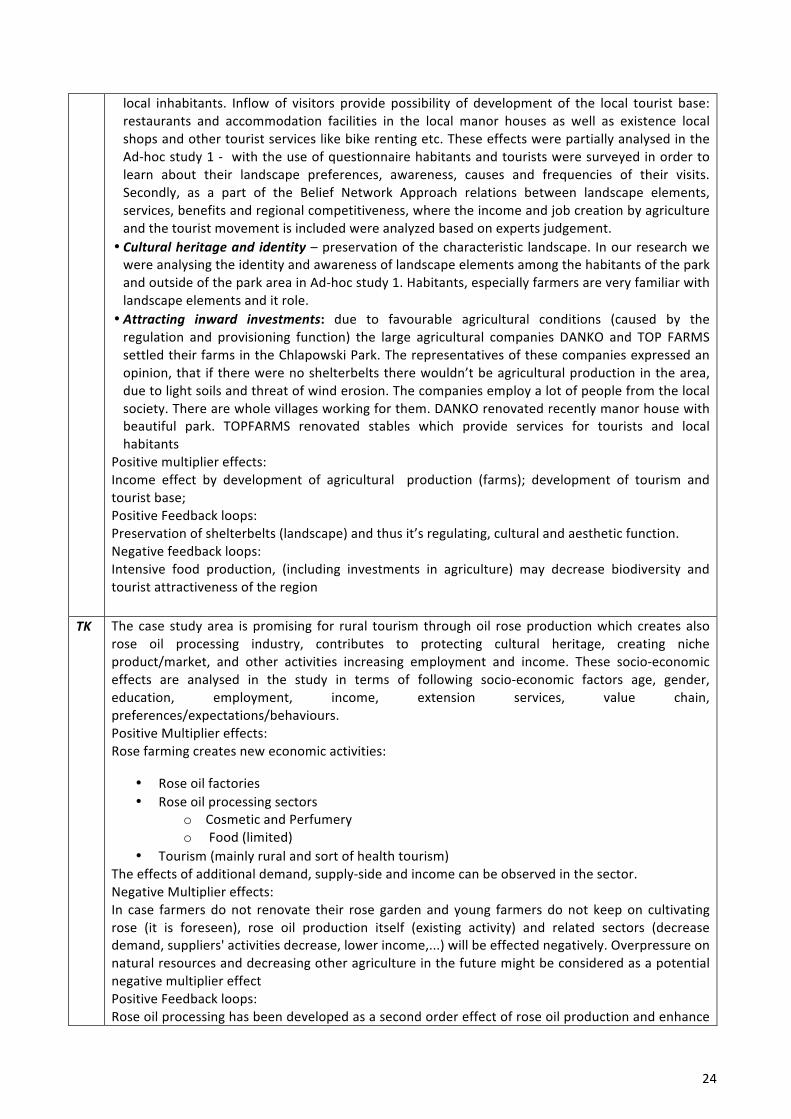
24
local inhabitants. Inflow of visitors provide possibility of development of the local tourist base: restaurants and accommodation facilities in the local manor houses as well as existence local shops and other tourist services like bike renting etc. These effects were partially analysed in the Ad-‐hoc study 1 -‐ with the use of questionnaire habitants and tourists were surveyed in order to learn about their landscape preferences, awareness, causes and frequencies of their visits. Secondly, as a part of the Belief Network Approach relations between landscape elements, services, benefits and regional competitiveness, where the income and job creation by agriculture and the tourist movement is included were analyzed based on experts judgement.
• Cultural heritage and identity – preservation of the characteristic landscape. In our research we were analysing the identity and awareness of landscape elements among the habitants of the park and outside of the park area in Ad-‐hoc study 1. Habitants, especially farmers are very familiar with landscape elements and it role.
• Attracting inward investments: due to favourable agricultural conditions (caused by the regulation and provisioning function) the large agricultural companies DANKO and TOP FARMS settled their farms in the Chlapowski Park. The representatives of these companies expressed an opinion, that if there were no shelterbelts there wouldn’t be agricultural production in the area, due to light soils and threat of wind erosion. The companies employ a lot of people from the local society. There are whole villages working for them. DANKO renovated recently manor house with beautiful park. TOPFARMS renovated stables which provide services for tourists and local habitants
Positive multiplier effects: Income effect by development of agricultural production (farms); development of tourism and tourist base; Positive Feedback loops: Preservation of shelterbelts (landscape) and thus it’s regulating, cultural and aesthetic function. Negative feedback loops: Intensive food production, (including investments in agriculture) may decrease biodiversity and tourist attractiveness of the region
TK The case study area is promising for rural tourism through oil rose production which creates also rose oil processing industry, contributes to protecting cultural heritage, creating niche product/market, and other activities increasing employment and income. These socio-‐economic effects are analysed in the study in terms of following socio-‐economic factors age, gender, education, employment, income, extension services, value chain, preferences/expectations/behaviours. Positive Multiplier effects: Rose farming creates new economic activities:
• Rose oil factories • Rose oil processing sectors
o Cosmetic and Perfumery o Food (limited)
• Tourism (mainly rural and sort of health tourism) The effects of additional demand, supply-‐side and income can be observed in the sector. Negative Multiplier effects: In case farmers do not renovate their rose garden and young farmers do not keep on cultivating rose (it is foreseen), rose oil production itself (existing activity) and related sectors (decrease demand, suppliers' activities decrease, lower income,...) will be effected negatively. Overpressure on natural resources and decreasing other agriculture in the future might be considered as a potential negative multiplier effect Positive Feedback loops: Rose oil processing has been developed as a second order effect of rose oil production and enhance

25
the other medical and aromatic plants farming (e.g. lavender) in the region: Rose farming creates(agriculture) rose oil processing(agro-‐industry); rose oil processing facilities (agro-‐industry) creates new activities (agriculture) and again enhances economic activities (related to new agricultural products, vertical and horizontal); enhancement existing activities
BG Direct effects 1. Creation and maintenance of jobs on farms (part time employment) and in hotel and
restaurants (full time employment). 2. Creation of added value – traditional culture and culinary add value to the wine tourism.
Specific local environmental conditions provide opportunities for local wines. 3. New investments in wine value chain (vineyards, wineries, hotels and restaurants). 4. Enhancement of land market activity.
Indirect effects 1. Preservation of local traditions in wine making. 2. Recreation and enhancement of cultural heritage and identity. 3. Enhancement the quality of life. 4. Development of tourist industry. 5. Enhancement recreational opportunities. 6. Income effects on the wider rural economy. 7. Loss of biodiversity.
Positive Multiplier effects: -‐ Income effects – wineries increase their income by direct sales due to wine tourism. -‐ Niche-‐market opportunities. -‐ New economy activities – tourist attractions, opportunities for spiritual sense. Negative Multiplier effects: Decreasing other agricultural activities (for example horticulture) Positive Feedback loops: Enhancement existing activities – transport, communication, constructing and trading. Positive/Negative feedback loops: Wine tourism dominates over other types of tourism (rural, hunting and cultural). Negative feedback loops: Insufficient usage of proper environmental conditions for producing vegetables and livestock.
FR Use of the vegetation growth supplyof meat supply of milk and cheese and other local products supply of fuel wood
Prevention of fire risks Positive Multiplier effects: The use of the spontaneous growth of the vegetation by the ruminants induce a production of milk, meat, wood that at its time induce local economy (tourism activity, retailers) Positive/Negative feedback loops: The use of the spontaneous growth of the vegetation by the ruminants is supposed to reduce the risk of fire Negative feedback loops: The only use of spontaneous growth let the vegetation tend to a non pasturable state and that hampers the livestock activity at long term It sems to us that the feedbacks effect impacts more the supply of the service than the demand for the service (the service is the growing biomass but its use is not always possible by the animals). More over when you are talking about second order effect (through demand or supply chains) you skip outside the ecosystem services, that is you go to “norma”l economy. In our mind another conception of the second order effect could be the use of one service (in our example the biomass by livestock) generates other service to another kind of population: for example the shepherds are

26
important to keep the landscape open because of the grazing of their animals, which facilitates ( or not) tracking or picking mushrooms etc ... The second order occurs through a new service and not through the economic chain as we understand from the Domansky’s pattern.
7 Synthesis: Discussion, Conclusion and lessons learned for the final framework The importance and impact of actors, landscape services, socioeconomic benefits and regional competitiveness in the landscape valorisation framework
The results of the ANP exercise confirm the conceptual connections of elements in the upper right hand box of the CLAIM conceptual framework. Particularly when looking at the priorities given to private good-‐type services in comparison to public good-‐type landscape services, the results of the ANP exercise show that people have a higher consciousness towards consumptive and marketable goods provided by a certain environment, than towards essential, but hardly discernible, benefits from the use of public good-‐type services (Polasky et al., 2010). In general the „classical“, agricultural system is perceived to play the most important role in the system (agriculture ! food !jobs and investment ! economic competitiveness). However, the results also show that public good type landscape services, and here first and foremost cultural services are regarded as important. The perception of public goods is clearly driven by regional specificities. So is, e.g. the protection function of utter importance in Corsica, Austria or Italy, where potential natural risks exist which are buffered by the regional landscape (CLAIM, 2014).
A policy implication of the study is that a more efficient and continuous communication strategy between scientists, decision makers, local administrations and civil society might reduce a knowledge distance and make population aware of the public heritage provided by the landscapes they are surrounded by. At the same time, the weight of different valorisation pathways can hint at priority areas for local policy design, particularly in connecting landscape-‐related and chain-‐related measures of the Rural Development Programmes. European governance strategies with regard to public good type service provision have to be context specific and have to consider regional conditions.
Landscape service use, beneficiaries and benefits
From the results of the literature and expert knowledge based overview in 9 CSA in Activity a), which has been validated by the stakeholder process in Activity b), it becomes apparent that the main beneficiaries of agricultural landscape services are local agriculture, local tourism and local inhabitants (see Table 2). It also becomes obvious, that the beneficiary impact of landscape services on sectors, which profit of services not directly, but rather “second order” (local trade/industry/services) is considerably lower. The benefits from the use of landscape services are actor-‐specific: While agriculture mainly benefits from provisioning and regulating landscape services, tourism mainly benefits from cultural services such as, landscape aesthetics. Local inhabitants appear to be the mayor beneficiaries of the broadest range of landscape services. In general, the services groups provisioning, regulating and cultural all appear to generate benefits which are of similar importance. Supporting services are those creating the least directly perceivable socioeconomic benefits, which obviously is due to there “supporting” character because of which they are indirectly valorised via the three other main service groups they support.
The contribution of landscape service valorisation to regional competitiveness
27
As regards the values of landscapes and landscape services, all valuation studies show high preferences of economic actors/consumers towards landscape. However, preferences are different for different actors/consumers. Common tourism clearly prefers landscapes rich in landscape elements (NL, PL). Besides of their preferences towards the cultural services of the landscape elements, tourist and visitors however tend to overvalue the environmental and economic functions of landscape elements. Specific tourism which follows clear objectives (wine tourism in BG) is only interested in attributes that directly are connected to the touristic objective. Agriculture clearly focuses on the economic usability of landscape elements and attributes values to landscape elements as soon as they provide an economic advantage (regulating services of shelterbelts in Poland).
Landscape values, landscape valorization: link or gap?
The results of the Italian study “Landscape perception and ecosystem service uses: Results from surveys and latent variable models” gives strong evidence that public goods and landscape elements are perceived as an advantage for economic actors. However, the study shows that in some cases a gap between expressed values of landscape services and actual service use exists. The values attributed to landscape services are not always “translated” into valorization by all consumer groups.
Socioeconomic “second order” benefits of landscape services
The two studies from Italy and Poland, evaluation socio-‐economic benefits of landscape services via Bayesian belief networks give strong evidence that public good-‐type landscape services create socioeconomic benefits for the regional economies.
The results of the Italian case study, modelling the influence of specific landscape elements on the creation of second-‐order effects for the case of agri-‐tourism give strong evidence that public good-‐type cultural services (landscape attractiveness) are inputs for economic activities such as agritourism. The study shows that to generate second-‐order services (e.g. food service), complex cause effect chains are run through: So does e.g. the wetlands cover support number of jobs and value added via the cause effect chain [landscape attractiveness!agritourism!seats for eating! increase of jobs and the added value of farms]. This cause effect chain is additionally affected by e.g. wetlands residents’ perception influencing landscape attractiveness and seats for eating via residents’ frequency. The Polish case study again gives strong evidence that landscape elements (shelterbelts) create private and public good – type services that create direct and indirect socioeconomic benefits that foster regional competitiveness. Also here it is seen that the cause-‐effect chains are complex: the shelterbelts in the case study region support competitiveness via [protection function ! yield], [landscape aesthetics ! tourism ! employment] and [habitat! tourism ! employment].
Also in the Monetary choice experiment of the Spanish ad-‐hoc study, which uses the case of a pathway restoration in olive groves to answer the question if landscape attractiveness is a driver of rural economy, gives strong evidence that the presence of specific landscape elements increases touristic demand and hold the potential for creating first order and second order socio-‐economic effects (visitor’s expenditures and multiplier effects). However, this study also makes clear that results are not general but context specific. For instance, for the Spanish case study results do not refer to all olive orchards mountainous landscapes, but only to the ones where green pathways exists (or are possible to be constructed) and are easily accessible (in practise are close to a urban area).
The influence of landscape elements on farm performance with farm optimization model

28
The case study from Poland, modelling the influence of landscape elements on farm performance with farm optimization model, gives strong evidence for the economic importance of specific landscape elements on agricultural performance (Win-‐Win scenario). CAP scenarios in the study, which assume a removal of the landscape elements “shelterbelts”, show the strong negative influence on the level of Net Farm Incomes. Even relatively small decrease of the share of high profit cash crops in the cropping structure (due to reduction of wind-‐protection) could, have a strong negative influence on the economic performance of farms in the case study area.
Landscape and regional competitiveness: Is there a connection at all?
Despite the obvious role and influence of public good-‐type landscape services in the system between landscape and regional competitiveness, the results of 2 case studies in Austria show, that the influence of solely landscape is not high. The data envelopment analysis in the Austrian region shows, that regional competitiveness is rather influenced by non-‐landscape factors such as the closeness to urban centres or semi-‐urban areas. It shows that the more remote an area, the less competitive it is, even if the landscape is beautiful and rich of potential landscape services – except if landscape is profoundly valorised by intensive tourism – on cost of cultural identity and authenticity.
The Austrian survey in line with the analysis of the stakeholder network active in the region shows, that landscape is valued mainly for its cultural, “soft” factors and highly appreciated. Nevertheless “economic” impacts are evaluated to be low (labour market, demography, investments).
Final conclusions:
• Landscape and the private and public good type services it provides is a driver of competitiveness • Economic actors, due to their activities (both demand and supply) influence the delivery of private
and public good type services. The provision of landscape services is directly affected by landscape "managers" such as the agriculture and forestry sector but also by "consumers/ demanders" of landscape services.
• There is a higher consciousness towards consumptive and marketable goods provided by a certain environment, than towards essential, but hardly discernible, benefits from the use of public good-‐type services.
• The studies show that also public good type landscape services drive competitiveness • Cause-‐effect chains between landscape services, socioeconomic benefits and regional
competitiveness are often complex and region specific. • European governance strategies with regard to public good provision have to be context specific and
have to consider regional conditions.
29
8 References Balderjahn, I., and Schnurrenberger B. ‘Der Standort Deutschland im Lichte der Standortpolitik
internationaler Unternehmen‘. (1999) Available at: http://opus.kobv.de/ubp/frontdoor.php?source_opus=917&la=de. Last accessed 24 March 2014
Bristow, G. (2005). Everyone’s a ‘winner’: problematising the discourse of regional competitiveness. Journal of Economic Geography, 5: 285-‐304.
CLAIM (2014) Report on Claim WP4, Task 2, Activity d) (Analytical Network Process). First periodic report of the EU FP7 project CLAIM. Available at (20.05.2014) http://www.claimproject.eu/docup/D4.20_Part_3.pdf
Cooper, T., Hart, K. and Baldock, D. ‘Provision of Public Goods through Agriculture in the European Union’. Report Prepared for DG Agriculture and Rural Development, Contract No 30-‐CE-‐0233091/00-‐28, Institute for European Environmental Policy: London. (2009)
Costanza, R., d’ Arge, R., De Groot, R., Farber, S., Grasso, M., Hannon, B., Limburg, K., Naeem, S.; O'Neill, R.V.; Paruelo, J.; Raskin, R.G.; Sutton, P. and van den Belt, M. ‘The value of the world’s ecosystem services and natural capital’, Nature, Vol. 387, (1997) pp.253-‐260
Courtney, P., Hill, G. and Roberts, D. ‘The role of natural heritage in rural development: an analysis of economic linkages in Scotland’, Journal of Rural Studies, 22, (2006) pp.469-‐484
De Groot, R., Alkemade, R., Braat, L., Hein, L. and L. Willemen. ‘Challenges in integrating the concept of ecosystem services and values in landscape planning, management and decision making’ Ecological Complexity Vol. 6, (2010). 453-‐462.
Diaz-‐Balteiro, L. and Romero, C. ‘Valuation of environmental goods: A shadow value perspective’, Ecological Economics, Vol. 64, (2008), pp 517–520
Dijkstra, L., Annoni P. & K. Kozovska (2011) A New Regional Competitiveness Index: Theory, Methods and Findings, European Union, regional policy no 02/2011
Dissart, J.C. and Vollet, D. ‘Landscapes and territory-‐specific economic bases’, Land Use policy, Vol. 28, (2011) pp.563-‐573
Domanski, B. & K. Gwosdz (2010), Multiplier effects in local and regional development, UAESTIONES GEOGRAPHICAE 29(2)
ENRD [European Network for Rural Development] ‘Thematic Working Group 3: Public Goods And Public Intervention, Final Report’ Brussels: European Network for Rural Development, (2010)
European Commission (1999a). Sixth Periodic Report on the Social and Economic Situation of Regions in the EU, 1999.
European Commission (1999b). Territorial competitiveness -‐ Creating a territorial development strategy in light of the LEADER experience, “Rural Innovation” Dossier n° 6 -‐ LEADER European Observatory
European Commission (2002 – 2013). Periodic reports on economic, social and territorial cohesion. Report from the commission. In: http://ec.europa.eu/regional_policy/information/reports/index_en.cfm
European Commission (2010). EU Regional competitiveness Index 2010. Publications Office of the European Union, Luxembourg, 2010
European Commission (2009). European Competitiveness Report 2008, Communication from the Commission COM(2008) 774 final. European Commission, Luxembourg, 2009

30
Fieldsend, A. ‘Determining the Socio-‐economic Value of Agricultural Landscape’, Horticulture, Vol. 68, (2011a) pp. 338-‐347
Fieldsend, A. F. and K. Kerekes. (2011b). Contrasting prospects for new sources of rural employment in two regions of the European Union. Rural Areas and Development Series 8, Rural Development: Quo Vadis? 7-‐21
Florida, R., (2000). The Economic Geography of Talent. SWIC Working Papers, September. 2000.
Haines-‐Young, R. and Potschin, M. ‘The links between biodiversity, ecosystem services and human well-‐being’, In: RAFFAELLI, D.G. and FRID, C.L.J., eds., Ecosystem ecology: a new synthesis. Cambridge University Press. (2010) pp. 110-‐139
Hein, L., van Koppen, K., de Groot, R. and van Ierland, E. ‘Spatial scales, stakeholders Huggins, R. (2003). Creating a UK Competitiveness Index: regional and local benchmarking. Regional Studies 37(1), pp. 89-‐96.
Huggins, R. and W. Davies (2006). European Competitiveness Index 2006-‐07. Robert Huggins Associates Ltd. 2006
Huggins, R. and J. Day (2006). UK Competitiveness Index, 2006: University of Wales Institute, Cardiff – UWIC: Robert Huggins Associates Ltd.
Huggins, R and P. Thompson (2010).. UK Competitiveness Index, 2010. Centre for International Competitiveness, University of Wales Institute, Cardiff, 2010
IMD (2000).The World Competitiveness Yearbook, Lausanne, 2000.
Krugman, P. (1990). The Age of Diminished Expectations. Cambridge MA, MIT Press, p.9.
Krugman, P. (1994a). Competitiveness: A Dangerous Obsession’, Foreign Affairs, Vol. 73(2), pp. 28-‐44.
Krugman, P. (1994b). The myth of competitiveness, Foreign Affairs.
Krugman, P: (1996) Pop Internationalism. MIT Press Cambridge
Martin, L.; Westgren, R. and Van Duren, E. (1991). Agribusiness Competitiveness across National Boundaries. American Journal of Agricultural Economics 73, 1456–1464
Martin, R., Kitson, M. and P.Tyler (2006). Regional Competitiveness. London: Routledge.
Meyer-‐Stamer, J. (2008). “Systematic Competitiveness and Local Economic Development.” In Shamin Bodhanya (ed.) Large Scale Systemic Change: Theories, Modelling and Practices. http://www.meyer-‐stamer.de/2008/Systemic+LED_SouthAfrica.pdf
Millennium Ecosystem Assessment (MEA) (2005). Ecosystems and well-‐being. Washington, DC: Island Press.
Millennium Ecosystem Assessment, (2005a): Ecosystems and Human Well-‐being: Synthesis, Island Press, Washington, DC.
Müller, F., de Groot, R. and Willemen, L. (2010) ‘Ecosystem Services at the Landscape Scale: the Need for Integrative Approaches’, Landscape Online, Vol. 23, pp.1-‐11.
OECD (2001): Multifunctionality. Towards an analytical framework, OECD Publication services, Paris, France
OECD (2010). OECD Regional Typology. Directorate for Public Governance and Terretorial Development. In: http://www.oecd.org/gov/regional-‐policy/42392595.pdf(12.02.2014).
Porter, M and C.Ketals (2003). UK Competitiveness: Moving to the Next Stage, DTI Economics Paper No. 3, Economic and Social Research Council and Department of Trade and Industry, p.11.
Porter, M. (1992). Competitive Advantage: creating and sustaining superior performance. London: PA consulting group, p. 40.

31
Power, A.G. (2010) ‘Ecosystem services and agriculture: tradeoffs and synergies’, Philosophical Transactions of the Royal Society, Vol. 365, pp.2959-‐2971
Ritsilä, J. J. (1999). Regional Differences in Environments for Enterprises, Entrepreneurship & Regional Development, 1999, Vol. 11, pp. 187-‐202.
Rudd, M.A. (2009) ‘Nonmarket Economic Valuation and “The Economist’s Fallacy”’, Journal of MultiDisciplinary Evaluation, Vol.6, pp.112 -‐ 115
Schaeffer, P. (2008) ‘Thoughts concerning the economic valuation of landscapes’, Journal of environmental management, Vol. 89, pp. 146-‐154
Schwab, K. and M. Porter (2007). The Global Competitiveness Report 2007-‐2008. World Economic Forum. Geneva, Switzerland
TEEB (2010) ‘The economics of ecosystems and biodiversity: mainstreaming the economics of nature: a synthesis of the approach, conclusions and recommendations of TEEB’
Thomson, N. & N. Ward (2005). Rural Areas and Regional Competitiveness, Centre for Rural Economy Research Report, Report to Local Government Rural Network ISBN 1 903964 23 7
van der Meulen, V., Verspecht, A., Vermeire, B., van Huylenbroek, G., Gellynck, X. ‘The use of economic valuation to create public support for green infrastructure investments in urban areas’, Landscape and Urban Planning, Vol. 103, (2011) pp.198-‐206
Van Zanten, B.T. Verburg, P.H., Espinosa, M., Gomez-‐y-‐Paloma, S., Galimberti, G., Kantelhardt, J., Kapfer, M., Lefebvre, M., Manrique, R., Piorr, A., Raggi, M., Schaller, L., Targetti, S., Zasada I. and Viaggi, D. (2014). European agricultural landscapes, common agricultural policy and ecosystem services: a review. Agronomy for Sustainable Development, 34(2), 309–325. doi:10.1007/s13593-‐013-‐0183-‐4


