Creating maps and other geographical
visualizations from census data
UK Data Service Census Support census geography courseUniversity of Edinburgh6th June 2013
Carol BlackwoodUK Data ServiceEDINA
The power of maps
• Mapping census data reveals patterns hidden in tabular data
• Using GIS allows you to be creative and flexible
• Highlight the features that are important to your research

Types of maps
• Common maps used when looking at census data
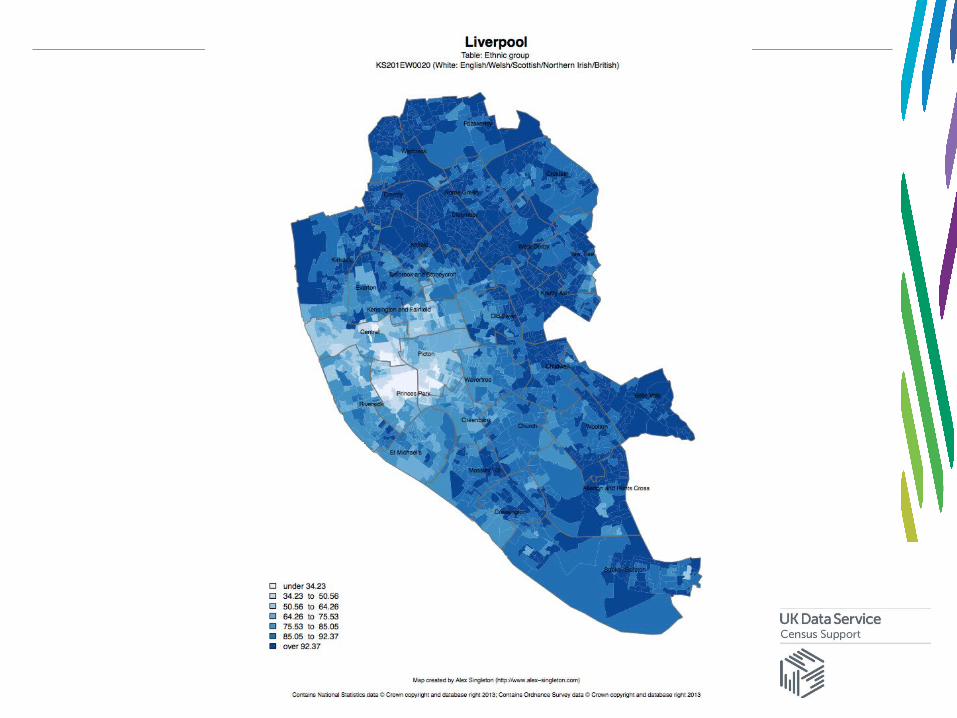
• Choropleth map• A thematic map shaded according to a variable e.g.
population, age
• Cartogram• A thematic map where land area is shown in proportion to
the variable of interest
District outlines
DIGITAL BOUNDARY DATA
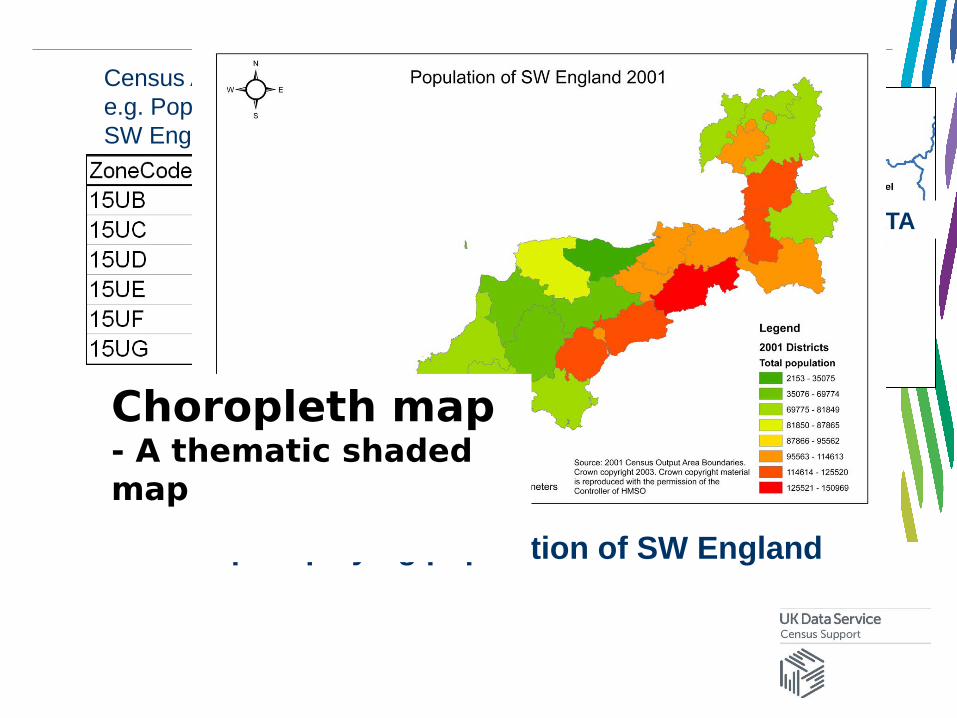
Census Aggregate Statisticse.g. Population by district of SW England
=
Map displaying population of SW England
Choropleth map- A thematic shaded map

edin_oa_no_heating
percent
0.000000 - 6.250000
6.250001 - 15.710000
15.710001 - 29.270000
29.270001 - 47.620000
47.620001 - 82.350000
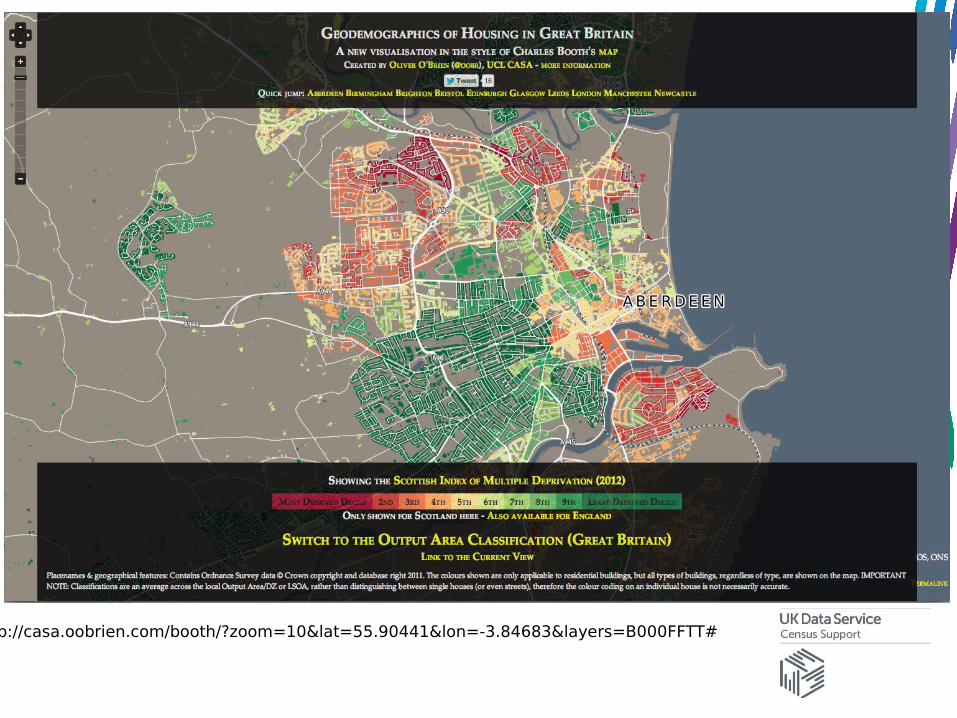
http://casa.oobrien.com/booth/?zoom=10&lat=55.90441&lon=-3.84683&layers=B000FFTT#
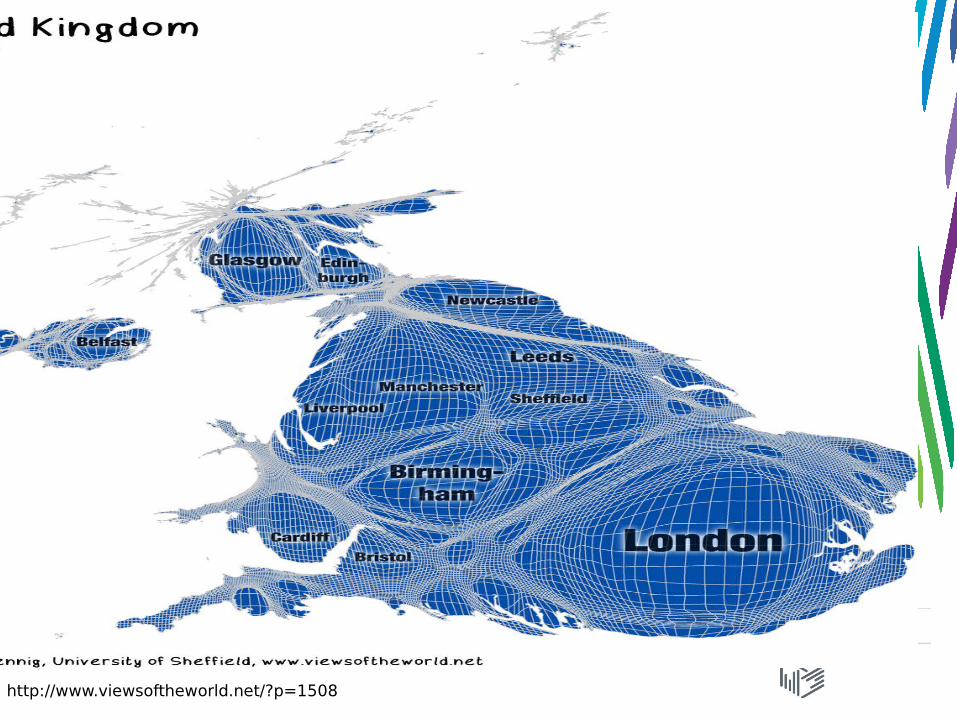
http://www.viewsoftheworld.net/?p=1508
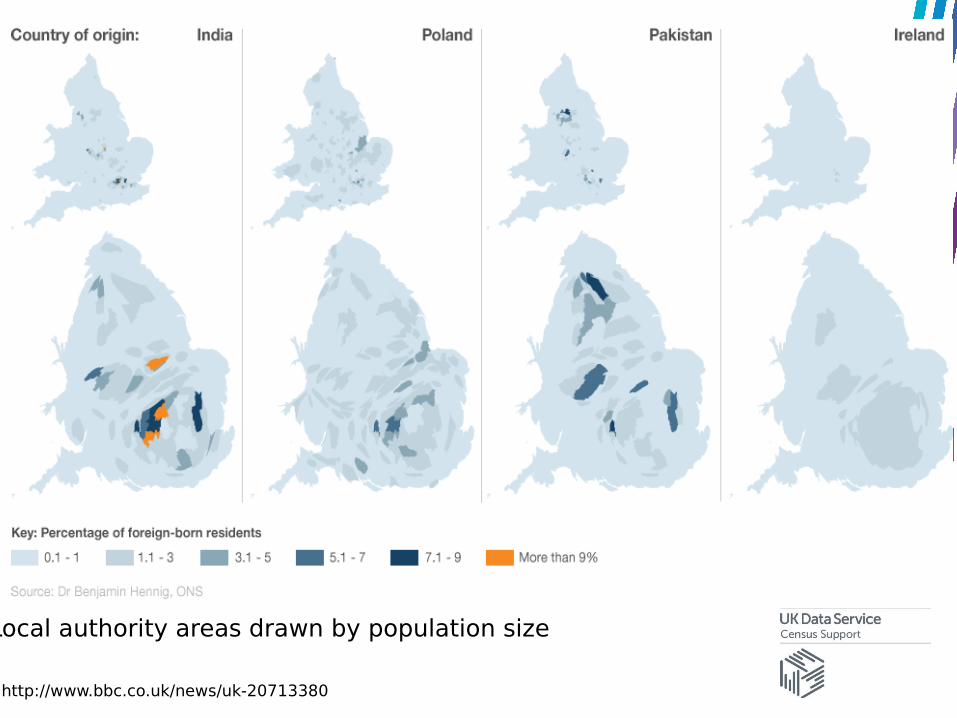
http://www.bbc.co.uk/news/uk-20713380
Local authority areas drawn by population size

Creating your own maps
• Many options for creating thematic maps including…
• Create choropleth maps using GIS
• Thematic Mapper - http://thematic.edina.ac.uk/thematic/map
• Cartogrammar - http://cartogrammar.edina.ac.uk

CAS postcode sectors sized by 2001 population


