Coulomb crystal mixtures in white dwarf cores and neutron star crustsA. A. Kozhberov and D. A. Baiko Citation: Physics of Plasmas 22, 092903 (2015); doi: 10.1063/1.4930215 View online: http://dx.doi.org/10.1063/1.4930215 View Table of Contents: http://scitation.aip.org/content/aip/journal/pop/22/9?ver=pdfcov Published by the AIP Publishing Articles you may be interested in The accretion of solar material onto white dwarfs: No mixing with core material implies that the mass of thewhite dwarf is increasing AIP Advances 4, 041007 (2014); 10.1063/1.4866984 Polarized pairing in neutron star crusts AIP Conf. Proc. 1441, 390 (2012); 10.1063/1.3700564 The Electrodynamics of the Core and the Crust components in Neutron Stars AIP Conf. Proc. 1059, 68 (2008); 10.1063/1.3012286 Magnetic fields in neutron stars, white dwarfs and implications for binary millisecond pulsars AIP Conf. Proc. 968, 188 (2008); 10.1063/1.2840393 Multi‐Dimensional Simulations of the Accretion‐Induced Collapse of White Dwarfs to Neutron Stars AIP Conf. Proc. 924, 126 (2007); 10.1063/1.2774849
This article is copyrighted as indicated in the article. Reuse of AIP content is subject to the terms at: http://scitation.aip.org/termsconditions. Downloaded to IP:
194.85.224.35 On: Mon, 26 Oct 2015 11:34:12

Coulomb crystal mixtures in white dwarf cores and neutron star crusts
A. A. Kozhberova) and D. A. BaikoIoffe Institute, Politekhnicheskaya 26, St. Petersburg, Russia
(Received 2 July 2015; accepted 20 August 2015; published online 17 September 2015)
We calculate electrostatic, spectral, and thermal properties of two-component Coulomb crystals of
ions and determine the limits of applicability of the linear mixing theory to such systems. VC 2015AIP Publishing LLC. [http://dx.doi.org/10.1063/1.4930215]
I. INTRODUCTION
It is generally accepted that matter in white dwarf cores
and neutron star envelopes at not too low densities represents
a mixture of atomic nuclei of various types immersed into a
strongly degenerate electron gas and fully ionized by the gas
pressure (e.g., Ref. 1). In particular, the inner layers of white
dwarfs are composed of a carbon and oxygen plasma with
traces of other elements such as neon and iron (e.g., Ref. 2).
At the initial stages of evolution, this mixture is in a liquid
state (a Coulomb liquid of ions). As a star cools, the plasma
crystallizes with a formation of a Coulomb crystal of ions.
The occurrence of this crystallization process has been
inferred from observations of a white dwarf in the globular
cluster NGC 6397.3
In plasma physics, a Coulomb crystal is a system of
point charges of one sign arranged in a crystal lattice with a
strictly uniform neutralizing background of opposite charge
(e.g., Refs. 1 and 4). It is customary to consider Coulomb
crystals with a single ion type (one-component crystals or
occ). If quantization of the ion motion is neglected, the prop-
erties of this system are determined by one parameter, the
Coulomb coupling parameter C � ðZ ieÞ2=ða iTÞ. In this case,
Z ie is the ion charge, T is the temperature (kB ¼ 1),
a i ¼ ð4pn i=3Þ�1=3is the ion sphere radius, and n i is the ion
number density. Such classic occ is known to melt at
C � 175 (e.g., Ref. 1).
In the compact stars, one typically expects C� 1.
Moreover, in the crusts of neutron stars, C > 175 except the
outermost low-density layers and/or the very early stages of
the star life. Therefore, for astrophysical applications, it is
necessary to study thermodynamic properties of Coulomb
crystals (both occ and mixtures). For instance, heat capacity
of matter in the inner layers of white dwarfs controls the
cooling rate and is thus required for a reliable estimate of the
star age (e.g., Refs. 2 and 4). Precise knowledge of the elec-
trostatic energy and thermal free energy is indispensable for
determination of the crystallization temperature.
Thermodynamic properties of occ in the harmonic
lattice approximation have been studied in Refs. 5–7 and
fitted with comparable accuracy for body-centered cubic
(bcc) and face-centered cubic (fcc) lattices in Refs. 8 and 9.
The influence of magnetic field on thermodynamics of occ
was analyzed in detail in Refs. 10 and 11, while electron
screening has been discussed in Refs. 12–14. Various ana-
lytic and numerical methods were employed to study classic
and quantum anharmonic corrections in a large number of
works (e.g., Refs. 9, 15, 16, and references therein). Among
all investigated lattices the bcc lattice was found to have the
lowest free energy, but the difference between the energies
of several lattices is very small, and, if the electron polariza-
tion is taken into account, the fcc lattice may become more
energetically favorable.13
Far less work has been devoted to a description of
Coulomb mixtures, i.e., multi-component plasmas composed
of fully ionized atomic nuclei of several types and a uniform
charge-compensating electron background (e.g., Ref. 17).
Physical properties of these systems are usually obtained
from the linear mixing (lm) theory (e.g., Refs. 18 and 19) or
numerically, from molecular dynamics (e.g., Refs. 20–22
and references therein) or Monte-Carlo (e.g., Refs. 23–26)
simulations. A high level of accuracy of the lm approach for
the Coulomb liquid has been demonstrated27 and confirmed
later by Monte-Carlo modeling (e.g., Refs. 25 and 28). The
lm rule has been applied to Coulomb crystals for the first
time in Ref. 29. These authors calculated the electrostatic
energy of substitutionally disordered (i.e., ions of different
types are randomly distributed over nodes of a perfect
lattice) bcc, fcc, and CsCl lattices as an average of the local
minima of the interaction energies, obtained from several in-
dependent molecular dynamics runs, and made a comparison
with respective lm predictions. Recently, a simple analytic
estimate of the free energy deviation from the lm result has
been proposed.19
Unfortunately, none of these methods is applicable at
temperatures below the crystal Debye temperature, where
quantum effects of the ion motion play a decisive role, and
thus, there is no assessment of the validity of the lm theory
under such conditions. However, the quantum regime is
highly relevant for the astrophysical objects mentioned
above.
In this paper, we refine and expand our work30 and pres-
ent a detailed analytic and numerical study of physical prop-
erties of an ordered binary Coulomb crystal, i.e., a perfect
Coulomb crystal with ions of two different sorts (different
charges and masses) in each elementary cell. We focus on
thermodynamic functions of the ion component only treating
electrons simply as a uniform neutralizing background. In
principle, thermodynamic functions of strongly degenerate
electron gas are well understood and should be addeda)Electronic mail: [email protected].
1070-664X/2015/22(9)/092903/10/$30.00 VC 2015 AIP Publishing LLC22, 092903-1
PHYSICS OF PLASMAS 22, 092903 (2015)
This article is copyrighted as indicated in the article. Reuse of AIP content is subject to the terms at: http://scitation.aip.org/termsconditions. Downloaded to IP:
194.85.224.35 On: Mon, 26 Oct 2015 11:34:12

directly to the respective ion contributions. Let us note that
electrons are responsible for the dominant contribution to the
crystal pressure and for a substantial contribution to the
system heat capacity, particularly at low temperatures. We
analyze electrostatic, spectral, and thermal properties of the
binary Coulomb crystal mixture within the harmonic lattice
model framework. This allows us to take into account the
quantum effects. For simplicity, we neglect anharmonic
effects, which become significant near the melting transition,
as well as effects of the electron background polarization.
The latter invalidate the assumption of constant and uniform
electron background and are important for large-Z ions at
rather low densities. We compare our results with predictions
of the lm theory and discuss its applicability to Coulomb
crystal mixtures at low temperatures.
II. NOTATIONS
Consider an ordered Coulomb crystal mixture (or a
multi-component Coulomb crystal), i.e., a regular arrange-
ment of ions of several types in a lattice. The position of an
ion of type p (with charge number Zp and mass Mp,
p ¼ 1:::Ncell; Ncell is the number of ions in the lattice elemen-
tary cell) in a crystal is given by its radius vector rlp ¼ Xlp
þulp, where ulp is the ion displacement from its equilibrium
position. Equilibrium positions of ions are given by Xlp ¼ Rl
þvp, where Rl ¼ l1a1 þ l2a2 þ l3a3 is a lattice vector,
l1; l2; l3 are arbitrary integers, vectors a1; a2; a3 are the lattice
main translation vectors, and vp is the basis vector of the
p-ion in the elementary cell (by construction we always have
v1 ¼ 0, vp 6¼ 0 for p> 1). The reciprocal lattice is formed by
vectors Gm ¼ m1g1 þ m2g2 þ m3g3, where g1; g2; g3 are the
reciprocal lattice main translation vectors satisfying
giaj ¼ 2pdij, and m1;m2;m3 are arbitrary integers.
We shall study in detail and compare two binary lattices:
a simple cubic lattice with Ncell ¼ 2 (sc2) and a hexagonal
lattice with Ncell ¼ 2 (h2). The ions at v1 and v2 are different,
while the number density is the same for ions of both types.
Figure 1 illustrates the two lattice structures with different
colors corresponding to different ions. The sc2 and h2 latti-
ces coincide with the bcc and hexagonal close-packed (hcp)
lattices, respectively, if all ions are identical. The origin of a
Cartesian coordinate system is always assumed to coincide
with a Z1-ion, while a � Z2=Z1 � 1. We shall describe the
sc2 lattice by the simple cubic (sc) lattice main translation
vectors a1 ¼ alð1; 0; 0Þ, a2 ¼ alð0; 1; 0Þ, a3 ¼ alð0; 0; 1Þ, and
the basis vector v2 ¼ 0:5alð1; 1; 1Þ. The h2 lattice is
described by the main translation vectors of the hexagonal
(hex) lattice a1 ¼ alð1; 0; 0Þ, a2 ¼ 0:5alð1;ffiffiffi3p
; 0Þ, and
a3 ¼ alð0; 0;ffiffiffiffiffiffiffiffi8=3
pÞ with the basis vector v2 ¼ alð1=3; 1=3;ffiffiffiffiffiffiffiffi
2=3p
Þ. In both cases, al is the lattice constant (cf. Fig. 1).
The primitive subzones of the Brillouin zones of these latti-
ces are determined by the following inequalities: kx � ky �kz � 0; kxal � p for the sc2 lattice, and 0 � kxal � p
ffiffiffiffiffiffiffiffi4=3
p,
0 � ky � kx=ffiffiffi3p
, and 0 � kzal � pffiffiffiffiffiffiffiffi3=8
pfor the h2 lattice,
where k is a wavevector.
III. ELECTROSTATIC ENERGY
The potential energy of a multi-component Coulomb
crystal with an arbitrary number and type of ions in the ele-
mentary cell is given by
U ¼ 1
2
Xlpl0p0
0 ZpZp0e2
jrlp � rl0p0 j� ne
Xlp
ðdr
Zpe2
jrlp � rj
þ n2ee2
2
ð ðdr dr0
jr� r0j ; (1)
where sums over l and l0 are extended to infinity, sums over
p and p0 go over all ions in the elementary cell, prime at the
first sum means that terms with l ¼ l0 and p ¼ p0 are omitted,
Zp is the charge number of ions located at rlp, ne¼Zn is the
electron number density, Z is the average ion charge number,
and n is the total ion number density. For binary crystals con-
sidered in this work, ne ¼ 0:5nðZ1 þ Z2Þ. The first sum is
divergent, whereas the second and the third terms serve to
cancel this infinity, so that the electrostatic energy per one
ion becomes finite.
If all ions are fixed at their equilibrium positions,
rlp ¼ Xlp, Eq. (1) yields the static-lattice binding energy of
the crystal, or the Madelung energy, UM. Equation (1) is
obviously impractical and we have used Ewald transforma-
tions31 to derive a rapidly converging practical formula for
calculating the Madelung energy of a completely general
perfectly ordered multi-component Coulomb crystal
UM ¼ Ne2
an;
n ¼ a
2Ncell
Xlpp0
ZpZp0 1� dpp0dRl0ð Þerfc AYlpp0ð Þ
Ylpp0
� Aa
Ncell
ffiffiffippX
p
Z2p �
3
8N2cellA
2a2
Xpp0
ZpZp0
þ 3
2N2cella
2
Xmpp0
ZpZp0 1� dGm0ð Þ
� 1
G2m
exp � G2m
4A2þ iGm vp � vp0ð Þ
� �: (2)
In this case, Ylpp0 ¼ Rl þ vp � vp0 , N is the total number of
ions, a � ð4pn=3Þ�1=3, and erfcðxÞ is the complementary
error function. An arbitrary parameter A is chosen so that
sums over direct and reciprocal lattice vectors, Rl and Gm,FIG. 1. The sc2 (left) and h2 (right) lattices.
092903-2 A. A. Kozhberov and D. A. Baiko Phys. Plasmas 22, 092903 (2015)
This article is copyrighted as indicated in the article. Reuse of AIP content is subject to the terms at: http://scitation.aip.org/termsconditions. Downloaded to IP:
194.85.224.35 On: Mon, 26 Oct 2015 11:34:12

converge equally rapidly. Equation (2) reproduces Eq. (10)
of Ref. 32 for an occ with N cell ¼ 1. For an occ with
N cell > 1, this formula reproduces, e.g., Eq. (5) of Ref. 8.
For multi-component crystals, to our knowledge, such a for-
mula has not been previously published.
For ordered binary crystal mixtures in consideration, Eq.
(2) reduces to30
UM ¼ Ne2
a
Z21 þ Z2
2
24=3f1 þ Z1Z2 f2 �
f1
21=3
� �" #: (3)
In the case of the sc2 lattice, f1 and f2 are the Madelung con-
stants of the sc and bcc lattices, respectively (f1 ¼ f sc
¼ �0:88005944211 and f2 ¼ f bcc ¼ �0:89592925568). For
the h2 lattice, f1 and f2 are the Madelung constants of the hex
and hcp lattices, respectively (f1 ¼ f hex ¼ �0:77943336427
and f2 ¼ f hcp ¼ �0:89583812046). It is clear, that in the spe-
cial cases Z1¼Z2 and Z2 ¼ 0, Eq. (3) reproduces correctly
the Madelung energy of the respective occ.
Interestingly, Eq. (3) can be easily obtained from sym-
metry considerations. Since densities of both types of ions
are equal and the lattices do not change under the ion inter-
change (Z1 $ Z2), the electrostatic energy must have the
form: UM ¼ c1ðZ21 þ Z2
2Þ þ c2Z1Z2. Constants c1 and c2 can
now be found from the special cases above. If Z2 ¼ 0, the
number of ions is halved and c1 ¼ Ne2f1=ð24=3aÞ. If Z1¼Z2,
2c1 þ c2 ¼ Ne2f2=a.
It is useful to compare the exact Madelung energy with
that obtained from the lm theory. According to Ref. 18, lin-
ear mixing yields the Madelung energy of a binary crystal as
UlmM ¼ N1
Z21e2
a1
f2 þ N2
Z22e2
a2
f2; (4)
where aj ¼ ð4pnj=3Þ�1=3; nj ¼ ne=Zj, and the electron num-
ber density ne in both terms should be the same as in the mix-
ture; Nj is the total number of j-ions. Hence, for a perfectly
ordered binary crystal with N1¼N2,
UlmM
UM
¼ 1þ að Þ1=31þ a5=3ð Þf2
a� 1ð Þ2f1 þ 24=3af2
: (5)
Equation (5) is symmetric under the replacement of a by
1=a, is 1 at a¼ 1, and reaches 1.00094 and 1.00215 for the
sc2 and h2 lattices, respectively, at the maximum allowed
charge ratio for these lattices, a ¼ 3:6 and a ¼ 1:25 (see
below). For the carbon-oxygen mixture with the sc2 lattice,
UlmM =UM � 1 � �6:67� 10�5. This difference seems small,
but it may still be important, because the Madelung energy is
by far the dominant contribution to the crystal energy. For
some applications (such as determination of the crystal melt-
ing point), it is desirable to know it with the best possible
precision.
IV. DYNAMIC MATRIX AND COLLECTIVE MODES
The potential energy Eq. (1) can be expanded in powers
of ion displacements and, in the harmonic lattice model, only
the second order terms are retained. These terms determine the
phonon spectrum of the crystal, which can be found by solving
the dispersion equation detfDlkpp0ðkÞ � x2dlkdpp0 g ¼ 0 for the
squared frequency, x2, at any wavevector k. For a perfect lat-
tice with arbitrary number and type of ions in the elementary
cell, the dynamic matrix Dlkpp0ðkÞ is equal to
Dlkpp0 kð Þ ¼ ZpZp0e
2ffiffiffiffiffiffiffiffiffiffiffiffiffiMpMp0
p Blkpp0 kð Þ þ Zpe2
MpWlk
p dpp0 ; (6)
where
Blkpp0 kð Þ ¼ � @2
@ul@uk
XRl 6¼0
exp ikRlð Þju� Rl � vp þ vp0 j
����u!0
;
Wlkp ¼
@2
@ul@uk
XRl 6¼0
Xp00
Zp00
ju� Rl � vp þ vp00 j
(
�ne
ðdr
ju� vp � rj
)�����u!0
: (7)
Using Ewald transformations one can recast matrices
Blkpp0ðkÞ and Wlk
p in a form of rapidly converging lattice
sums,30 which we reproduce here for completeness
Blkpp0 kð Þ ¼ 4pn
N cell
Xm
Glm � klð Þ Gk
m � kk�
jGm � kj2exp � jGm � kj2
4A2þ i Gm � kð Þ vp � vp0ð Þ
� �� 4A3
3ffiffiffipp dlkdpp0
�X
l
1� dpp0dRl0ð Þ3Ya
lpp0Yklpp0
Y2lpp0
� dlk
!erfc AYlpp0ð Þ
Y3lpp0
þ 2Affiffiffipp
Y2lpp0
e�A2Y2
lpp0
" #þ 4A3ffiffiffi
pp
Yllpp0Y
klpp0
Y2lpp0
e�A2Y2
lpp0
8<:
9=;eikRl ;
Wlkp ¼ �
4pn
N cell
Xp00
Zp00X
m
0 GlmGk
m
G2m
exp � G2m
4A2þ iGm vp � vp00ð Þ
� �þ 4A3
3ffiffiffipp Zpd
lk
þXlp00
Zp00 1� dpp00dRl0ð Þ3Yl
lpp00Yklpp00
Y2lpp00
� dlk
!erfc AYlpp00ð Þ
Y3lpp00
þ 2Affiffiffipp
Y2lpp00
e�A2Y2
lpp00
" #þ 4A3ffiffiffi
pp
Yllpp00Y
klpp00
Y2lpp00
e�A2Y2
lpp00
8<:
9=; ; (8)
092903-3 A. A. Kozhberov and D. A. Baiko Phys. Plasmas 22, 092903 (2015)
This article is copyrighted as indicated in the article. Reuse of AIP content is subject to the terms at: http://scitation.aip.org/termsconditions. Downloaded to IP:
194.85.224.35 On: Mon, 26 Oct 2015 11:34:12
where Ylpp00 ¼ Rl þ vp � vp00 , indices l; k denote Cartesian
components, and A is again arbitrary. For cubic occ with
Ncell ¼ 1, Eqs. (6) and (8) reproduce Eq. (3) of Ref. 8. For
non-cubic occ (e.g., for hcp), Eq. (3) of Ref. 8 is incorrect.
One can show30 thatX�
x2�ðkÞ ¼ Ncellx
2s; (9)
x2s ¼
4pne2
N2cell
Xpp0
ZpZp0
Mp; (10)
where � enumerates frequencies at fixed k (� ¼ 1…3Ncell).
For an occ with N cell � 1, Zp¼ Z, and Mp¼M for all p, xs
becomes the regular plasma frequency xp ¼ffiffiffiffiffiffiffiffiffiffiffiffiffiffiffiffiffiffiffiffiffiffiffi4pnZ2e2=M
p.
For this reason, x s can be called the multi-component
plasma frequency. An occ can also be obtained by setting Zp
to Z and Mp to M for some values of p, and Zp¼ 0 for all the
other values of p. Equation (9) will yield a correct sum rule
in this case as well.
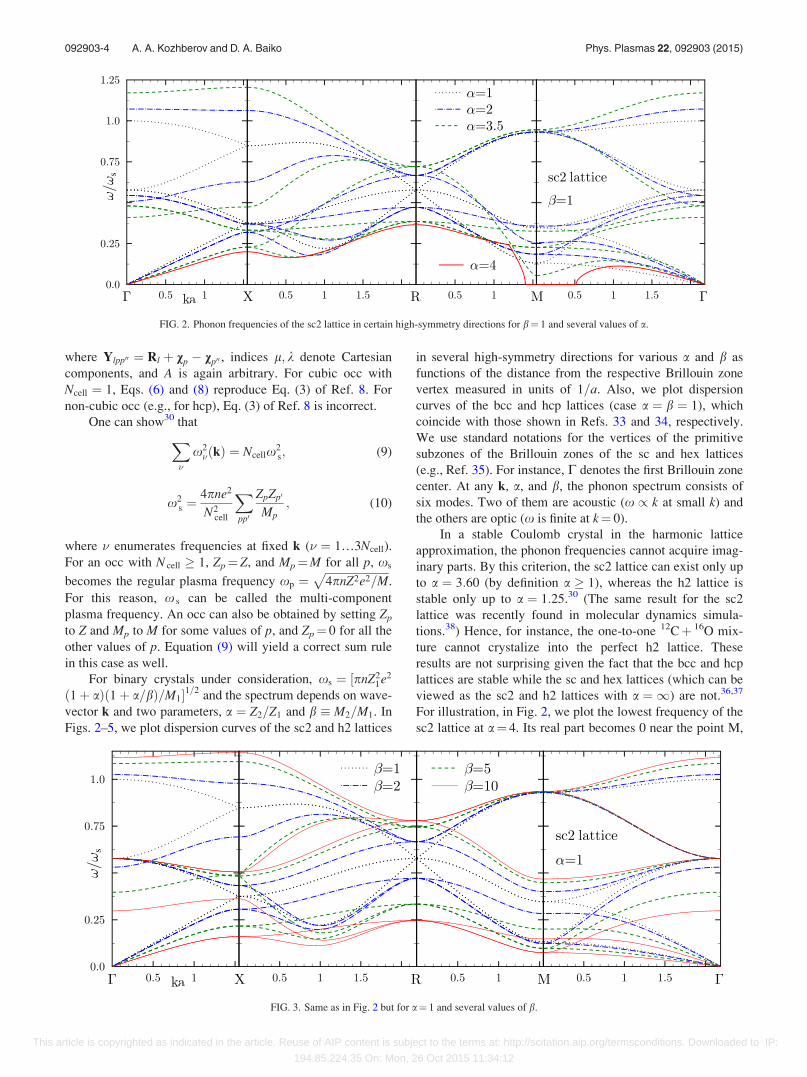
For binary crystals under consideration, xs ¼ ½pnZ21e2
ð1þ aÞð1þ a=bÞ=M11=2and the spectrum depends on wave-
vector k and two parameters, a ¼ Z2=Z1 and b � M2=M1. In
Figs. 2–5, we plot dispersion curves of the sc2 and h2 lattices
in several high-symmetry directions for various a and b as
functions of the distance from the respective Brillouin zone
vertex measured in units of 1=a. Also, we plot dispersion
curves of the bcc and hcp lattices (case a ¼ b ¼ 1), which
coincide with those shown in Refs. 33 and 34, respectively.
We use standard notations for the vertices of the primitive
subzones of the Brillouin zones of the sc and hex lattices
(e.g., Ref. 35). For instance, C denotes the first Brillouin zone
center. At any k, a, and b, the phonon spectrum consists of
six modes. Two of them are acoustic (x / k at small k) and
the others are optic (x is finite at k¼ 0).
In a stable Coulomb crystal in the harmonic lattice
approximation, the phonon frequencies cannot acquire imag-
inary parts. By this criterion, the sc2 lattice can exist only up
to a ¼ 3:60 (by definition a � 1), whereas the h2 lattice is
stable only up to a ¼ 1:25.30 (The same result for the sc2
lattice was recently found in molecular dynamics simula-
tions.38) Hence, for instance, the one-to-one 12Cþ 16O mix-
ture cannot crystalize into the perfect h2 lattice. These
results are not surprising given the fact that the bcc and hcp
lattices are stable while the sc and hex lattices (which can be
viewed as the sc2 and h2 lattices with a ¼ 1) are not.36,37
For illustration, in Fig. 2, we plot the lowest frequency of the
sc2 lattice at a¼ 4. Its real part becomes 0 near the point M,
FIG. 2. Phonon frequencies of the sc2 lattice in certain high-symmetry directions for b¼ 1 and several values of a.
FIG. 3. Same as in Fig. 2 but for a¼ 1 and several values of b.
092903-4 A. A. Kozhberov and D. A. Baiko Phys. Plasmas 22, 092903 (2015)
This article is copyrighted as indicated in the article. Reuse of AIP content is subject to the terms at: http://scitation.aip.org/termsconditions. Downloaded to IP:
194.85.224.35 On: Mon, 26 Oct 2015 11:34:12
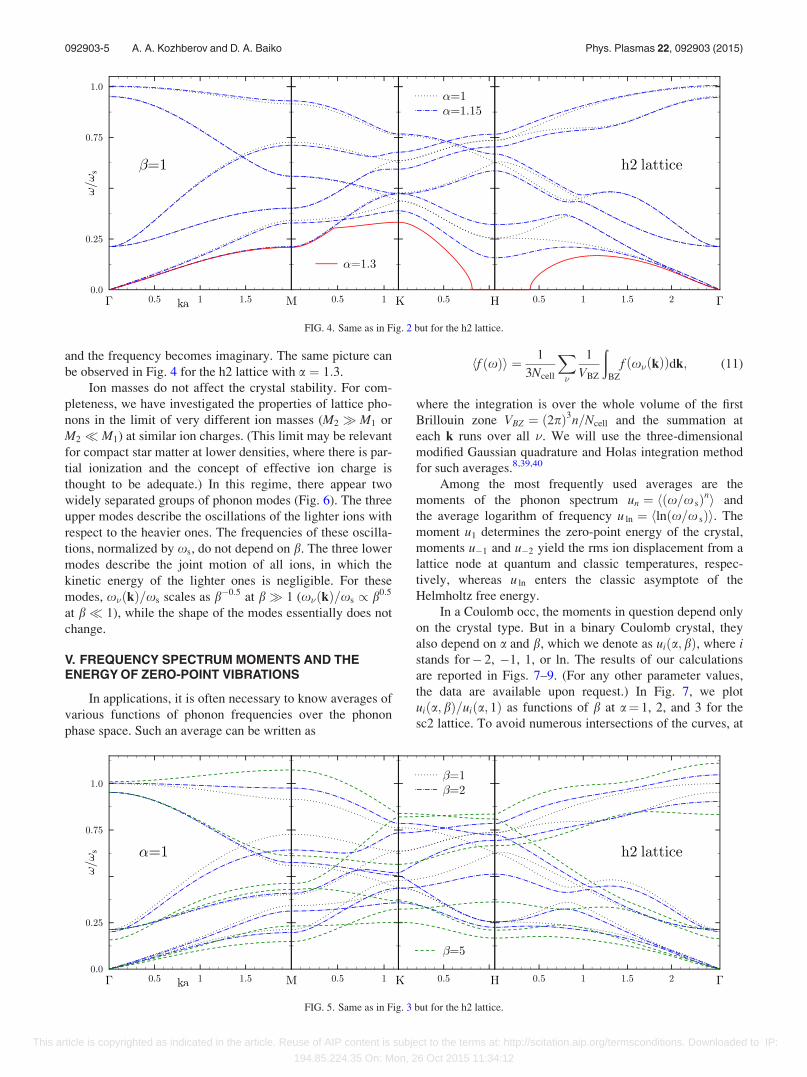
and the frequency becomes imaginary. The same picture can
be observed in Fig. 4 for the h2 lattice with a ¼ 1:3.
Ion masses do not affect the crystal stability. For com-
pleteness, we have investigated the properties of lattice pho-
nons in the limit of very different ion masses (M2 � M1 or
M2 M1) at similar ion charges. (This limit may be relevant
for compact star matter at lower densities, where there is par-
tial ionization and the concept of effective ion charge is
thought to be adequate.) In this regime, there appear two
widely separated groups of phonon modes (Fig. 6). The three
upper modes describe the oscillations of the lighter ions with
respect to the heavier ones. The frequencies of these oscilla-
tions, normalized by xs, do not depend on b. The three lower
modes describe the joint motion of all ions, in which the
kinetic energy of the lighter ones is negligible. For these
modes, x�ðkÞ=xs scales as b�0:5 at b� 1 (x�ðkÞ=xs / b0:5
at b 1), while the shape of the modes essentially does not
change.
V. FREQUENCY SPECTRUM MOMENTS AND THEENERGY OF ZERO-POINT VIBRATIONS
In applications, it is often necessary to know averages of
various functions of phonon frequencies over the phonon
phase space. Such an average can be written as
hf xð Þi ¼ 1
3Ncell
X�
1
VBZ
ðBZ
f x� kð Þð Þdk; (11)
where the integration is over the whole volume of the first
Brillouin zone VBZ ¼ ð2pÞ3n=Ncell and the summation at
each k runs over all �. We will use the three-dimensional
modified Gaussian quadrature and Holas integration method
for such averages.8,39,40
Among the most frequently used averages are the
moments of the phonon spectrum un ¼ hðx=x sÞni and
the average logarithm of frequency u ln ¼ hlnðx=x sÞi. The
moment u1 determines the zero-point energy of the crystal,
moments u�1 and u�2 yield the rms ion displacement from a
lattice node at quantum and classic temperatures, respec-
tively, whereas u ln enters the classic asymptote of the
Helmholtz free energy.
In a Coulomb occ, the moments in question depend only
on the crystal type. But in a binary Coulomb crystal, they
also depend on a and b, which we denote as uiða; bÞ, where istands for� 2, �1, 1, or ln. The results of our calculations
are reported in Figs. 7–9. (For any other parameter values,
the data are available upon request.) In Fig. 7, we plot
uiða; bÞ=uiða; 1Þ as functions of b at a¼ 1, 2, and 3 for the
sc2 lattice. To avoid numerous intersections of the curves, at
FIG. 5. Same as in Fig. 3 but for the h2 lattice.
FIG. 4. Same as in Fig. 2 but for the h2 lattice.
092903-5 A. A. Kozhberov and D. A. Baiko Phys. Plasmas 22, 092903 (2015)
This article is copyrighted as indicated in the article. Reuse of AIP content is subject to the terms at: http://scitation.aip.org/termsconditions. Downloaded to IP:
194.85.224.35 On: Mon, 26 Oct 2015 11:34:12
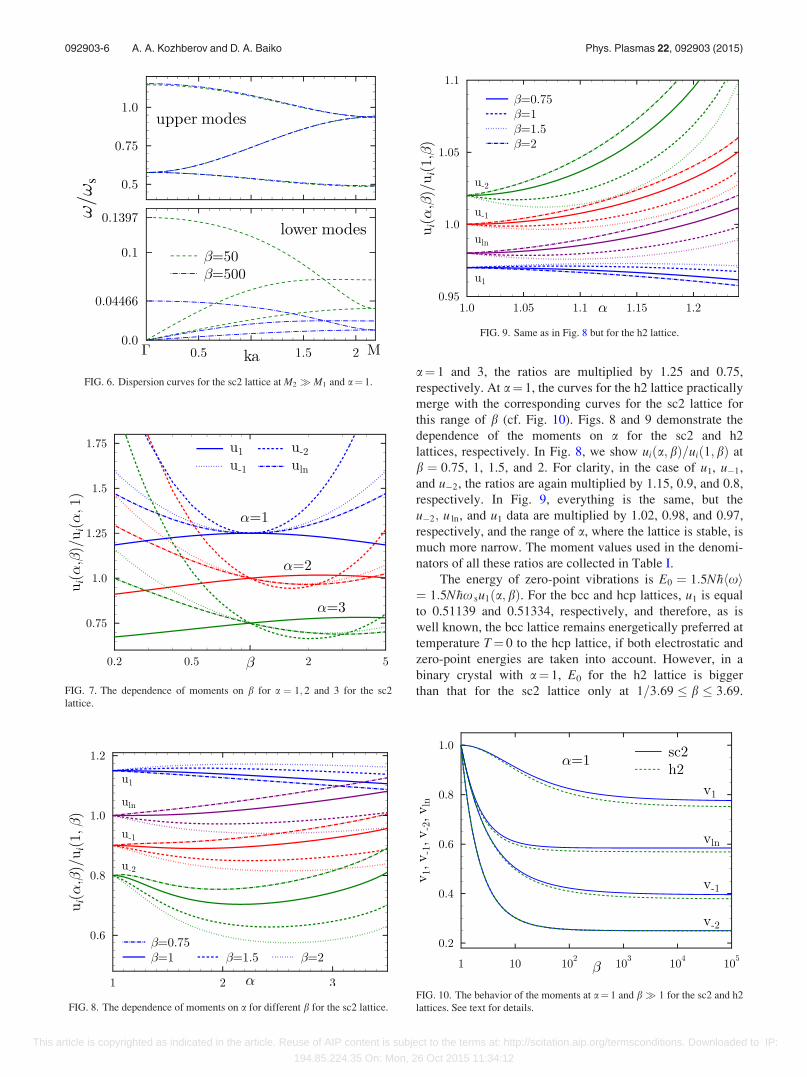
a¼ 1 and 3, the ratios are multiplied by 1.25 and 0.75,
respectively. At a¼ 1, the curves for the h2 lattice practically
merge with the corresponding curves for the sc2 lattice for
this range of b (cf. Fig. 10). Figs. 8 and 9 demonstrate the
dependence of the moments on a for the sc2 and h2
lattices, respectively. In Fig. 8, we show uiða; bÞ=uið1; bÞ at
b ¼ 0:75, 1, 1.5, and 2. For clarity, in the case of u1, u�1,
and u�2, the ratios are again multiplied by 1.15, 0.9, and 0.8,
respectively. In Fig. 9, everything is the same, but the
u�2; u ln, and u1 data are multiplied by 1.02, 0.98, and 0.97,
respectively, and the range of a, where the lattice is stable, is
much more narrow. The moment values used in the denomi-
nators of all these ratios are collected in Table I.
The energy of zero-point vibrations is E0 ¼ 1:5N�hhxi¼ 1:5N�hx su1ða; bÞ. For the bcc and hcp lattices, u1 is equal
to 0.51139 and 0.51334, respectively, and therefore, as is
well known, the bcc lattice remains energetically preferred at
temperature T¼ 0 to the hcp lattice, if both electrostatic and
zero-point energies are taken into account. However, in a
binary crystal with a¼ 1, E0 for the h2 lattice is bigger
than that for the sc2 lattice only at 1=3:69 � b � 3:69.
FIG. 8. The dependence of moments on a for different b for the sc2 lattice.
FIG. 9. Same as in Fig. 8 but for the h2 lattice.
FIG. 10. The behavior of the moments at a¼ 1 and b� 1 for the sc2 and h2
lattices. See text for details.
FIG. 6. Dispersion curves for the sc2 lattice at M2 � M1 and a¼ 1.
FIG. 7. The dependence of moments on b for a ¼ 1; 2 and 3 for the sc2
lattice.
092903-6 A. A. Kozhberov and D. A. Baiko Phys. Plasmas 22, 092903 (2015)
This article is copyrighted as indicated in the article. Reuse of AIP content is subject to the terms at: http://scitation.aip.org/termsconditions. Downloaded to IP:
194.85.224.35 On: Mon, 26 Oct 2015 11:34:12
Accordingly, for systems with a sufficiently large mass ratio
the h2 lattice may become energetically preferred at T¼ 0 to
the sc2 lattice. On the other hand, at a ¼ 1:2; u1ð1:2; bÞ for
the sc2 lattice is always bigger than that for the h2 lattice.
Hence, for such charge ratio, there are densities at which the
h2 lattice is more favorable regardless of the mass ratio.41
Let us also discuss the behavior of the spectral averages
in the limit of a very large mass ratio of the constituent ions,
where some analytic results can be obtained. Clearly, for
u1ða; bÞ, the three upper frequencies x � x s produce the
dominant contribution. Thus, at b� 1 or b 1, u1ða; bÞapproaches a constant value. This can be seen in Fig. 10,
where we plot v1 � u1ð1; bÞ=u1ð1; 1Þ as a function of b. The
opposite situation takes place for u�1ða; bÞ and u�2ða; bÞ.The three lower modes yield the dominant contribution to
these moments and, consequently, u�1ða; bÞ behaves as b0:5
at b� 1 (b�0:5 at b 1), while u�2ða; bÞ grows / b(/ 1=b) at b� 1 (b 1). In Fig. 10, we show v�1 � u�1
ð1; bÞ=u�1ð1; 1Þ=ffiffiffibp
and v�2 � u�2ð1; bÞ=u�2ð1; 1Þ=b. As
expected, these quantities approach constant values at
b� 1. Finally, in the case of u ln both groups of modes pro-
duce comparable contributions. The upper modes result in a
constant term and the lower modes yield a / lnb term in the
high-b asymptote. It is illustrated in Fig. 10, where v ln �u lnð1; bÞ=u lnð1; 1Þ=ð1þ q1lnbÞ is plotted with q1 ¼ 0:5214
for the sc2 lattice and q1 ¼ 0:5313 for the h2 lattice. All
these conclusions also hold for a > 1.
VI. PHONON THERMODYNAMICS
Thermal phonon Helmholtz free energy F, thermal pho-
non energy U, and heat capacity C are given by
F ¼ 3NThln 1� e�wð Þi ;
U ¼ 3NTw
ew � 1
D E;
C ¼ 3Nw2
4sinh2 w=2ð Þ
�; (12)
where w � �hx=T and phonon chemical potential is zero. The
thermodynamic potentials of a binary Coulomb crystal are
fully determined by three parameters, T=T s, a, and b, where
T s � �hx s is the multi-component plasma temperature. If
a ¼ b ¼ 1, T s becomes the usual ion plasma temperature of
the respective occ, T p � �hx p.
Using the Holas integration method, we have calculated
thermodynamic functions Eq. (12) for the sc2 and h2 lattices
in a wide range of T=T s and b for dense grids of a spanning
the stability bands of these lattices. The numerical data on
the thermodynamic functions are available upon request.
Here, we summarize the main features of these results.
Let us recall, that the thermodynamic functions of a
Coulomb occ have two asymptotic regimes of high and low
(or classic and quantum) temperatures. At high temperatures,
where the occupation numbers are big for all phonon modes,
the Dulong-Petit law takes place, which states that the heat
capacity saturates at C occ ¼ 3N, the thermal energy is
U occ ¼ 3NT, and the free energy is F occ ¼ 3NT½lnðT p=TÞþu ln � 1:5N�hx pu1. At low temperatures, only acoustic
phonons near the Brillouin zone center are excited and con-
tribute to the thermodynamic quantities. This results in the
Debye T3-law for the heat capacity and T4-law for the energy
and free energy.
The Dulong-Petit and Debye laws are also satisfied
for binary mixtures (bin). At high temperatures, F bin
¼ 3NT½lnðT s=TÞ þ u lnða; bÞ � 1:5N�hx su1ða; bÞ. At low
temperatures, the heat capacity behaves as Cbin ¼ NHða; bÞðT=T sÞ3, where Hða; bÞ is a quantum asymptote coefficient,
which depends on a, b, and the lattice type. Furthermore,
Fbin ¼ CbinT=12 and Ubin ¼ CbinT=4.
In Figs. 11 and 12, we plot the ratios of the three ther-
modynamic functions of binary mixtures for several a and bto the same thermodynamic functions of the occ (a ¼ b ¼ 1)
with respective lattice (i.e., bcc for the sc2-mixtures and hcp
for the h2-mixtures). The ratios are calculated as functions of
T=T s, while the thermodynamic functions in the denomina-
tor are taken at T=T p ¼ T=T s. Accordingly, to find the value
of a thermodynamic function of a binary crystal at
T=T s ¼ x0, one has to take the ratio at argument x0 and
multiply by the thermodynamic function of the occ at
T=T p ¼ x0. The latter can be taken from Ref. 8 for the bcc
crystal and will be published elsewhere42 for the hcp crystal.
In Fig. 11(a), we consider the thermodynamic functions
at a¼ 1 for several representative values of b, for both types
of lattices. One can see that the dependencies are qualita-
tively very similar for the ratios of different thermodynamic
functions. The energy and heat capacity ratios tend to 1 at
high temperatures and to a constant, which depends on b but
not on the lattice type, at low temperatures. The free energy
ratio also tends to the same constant in the quantum limit but
at high temperatures, due to the logarithmic character of the
asymptotes, its convergence to 1 is much slower. The ther-
modynamic functions in the quantum regime are higher for
mixtures with a¼ 1 and b 6¼ 1 than for the occ, which can be
attributed to softening of acoustic modes near the Brillouin
zone center (cf. Figs. 3 and 5). In general, for a¼ 1, there is
only a slight difference between the lattice types.
The situation is drastically different in Fig. 11(b), where
a ¼ 1:2. In this case, the behavior of the ratios, including
their low temperature limits, is very sensitive to the lattice
type. Since a ¼ 1:2 is already close to the lattice destruction
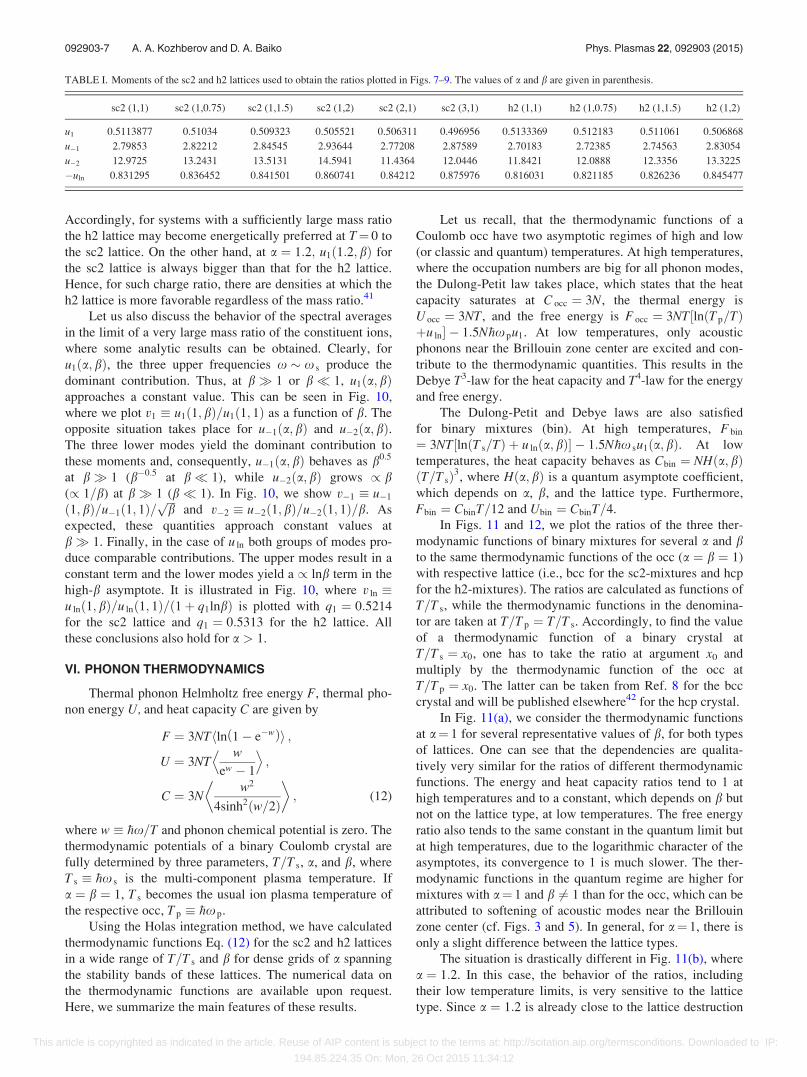
TABLE I. Moments of the sc2 and h2 lattices used to obtain the ratios plotted in Figs. 7–9. The values of a and b are given in parenthesis.
sc2 (1,1) sc2 (1,0.75) sc2 (1,1.5) sc2 (1,2) sc2 (2,1) sc2 (3,1) h2 (1,1) h2 (1,0.75) h2 (1,1.5) h2 (1,2)
u1 0.5113877 0.51034 0.509323 0.505521 0.506311 0.496956 0.5133369 0.512183 0.511061 0.506868
u�1 2.79853 2.82212 2.84545 2.93644 2.77208 2.87589 2.70183 2.72385 2.74563 2.83054
u�2 12.9725 13.2431 13.5131 14.5941 11.4364 12.0446 11.8421 12.0888 12.3356 13.3225
�uln 0.831295 0.836452 0.841501 0.860741 0.84212 0.875976 0.816031 0.821185 0.826236 0.845477
092903-7 A. A. Kozhberov and D. A. Baiko Phys. Plasmas 22, 092903 (2015)
This article is copyrighted as indicated in the article. Reuse of AIP content is subject to the terms at: http://scitation.aip.org/termsconditions. Downloaded to IP:
194.85.224.35 On: Mon, 26 Oct 2015 11:34:12
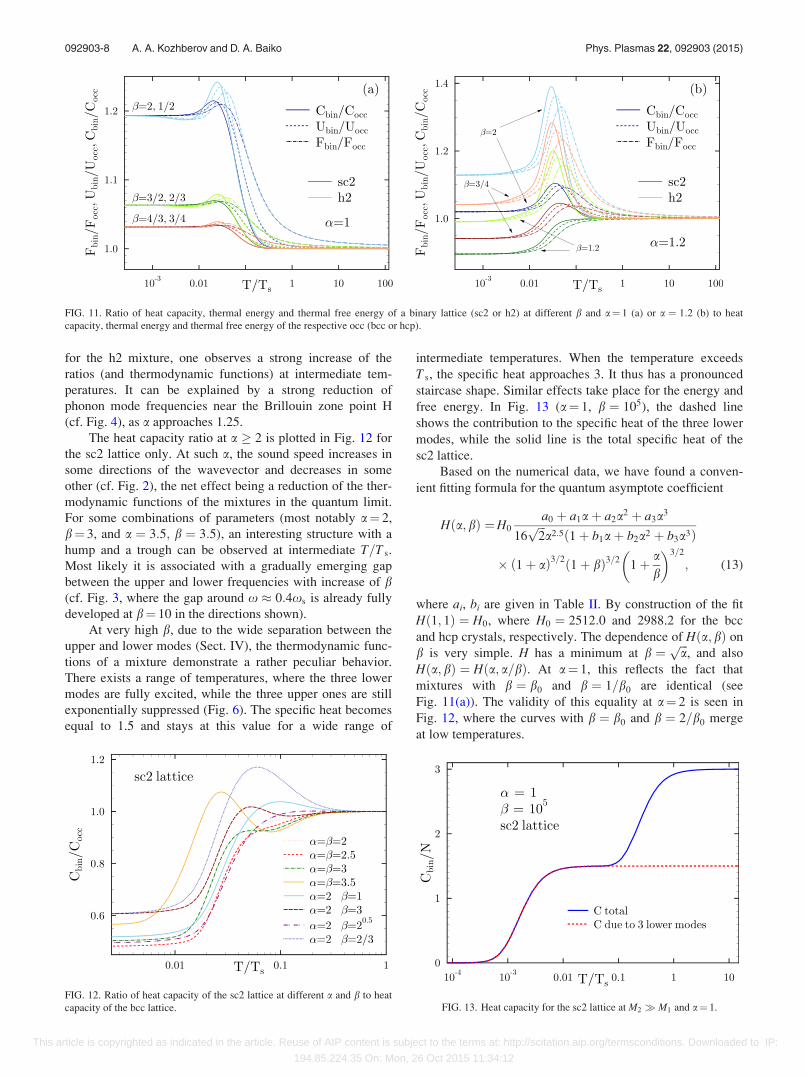
for the h2 mixture, one observes a strong increase of the
ratios (and thermodynamic functions) at intermediate tem-
peratures. It can be explained by a strong reduction of
phonon mode frequencies near the Brillouin zone point H
(cf. Fig. 4), as a approaches 1.25.
The heat capacity ratio at a � 2 is plotted in Fig. 12 for
the sc2 lattice only. At such a, the sound speed increases in
some directions of the wavevector and decreases in some
other (cf. Fig. 2), the net effect being a reduction of the ther-
modynamic functions of the mixtures in the quantum limit.
For some combinations of parameters (most notably a¼ 2,
b¼ 3, and a ¼ 3:5; b ¼ 3:5), an interesting structure with a
hump and a trough can be observed at intermediate T=T s.
Most likely it is associated with a gradually emerging gap
between the upper and lower frequencies with increase of b(cf. Fig. 3, where the gap around x � 0:4xs is already fully
developed at b¼ 10 in the directions shown).
At very high b, due to the wide separation between the
upper and lower modes (Sect. IV), the thermodynamic func-
tions of a mixture demonstrate a rather peculiar behavior.
There exists a range of temperatures, where the three lower
modes are fully excited, while the three upper ones are still
exponentially suppressed (Fig. 6). The specific heat becomes
equal to 1.5 and stays at this value for a wide range of
intermediate temperatures. When the temperature exceeds
T s, the specific heat approaches 3. It thus has a pronounced
staircase shape. Similar effects take place for the energy and
free energy. In Fig. 13 (a¼ 1, b ¼ 105), the dashed line
shows the contribution to the specific heat of the three lower
modes, while the solid line is the total specific heat of the
sc2 lattice.
Based on the numerical data, we have found a conven-
ient fitting formula for the quantum asymptote coefficient
H a; bð Þ ¼H0
a0 þ a1aþ a2a2 þ a3a3
16ffiffiffi2p
a2:5 1þ b1aþ b2a2 þ b3a3ð Þ
� 1þ að Þ3=21þ bð Þ3=2
1þ ab
� �3=2
; (13)
where ai, bi are given in Table II. By construction of the fit
Hð1; 1Þ ¼ H0, where H0 ¼ 2512:0 and 2988.2 for the bcc
and hcp crystals, respectively. The dependence of Hða; bÞ on
b is very simple. H has a minimum at b ¼ffiffiffiap
, and also
Hða; bÞ ¼ Hða; a=bÞ. At a¼ 1, this reflects the fact that
mixtures with b ¼ b0 and b ¼ 1=b0 are identical (see
Fig. 11(a)). The validity of this equality at a¼ 2 is seen in
Fig. 12, where the curves with b ¼ b0 and b ¼ 2=b0 merge
at low temperatures.
FIG. 13. Heat capacity for the sc2 lattice at M2 � M1 and a¼ 1.
FIG. 11. Ratio of heat capacity, thermal energy and thermal free energy of a binary lattice (sc2 or h2) at different b and a¼ 1 (a) or a ¼ 1:2 (b) to heat
capacity, thermal energy and thermal free energy of the respective occ (bcc or hcp).
FIG. 12. Ratio of heat capacity of the sc2 lattice at different a and b to heat
capacity of the bcc lattice.
092903-8 A. A. Kozhberov and D. A. Baiko Phys. Plasmas 22, 092903 (2015)
This article is copyrighted as indicated in the article. Reuse of AIP content is subject to the terms at: http://scitation.aip.org/termsconditions. Downloaded to IP:
194.85.224.35 On: Mon, 26 Oct 2015 11:34:12

Finally, it is worthwhile to compare the thermodynamic
functions of a one-to-one Coulomb crystal mixture calcu-
lated using the linear mixing theory with the exact results
obtained from the phonon spectrum. Using the heat capacity
as an example and following Ref. 18, we can write
Clm ¼ N1C1ðZ1;M1Þ þ N2C2ðZ2;M2Þ, where CiðZi;MiÞ is
the specific heat of the occ at the same temperature and elec-
tron number density as in the mixture. Our calculations show
noticeable deviation of the lm predictions from the exact
results at intermediate and low temperatures for crystals with
significant difference between ions (Fig. 14). For example,
for a¼ 2 and b¼ 1, the specific heat calculated by the lm
rule is 2.4 times greater than the actual one at low tempera-
tures. For the carbon-oxygen mixture (12Cþ16O), Clm=Cbin
varies from 1 at T=Ts � 1 to 1.268 at T Ts. In Fig. 14,
only for the 62Ni þ78Ni and 56Fe þ62Ni mixtures, the differ-
ence between Clm and Cbin at low temperatures is small and
does not exceed a few percent. For these two mixtures, the
right-hand y-axis should be used. Similar conclusions also
hold true for the thermal energy and thermal free energy.
VII. CONCLUSIONS
We have studied physical properties of ordered
Coulomb crystal mixtures from the first principles in the har-
monic lattice model. We have derived rapidly converging
practical expressions for the electrostatic energy and the
dynamic matrix of an arbitrary multi-component Coulomb
crystal. The general expressions have been applied to binary
Coulomb crystals with equal number of ions of two different
types with sc2 and h2 lattices, and these systems have been
analyzed in considerable detail (the sc2 and h2 lattices turn
into the bcc and hcp lattices if all ions are identical).
We have confirmed our earlier findings that the sc2 and
h2 lattices are stable if the ratio of ion charges a in the binary
crystal is below 3.60 and 1.25, respectively, regardless of the
ion mass ratio b (by definition a � 1). We have also com-
pared the exact binary crystal electrostatic energy with that
obtained from the linear mixing theory. The relative inaccur-
acy of the latter for the electrostatic energy is shown to be
not worse than a few parts per thousand.
The dynamic matrix allows one to determine the phonon
spectrum of a crystal. Phonon spectrum moments and ther-
modynamic functions have been calculated by numerical
integration over the first Brillouin zone for a wide range of
temperatures, a, and b. For all mixtures, the Dulong-Petit
and Debye laws are satisfied. The dependence of the Debye-
law coefficient on a and b have been approximated by a con-
venient analytic formula with good accuracy for both latti-
ces. We have also investigated the phonon properties for
binary crystals with very different ion masses (b� 1). In
this limit, a gap develops in the crystal spectrum, which
separates the low-frequency (�xs=ffiffiffibp
) modes, correspond-
ing to a joint motion of both types of ions, from the high-
frequency (�xs) modes, describing the oscillations of the
lighter ions with respect to the heavier ones. As a result, the
spectrum moments have very simple asymptotic behavior.
Also, the temperature dependence of the crystal thermody-
namic functions assumes a pronounced staircase shape,
because the low-frequency modes saturate at temperatures,
where the high-frequency modes are still exponentially
suppressed.
Finally, we have checked the accuracy of the linear mix-
ing predictions for the phonon thermodynamic functions
against our results based on the actual phonon spectra of bi-
nary mixtures. It turned out that the linear mixing theory
does a rather poor job being off by tens to hundreds per cent
at intermediate and low temperatures, especially, for crystals
with significantly different ions.
ACKNOWLEDGMENTS
The work of A.A.K. was partially supported by Russian
Foundation for Basic Research (Grant No. 14-02-00868-a).
1P. Haensel, A. Y. Potekhin, and D. G. Yakovlev, Neutron Stars 1:Equation of State and Structure (Springer, New York, 2007).
2L. Segretain, G. Chabrier, M. Hernanz, E. Garcia-Berro, J. Isern, and R.
Mochkovitch, Astrophys. J. 434, 641 (1994).3D. E. Winget, S. O. Kepler, F. Campos, M. H. Montgomery, L. Girardi, P.
Bergeron, and K. Williams, Astrophys. J. 693, L6 (2009).4S. L. Shapiro and S. A. Teukolsky, Black Holes, White Dwarfs, andNeutron Stars (Wiley-Interscience, New York, 1983).
5W. J. Carr, Jr., Phys. Rev. 122, 1437 (1961).6E. L. Pollock and J. P. Hansen, Phys. Rev. A 8, 3110 (1973).7G. Chabrier, Astrophys. J. 414, 695 (1993).8D. A. Baiko, A. Y. Potekhin, and D. G. Yakovlev, Phys. Rev. E 64,
057402 (2001).9A. Y. Potekhin and G. Chabrier, Contrib. Plasma Phys. 50, 82 (2010).
10D. A. Baiko, Phys. Rev. E 80, 046405 (2009).11D. A. Baiko and D. G. Yakovlev, MNRAS 433, 2018 (2013).12A. Y. Potekhin and G. Chabrier, Phys. Rev. E 62, 8554 (2000).13D. A. Baiko, Phys. Rev. E 66, 056405 (2002).14M. Akbari-Moghanjoughi, Phys. Plasmas 20, 042706 (2013).
FIG. 14. Ratio of the linear mixing theory specific heat to the exact phonon
specific heat of the mixture. The right-hand y-axis should be used for 62Ni
þ78Ni and 56Fe þ62Ni mixtures.
TABLE II. Fitting parameters ai and bi for the sc2 and h2 lattices (accuracy
exceeds 0.2% and 0.05%, respectively).
i 0 1 2 3
sc2 ai 0.1236 �0.22915 0.2297 0.03881
bi �2.024 1.354 �0.1671
h2 ai 0.0610816 0.236187 �0.0393898 �0.0357678
bi �1.78839 1.41519 �0.404688
092903-9 A. A. Kozhberov and D. A. Baiko Phys. Plasmas 22, 092903 (2015)
This article is copyrighted as indicated in the article. Reuse of AIP content is subject to the terms at: http://scitation.aip.org/termsconditions. Downloaded to IP:
194.85.224.35 On: Mon, 26 Oct 2015 11:34:12
15R. C. Albers and J. E. Gubernatis, Phys. Rev. B 33, 5180 (1986).16D. H. E. Dubin, Phys. Rev. A 42, 4972 (1990).17A. Y. Potekhin, G. Chabrier, and F. J. Rogers, Phys. Rev. E 79, 016411
(2009).18G. Chabrier and N. W. Ashcroft, Phys. Rev. A 42, 2284 (1990).19Z. Medin and A. Cumming, Phys. Rev. E 81, 036107 (2010).20C. J. Horowitz and D. K. Berry, Phys. Rev. C 79, 065803 (2009).21A. S. Schneider, J. Hughto, C. J. Horowitz, and D. K. Berry, Phys. Rev. E
85, 066405 (2012).22J. Hughto, C. J. Horowitz, A. S. Schneider, Z. Medin, A. Cumming, and
D. K. Berry, Phys. Rev. E 86, 066413 (2012).23S. Ichimaru, H. Iyetomi, and S. Ogata, Astrophys. J. 334, L17 (1988).24G. S. Stringfellow, H. E. DeWitt, and W. L. Slattery, Phys. Rev. A 41,
1105 (1990).25H. E. DeWitt, W. Slattery, and G. Chabrier, Physica B 228, 21 (1996).26H. E. DeWitt and W. Slattery, Contrib. Plasma Phys. 43, 279 (2003).27J. P. Hansen, G. M. Torrie, and P. Vieillefosse, Phys. Rev. A 16, 2153
(1977).28Y. Rosenfeld, Phys. Rev. E 52, 3292 (1995); 54, 2827 (1996).
29S. Ogata, H. Iyetomi, S. Ichimaru, and H. M. Van Horn, Phys. Rev. E 48,
1344 (1993).30A. A. Kozhberov and D. A. Baiko, Contrib. Plasma Phys. 52, 153 (2012).31P. P. Ewald, Ann. Phys. 359, 519 (1917); 369, 253 (1921).32K. Fuchs, Proc. R. Soc. London, Ser. A 151, 585 (1935); 153, 622 (1936);
157, 444 (1936).33A. A. Kozhberov and D. A. Baiko, Contrib. Plasma Phys. 54, 859 (2014).34T. Nagai and H. Fukuyama, J. Phys. Soc. Jpn. 51, 3431 (1982); 52, 44
(1983).35W. Setyawana and S. Curtaroloa, Comput. Mater. Sci. 49, 299 (2010).36M. Born, Proc. Cambr. Philos. Soc. 36, 160 (1940).37M. Born, Proc. Cambr. Philos. Soc. 38, 82 (1942).38G. J. Kalman, Z. Donko, P. Hartmann, and K. I. Golden, Europhys. Lett.
107, 35001 (2014).39A. Holas, J. Comput. Phys. 23, 150 (1977).40R. C. Albers and J. E. Gubernatis, LASL Report No. LA-8674-MS, 1981.41A. A. Kozhberov, Ph.D. thesis (Ioffe Institute, in prep.).42A. A. Kozhberov and D. A. Baiko, “Thermodynamic functions of the hcp
Coulomb crystal Lattice,” Astrophys. Space Sci. (to be published).
092903-10 A. A. Kozhberov and D. A. Baiko Phys. Plasmas 22, 092903 (2015)
This article is copyrighted as indicated in the article. Reuse of AIP content is subject to the terms at: http://scitation.aip.org/termsconditions. Downloaded to IP:
194.85.224.35 On: Mon, 26 Oct 2015 11:34:12


![[PPT]Mohr-Coulomb Model - Civil, Environmental and …ceae.colorado.edu/~sture/plaxis/slides/Mohr Coulomb Model... · Web viewMohr-Coulomb Model Short Course on Computational Geotechnics](https://cdn.vdocuments.us/doc/165x107/5afa21707f8b9aac248f648f/pptmohr-coulomb-model-civil-environmental-and-ceae-stureplaxisslidesmohr.jpg)


