Cost and Management of ssSTPs Improving Sewage Management and Reuse
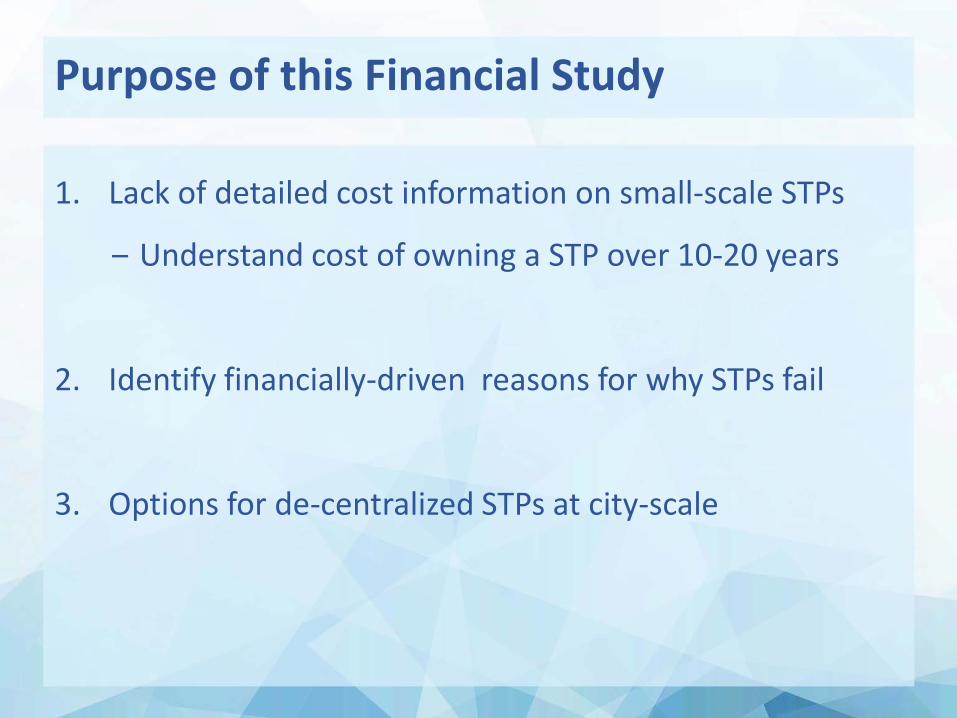
Purpose of this Financial Study
1. Lack of detailed cost information on small-scale STPs
‒ Understand cost of owning a STP over 10-20 years
2. Identify financially-driven reasons for why STPs fail
3. Options for de-centralized STPs at city-scale

Technologies Studied
1. MBR Membrane Bio-Reactor
2. SBR Sequencing Batch Reactor
3. MBBR Moving Bed Biofilm Reactor
4. ASP Activated Sludge Process
5. EA Extended Aeration
6. P-MBBR Packaged MBBR
7. DEWATS ABR-based non-mechanized systems
8. SBT-CAMUS Soil Bio-Technology (non-mechanized)

Many factors determine cost of a STP
1. Quality of components
2. Design Specifications: Capacity, component ratings etc
3. Climatic conditions
4. Soil type
5. Automation
6. Geographic location
7. Location within a site (underground/basement etc)
8. Profit margins of designer
1. Lifecycle Cost of STPs
2. Failure and Management
3. City-scale De-centralization

Cost Headers
A. Capital Costs
• Civil Construction and Tanks
• Electro-mechanical components: Pumps, Blower etc.
B. O&M Costs
• Labor
• Electricity
• Consumables
• Minor maintenance
C. Capital Maintenance Costs
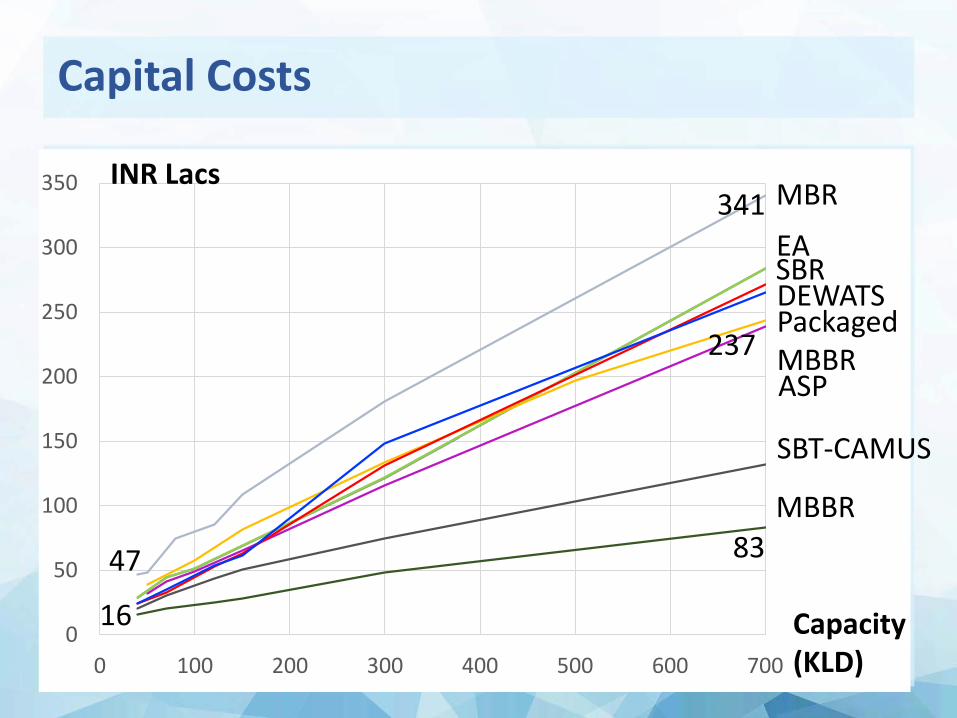
Capital Costs
16
83 47
341
0
50
100
150
200
250
300
350
0 100 200 300 400 500 600 700
INR Lacs
ASP
MBBR
MBR
EA DEWATS
SBT-CAMUS
Packaged MBBR
SBR
Capacity (KLD)
237
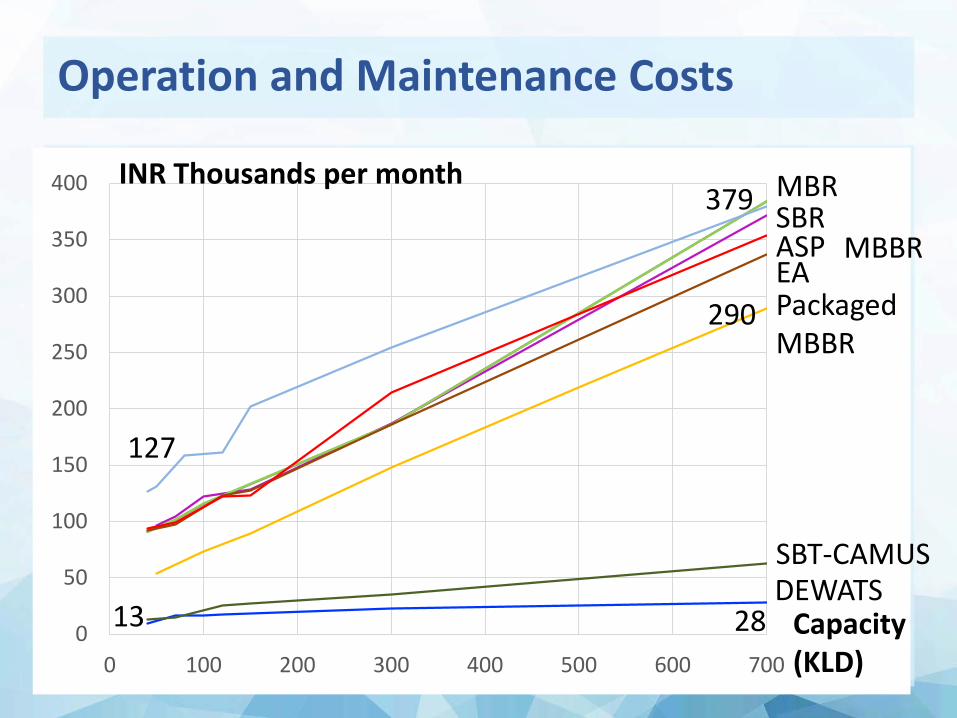
Operation and Maintenance Costs
127
28 13 0
50
100
150
200
250
300
350
400
0 100 200 300 400 500 600 700
INR Thousands per month
Capacity (KLD)
ASP MBBR
MBR
EA
DEWATS SBT-CAMUS
Packaged MBBR
SBR 379
290

Life Cycle Costs (LCC) (10 years)
303
1,219
44 243
0
200
400
600
800
1'000
1'200
0 100 200 300 400 500 600 700
780
INR Lacs
Capacity (KLD)
ASP
MBBR
MBR
EA
DEWATS SBT-CAMUS
Packaged MBBR
SBR
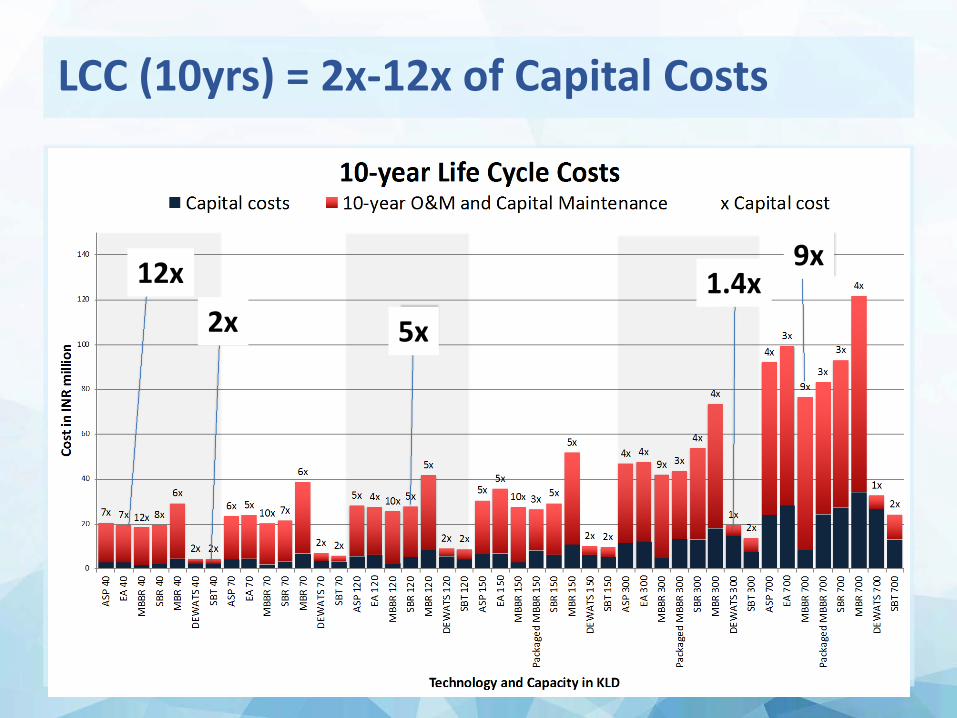
LCC (10yrs) = 2x-12x of Capital Costs
12x 2x 5x
1.4x 9x

Scale makes STPs more affordable
1,490
308
134 51 0
200
400
600
800
1'000
1'200
1'400
1'600
0 100 200 300 400 500 600 700 800 900 1000 1100 1200
INR per Household per Month
# of HH
ASP MBBR
MBR
EA
DEWATS SBT-CAMUS P-MBBR
SBR

Premium Components can be lowest LCC
• Premium components require least Capital Maintenance
1.3 1.2 1.2
3.4 3.4 3.4
0.4 0.5 0.6 5.1 5.2 5.2
0
1
2
3
4
5
6Premium Standard Substandard
Cost
s in
INR
cror
es
SBR - 300 KLD system
Capital Costs 10-year O&M Capital Maintenance
+10 - 18%
-5 - 0%
1. Lifecycle Cost of STPs
2. Failure and Management
3. City-scale De-centralization

Key stakeholders
• Financial factors determine management choices • Buyers and long-term owners are often different parties • Conflicting incentives among Stakeholders
Planning, Design, Implementation
Real estate developer
Architect, MEP Consultant, EPC Contractor etc
STP designer and installer
Operations and Maintenance
Owner / RWA
O&M Service Provider
O&M Staff
Regulations and Permits
State Pollution Control Board
Municipality: Building Permits
Water and Sewerage Board

5 Common O&M Models Model Cost Risks and Challenges
1. In-house staff (Part time) $
• Training, Quality, Absenteeism • Risk of poor asset maintenance • Supervision likely will be weak • Automation can reduce risks
2. In-house staff (Full-time) $$
3. O&M by System Designer $$$$
• Operator may not report system problems
4. Independent Service Provider $$$$ • Can blame designer for problems
5. Facility Management Company
$$$ • Lack of specialization • Can blame designer for problems
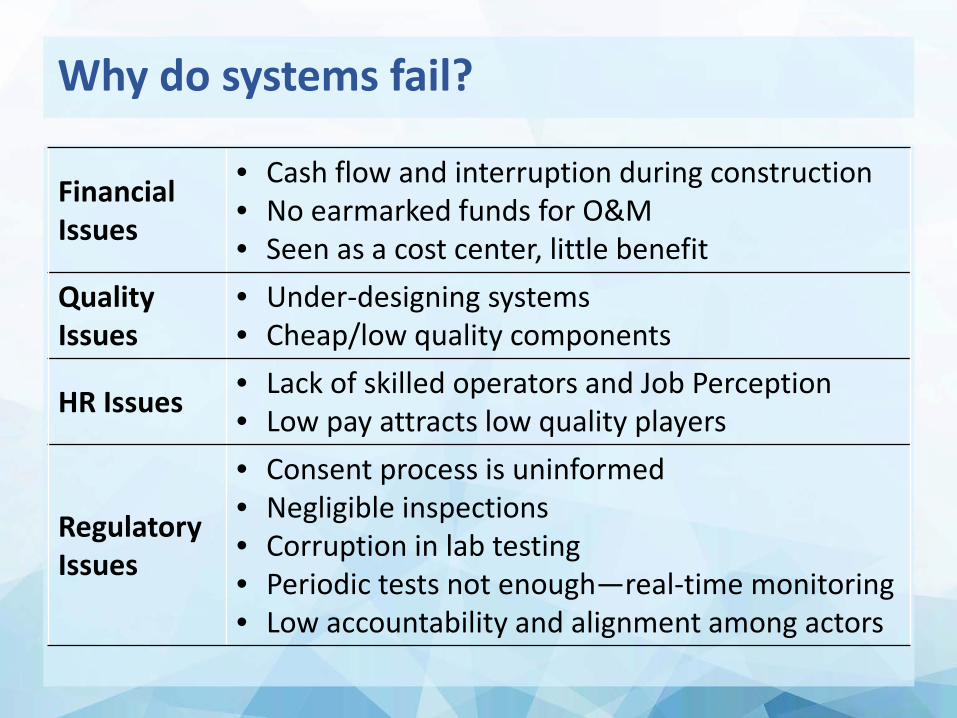
Why do systems fail?
Financial Issues
• Cash flow and interruption during construction • No earmarked funds for O&M • Seen as a cost center, little benefit
Quality Issues
• Under-designing systems • Cheap/low quality components
HR Issues • Lack of skilled operators and Job Perception • Low pay attracts low quality players
Regulatory Issues
• Consent process is uninformed • Negligible inspections • Corruption in lab testing • Periodic tests not enough—real-time monitoring • Low accountability and alignment among actors
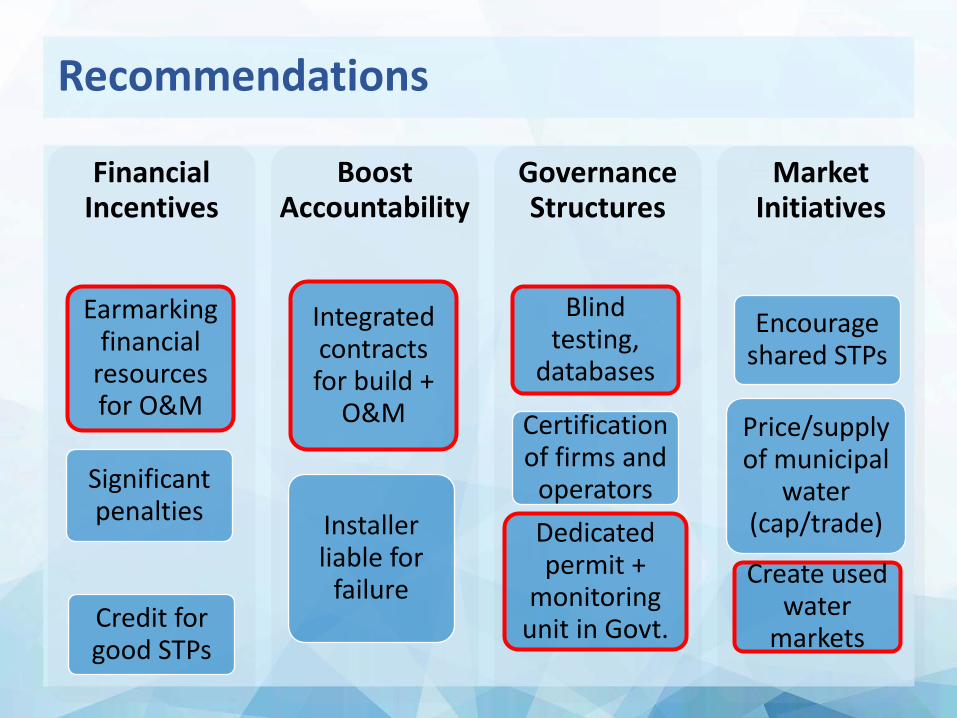
Financial Incentives
Earmarking financial
resources for O&M
Significant penalties
Credit for good STPs
Boost Accountability
Integrated contracts for build +
O&M
Installer liable for
failure
Governance Structures
Blind testing,
databases
Certification of firms and
operators Dedicated permit +
monitoring unit in Govt.
Market Initiatives
Encourage shared STPs
Price/supply of municipal
water (cap/trade)
Create used water
markets
Recommendations

1. Lifecycle Cost of STPs
2. Failure and Management
3. City-scale De-centralization
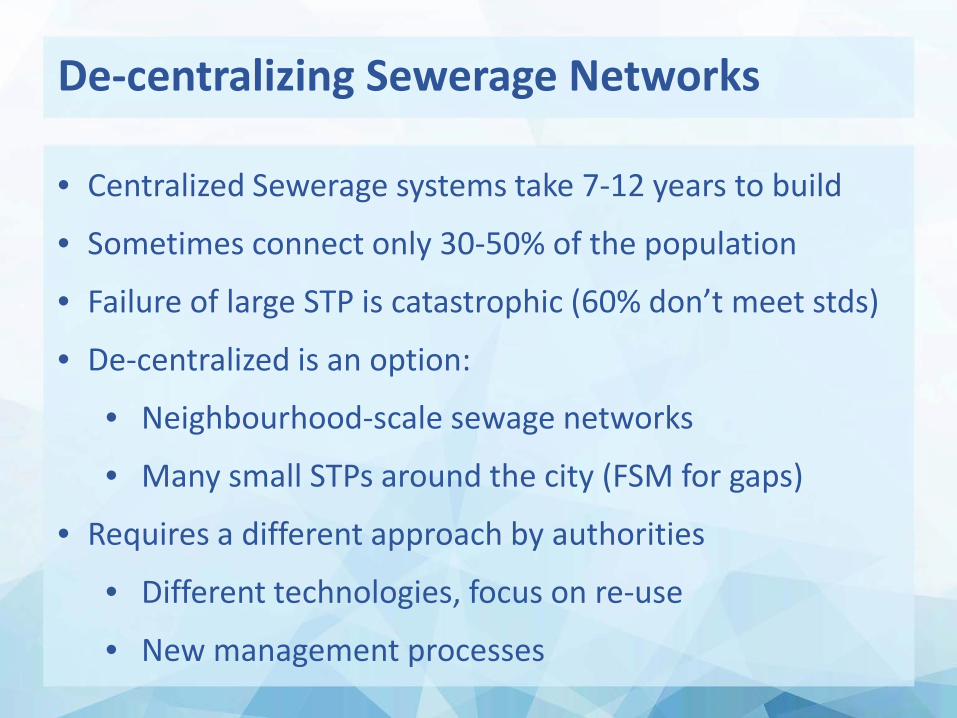
De-centralizing Sewerage Networks
• Centralized Sewerage systems take 7-12 years to build
• Sometimes connect only 30-50% of the population
• Failure of large STP is catastrophic (60% don’t meet stds)
• De-centralized is an option:
• Neighbourhood-scale sewage networks
• Many small STPs around the city (FSM for gaps)
• Requires a different approach by authorities
• Different technologies, focus on re-use
• New management processes
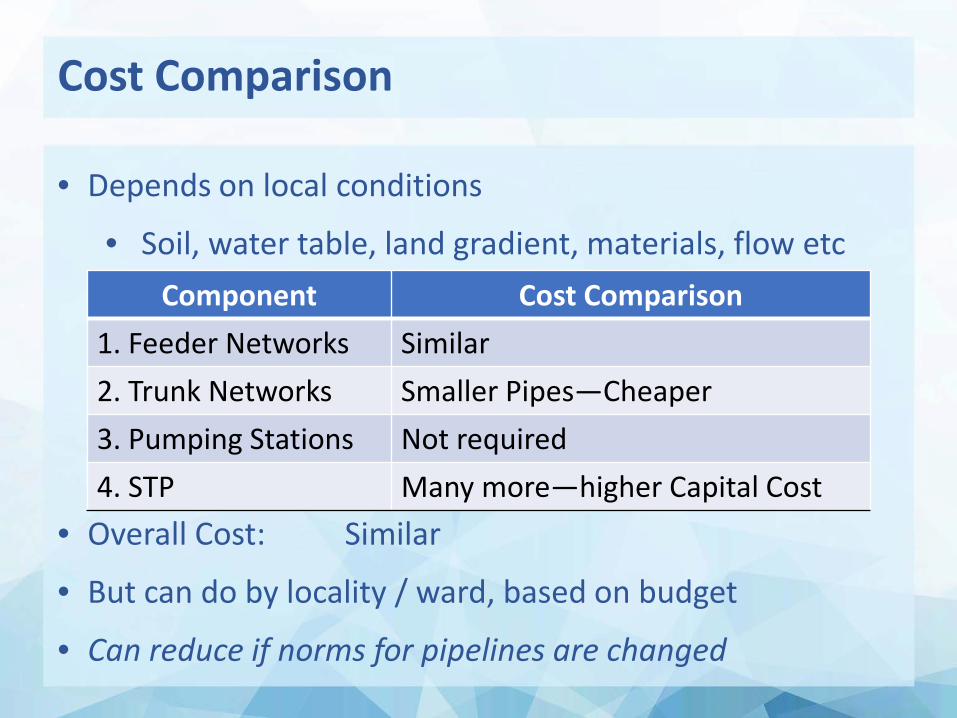
Cost Comparison
• Depends on local conditions
• Soil, water table, land gradient, materials, flow etc
• Overall Cost: Similar
• But can do by locality / ward, based on budget
• Can reduce if norms for pipelines are changed
Component Cost Comparison 1. Feeder Networks Similar 2. Trunk Networks Smaller Pipes—Cheaper 3. Pumping Stations Not required 4. STP Many more—higher Capital Cost

It’s a New Way : Benefits and Challenges
• Cap. Cost Similar to centralized, but can do locality-wise
• Time Can operationalize segments quickly (1-3 yrs)
• Tech More choice—select ideal tech for each STP
• Land Need many smaller plots
• Re-use Easier at local level (5-60% water shortage)
• Expansion Easier over time (save $$ today)
• Op. Cost Depends on STP tech
• Mgmt. Many locations—new systems and processes
Speed, Flexibility and Re-use are key advantages

Conclusions and Key Lessons
• STPs cost < 0.2% of building project cost
• Lifecycle cost is 2-12x Capital Cost
• Alignment of interest is needed for proper O&M
• Better rules / regulations, training and O&M models
• Financial investment, fines and incentives
• De-centralized STPs viable and beneficial for cities
• Wastewater re-use—cut water supply capital / O&M costs
and improve water security, health etc

Questions anyone?


