Download - corresponding au
MiR-206 suppresses the deterioration of intrahepatic cholangiocarcinoma and promotes
sensitivity to chemotherapy by inhibiting interactions with stromal CAFs
Renjie Yang1,2,3, Dong Wang2,3, Shen Han2,3, Yichao Gu2,3, Zhi Li2, Lei Deng2, Aihong Yin2, Yun Gao2,
Xiangcheng Li2, Yue Yu2*, Xuehao Wang1,2*
1 School of Medicine, Southeast University, Nanjing, China.
2 Hepatobiliary Center, The First Affiliated Hospital of Nanjing Medical University; Key Laboratory of Liver
Transplantation, Chinese Academy of Medical Sciences; NHC Key Laboratory of Living Donor Liver
Transplantation (Nanjing Medical University), Nanjing, Jiangsu Province, China.
*corresponding author: Xuehao Wang, Hepatobiliary Center, The First Affiliated Hospital of Nanjing Medical
University; Key Laboratory of Liver Transplantation, Chinese Academy of Medical Sciences; NHC Key
Laboratory of Living Donor Liver Transplantation (Nanjing Medical University), Nanjing, Jiangsu Province,
China; School of Medicine, Southeast University, Nanjing, China. E-mail: [email protected];
Yue Yu, Hepatobiliary Center, The First Affiliated Hospital of Nanjing Medical University; Key Laboratory of
Liver Transplantation, Chinese Academy of Medical Sciences; NHC Key Laboratory of Living Donor Liver
Transplantation (Nanjing Medical University), Nanjing, Jiangsu Province, China; E-mail: [email protected].
3These authors contributed equally to this work.
Abstract
Background: Intrahepatic cholangiocarcinoma (iCCA) is a highly malignant subtype of
cholangiocarcinoma (CCA) with poor prognosis. In iCCA, the interplay between the stroma and
tumor cells results in resistance to adjuvant chemotherapy. Increasing evidence indicates that miR-
206 participates in tumor progression, but its role in iCCA is still unclear. The aim of this study was
to identify dysregulated miR-206 expression in iCCA and to further explore the underlying
mechanism.
Methods: MiR-206 expression was proven to be downregulated in iCCA tissues by qPCR, and its
correlation with clinical characteristics and prognosis was investigated. iCCA-derived cancer-
associated fibroblast cells (CAFs) and normal fibroblast cells (NFs) were isolated and identified.
MiR-206 was knocked in or down in CAFs and CCA cells, respectively, to explore the role of miR-
206, and coculture of these treated CCAs and CAFs was conducted to explore the effects of miR-
206 on their mutual promoting effects. Exosomes carrying miR-206 and an orthotopic mouse model
were used to determine the inhibitory effects of miR-206 on iCCA deterioration in vivo.
Results: We confirmed that miR-206 is a suppressor of iCCA. Overexpressing miR-206 in CCA
cells inhibited cell proliferation, migration and invasion. When cocultured with CCA cells, NFs
downregulated miR-206 expression, and NFs were susceptible to transforming into CAFs.
Moreover, CAFs promoted CCA cell malignant behaviors and gemcitabine resistance.
Overexpressing miR-206 in CAFs or CCA cells inhibited this mutual promoting effect. Additionally,
when delivered by exosomes, miR-206 suppressed tumor deterioration. And combined with
gemcitabine, this treatment resulted in a longer survival time.
Conclusion: Our study explained that the interaction between CCA cells and CAFs promoted iCCA
deterioration. As a suppressive factor, miR-206 inhibited aggressive characteristics and gemcitabine
resistance by interfering with this mutual promoting effect. This research elucidated the molecular

mechanism underlying the unfavorable chemotherapeutic response of patients with iCCA, which
provided a promising target for iCCA treatment.
Keywords: intrahepatic cholangiocarcinoma, cancer-associated fibroblasts, miR-206, cytokines,
exosome
Graphical abstract
Introduction
Intrahepatic cholangiocarcinoma (iCCA), which occurs in the liver, is a rare subtype of
cholangiocarcinoma (CCA) [1]. The incidence and mortality of iCCA have been sharply increasing
in recent decades [2]. Surgical resection is an effective treatment for iCCA patients; unfortunately,
some patients with early disease are ineligible for surgical resection because of locally advanced
disease or metastasis. Gemcitabine-based regimens are currently widely used in iCCA treatment.
However, neither gemcitabine monotherapy nor gemcitabine-combined chemotherapy achieves
satisfactory responses in unresectable patients [3]. This highlights the importance of identifying new
therapeutic options for iCCA.
Currently, tumor aggressiveness is no longer thought to be determined by tumor cells alone. The
tumor microenvironment (TME) has been proven to affect tumorigenesis and progression [4-6]. In
the primary tumor mass, tumor cells regulate the local environment, which may in turn promote
tumor cell malignant behaviors. In addition, exposure of tumors to various stimuli, such as
chemotherapy drugs, triggers several signalling pathways in the TME, leading to tolerance to

chemotherapeutic drugs. Histologically, iCCA is characterized by abundant stroma, and the majority
of its malignant behaviors are related to fibrotic and microvessel environments [7]. In the stroma of
iCCA, alpha-SMA+ CAFs are the predominant components[8]. Several studies have shown that the
alpha-SMA+ environment advances tumor stage and predicts unfavorable outcomes [9]. As a barrier
to chemotherapeutic drugs, CAFs support cancer deterioration in response to stimuli received from
CCA cells. Reports show that the presence of CAFs is correlated with chemotherapy resistance and
poor clinical outcomes in patients with solid cancers, including iCCA[10, 11]. This mutual
promoting effect suggests that it is difficult to effectively suppress tumor deterioration with
traditional chemotherapy drugs that target only cancer cells. Therefore, targeting the complicated
tumor environment has been considered a promising treatment strategy [12, 13].
MicroRNAs (miRs), a class of noncoding RNAs, play important roles in cancer development.
Previous studies have shown that miRs regulate the biological behaviors of tumor cells. MiRs have
also been reported to participate in TME formation and to be related to tumor deterioration[14]. It
has been reported that mir-206 acted as an anti-oncogene in many human tumors. Previous studies
suggested that its decreased level in various tumors led to tumor cell growth, migration, invasion
and apoptosis, including lung, liver, gastric, breast, colorectal cancer [15-19]. Besides, miR-206
was proven to play roles in suppressing hepatic stellate cells activation and liver fibrosis[20].
However, the role of miR-206 in iCCA is unknown. Here, we identified miR-206 as a suppressor
factor and further investigated the role of miR-206 in iCCA deterioration and the underlying
mechanism.
Materials and Methods
Sample collection and NF and CAF isolation
Tissues were obtained from patients who underwent surgical treatment at the First Affiliated
Hospital of Nanjing Medical University. This study was approved by the institutional ethics
committee of University and was conducted in accordance with the principles of the Declaration of
Helsinki. All the samples were pathologically identified as being iCCA samples. Paired NFs and
CAFs were isolated from fresh iCCA patient tumor tissues. NFs were isolated from adjacent tissues,
which were located at least 5 cm from the tumor margin. Isolated NFs and CAFs were harvested
and identified based on the expression of the fibroblastic marker Vimentin by immunostaining, and
CAFs expressed higher levels of alpha-SMA and FAP than NFs (Figure S1).
RNA-Fluorescence In Situ Hybridization (FISH)
A FISH kit (Roche, Basel, Switzerland) was used to detect the expression of miR-206 in iCCA
tissues and cells. The miR-206 probe was purchased from Sigma–Aldrich (St. Louis, MO, USA).
Fluorescence images were captured using a laser confocal scanning microscope (FV1000; Olympus,
Tokyo, Japan).
Cell culture and co-culture
A human normal intrahepatic bile duct cell line (HiBEC cells), two human CCA cell lines (HUCCT1
and RBE cells), the human umbilical vein endothelial cell line (HUVECs) and the 293T cell line
were purchased from American Type Culture Collection (ATCC, Manassas, VA, USA). HiBECs,
HUVECs and 293T cells were cultured in DMEM supplemented with 1% penicillin/streptomycin
and 10% FBS (medium and supplement from Gibco®, Gaithersburg, MD). The HUCCT1 and RBE
cell lines were cultured in RPMI-1640 medium supplemented with 1% penicillin/streptomycin and

10% FBS. The NFs and CAFs isolated from human tissues were cultured in Dulbecco’s modified
Eagle’s medium (DMEM)/F12 supplemented 1% penicillin/streptomycin and 15% FBS (medium
and supplement from Gibco®, Gaithersburg, MD). Transwell chambers were employed in this study
to coculture cells (Figure S2A). Gemcitabine was purchased from MedChemExpress (Shanghai,
China). The IC50 values of gemcitabine in the HUCCT1 and RBE cells were detected by CCK-8
assay (gemcitabine IC50 values: 0.0236 µmol/L in HUCCT1 and 2.51 µmol/L in RBE cells, Figure
S2B). Cytokines, including IL-1beta, IL-6, IL-8, VEGF-alpha, CXCL12, and TGF-beta1, were
purchased from Beyotime Biotechnology (Shanghai, China).
Exosome isolation, identification, tracing and transfection
Cells were cultured in DMEM/F12 (Gibco, Germany) without FBS for 48 hours in preparation for
exosome isolation. Conditioned medium (CM) was collected from the cells. The CM samples were
centrifuged at 300 × g for 10 min to remove the dead cells, then centrifuged at 3,000 × g for 10 min
to remove the residual debris, and then filtered through a 0.22-µm filter (Nalgene™, Waltham, MA).
ExoQuick-TCExosome Precipitation Solution (System Biosciences, Mountain View, CA, USA)
was used to extract the exosomes. Transmission electron microscopy (TEM) was used to observe
exosome morphology, and nanoparticle tracking analysis (NTA) (Zetasizer Nano ZS90, Malvern
Panalytical) was used to determine the size and concentration of the exosomes. CD9, CD63 and
Tsg101 expression was analyzed by Western blotting to characterize the isolated exosomes. CM-Dil
solution (Invitrogen, Carlsbad, CA, USA) was used to trace the exosomes. The exosomes were
loaded with miR-206-mimic using an Exo-Fect Exosome Transfection Kit (System Biosciences).
The exosomes carrying the miR-206-mimic were named miR-206-mimic/exo, and those carrying
the negative control were named NC-mimic/exo. For the in vitro experiments, exosomes were used
to treat cells at a concentration of 50 µg protein/105 cells.
Cell transfection
Negative control (NC) mimic, miR-206-mimic, NC-inhibitor and miR-206-inhibitor were
purchased from GeneChem (Shanghai, China). HUCCT1 and RBE cells were transfected with the
NC-mimic and miR-206-mimic with Lipofectamine 3000 reagent (Invitrogen, Carlsbad, CA, USA).
The NFs isolated from human tissues were transfected with the NC-inhibitor or miR-206 inhibitor.
Cy3 labelling was used to trace miR-206. Paired CAFs were transfected with the NC-mimic or miR-
206-mimic. LASP1 and Anxa2 overexpression plasmid vectors were synthesized by GeneChem
(Shanghai, China).
Quantitative real-time PCR (q-PCR) analysis.
RNA was extracted using TRIzol® reagent, and miR-206 cDNA was synthesized with the miRNA
1st Strand cDNA Synthesis Kit (by stem-loop); cDNA were synthesized from mRNA with the
HiScript® II Q RT SuperMix for qPCR (Vazyme, Nanjing, China). Q-PCR analysis was used to
assess the miRNA and mRNA expression levels using the Thermal Cycler Dice Detection System
with AceQ qPCR SYBR Green Master Mix, according to the manufacturer's protocol (High ROX
Premixed; Vazyme, Nanjing, China). The sequences of the primers used in this study are listed in
Supplemental Table 1.
Western blotting (WB), immunohistochemistry (IHC) and immunofluorescence (IF) staining.
Cells were lysed by incubation on ice for 20 min. Proteins were extracted with a protein extraction
kit (Beyotime, Shanghai) and used for WB assays. Tissue samples were incubated with 10% neutral
buffer and then embedded in formalin paraffin for IHC. Antibodies against alpha-SMA, FAP, Ki67,
E-cadherin, Vimentin, LASP1, Anxa2, p-STAT3, STAT3, Nanog, CD9, CD68, Tsg101, Bcl-2 and

Bax were purchased from Cell Signaling Technology (Danvers, MA, USA). An anti-beta-actin
antibody was used as the control. For IF staining, cells were seeded on previously prepared
coverslips and incubated for 24 hours. After being fixed with 4% paraformaldehyde, the cells were
treated with 0.1% Triton-100 and then incubated with 5% goat serum. Then, the cells were stained
with primary and secondary antibodies. Primary antibodies against Vimentin, alpha-SMA and FAP
were purchased from Cell Signaling Technology (Danvers, MA, USA). The nuclei were stained
with 4',6-diamidino-2-phenylindole (DAPI). Then, fluorescence was detected using a Nikon Eclipse
80i microscope.
Cell counting kit (CCK)-8 and colony formation assays
A CCK-8 assay was used to assess cell viability. Cells were plated in 96-well plates at
2×10³ cells/well (four replicates per group). Cell viability was measured with a microplate reader
(Bio–Rad, Hercules, CA, USA). For the colony formation assay, 500 cells were seeded per well.
The culture medium was renewed twice a week. When we harvested the colonies, the cells were
washed three times with PBS and stained with crystal violet solution. The cell colonies were counted
with ImageJ software. Each experiment was performed in triplicate.
Transwell migration assays, invasion assays, wound healing assays
Transwell migration, invasion and wound healing assays were conducted to monitor cell motility
and metastasis. For the Transwell migration assays, 3000 cells (HUCCT1 cells, RBE cells, NFs or
CAFs) were added to the upper chamber (Corning, Bedford, MA, USA) in 500 μL serum-free
medium. Membranes coated with Matrigel (BD Biosciences, Bedford, MA, USA) were used in the
invasion assays. Serum-free medium containing exosomes was added to the upper chamber. The
cells were incubated for 24 h at 37 °C in a 5% CO2 atmosphere. The cells were fixed with methanol,
stained with 1% toluidine blue, and air-dried. The cell numbers were counted using Image-Pro Plus
software (IPP; Media Cybernetics Corporation, USA). For the wound healing assays, cells were
seeded in six-well plates at 90% confluence. A vertical wound was generated by dragging a plastic
pipette tip across the cell monolayer, and the detached cells were removed. The cells were incubated
at 37 °C, and phase contrast images of the wounds were captured after 48 hours of incubation.
Images of the wound in each sample were captured in at least three fields of vision.
Sphere formation assay
HUCCT1 and RBE cells were plated in 6-well ultralow attachment plates (Corning Inc., New York,
NY, USA) at a density of 100 cells/well. The cells were then cultured for 7 days in serum-free
DMEM/F12 medium supplemented with 20 ng/mL epidermal growth factor (EGF, PeproTech,
USA), 10 ng/mL basic fibroblast growth factor (bFGF, PeproTech, USA), and 2% B27 supplement
(Gibco, Germany). The culture media was supplemented with an additional 2% B27, bFGF and
EGF every other day. The colonies were counted and imaged under a light microscope.
Dual-luciferase reporter assay
PmirGLO reporter plasmids carrying WT or mutant sequences from the 3′UTR of Anxa2 or LASP1
and a miR-206 mimic or scramble control were cotransfected into 293T cells with Lipofectamine
3000 (Invitrogen; Thermo Fisher Scientific, Inc.). After 48 hours, the cells were harvested and lysed.
Then, the firefly and Renilla luciferase activities were measured using the Dual-
Luciferase® Reporter Assay System (E1910, Promega, USA) according to the manufacturer’s
protocol.
Collagen contraction assay.
A total of 2 × 10⁵ NFs or CAFs were embedded in a gel composed of rat tail Col-I. The mixture

(500 μL) was aliquoted into individual wells of a 24-well plate, and the plate was incubated at 37 °C.
After 30 mins, a pipette tip was used to detach the collagen gels from the wells. Then, complete
DMEM was added to the wells. Two days later, the collagen gels were imaged, and their diameters
were measured.
Matrigel tube formation assay.
HUVECs were diluted in serum-free RPMI 1640 medium, and 4*104 cells in 100 µl were added to
each well of a 96-well culture plate that had been precoated with Matrigel (BD Biosciences, Bedford,
MA, USA). In addition, 100 µL CM from NC-mimic/CAFs or miR-206-mimic/CAFs was added to
the wells (1:1 ratio of CM to serum-free RPMI 1640). Then, the plate was incubated at 37 °C for
8 hours. Tube formation was visualized under an inverted microscope, and the results were analyzed
by Image-Pro Plus software (IPP; Media Cybernetics Corporation, USA). The tube structures from
three randomly chosen fields of view were imaged under a microscope and analyzed.
Enzyme-Linked Immunosorbent Assay (ELISA).
Cells were incubated in serum-free medium for 2 days. The concentrations of IL-1beta, IL-6, IL-8,
VEGF-alpha, CXCL12 and TGF-beta1 in the culture medium were detected using ELISA kits (R&D,
Minneapolis, MN, USA).
Flow cytometry (FCM)
FCM was performed using a flow cytometer (BD Biosciences, Franklin Lakes, NJ, US). For cell
cycle analysis, cells were washed with cold PBS, resuspended in 0.5 mL of 70% alcohol and
incubated at 4 °C overnight. The cells were centrifuged and washed with PBS, and 200 µL of cell
cycle reagent was added. The cells were incubated for 30 min in the dark at room temperature and
analyzed with a cell cycle analysis kit (Multi Sciences, Brentwood, UK). For cell apoptosis analysis,
an Annexin V-FITC/PI apoptosis kit (Multi Sciences, Hangzhou) was used to detect apoptotic cells.
The cells were fixed with 70% ethanol and incubated at -20 °C overnight before analysis.
Gemcitabine was used to induce apoptosis. For cell stemness analysis, the cells were incubated with
a CD44-PE antibody and CD133-APC antibody (BD Biosciences).
TUNEL staining
Xenograft tumors were collected for sectioning and TUNEL staining. TUNEL staining was
performed using the TUNEL Apoptosis Detection kit (R&D Systems, Inc.), according to the
manufacturer's protocol. Apoptotic cells were observed and images were captured with a
fluorescence microscope; green indicates apoptotic cells, and blue indicates nuclei.
In vivo xenograft experiments.
To determine the effects of CAFs on tumor growth, a subcutaneous xenotransplantation tumor
model was established in 6-week-old BALB/c nude mice (Charles River, USA). Before tumor cells
were injected, we injected isolated CAFs (2×10⁶ CAFs in 0.1 mL PBS) alone. Palpable
subcutaneous tumors were not detected in the mice, indicating that CAFs are not primarily
tumorigenic. Then, we subcutaneously injected a mixture of tumor cells and CAFs into the flanks
of mice to observe tumor formation. A mixture of 1.8*106 HUCCT1 cells and 2×10⁵ CAFs in 0.1
mL PBS was injected. Tumor volume was calculated every week according to the following formula:
Volume = 0.5×width2×length. After 1-2 weeks, the mice were intraperitoneally injected with
gemcitabine (50 mg/kg body weight in DMSO) once a week for a total of 2 weeks. All the mice
were killed in the 3-4 week, and tumor masses were harvested for further analysis.
Additionally, to simulate the tumor microenvironment in the liver, we also established an orthotopic
liver tumor model in 6-week-old BALB/c nude mice. HUCCT1 cells (1.8×10⁶) and CAFs (2×10⁵)
were premixed with Matrigel and then injected into a liver lobe with a 27G insulin syringe
(Myjector 1 mL, Terumo Corporation, Somerset, NJ). The mice were monitored after injection.
When a tumor mass could be observed in the mouse liver lobes and reached at least 1×1 cm (4–5
weeks), exosomes or drugs were administered, and we started to record the survival times of the
mice. Gemcitabine (50 mg/kg body weight in DMSO) was administered weekly by intraperitoneal
injection. Considering that NFs are not primarily tumorigenic, NF exosomes were collected and
stored at -80 °C for miR-206 transfection and in vivo injection. MiR-206-modified exosomes (100
µg exosome protein content in 200 µL PBS) were injected into the tail vein. Exosome injections
were consecutively administered two times a week. By staining the exosomes with CM-Dil, we
confirmed that the exosomes were transmitted to the liver and were absorbed by the liver (Figure
S2C). Tumor growth was monitored every 3 days. Survival time was recorded until mice died.
Statistical analysis
GraphPad Prism 7 software (San Diego, CA, USA) was used to present the results of statistical
analysis. All the experiments were performed an average of at least three times. The results are
presented as the mean ± SD of each group. Correlations between the clinicopathological parameters
and the miR-206 levels were assessed using the chi-square test or Fisher's exact test. The Kaplan–
Meier log rank test was used for survival analysis. Univariate and multivariate analyzes were
performed with the Cox proportional hazards model in SPSS 21.0. Statistical analysis of in vitro
experiments was performed with two-tailed Student’s t-test. In all cases, a P value less than 0.05
was considered statistically significant (* less than 0.05, ** less than 0.01, and *** less than 0.001).
Results
MiR-206 was a suppressive factor, and the downregulation of its expression promoted iCCA
deterioration
We analyzed 42 human iCCA tissues by qPCR. Compared with paired normal tissues, tumor tissues
exhibited obviously lower miR-206 expression (P=0.002, Figure 1A). The FISH results showed
decreased miR-206 expression in iCCA tissues compared with adjacent tissues (Figure 1B). The 42
patients were then classified into two groups based on miR-206 expression (Figure S2D), and the
correlation of miR-206 expression with patient clinical features is summarized in Table 1. miR-206
expression was negatively correlated with larger tumor size (P =0.0122) and positively correlated
with vascular invasion (P =0.0278). Kaplan–Meier analysis showed that low miR-206 expression
predicted unfavorable OS (P =0.0008) and DFS (P =0.0014) rates compared with those predicted
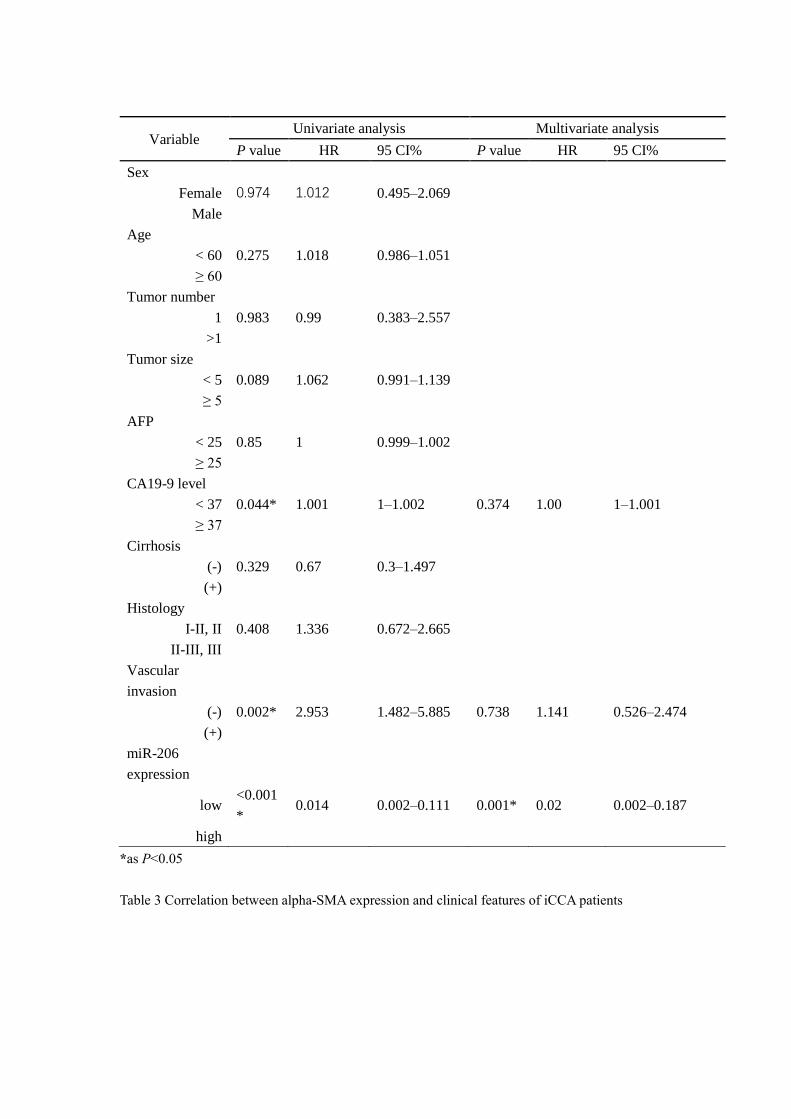
by high miR-206 expression (Figures 1C-D). Furthermore, the multivariate analysis results in Table
2 showed that miR-206 expression (P<0.001, HR=0.02) could be an independent prognostic factor
for unfavorable prognosis. We further analyzed the effects of the tumor stroma on these
characteristics. As shown in Table 3, alpha-SMA expression in tissues was also correlated with
vascular invasion (P =0.0278) and miR-206 expression (P<0.001), and low miR-206 expression in
tissues was accompanied by a strong alpha-SMA reaction (Figure 1E). We further analyzed the
expression of several molecular markers of malignancy, including E-cadherin, Vimentin, VEGF-
alpha and alpha-SMA, in iCCA tissues and found that a decrease in miR-206 expression was
significantly correlated with an increase in the expression of these markers (E-cadherin: R2=0.4284,
P<0.05, Vimentin: R2=0.5924, P <0.05, VEGF-α: R2=0.2901, P <0.05 and alpha-SMA: R2=0.369,
P <0.05) (Figure 1F); these results indicated that loss of miR-206 expression promoted iCCA
malignant behavior and stromal reaction.
Interaction between CCA cells and CAFs resulted in a further reduction in miR-206
expression
High numbers of neighboring CAFs are a typical characteristic of iCCA tissue (Figure 2A). We
isolated paired NFs and CAFs for the following experiments. As shown by qPCR and IF assays,
miR-206 expression was decreased in CAFs compared to paired NFs (P=0.0002, Figure 2B-C).
After coculture with HUCCT1 or RBE cells, the expression of miR-206 in CAFs was downregulated
(Figure 2D). TGF-beta1, which is secreted by tumor cells, is a well-known profibrotic cytokine, and
highly secreted by CCA cell lines compared to HiBEC cell (Figure S2E). After TGF-beta1
stimulation, miR-206 expression in CAFs was sharply decreased (Figure 2E). Then, we incubated
HUCCT1 and RBE cells with CM from NFs and CAFs, and a reduction in miR-206 expression was
also observed in CAFs group (Figure 2F). We used several cytokines associated with iCCA
malignancy to determine the cause of miR-206 downregulation and found that IL-6 caused the most
significant reduction in miR-206 expression in both HUCCT1 and RBE cells (Figure 2G, Figure
S2F). These results demonstrated that miR-206 was involved in the CCA-CAF interaction, which
was mainly attributed to IL-6 and TGF-beta1 secretion.
MiR-206 suppressed CCA cell proliferation, migration, and invasion and facilitated sensitivity
to chemotherapy.
To determine the effect of miR-206 on CCA cells, we detected the expression of miR-206 in CCA
cell lines (HUCCT1 and RBE cell lines) and found that its expression was downregulated compared
to that in HiBECs (Figure 3A). It has been reported that IL-6 contributes to CCA malignancy and
chemoresistance. We treated HUCCT1 and RBE cells with IL-6. IL-6 decreased miR-206
expression and enhanced CCA cell resistance to gemcitabine, but this enhanced gemcitabine
resistance was attenuated in miR-206-overexpressing cells (Figures 3B-C). This result suggested
that miR-206 might be involved in CCA malignant behaviors. We transfected the miR-206-mimic
or miR-206-inhibitor into HUCCT1 and RBE cells, and the efficacies of these transfections were
confirmed (Figure S3A). The CCK-8 assay showed that overexpression of miR-206 significantly
suppressed cell growth and inhibited colony formation in HUCCT1 and RBE cells, while knocking
down miR-206 expression promoted cell proliferation (Figures 3D-E, Figure S3B). Transwell
migration assays demonstrated that overexpression of miR-206 suppressed HUCCT1 and RBE cell
migration, while knocking down miR-206 expression promoted HUCCT1 and RBE cell migration.
Invasion assays showed that cells treated with the miR-206 inhibitor were more likely to cross to
the other side of the membrane (Figure 3F, Figure S3C), and wound healing assays showed that
miR-206 inhibited CCA cell motility (Figure 3G, Figure S3D); all of these results suggested that
downregulation of miR-206 expression enhanced cell invasion. Furthermore, we examined the
effect of miR-206 on drug resistance. After gemcitabine treatment (0.023 µmol/L for HUCCT1 cells
and 2.51 µmol/L for RBE cells) for 2 hours, the qPCR results showed that miR-206 expression was
significantly decreased in the cells treated with gemcitabine (Figure 3H). The results of the apoptosis
assay showed that in response to gemcitabine, the proportion of apoptotic HUCCT1 and RBE cells
transfected with the miR-206 mimic was significantly increased compared with that of CCA cells
transfected with the NC-mimic (Figure 3I). Gemcitabine is an anticancer agent that targets the cell
cycle. The FCM results showed that miR-206 induced cell cycle arrest in the G1/S phase and
inhibited cell cycle progression (Figure 3J).

MiR-206 suppressed CCA cell stem-like characteristics and TGF-beta1 secretion via
LASP1/STAT3 signalling.
The stem cell-like characteristics of tumor cells are responsible for drug resistance. The colony
formation assay experiments showed that cells overexpressing miR-206 formed more and larger
spheroid colonies than those transfected with the NC mimic, and these results were observed both
in HUCCT1 and RBE cells (Figure 4A). The results of the FCM assay demonstrated that miR-206
overexpression led to a decrease in the CD44+CD133+ population compared to the control (Figure
4B). We evaluated the mRNA levels of Nanog, Sox2, Oct4, and regulators of stemness and found
that the expression of these regulators was downregulated by miR-206 (Figure 4C).
Through a bioinformatics tool, LASP1 expression was previously reported to correlate with the
malignant phenotype of CCA, and LASP1 was predicted to be a direct target of miR-206 (Figure
4D). A predicted binding site in the 3’ untranslated region (UTR) of LASP1 mRNA was confirmed
by dual-luciferase reporter assay (Figure 4E). Correlation analysis showed that there was a link
between miR-206 and LASP1 in tissues (P<0.05, R2=0.5495, Figure 4F). The results of the WB
assay confirmed a decrease in LASP1 expression in miR-206-overexpressing cells and an increase
in LASP1 expression in cells treated with the miR-206 inhibitor (Figure 4G). After confirming
LASP1 overexpression from a plasmid (Figure 4H), we detected the effect of LASP1 on Nanog,
Sox2, and Oct4. The results showed that the downregulation of Nanog expression by miR-206 was
significantly reversed by LASP1 overexpression in HUCCT1 cells (Figure 4I). This result
demonstrated that LASP1 mediated the inhibitory effect of miR-206 on cell stem-like features by
regulating Nanog.
In the IL-6 receptor system, STAT3 signalling is aberrant activated in gemcitabine-resistant cells
and correlates with the stem-like phenotype of cells. As shown in Figures 4J-K, miR-206 suppressed
STAT3 phosphorylation and Nanog expression, and these effects were mediated by LASP1. Sphere
formation assay showed that LASP1 overexpression partially rescued formation of spheroid
colonies by HUCCT1 cells. Furthermore, treatment with Stattic, a specific STAT3 inhibitor,
suppressed the LASP1-induced sphere formation and expression of Nanog, as well as secretion of
TGF-beta1 (Figures 4L-M). These data suggest that LASP1/STAT3 mediated the effect of miR-206
on malignant characteristics of CCA, including drug resistance.
Reduction of miR-206 expression promoted NF reprogramming toward the CAF phenotype
and enhanced IL-6 secretion by targeting Anxa2.
In response to TGF-beta1, NFs are activated and susceptible to transforming into CAFs, as reflected
by the upregulation of alpha-SMA expression. MiR-206 expression was downregulated when NFs
were activated, but overexpression of miR-206 sharply decreased alpha-SMA expression (Figures
5A-B). We further studied the effect of miR-206 on CAF activation.
We then transfected CAFs with the miR-206 mimic and NFs with the miR-206 inhibitor. WB results
showed that knocking down miR-206 expression in NFs increased the alpha-SMA and FAP levels
and promoted NFs activation, while miR-206 overexpression in CAFs decreased alpha-SMA
expression (Figure 5C). Subsequent in vitro experiments demonstrated that miR-206 inhibited
proliferation, migration, pro-collagen contraction, angiogenesis and cytokine secretion (Figures
S4A-E). To explain the underlying mechanism, we screened the indicated genes predicted by a
bioinformatics tool and found that Anxa2 was a potential target of miR-206 [21]. A dual-luciferase
reporter assay confirmed that Anxa2 was a direct target of miR-206 (Figure 5D). The qPCR and WB
results showed that Anxa2 was overexpressed in CAFs compared to paired NFs, and its expression

was negatively regulated by miR-206 (Figures 5E-F). Correlation analysis confirmed a link between
miR-206 and Anxa2 in tissues (P<0.05, R2=0.3726, Figure 5G). We transfected CAFs with an Anxa2
overexpression plasmid and confirmed this effect by WB assay (Figure 5H). The results showed
that miR-206 decreased the alpha-SMA levels, and this reduction was reversed by Anxa2 (Figure
5I). In vitro experiments further demonstrated that Anxa2, which is regulated by miR-206, promoted
CAF proliferation, migration, collagen contraction, and angiogenesis (Figures 5J-M, Figures S4F-
H). We also analyzed the concentrations of cytokines, including IL-6, in CM from CAFs. The ELISA
results showed that Anxa2 reversed the miR-206-mediated suppression of cytokine secretion
(Figure 5N).
Overexpression of miR-206 suppressed the mutual promotion of malignant behaviors and
gemcitabine resistance in the CCA-CAF environment.
Our results explained the simultaneous reduction in miR-206 expression during CCA-CAF mutual
promotion. To explore whether miR-206 overexpression counteracts this mutual promoting effect,
we cocultured HUCCT1 cells with CAFs. Colony formation and migration assays showed that
HUCCT1 cells cultured with NC-mimic/CAFs exhibited enhanced proliferation and migration
potential compared to HUCCT1 cells cultured alone, whereas miR-206-mimic/CAFs exerted a
suppressive effect (Figures 6A-B, Figures S5A-B). CCK-8 and colony formation assays showed
that in cultures treated with gemcitabine, coculture with NC-mimic/CAFs rescued the growth and
colony formation abilities of HUCCT1 cells, and CAFs overexpressing miR-206 (miR-206-
mimic/CAFs) significantly suppressed HUCCT1 cell growth (Figure 6C, Figure S5C). Cell cycle
analysis showed that CAFs promoted HUCCT1 cell cycle progression from the G1 phase to the S
phase, while cell cycle progression was arrested by miR-206-mimic/CAFs (Figure 6D). Sphere
formation assay experiments showed that cells cocultured with miR-206-mimic/CAFs formed
smaller spheroid colonies than those cocultured with NC mimic/CAFs (Figure 6E). qPCR results
showed that Nanog, Sox2 and Oct4 expression in HUCCT1 cells was decreased when they were
cocultured with miR-206-mimic/CAFs (Figure 6F). Subcutaneous tumor implantation experiments
showed that CAFs coinjection promoted tumor growth when treated with gemcitabine (0.077 cm3
vs 0.245 cm3, P=0.0052), and miR-206 overexpression impaired the effect of CAFs in promoting
tumor growth (1.13 cm3 vs 0.592 cm3, P=0.0036, Figure 6G). The level of TGF-beta1 mRNA in
HUCCT1 cells was increased when the cells were cocultured with NC-mimic/CAFs, and coculture
with miR-206-mimic/CAFs eliminated this upregulated TGF-beta1 mRNA expression (Figure 6H).
The results demonstrated that upregulation of miR-206 expression in CAFs attenuated the
promotion of malignant behaviors and gemcitabine resistance.
Then, we cocultured NFs with NC-mimic/HUCCT1 cells or miR-206-mimic/HUCCT1 cells and
found that NF transformation into CAFs was delayed when cocultured with miR-206-
mimic/HUCCT1 cells (Figure 6I). The qPCR results showed that the mRNA levels of IL-1beta, IL-
6, IL-8, VEGF-alpha and CXCL12 in CAFs were reduced compared to those in CAFs cocultured
with NC-mimic/HUCCT1 cells (Figure 6J). This result suggested that miR-206 was involved in the
symbiotic CCA-CAF environment and that the upregulation of its expression may suppress this
mutual promoting effect.
Exosomes acted as carriers of miR-206 in the CCA-CAF environment
In coculture systems of miR-206-mimic/CAFs with HUCCT1 cells, Cy3-labelled miR-206 mimic
in HUCCT1 cells was observed by fluorescence microscopy, and Cy3-labelled NC mimic was used
as the control (Figure 7A). The qPCR results showed that the miR-206 level in the miR-206-

mimic/CAF group was much higher than that in the single culture group (Figure 7B). This finding
suggests that miR-206 can be transferred during CCA-CAFs communication. We isolated exosomes
from CAFs and identified them by TEM, NTA and WB (Figures 7C-D). We analyzed exosomes
from miR-206-mimic/CAFs and NC-mimic/CAFs, and we observed an obvious increase in the miR-
206 levels in the exosomes from miR-206-mimic/CAFs (Figure 7E). By staining exosomes with
CM-Dil, we confirmed that NC-mimic/CAF- and miR-206-mimic/CAF-derived exosomes were
internalized by HUCCT1 cells (Figure 7F). HUCCT1 cells treated with exosomes from miR-206-
mimic/CAFs displayed an apparent increase in their miR-206 levels (Figure 7G). These
observations suggested that exosomes might carry miR-206 and assist in miR-206 translocation into
CCA cells.
Exosome-delivered miR-206 eliminated the CCA-CAF mutually promoting environment and
suppressed malignancy
To exclude the possible roles of factors other than miR-206 in exosomes, we transfected the miR-
206-mimic directly into NF exosomes (miR-206-mimic/exo) and confirmed the success of the
transfection (Figure 8A). CCK-8 and colony formation assays showed that compared to NC-
mimic/exo, miR-206-mimic/exo significantly inhibited the cell growth and colony formation
potential of HUCCT1 cells (Figure 8B-C). Cell cycle analysis demonstrated that miR-206-
mimic/exo caused HUCCT1 cell cycle arrest in the G1/S phase (Figure 8D). The migratory behavior
of HUCCT1 cells was also suppressed by miR-206-mimic/exo (Figure 8E). WB results showed that
miR-206-mimic/exo suppressed LASP1, Nanog, and pSTAT3 expression in HUCCT1 cells (Figure
8F). In CAFs, as shown in IF and WB assays, the expression of CAF markers (alpha-SMA and FAP)
and Anxa2 was decreased by miR-206-mimic/exo compared to NC-mimic/exo (Figure 8G-H).
Next, we compared the inhibitory effects of miR-206-mimic/exo with those of gemcitabine.
HUCCT1 cells were seeded in 6-well plates, and CAFs were seeded in the upper chamber.
Gemcitabine (0.023 µmol/L) or miR-206-mimic/exo (50 µg/105 cells) was added to both chambers,
and cell colony formation was observed. In the presence of CAFs, the deleterious effect of
gemcitabine was sharply decreased, as shown by the increased colony formation of HUCCT1 cells.
In the miR-206-mimic/exo treatment groups, no significant difference in colony formation was
observed between the single culture group and coculture group. The fold change in colony number
after gemcitabine treatment was much higher than that after miR-206-mimic/exo treatment (Figure
8I). We also detected the expression of the apoptotic markers Bcl-2 and Bax in HUCCT1 cells. The
reduction in the Bcl-2/Bax ratio in the gemcitabine group was partially rescued by coculture with
CAFs, while this recovery was not observed in the group treated with miR-206-mimic/exo. The fold
change in the Bcl-2/Bax ratio after gemcitabine treatment was significantly higher than that after
miR-206-mimic/exo treatment (Figure 8J). These results suggested that compared to gemcitabine,
miR-206 may eliminate the promoting effects of CAFs and exert stronger inhibitory effects.
MiR-206-mimic/exo inhibited xenograft malignancy and, when combined with gemcitabine,
prolonged the survival time of a mouse model.
We further studied the effect of the combination of miR-206-mimic/exo and gemcitabine in an
orthotopic mouse model. Tumors were photographed, and the tumor volumes were analyzed.
Coinjection with CAFs led to an increase in xenograft volume in the gemcitabine-treated mice, but
this increase was not significant in the mice treated with miR-206-mimic/exo. After treatment with
gemcitabine combined with miR-206-mimic/exo, the tumor volumes were much smaller than those
in mice treated with each reagent alone (Figure 9A). Survival curve analysis showed more favorable

outcomes for the mice treated with combined therapy compared with the mice treated with
gemcitabine alone (38.5 versus 50.5 days, median survival time, P=0.0025) (Figure 9B). As shown
by the tissue IHC results, the combined treatment resulted in a lower proportion of Ki-67-positive
cells than treatment with each reagent alone (Figure 9C). MiR-206-mimic/exo decreased the alpha-
SMA+ area in tissues compared to gemcitabine treatment alone (Figure 9C). The TUNEL assay
showed that CAFs prevented gemcitabine-induced cell apoptosis, and gemcitabine combined with
miR-206-mimic/exo reversed the antiapoptotic effect of CAFs and enhanced the effect of
gemcitabine (Figure 9C).
Discussion
Our results showed that miR-206 was a suppressive factor in iCCA tissues. The downregulation of
miR-206 expression was related to the growth and aggressive phenotype of iCCA. Prognosis and
multivariate analysis showed that miR-206 was an independent prognostic factor and that decreases
in its expression predicted unfavorable patient outcomes.
Tumor is a complex tissue with intricate cell components. Even if tumor cells have the main role,
tumor progression cannot be accomplished without other stromal cells, especially in aggressive
cancers. Available evidence indicates that CCA microenvironment play a relevant role in its
progression and drug resistance. Aggressive phenotype of iCCA is the prototype of tissue containing
high amount of CAFs and other extracellular matrix [22]. As a result of CAFs’ reciprocal
communication with CCA cells by paracrine signaling, cancer growth and invasion are driven, and
CCA cells acquire cancer stem cell (CSC)-like property and acquired resistance to chemotherapeutic
drugs, such as gemcitabine [23]. Gemcitabine itself, as a stimulus, induces the iCCA interstitial
reaction and increases the expression of IL-6, which enhance tumor cell gemcitabine resistance [24].
As a suppressive gene, miR-206 is involved in the interaction between CCA cells and CAFs that
promotes the malignancy of CCA cells and enhances their resistance to gemcitabine, and this effect
is attributed to IL-6 and TGF-beta1 secretion (Figure 9D).
In cellular experiments, miR-206 inhibited the proliferation, migration and invasion of the HUCCT1
and RBE cell lines. LASP1 (LIM and SH3 domain protein 1) was recently identified as a regulator
of tumor progression and drug resistance in several cancers, including CCA [25-28]. In this study,
LASP1 was proven to be a target of miR-206 and promoted Nanog and TGF-beta1 expression via
the STAT3 pathway. TGF-beta1 signalling is aberrantly activated in cancers and plays important
roles in the tumor environment, including in the immunity of the tumor environment [29, 30].
Additionally, as a profibrotic mediator, TGF-beta1 plays important roles in promoting CAF
generation and tumor progression [31-33]. A well-known promotor of alpha-SMA expression is
Smad3, which is part of TGF-beta1 signaling pathway. Activated TGF-beta1 signaling frequently
occurs in stromal component of iCCA [34, 35]. After stimulation by TGF-beta1, NFs were
susceptible to transforming into CAFs, and this effect was accompanied by a further decrease in
miR-206 expression. Previous study proofed that TGF-beta1 inhibited miR-206 expression in
airway smooth muscle cell and induced proliferation by activating Smad2/3 [36]. Blockage of TGF-
beta/Smad2 increased miR-206 expression [37]. Han et al. demonstrated that histone deacetylase 4
(HDAC4) could be induced by TGF-beta1 and recruited to the miR-206 promotor to repress miR-
206 transcription during liver fibrogenesis [20]. These events suggest that secreted TGF-beta1 acts
as an upstream of miR-206 in CAFs and medicated CCA-induced CAFs generation.
In CAFs, we demonstrated that Anxa2 partially mediated the effect of miR-206. It has been reported
that Anxa2 (Annexin A2) is a profibrotic gene expressed during tissue fibrosis and cancer [21, 38-
40]. Mediated by Anxa2, downregulation of miR-206 expression promoted secretion of cytokines,
including IL-6, IL-8 and VEGF-alpha. VEGF-alpha, an angiogenesis regulator, is expressed in
approximately 50% of iCCA tumors and is associated with increased microvascular density and
poor prognosis [41-43]. Studies on IL-6 and IL-8 show that they play important roles in protecting
pancreatic adenocarcinoma from gemcitabine-induced apoptosis [44, 45]. In response to CAFs,
miR-206 expression was further downregulated in CCA cells. Our data show that IL-6 is the main
inducer of miR-206 reduction (fall to 0.36-fold approximately, Figure 2G). IL-6 is a multi-functional
cytokine, and IL-6/STAT3 signaling activation accounts for 50% of iCCA [46]. Influenced by other
environmental components and in particular IL-6, STAT3 is activated. Activation of STAT3 plays
crucial roles in promoting aggressive phenotype and resistance to a broad spectrum of
chemotherapeutic drugs [47]. For example, STAT3 activation within triple-negative breast cancer
led to epithelial-mesenchymal transition (EMT) phenotype and CSC markers expression, and
inhibiting STAT3 enhanced the cisplatin sensitivity [48]. Our data show that except for Nanog, miR-
206 expression is regulated by IL-6/STAT3 pathway. Previous study has explained that the IL-
6/STAT3 pathway might regulate pri-miR-206 posttranscriptionally and reduce mature miR-206
expression [49]. These data demonstrate that paracrine IL-6 is main cause of miR-206 reduction in
CCA cells.
Moreover, previous studies reported that increased TGF-beta1 and IL-6 contributed to
immunosuppressive microenvironment in iCCA. Hasita H et al. reported that tumor-associated
macrophages (TAMs) contribute to angiogenesis, immunosuppression and poor clinical prognosis
via STAT3 activation and TGF-beta1 secretion in iCCA[50, 51]. Other types of immune cells, such
as NK cells, neutrophil, were also affected by TGF-beta1[52, 53]. Through the influence of CCA-
CAFs crosstalk, CCA stroma contains an abundant immunosuppressive immune cells, which
facilitate tumor invasion and progression [54].
Current researches indicate that targeting crosstalk between cells populating local environment and
CCA cells is a novel promising approach for the management of CCA. A recent study showed that
IL-6 was highly expressed in murine and human CCA tissue, and targeting IL-6 signalling inhibited
CCA progression in vitro and in vivo [55]. TGF-beta signaling is also an effective target to suppress
CCA cell’s proliferation and survival [56]. By transfecting a miR-206 mimic into either tumor cells
or CAFs, IL-6 and TGF-beta1 expression decreased. We observed that the mutual promoting effect
between CCA cells and CAFs could be attenuated, and CCA cell malignancy could be inhibited.
These results suggest that miR-206 could be used as a drug to inhibit tumor growth and increase
gemcitabine efficiency.
Increasing numbers of studies have shown that the development of therapeutic exosomes may lead
to decreased immune rejection and improved safety compared to established cellular and drug-based
therapeutics[57]. As endogenous vesicles, exosomes are refined biological nanoplatforms.
Engineering exosomes has been used in cancer therapy as stable transfer of drugs, therapeutic
miRNA and proteins [58]. In this work, we confirmed that miR-206 mimic could be delivered by
fibroblasts-derived exosomes, and this transfer was not observed in CCA cells’ exosomes (Figure
S6). Following experiments showed exosomes carrying miR-206 exhibited improved delivery
efficiency compared to free miR-206 (Figures S7A-C). CCK-8 and qPCR assays showed that NF-
derived exosomes carrying miR-206 exerted more significant anticancer effects than CAF-derived
exosomes carrying miR-206 (Figures S7D-E). This effect might be attributed to the higher
concentration of malignancy-promoting molecules in CAF-derived exosomes than in CAF-derived
exosomes[59, 60]. Therefore, we used NF-derived exosomes as carriers to observe the anticancer
effect of miR-206. As shown in Figure 8, miR-206-mimic/exo eliminated the CCA-CAF mutual
promoting effect and improved gemcitabine sensitivity, evidenced by increased TUNEL staining.
In conclusion, our research demonstrates that miR-206 exerts its antitumor effect by inhibiting the
malignancy of tumor cells and stromal fibroblasts. MiR-206 promotes iCCA sensitivity to
gemcitabine and facilitates gemcitabine-induced tumor cell death mainly by suppressing the mutual
promoting effects of tumor cells and stromal fibroblasts. This work elucidated the mechanism
underlying drug resistance and highlights the potential of miR-206 as a new therapeutic target.
Abbreviations
CCA: cholangiocarcinoma; iCCA: intrahepatic cholangiocarcinoma; miR: microRNA; TME: tumor
microenvironment; CAF: cancer-associated fibroblast; NF: normal fibroblast; exo: exosome; alpha-
SMA: alpha-smooth muscle actin; FAP: fibroblast activation protein, alpha; FISH: fluorescence in
situ hybridization; IL: interleukin; VEGF-alpha: vascular endothelial growth factor alpha; CXCL:
chemokine; TGF-beta: transforming growth factor beta; WT: wild type; CSC: cancer stem cell; EMT:
epithelial-mesenchymal transition; TEM: transmission electron microscopy; NTA: nanoparticle
tracking analysis; NC: negative control; qPCR: quantitative real-time PCR; WB: Western blotting;
IHC: immunohistochemistry; IF: immunofluorescence; CM: culture medium; ELISA: enzyme-
linked immunosorbent assay; FCM: flow cytometry; STAT: signal transducer and activator of
transcription
Acknowledgements
This work was supported by grants from the National Natural Science Foundation of China
(81570565 to Y Yu, 31930020 to XH Wang).
Contributions
RJ. Y., D. W. and YC. G performed the experiments, analyzed the data, and draft the manuscript;
S.H. and Z.L. isolated CAFs; L.D., AH. Y. and Y.G. contributed to immunostaining; XC. L., Y.Y.
and XH.W. design the study, edit the paper and finalize the manuscript.
Competing interests
The authors have declared that no competing interests exist.
References
1. Rizvi S, Khan SA, Hallemeier CL, Kelley RK, Gores GJ. Cholangiocarcinoma - evolving concepts
and therapeutic strategies. Nat Rev Clin Oncol. 2018; 15: 95-111.
2. Saha SK, Zhu AX, Fuchs CS, Brooks GA. Forty-Year Trends in Cholangiocarcinoma Incidence
in the U.S.: Intrahepatic Disease on the Rise. Oncologist. 2016; 21: 594-9.
3. Lamarca A, Barriuso J, McNamara MG, Valle JW. Molecular targeted therapies: Ready for
"prime time" in biliary tract cancer. Journal of hepatology. 2020.
4. Belli C, Trapani D, Viale G, D'Amico P, Duso BA, Della Vigna P, et al. Targeting the
microenvironment in solid tumors. Cancer Treat Rev. 2018; 65: 22-32.

5. Laplane L, Duluc D, Bikfalvi A, Larmonier N, Pradeu T. Beyond the tumour microenvironment.
Int J Cancer. 2019; 145: 2611-8.
6. Ji GW, Wang K, Xia YX, Wang JS, Wang XH, Li XC. Integrating Machine Learning and Tumor
Immune Signature to Predict Oncologic Outcomes in Resected Biliary Tract Cancer. Annals of
surgical oncology. 2020.
7. Affo S, Yu LX, Schwabe RF. The Role of Cancer-Associated Fibroblasts and Fibrosis in Liver
Cancer. Annual review of pathology. 2017; 12: 153-86.
8. Zhang XF, Dong M, Pan YH, Chen JN, Huang XQ, Jin Y, et al. Expression pattern of cancer-
associated fibroblast and its clinical relevance in intrahepatic cholangiocarcinoma. Human
pathology. 2017; 65: 92-100.
9. Joshi RS, Kanugula SS, Sudhir S, Pereira MP, Jain S, Aghi MK. The Role of Cancer-Associated
Fibroblasts in Tumor Progression. Cancers. 2021; 13.
10. Chen X, Song E. Turning foes to friends: targeting cancer-associated fibroblasts. Nat Rev Drug
Discov. 2019; 18: 99-115.
11. Kubo N, Araki K, Kuwano H, Shirabe K. Cancer-associated fibroblasts in hepatocellular
carcinoma. World journal of gastroenterology. 2016; 22: 6841-50.
12. Nicolas-Boluda A, Vaquero J, Laurent G, Renault G, Bazzi R, Donnadieu E, et al. Photothermal
Depletion of Cancer-Associated Fibroblasts Normalizes Tumor Stiffness in Desmoplastic
Cholangiocarcinoma. ACS Nano. 2020.
13. Roma-Rodrigues C, Mendes R, Baptista PV, Fernandes AR. Targeting Tumor
Microenvironment for Cancer Therapy. Int J Mol Sci. 2019; 20.
14. Pascut D, Pratama MY, Vo NVT, Masadah R, Tiribelli C. The Crosstalk between Tumor Cells
and the Microenvironment in Hepatocellular Carcinoma: The Role of Exosomal microRNAs and
their Clinical Implications. Cancers. 2020; 12.
15. Ren XL, He GY, Li XM, Men H, Yi LZ, Lu GF, et al. MicroRNA-206 functions as a tumor
suppressor in colorectal cancer by targeting FMNL2. Journal of cancer research and clinical
oncology. 2016; 142: 581-92.
16. Liang Z, Bian X, Shim H. Downregulation of microRNA-206 promotes invasion and
angiogenesis of triple negative breast cancer. Biochemical and biophysical research
communications. 2016; 477: 461-6.
17. Yang Q, Zhang C, Huang B, Li H, Zhang R, Huang Y, et al. Downregulation of microRNA-206
is a potent prognostic marker for patients with gastric cancer. European journal of
gastroenterology & hepatology. 2013; 25: 953-7.
18. Yunqiao L, Vanke H, Jun X, Tangmeng G. MicroRNA-206, down-regulated in hepatocellular
carcinoma, suppresses cell proliferation and promotes apoptosis. Hepato-gastroenterology. 2014;
61: 1302-7.
19. Zhang YJ, Xu F, Zhang YJ, Li HB, Han JC, Li L. miR-206 inhibits non small cell lung cancer cell
proliferation and invasion by targeting SOX9. International journal of clinical and experimental
medicine. 2015; 8: 9107-13.
20. Han X, Hao C, Li L, Li J, Fang M, Zheng Y, et al. HDAC4 stimulates MRTF-A expression and
drives fibrogenesis in hepatic stellate cells by targeting miR-206. Oncotarget. 2017; 8: 47586-94.
21. Yang M, Wang C, Li S, Xv X, She S, Ran X, et al. Annexin A2 promotes liver fibrosis by
mediating von Willebrand factor secretion. Digestive and liver disease : official journal of the Italian
Society of Gastroenterology and the Italian Association for the Study of the Liver. 2017; 49: 780-

8.
22. Banales JM, Cardinale V, Carpino G, Marzioni M, Andersen JB, Invernizzi P, et al. Expert
consensus document: Cholangiocarcinoma: current knowledge and future perspectives consensus
statement from the European Network for the Study of Cholangiocarcinoma (ENS-CCA). Nat Rev
Gastroenterol Hepatol. 2016; 13: 261-80.
23. Fabris L, Sato K, Alpini G, Strazzabosco M. The Tumor Microenvironment in
Cholangiocarcinoma Progression. Hepatology. 2021; 73 Suppl 1: 75-85.
24. Toyota Y, Iwama H, Kato K, Tani J, Katsura A, Miyata M, et al. Mechanism of gemcitabine-
induced suppression of human cholangiocellular carcinoma cell growth. Int J Oncol. 2015; 47:
1293-302.
25. Herrmann AB, Muller ML, Orth MF, Muller JP, Zernecke A, Hochhaus A, et al. Knockout of
LASP1 in CXCR4 expressing CML cells promotes cell persistence, proliferation and TKI resistance.
Journal of cellular and molecular medicine. 2020; 24: 2942-55.
26. Huang H, Xue Q, Du X, Cui J, Wang J, Cheng D, et al. p21-activated kinase 4 promotes the
progression of esophageal squamous cell carcinoma by targeting LASP1. Molecular
carcinogenesis. 2020.
27. Yin L, Chen Y, Zhou Y, Deng G, Han Y, Guo C, et al. Increased long noncoding RNA LASP1-
AS is critical for hepatocellular carcinoma tumorigenesis via upregulating LASP1. Journal of cellular
physiology. 2019; 234: 13493-509.
28. Zhang H, Li Z, Chu B, Zhang F, Zhang Y, Ke F, et al. Upregulated LASP-1 correlates with a
malignant phenotype and its potential therapeutic role in human cholangiocarcinoma. Tumour
Biol. 2016; 37: 8305-15.
29. Xue VW, Chung JY, Cordoba CAG, Cheung AH, Kang W, Lam EW, et al. Transforming Growth
Factor-beta: A Multifunctional Regulator of Cancer Immunity. Cancers. 2020; 12.
30. Tang PC, Chan AS, Zhang CB, Garcia Cordoba CA, Zhang YY, To KF, et al. TGF-beta1 Signaling:
Immune Dynamics of Chronic Kidney Diseases. Front Med (Lausanne). 2021; 8: 628519.
31. Yoon H, Tang CM, Banerjee S, Delgado AL, Yebra M, Davis J, et al. TGF-beta1-mediated
transition of resident fibroblasts to cancer-associated fibroblasts promotes cancer metastasis in
gastrointestinal stromal tumor. Oncogenesis. 2021; 10: 13.
32. Chandra Jena B, Kanta Das C, Banerjee I, Das S, Bharadwaj D, Majumder R, et al. Paracrine
TGF-beta1 from breast cancer contributes to chemoresistance in cancer associated fibroblasts via
upregulation of the p44/42 MAPK signaling pathway. Biochem Pharmacol. 2021; 186: 114474.
33. Tang PM, Zhang YY, Lan HY. LncRNAs in TGF-beta-Driven Tissue Fibrosis. Noncoding RNA.
2018; 4.
34. Sulpice L, Rayar M, Desille M, Turlin B, Fautrel A, Boucher E, et al. Molecular profiling of stroma
identifies osteopontin as an independent predictor of poor prognosis in intrahepatic
cholangiocarcinoma. Hepatology. 2013; 58: 1992-2000.
35. Andersen JB, Thorgeirsson SS. Genetic profiling of intrahepatic cholangiocarcinoma. Current
opinion in gastroenterology. 2012; 28: 266-72.
36. Pan Y, Liu L, Li S, Wang K, Ke R, Shi W, et al. Activation of AMPK inhibits TGF-beta1-induced
airway smooth muscle cells proliferation and its potential mechanisms. Scientific reports. 2018; 8:
3624.
37. Yin H, Liu MH, Gao F, Shang HM. Pro-inflammatory and pro-fibrotic role of long non-coding
RNA RMRP in pediatric asthma through targeting microRNA-206/CCL2 axis. J Biol Regul Homeost
Agents. 2021; 35: 71-83.
38. Kolgelier S, Demir NA, Inkaya AC, Sumer S, Ozcimen S, Demir LS, et al. Serum Levels of
Annexin A2 as a Candidate Biomarker for Hepatic Fibrosis in Patients With Chronic Hepatitis B.
Hepat Mon. 2015; 15: e30655.
39. Wang K, Zhang T, Lei Y, Li X, Jiang J, Lan J, et al. Identification of ANXA2 (annexin A2) as a
specific bleomycin target to induce pulmonary fibrosis by impeding TFEB-mediated autophagic
flux. Autophagy. 2018; 14: 269-82.
40. Lou Y, Yu Y, Xu X, Zhou S, Shen H, Fan T, et al. Long non-coding RNA LUCAT1 promotes
tumourigenesis by inhibiting ANXA2 phosphorylation in hepatocellular carcinoma. Journal of
cellular and molecular medicine. 2019; 23: 1873-84.
41. Thelen A, Scholz A, Weichert W, Wiedenmann B, Neuhaus P, Gessner R, et al. Tumor-
associated angiogenesis and lymphangiogenesis correlate with progression of intrahepatic
cholangiocarcinoma. The American journal of gastroenterology. 2010; 105: 1123-32.
42. Yoshikawa D, Ojima H, Iwasaki M, Hiraoka N, Kosuge T, Kasai S, et al. Clinicopathological and
prognostic significance of EGFR, VEGF, and HER2 expression in cholangiocarcinoma. Br J Cancer.
2008; 98: 418-25.
43. Guedj N, Zhan Q, Perigny M, Rautou PE, Degos F, Belghiti J, et al. Comparative protein
expression profiles of hilar and peripheral hepatic cholangiocarcinomas. Journal of hepatology.
2009; 51: 93-101.
44. Xing HB, Tong MT, Wang J, Hu H, Zhai CY, Huang CX, et al. Suppression of IL-6 Gene by
shRNA Augments Gemcitabine Chemosensitization in Pancreatic Adenocarcinoma Cells. BioMed
research international. 2018; 2018: 3195025.
45. Imafuji H, Matsuo Y, Ueda G, Omi K, Hayashi Y, Saito K, et al. Acquisition of gemcitabine
resistance enhances angiogenesis via upregulation of IL8 production in pancreatic cancer.
Oncology reports. 2019; 41: 3508-16.
46. Sia D, Tovar V, Moeini A, Llovet JM. Intrahepatic cholangiocarcinoma: pathogenesis and
rationale for molecular therapies. Oncogene. 2013; 32: 4861-70.
47. Zhao C, Li H, Lin HJ, Yang S, Lin J, Liang G. Feedback Activation of STAT3 as a Cancer Drug-
Resistance Mechanism. Trends Pharmacol Sci. 2016; 37: 47-61.
48. Kuo WY, Hwu L, Wu CY, Lee JS, Chang CW, Liu RS. STAT3/NF-kappaB-Regulated Lentiviral
TK/GCV Suicide Gene Therapy for Cisplatin-Resistant Triple-Negative Breast Cancer. Theranostics.
2017; 7: 647-63.
49. Yang Y, Wang W, Chang H, Han Z, Yu X, Zhang T. Reciprocal regulation of miR-206 and IL-
6/STAT3 pathway mediates IL6-induced gefitinib resistance in EGFR-mutant lung cancer cells.
Journal of cellular and molecular medicine. 2019; 23: 7331-41.
50. Hasita H, Komohara Y, Okabe H, Masuda T, Ohnishi K, Lei XF, et al. Significance of alternatively
activated macrophages in patients with intrahepatic cholangiocarcinoma. Cancer science. 2010;
101: 1913-9.
51. van Dalen FJ, van Stevendaal M, Fennemann FL, Verdoes M, Ilina O. Molecular Repolarisation
of Tumour-Associated Macrophages. Molecules. 2018; 24.
52. Li H, Han Y, Guo Q, Zhang M, Cao X. Cancer-expanded myeloid-derived suppressor cells
induce anergy of NK cells through membrane-bound TGF-beta 1. J Immunol. 2009; 182: 240-9.
53. Fridlender ZG, Sun J, Kim S, Kapoor V, Cheng G, Ling L, et al. Polarization of tumor-associated
neutrophil phenotype by TGF-beta: "N1" versus "N2" TAN. Cancer cell. 2009; 16: 183-94.

54. Loeuillard E, Conboy CB, Gores GJ, Rizvi S. Immunobiology of cholangiocarcinoma. JHEP Rep.
2019; 1: 297-311.
55. Nguyen MLT, Bui KC, Scholta T, Xing J, Bhuria V, Sipos B, et al. Targeting interleukin 6 signaling
by monoclonal antibody siltuximab on cholangiocarcinoma. Journal of gastroenterology and
hepatology. 2021; 36: 1334-45.
56. Lustri AM, Di Matteo S, Fraveto A, Costantini D, Cantafora A, Napoletano C, et al. TGF-beta
signaling is an effective target to impair survival and induce apoptosis of human
cholangiocarcinoma cells: A study on human primary cell cultures. PloS one. 2017; 12: e0183932.
57. Luan X, Sansanaphongpricha K, Myers I, Chen H, Yuan H, Sun D. Engineering exosomes as
refined biological nanoplatforms for drug delivery. Acta Pharmacol Sin. 2017; 38: 754-63.
58. Gilligan KE, Dwyer RM. Engineering Exosomes for Cancer Therapy. Int J Mol Sci. 2017; 18.
59. Magesh P, Thankachan S, Venkatesh T, Suresh PS. Breast cancer fibroblasts and cross-talk.
Clin Chim Acta. 2021; 521: 158-69.
60. Miki Y, Yashiro M, Moyano-Galceran L, Sugimoto A, Ohira M, Lehti K. Crosstalk Between
Cancer Associated Fibroblasts and Cancer Cells in Scirrhous Type Gastric Cancer. Front Oncol.
2020; 10: 568557.
Tables
Table 1 Correlation between miR-206 expression and clinical features of iCCA patients

*as P<0.05
Table 2 Univariate and multivariate analyzes of miR-206 expression with clinical features of
patients
Index
iCCA
High
miR-206
expression
Low
miR-206
expression
P
Sex
Female 7 6 0.999
Male 14 15
Age
< 60 14 9 0.2146
≥ 60 7 12
Tumor number
=1 19 17 0.6628
>1 2 4
Tumor size
< 5 16 7 0.0122*
≥ 5 5 14
AFP
< 25 19 18 0.999
≥ 25 2 3
CA19-9 level
< 37 7 5 0.7337
≥ 37 14 16
Cirrhosis
(-) 18 16 0.6965
(+) 3 5
Histology
I-II, II 10 7 0.5303
II-III, III 11 14
Vascular invasion
(-) 16 8 0.0278*
(+) 5 13
*as P<0.05
Table 3 Correlation between alpha-SMA expression and clinical features of iCCA patients
Variable Univariate analysis Multivariate analysis
P value HR 95 CI% P value HR 95 CI%
Sex
Female 0.974 1.012 0.495–2.069
Male
Age
< 60 0.275 1.018 0.986–1.051
≥ 60
Tumor number
1 0.983 0.99 0.383–2.557
>1
Tumor size
< 5 0.089 1.062 0.991–1.139
≥ 5
AFP
< 25 0.85 1 0.999–1.002
≥ 25
CA19-9 level
< 37 0.044* 1.001 1–1.002 0.374 1.00 1–1.001
≥ 37
Cirrhosis
(-) 0.329 0.67 0.3–1.497
(+)
Histology
I-II, II 0.408 1.336 0.672–2.665
II-III, III
Vascular
invasion
(-) 0.002* 2.953 1.482–5.885 0.738 1.141 0.526–2.474
(+)
miR-206
expression
low <0.001
* 0.014 0.002–0.111 0.001* 0.02 0.002–0.187
high

*as P<0.05
Figures
Index
iCCA
low
alpha-SMA
expression
high
alpha-SMA
expression
P
Sex
Female 9 4 0.1809
Male 12 17
Age
< 60 13 10 0.5359
≥ 60 8 11
Tumor number
=1 19 17 0.6628
>1 2 4
Tumor size
< 5 15 8 0.0616
≥ 5 6 13
AFP
< 25 18 19 0.999
≥ 25 3 2
CA19-9 level
< 37 6 6 0.999
≥ 37 15 15
Cirrhosis
(-) 17 17 0.999
(+) 4 4
Histology
I-II, II 10 7 0.5303
II-III, III 11 14
Vascular invasion
(-) 16 8 0.0278*
(+) 5 13
miR-206 expression
Low 2 19 <0.001*
High 19 2
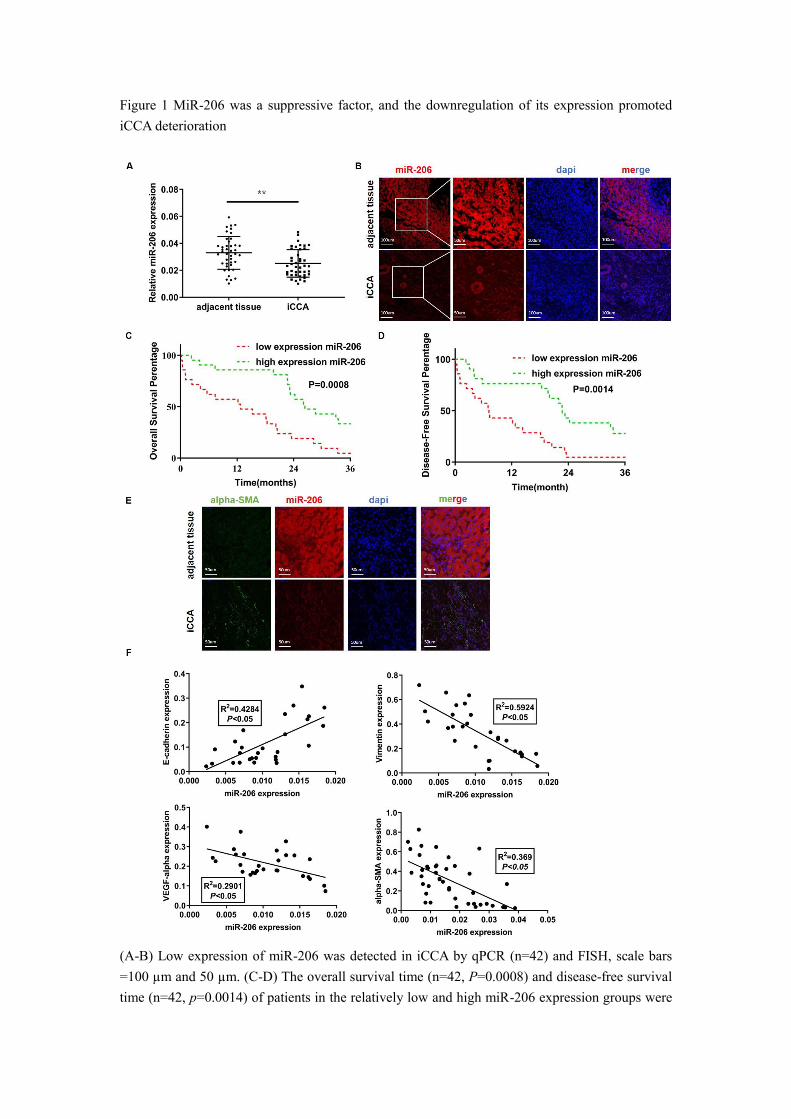
Figure 1 MiR-206 was a suppressive factor, and the downregulation of its expression promoted
iCCA deterioration
(A-B) Low expression of miR-206 was detected in iCCA by qPCR (n=42) and FISH, scale bars
=100 µm and 50 µm. (C-D) The overall survival time (n=42, P=0.0008) and disease-free survival
time (n=42, p=0.0014) of patients in the relatively low and high miR-206 expression groups were

analyzed and compared. (E) Alpha-SMA and miR-206 staining results in iCCA tissues. scale bar=
50 µm. (F) Relationships between miR-206 expression and E-cadherin, Vimentin, VEGF-alpha and
alpha-SMA expression in iCCA tissues were analyzed (n=28). The data were shown as the mean ±
SD, ** P <0.01, *** P <0.001
Figure 2 Interaction between CCA cells and CAFs resulted in a further reduction in miR-206
expression

(A) Alpha-SMA staining in normal liver, hepatocellular carcinoma and intrahepatic
cholangiocarcinoma tissues. The positive staining area was analyzed and is presented in the right
panel. scale bar= 20 µm. (B) Alpha-SMA and miR-206 expression in paired NFs and CAFs was
detected by FISH. Scale bar=50 µm. (C) Expression of miR-206 in 3 pairs of NFs and CAFs was
detected by qPCR. (D) Relative expression of miR-206 in NFs was analyzed when the NFs were
cocultured with HiBEC, HUCCT1 or RBE cells for 48 hours or cultured alone as a control. (E) The
fold change in the miR-206 levels in NFs treated with or without TGF-beta1 (20 ng/mL for 24 hours)
was analyzed. (F) Changes in relative miR-206 expression in HUCCT1 and RBE cells cocultured
NFs or CAFs were analyzed. (G) After treatment with IL-1beta, IL-6, IL-8, VEGF-alpha, and
CXCL12 (20 ng/mL for 2 hours), the change in miR-206 expression in the HUCCT1 and RBE cell
lines was analyzed, and PBS treatment was used as a control. The data are shown as the mean ± SD,
* P <0.05, ** P <0.01, *** P <0.001.
Figure 3 MiR-206 suppressed CCA cell proliferation, migration, and invasion and facilitated
sensitivity to chemotherapy.
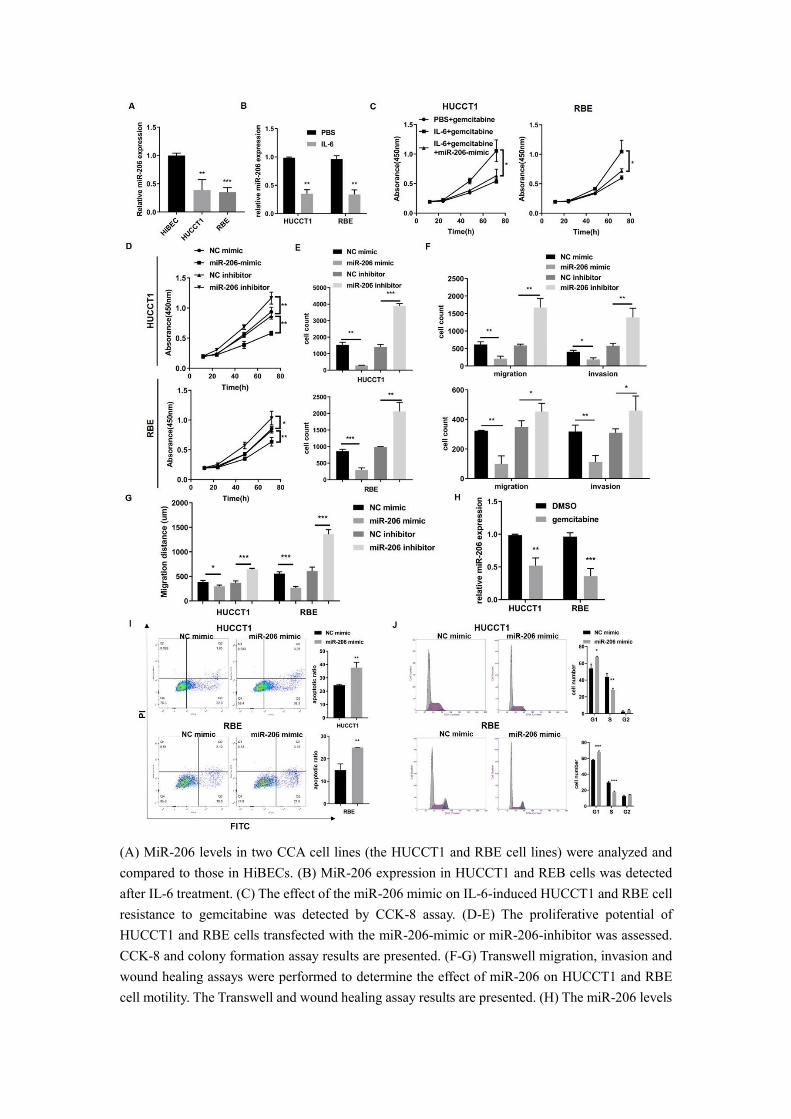
(A) MiR-206 levels in two CCA cell lines (the HUCCT1 and RBE cell lines) were analyzed and
compared to those in HiBECs. (B) MiR-206 expression in HUCCT1 and REB cells was detected
after IL-6 treatment. (C) The effect of the miR-206 mimic on IL-6-induced HUCCT1 and RBE cell
resistance to gemcitabine was detected by CCK-8 assay. (D-E) The proliferative potential of
HUCCT1 and RBE cells transfected with the miR-206-mimic or miR-206-inhibitor was assessed.
CCK-8 and colony formation assay results are presented. (F-G) Transwell migration, invasion and
wound healing assays were performed to determine the effect of miR-206 on HUCCT1 and RBE
cell motility. The Transwell and wound healing assay results are presented. (H) The miR-206 levels

in HUCCT1 and RBE cells were detected after gemcitabine treatment. (I) After treatment with
gemcitabine, the apoptosis of HUCCT1 and RBE cells transfected with the miR-206-mimic was
detected by FCM. The proportion of apoptotic cells was analyzed and is presented in the right panel.
(J) Cell cycle distribution of HUCCT1 and RBE cells transfected with the miR-206-mimic was
detected. The data are shown as the mean ± SD, * P <0.05, ** P <0.01, *** P <0.001.
Figure 4 MiR-206 suppressed CCA cell stem-like characteristics and TGF-beta1 secretion via
LASP1/STAT3 signalling.
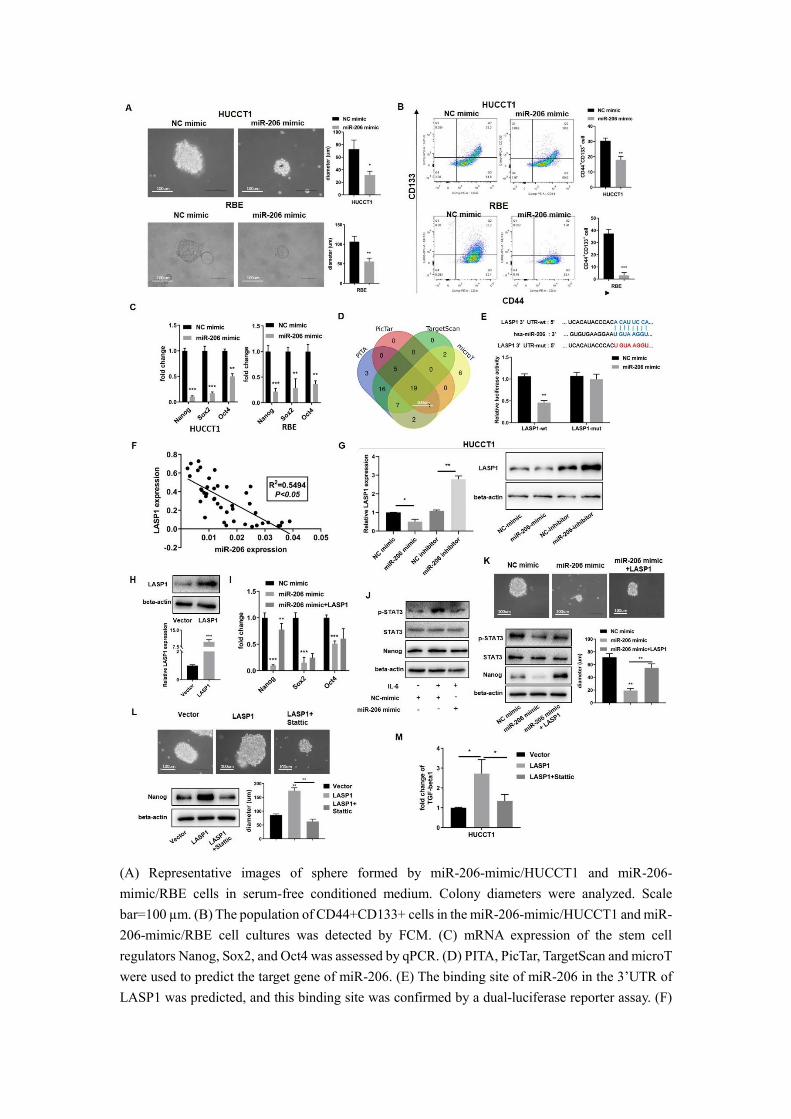
(A) Representative images of sphere formed by miR-206-mimic/HUCCT1 and miR-206-
mimic/RBE cells in serum-free conditioned medium. Colony diameters were analyzed. Scale
bar=100 µm. (B) The population of CD44+CD133+ cells in the miR-206-mimic/HUCCT1 and miR-
206-mimic/RBE cell cultures was detected by FCM. (C) mRNA expression of the stem cell
regulators Nanog, Sox2, and Oct4 was assessed by qPCR. (D) PITA, PicTar, TargetScan and microT
were used to predict the target gene of miR-206. (E) The binding site of miR-206 in the 3’UTR of
LASP1 was predicted, and this binding site was confirmed by a dual-luciferase reporter assay. (F)

The correlation between miR-206 expression and LASP1 expression in tissues was analyzed
(P<0.05, R2=0.5495). (G) Expression of LASP1 in miR-206 overexpression or knockdown
HUCCT1 cell line was evaluated by qPCR and WB. (H) The overexpression of LASP1 was
confirmed by qPCR and WB assays. (I) The Nanog, Sox2 and Oct4 mRNA levels in miR-206-
mimic/HUCCT1 cells overexpressing LASP1 were analyzed. (J) Expression of p-STAT3, STAT3,
and Nanog in miR-206-overexpressing HUCCT1 cells after IL-6 treatment. (K) Representative
images of spheres and expression of p-STAT3, STAT3, and Nanog in the HUCCT1 cell line
overexpressing the miR-206 and LASP1. Diameter of sphere was analyzed. Scale bar=100um. (L)
Representative images of spheres and protein expression of Nanog in LASP1-overexpressing
HUCCT1 cells treated with Stattic (20 μM for 24 hours). Diameter of sphere was analyzed. Scale
bar=100um. (M) Secretion of TGF-beta1 by LASP1-overexpressing HUCCT1 cells treated with
Stattic (20 μM for 24 hours). The data are shown as the mean ± SD, * P <0.05, ** P <0.01, *** P
<0.001.
Figure 5 Decreased miR-206 expression promoted NF reprogramming into the CAF phenotype and
enhanced IL-6 secretion by targeting Anxa2.

(A) Expression of alpha-SMA and miR-206 in NFs was evaluated by FISH assay to observe the
response of miR-206 expression to TGF-beta1 treatment (20 ng/mL for 12 hours). Scale bar=50 µm
(B) Relative changes in the alpha-SMA and miR-206 mRNA levels in response to TGF-beta1
treatment were detected by qPCR. (C) The protein expression of CAF markers, alpha-SMA and FAP
in miR-206-mimic/CAFs and miR-206-inhibitor/NFs was detected by WB assay. (D) The binding
site of miR-206 in the Anxa2 3’ UTR was predicted, and the binding site was confirmed by dual-
luciferase reporter assay. (E) Relative expression of Anxa2 in 3 pairs of NFs and CAFs was detected
by qPCR. (F) Regulation of alpha-SMA and Anxa2 expression by miR-206 was analyzed by WB
assay. (G) The correlation between miR-206 expression and Anxa2 expression in tissues was
analyzed (P<0.05, R2=0.3726). (H) Anxa2 overexpression was confirmed by WB assay. (I) Alpha-
SMA protein levels were evaluated after Anxa2 expression was upregulated in miR-206-
mimic/CAFs. (J-M) The effects of Anxa2 in miR-206-mimic/CAFs on CAF proliferation, motility,
collagen contraction and vascular formation were studied. (N) Fold changes in the IL-1beta, IL-6,
IL-8, VEGF-alpha and CXCL12 levels in conditioned medium from miR-206-mimic/CAFs with

Anxa2 upregulated expression. The data are shown as the mean ± SD, * P <0.05, ** P <0.01, ***
P <0.001.
Figure 6 Overexpression of miR-206 suppressed the mutual promotion of malignant behaviors and
gemcitabine resistance in the CCA-CAF environment.

(A-B) The proliferation and migration abilities of HUCCT1 cells cocultured with miR-206-
mimic/CAFs were explored by colony formation and Transwell assays. (C) The effects of miR-206-
mimic/CAFs on HUCCT1 cell resistance to gemcitabine were evaluated by CCK-8 and colony
formation assays. (D) The cycle distribution of HUCCT1 cells cocultured with miR-206-
mimic/CAFs was analyzed by FCM. (E) Sphere formation by HUCCT1 cells cocultured with miR-
206-mimic/CAFs were detected and assessed. Scale bar=100 µm. (F) Expression of Nang, Sox2 and
Oct4 in HUCCT1 cells was detected by qPCR. (G) MiR-206-mimic/CAFs combined with HUCCT1
cells were subcutaneously coinjected into mice. After gemcitabine treatment for 3-4 weeks, the mice
were sacrificed, subcutaneous tumors were imaged, and tumor volume was calculated. (H) The
mRNA level of TGF-beta1 in HUCCT1 cells cocultured with miR-206-mimic/CAFs was detected
by qPCR. (I) Alpha-SMA and FAP expression in NFs cocultured with miR-206-mimic/HUCCT1
cells was evaluated by IF assay. NFs culture alone as negative control. Scale bar=100 µm. (J) The
mRNA levels of IL-1beta, IL-6, IL-8, VEGF-alpha and CXCL12 in NFs cocultured with miR-206-
mimic/HUCCT1 cells were detected by qPCR. NFs culture alone as negative control. The data are
shown as the mean ± SD, * P <0.05, ** P <0.01, *** P <0.001.
Figure 7 Exosomes acted as carriers of miR-206 in the CCA-CAF environment

(A) MiR-206-mimic or NC mimic was labelled with Cy3 and transfected into CAFs. After
coculturing these cells with HUCCT1 cells for 48 hours, the labelled NC mimic and miR-206 were
observed in the HUCCT1 cells, and representative images were captured. Scale bar=50 µm. (B) The
level of miR-206 in the cocultured HUCCT1 cells was analyzed by qPCR. (C) TEM images of
exosomes from NC-mimic/CAFs and miR-206-mimic/CAFs, indicated by red arrows. Scale
bar=100 nm. The distribution and size of NC-mimic/CAF- and miR-206-mimic/CAF-derived
exosomes were evaluated by NTA. (D) WB assay was performed to confirm the protein expression
of CD9, CD63, Tsg101. (E) Fold changes in miR-206 expression in miR-206-mimic/CAFs and
secreted exosomes compared to that in NC-mimic/CAFs and secreted exosomes were analyzed by
qPCR. (F) NC-mimic/CAF- and miR-206-mimic/CAF-derived exosomes were labelled with CM-
Dil (red spot) and cocultured with HUCCT1 cells for 12 hours. The uptake of exosomes by
HUCCT1 cells was confirmed by fluorescence microscopy. Scale bar=100 µm. (G) The mRNA

levels of miR-206 in HUCCT1 cells treated with NC-mimic/CAF-derived exosomes and miR-206-
mimic/CAF-derived exosomes relative to those in HUCCT1 cells treated with CAF-derived
exosomes were detected by qPCR. The data are shown as the mean ± SD, *P <0.05, ** P <0.01,
*** P <0.001.
Figure 8 Exosome-delivered miR-206 eliminated the CCA-CAF mutually promoting environment
and suppressed malignancy

(A) The expression level of miR-206 in -derived exosomes transfected with the miR-206-mimic
was detected by qPCR. (B-E) Effects of miR-206-mimic/exo (50 μg/105 cells) on HUCCT1 cell
proliferation and migration were detected. The CCK-8, colony formation, cell cycle progression and
Transwell migration (scale bar=20 μm) assay results are presented. (F) Levels of LASP1, Nanog,
and p-STAT3 in HUCCT1 cells after miR-206-mimic/exo treatment were assessed. (G-H) The
expression of CAF markers (alpha-SMA and FAP) and Anxa2 in CAFs was evaluated. (I) HUCCT1

cells and CAFs were cocultured in 6-well plates, and both cell types were treated with gemcitabine
or miR-206-mimic/exo. The cells were analyzed compared to those cultured alone. Cell colony
number and fold change in the gemcitabine and miR-206-mimic/exo treatment groups were
compared and are presented in the right panel. (J) The Bcl-2/Bax ratio and fold change in the Bcl-
2/Bax ratio in the gemcitabine and miR-206-mimic/exo groups were also evaluated and analyzed.
*P <0.05, ** P <0.01, *** P <0.001
Figure 9 MiR-206-mimic/exo inhibited xenograft malignancy, and when combined with
gemcitabine, prolonged the survival time in a mouse model.

An orthotopic mouse model was established to compare the effects of miR-206 and gemcitabine in
vivo. Mice were administered miR-206-mimic/exo, gemcitabine or combined treatment. (A) After
4 weeks of treatment, the xenograft tumors were photographed (left panel), and the analysis results
are shown in the right panel. (B) The survival of the mice was monitored, and the survival times of
the mice treated with miR-206-mimic/exo, gemcitabine or a combination were analyzed (n=10 in
each group). (C) After sacrifice, xenograft tumors were harvested and used for IHC staining and
TUNEL assays (Scale bars=20 µm for Ki-67 staining, 100 µm for alpha-SMA staining, 100 µm for
TUNEL assay). The analysis results were presented in the right panel. (D) Schematic representation
showing the mechanism by which miR-206 is involved in the CCA-CAF interaction. In CCA cells,

miR-206 inactivates the STAT3 pathway and suppresses the expression of Nanog and TGF-beta1.
Secreted TGF-beta1 induced the reprogramming of NFs into CAFs via the miR-206/Anxa2 axis and
promoted cytokine secretion. Secretion of IL-6 by CAFs further decreased miR-206 expression in
CCA cells. miR-206 was involved in the mutual promoting effect that led to iCCA malignancy and
resistance to gemcitabine. The administration of exosomes carrying miR-206 can disrupt this mutual
promoting effect, and sensitivity to gemcitabine can be increased. *P <0.05, ** P <0.01, *** P
<0.001


