
Copyright © 2010 Pearson Education, Inc. publishing as Prentice Hall 5-1
Research Design
• Research design is a set of advanced decisions that make up the master plan specifying the methods and procedures for collecting and analyzing the needed information.
Copyright © 2010 Pearson Education, Inc. publishing as Prentice Hall 5-2

The Significance of Research Design
• There are basic marketing research designs that can be successfully matched to given problems and research objectives, and they serve the researcher much like the blueprint serves the builder.
Copyright © 2010 Pearson Education, Inc. publishing as Prentice Hall 5-3
Types of Research Design
• Three traditional categories:–Exploratory–Descriptive–Causal
Copyright © 2010 Pearson Education, Inc. publishing as Prentice Hall 5-4

Exploratory Research
• It is usually conducted when the researcher does not know much about the problems.
• Exploratory research is usually conducted at the outset of research projects.
Copyright © 2010 Pearson Education, Inc. publishing as Prentice Hall 5-5
Exploratory Research
• A variety of methods are available to conduct exploratory research.– Secondary Data Analysis: What has been written?
– Experience Surveys: Talk to those who have experience…those who adopted Vista early; those who make biodiesel; those who have taken an online course, etc.
– Case Analysis: Similar situation in past? Windows XP?
– Focus Groups: Talk to a few persons in the population
– Projective Techniques: For topics that are sensitive or difficult to articulate (personal hygiene; status-seeking!)
Copyright © 2010 Pearson Education, Inc. publishing as Prentice Hall 5-6

Focus Groups
• Very useful for generating information about how consumers think, their attitudes, terminology they use, liking/disliking of proposed new product
• Not useful for predicting a sales number!
• Is BIG business!
Copyright © 2010 Pearson Education, Inc. publishing as Prentice Hall 5-7
Descriptive Research
• Descriptive research is undertaken to describe answers to questions of who, what, where, when, and how.
• Descriptive research is desirable when we wish to project a study’s findings to a larger population, if the study’s sample is representative.
Copyright © 2010 Pearson Education, Inc. publishing as Prentice Hall 5-8
Research Design:Descriptive Research
• Two basic classifications:–Cross-sectional studies–Longitudinal studies
Copyright © 2010 Pearson Education, Inc. publishing as Prentice Hall 5-9

Classification of Descriptive Research Studies
• Cross-sectional studies measure units from a sample of the population at only one point in time.– Sample surveys are cross-sectional
studies whose samples are drawn in such a way as to be representative of a specific population.• These studies are usually presented with a margin of error.
Copyright © 2010 Pearson Education, Inc. publishing as Prentice Hall 5-10
Classification of Descriptive Research Studies
• Cross-sectional studies take “snapshots” of the population at a point in time.
Copyright © 2010 Pearson Education, Inc. publishing as Prentice Hall 5-11
Classification of Descriptive Research Studies
• Longitudinal studies repeatedly measure the same sample units of a population over time.
• Longitudinal studies often make use of a panel which represents sample units who have agreed to answer questions at periodic intervals.
• Many large research firms maintain panels of consumers.
Copyright © 2010 Pearson Education, Inc. publishing as Prentice Hall 5-12
Marketing Research Panels
• Continuous panels ask panel members the same questions on each panel measurement.
• Discontinuous panels vary questions from one panel measurement to the next.– They are sometimes referred to as
omnibus (“including or covering many things or classes”).
Copyright © 2010 Pearson Education, Inc. publishing as Prentice Hall 5-13

Marketing Research Panels – Discontinuous Panels
• Discontinuous panels have the advantage of being able to access large groups of people who have made themselves available for research.
• Discontinuous panels represent sources of information that may be quickly accessed for a wide variety of purposes.
Copyright © 2010 Pearson Education, Inc. publishing as Prentice Hall 5-14
Marketing Research Panels – Continuous Panels
• Continuous panels are used quite differently from discontinuous panels in that one may use data from continuous panels to gain insights into changes in consumers’ purchases, attitudes, etc.
Copyright © 2010 Pearson Education, Inc. publishing as Prentice Hall 5-15
Causal Research
• Causality may be thought of as understanding a phenomenon in terms of conditional statements of the form “If x, then y.”
• Causal studies are conducted through the use of experiments.
Copyright © 2010 Pearson Education, Inc. publishing as Prentice Hall 5-16
Experiments
• An experiment is defined as manipulating an independent variable to see how it affects a dependent variable, while also controlling the effects of additional extraneous variables.
Copyright © 2010 Pearson Education, Inc. publishing as Prentice Hall 5-17

Independent Variable
• Independent variables are those variables which the researcher has control over and wishes to manipulate… the 4 P’s–For example: level of ad
expenditure; type of ad appeal; price; product features, etc.
Copyright © 2010 Pearson Education, Inc. publishing as Prentice Hall 5-18

Dependent Variables
• Dependent variables are those variables that we have little or no direct control over, yet we have a strong interest.–Examples would be return on
investment, net profits, market share, customer satisfaction.
Copyright © 2010 Pearson Education, Inc. publishing as Prentice Hall 5-19

Extraneous Variables
• Extraneous variables are those variables that may have some effect on a dependent variable yet are not independent variables.
• Extraneous variables must be controlled through proper experimental design.
Copyright © 2010 Pearson Education, Inc. publishing as Prentice Hall 5-20
Experimental Design
• Experimental design is a procedure for devising an experimental setting such that a change in a dependent variable may be attributed solely to the change in an independent variable.
Copyright © 2010 Pearson Education, Inc. publishing as Prentice Hall 5-21
Symbols of Experimental Design
• O = measurement of a dependent variable
• X = manipulation, or change, of an independent variable
• R = random assignment of subjects to experimental and control groups
• E = experimental effect• Time is on the horizontal axis
Copyright © 2010 Pearson Education, Inc. publishing as Prentice Hall 5-22
Pretest and Posttest
• Pretest refers to the measurement of the dependent variable taken prior to changing the independent variable.
• Posttest refers to measuring the dependent variable after changing the independent variable.
Copyright © 2010 Pearson Education, Inc. publishing as Prentice Hall 5-23
A “True” Experimental Design
• A “true” experimental design is one that truly isolates the effects of the independent variable on the dependent variable while controlling for the effects of any extraneous variables.
Copyright © 2010 Pearson Education, Inc. publishing as Prentice Hall 5-24

Not “True” Experimental DesignExample: An Experiment to Assess the Effects of Display Position on Sales of
Apples
• After-Only Design: X O1Did apple sales increase or decrease? We don’t know the “effect” the change in the independent variable (display position) has on the dependent variable (apple$).
• One-Group, Before-After Design: O1 X O2We know how much apple$ changed but was the change due SOLELY to the change in display position? Could other (extraneous) variables have accounted for the change?
Copyright © 2010 Pearson Education, Inc. publishing as Prentice Hall 5-25

Remember What a “True” Experiment is…
• Experimental design is a procedure for devising an experimental setting such that a change in a dependent variable may be attributed solely to the change in an independent variable.
Copyright © 2010 Pearson Education, Inc. publishing as Prentice Hall 5-26
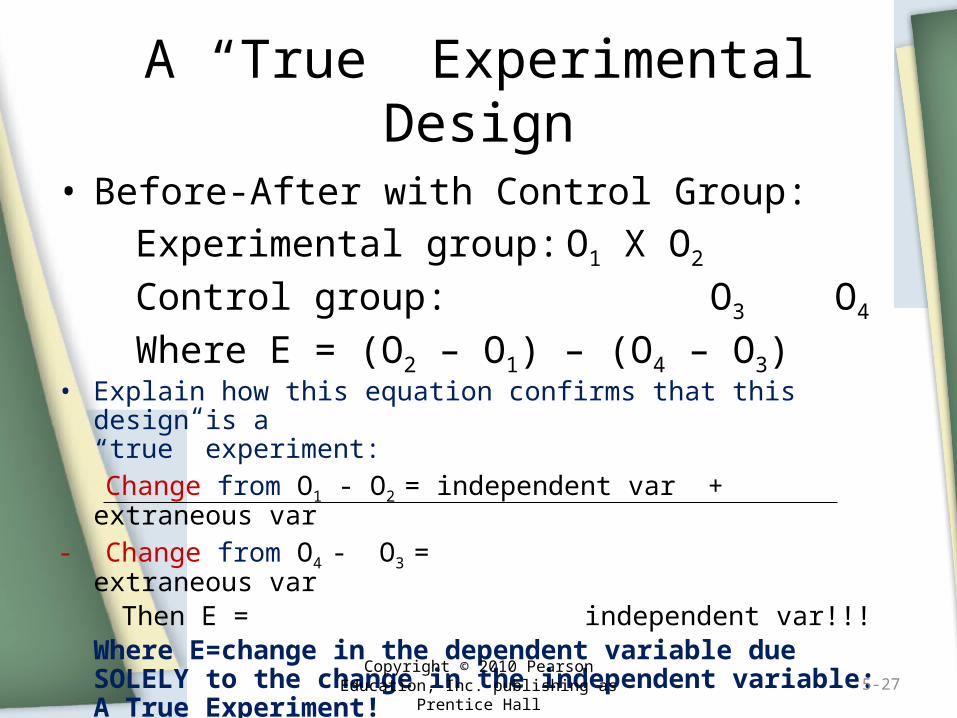
A “True” Experimental Design
• Before-After with Control Group:Experimental group: O1 X O2
Control group: O3 O4
Where E = (O2 – O1) – (O4 – O3)• Explain how this equation confirms that this design is a
“true” experiment: Change from O1 - O2 = independent var + extraneous var- Change from O4 - O3 = extraneous var Then E = independent var!!!
Where E=change in the dependent variable due SOLELY to the change in the independent variable: A True Experiment!
Copyright © 2010 Pearson Education, Inc. publishing as Prentice Hall 5-27
How valid are experiments?
• An experiment is valid if it has:– Internal validity: measures the
extent to which the change in the dependent variable is actually due to the change in the independent variable.
Copyright © 2010 Pearson Education, Inc. publishing as Prentice Hall 5-28
How valid are experiments?
• An experiment is valid if it has:–External validity: refers to the
extent that the relationship observed between the independent and dependent variables during the experiment is generalizable to the “real world.”
Copyright © 2010 Pearson Education, Inc. publishing as Prentice Hall 5-29

Types of Experiments
• Laboratory experiments are those in which the independent variable is manipulated and measures of the dependent variable are taken in a contrived, artificial setting for the purpose of controlling the many possible extraneous variables that may affect the dependent variable.
• Good at establishing internal validity Copyright © 2010 Pearson Education, Inc.
publishing as Prentice Hall 5-30

Types of Experiments
• Field experiments are those in which the independent variables are manipulated and the measurements of the dependent variable are made on test units in their natural setting.
• Good at establishing external validity
Copyright © 2010 Pearson Education, Inc. publishing as Prentice Hall 5-31
Copyright © 2010 Pearson Education, Inc. publishing as Prentice Hall 6-32

Primary Versus Secondary Data
• Primary data: information that is developed or gathered by the researcher specifically for the research project at hand.
• Secondary data: information that has previously been gathered by someone other than the researcher and/or for some other purpose than the research project at hand.
Copyright © 2010 Pearson Education, Inc. publishing as Prentice Hall 6-33
Uses of Secondary Data
• Secondary data has many uses in marketing research and sometimes the entire research project may depend on the use of secondary data.
• Applications include economic-trend forecasting, corporate intelligence, international data, public opinion, and historical data.
• See www.secondarydata.com.Copyright © 2010 Pearson Education, Inc.
publishing as Prentice Hall 6-34

35
Figure 2.1 Sources of secondary dataSource: Adapted from Aaker, Kumar and Day (1998)
Internet (electronic)
Printed
- Private market research firms (e.g. Euromonitor, Frost & Sullivan)- Governments- Industry associations- Trade magazines / journals- Article databases (e.g. Proquest)- Websites of competitors - Firms’ annual reports- Newspaper- Books
Standardizedsources of marketing
data
- Consumer purchase panels (GFK)- Store audits (Store checks)- Nielsen’s Television Index- Multimedia services- Web-traffic (monitoring traffic on Web-sites)
Primarydata sources
Data sources
Secondary data sources
Externaldata sources
Published data
Data collection with a specific purpose in mind -
typical personal interviews
Internaldata sources
- Sales reports- Market share reports- Marketing activities- Cost information- Sales force feedback- Sales reps’ reports- Customer - End-user feedback- Etc.
External Secondary Data
• Published: sources of information prepared for public distribution and normally found in libraries or a variety of other entities, such as trade organizations.
Copyright © 2010 Pearson Education, Inc. publishing as Prentice Hall 6-36
External Secondary Data
• Syndicated Services Data: provided by firms that collect data in a standard format and make them available to subscribing firms – highly specialized and not available in libraries. An example: Arbitron Radio Listenership Studies
Copyright © 2010 Pearson Education, Inc. publishing as Prentice Hall 6-37
External Secondary Data
• External databases: databases supplied by organizations outside the firm such as online information databases (e.g., FACTIVA and Lexis Nexis.
Copyright © 2010 Pearson Education, Inc. publishing as Prentice Hall 6-38
Advantages of Secondary Data
• Are obtained quickly• Are inexpensive• Are usually available• Enhance existing primary data• May achieve research objective
Copyright © 2010 Pearson Education, Inc. publishing as Prentice Hall 6-39
Disadvantages of Secondary Data
• Reporting units are incompatible…need zip code data and only have county data.
• Measurement units do not match…need per capita income and only have household income.
Copyright © 2010 Pearson Education, Inc. publishing as Prentice Hall 6-40
Disadvantages of Secondary Data
• Class definitions are not usable…need to know percent of population with income above $100k and only have $50k and over.
• Data are outdated.
Copyright © 2010 Pearson Education, Inc. publishing as Prentice Hall 6-41

Evaluating Secondary Data
• What was the purpose of the study?
• Who collected the information?• What information was collected?• How was the information attained?• How consistent is the information
with other information?
Copyright © 2010 Pearson Education, Inc. publishing as Prentice Hall 6-42
Locating Secondary Data Sources
• Step 1: Identify what you wish to know and what you already know about your topic.
• Step 2: Develop a list of key words and
names.• Step 3: Begin your search
using several library sources.
Copyright © 2010 Pearson Education, Inc. publishing as Prentice Hall 6-43
Locating Secondary Data Sources
• Step 4: Compile the literature you have found and evaluate your findings.
• Step 5: If you are unhappy with what you have found or are otherwise having trouble and the reference librarian has not been able to identify sources, use an authority.
• Step 6: Report results.Copyright © 2010 Pearson Education, Inc.
publishing as Prentice Hall 6-44
Copyright © 2010 Pearson Education, Inc. publishing as Prentice Hall 7-45

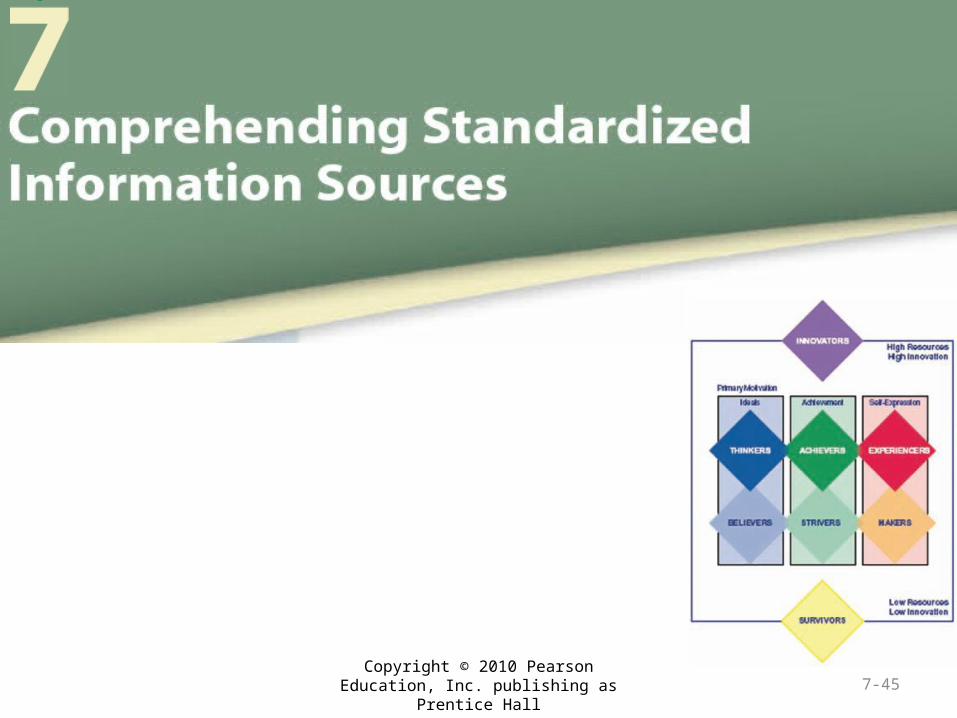
What is Standardized Information?
• Standardized information is a type of secondary data in which the data collected and/or the process of collecting the data are standardized for all users.
• Two broad classes: –Syndicated data–Standardized services
Copyright © 2010 Pearson Education, Inc. publishing as Prentice Hall 7-46

Advantages of Syndicated Data
• Advantages:– Shared costs– High quality of the data collected– Quick data dissemination
Copyright © 2010 Pearson Education, Inc. publishing as Prentice Hall 7-47
Disadvantages of Syndicated Data
• Disadvantages:–Buyers have little control over
what information is collected–Firms often must commit to long-
term contracts–No strategic information
advantage in purchasing syndicated data
Copyright © 2010 Pearson Education, Inc. publishing as Prentice Hall 7-48

Advantages of Standardized Services
• Advantages: –Taking advantage of the
experience of the research firm offering the service
–Reduced cost–Speed of the research service
Copyright © 2010 Pearson Education, Inc. publishing as Prentice Hall 7-49
Disadvantages of Standardized Services
• Disadvantages: –The ability to customize some
projects is lost.–The company providing the
standardized service may not know a particular industry well.
Copyright © 2010 Pearson Education, Inc. publishing as Prentice Hall 7-50
Single Source Data
• Single-source data: data that contain information on several variables such as promotional message exposure, demographics, and buyer behavior.– Recorded continuously from a panel of
respondents to measure their exposure to promotional materials (usually TV as well as in-store promotions) and subsequent buying behavior
Copyright © 2010 Pearson Education, Inc. publishing as Prentice Hall 7-51

Single Source Data
• Single-source data: data that contain information on several variables, such as promotional message exposure, demographics, and buyer behavior.– Can help managers determine causal
relationships between types of promotions and sales.• Example: BehaviorScan
Age Income TV ad? Purchase?
Old Low No No
Young High Yes Yes
Young Moderate
Yes Yes
Copyright © 2010 Pearson Education, Inc. publishing as Prentice Hall 7-52

Danske kilder til markedsinformation

Typer
• Virksomhedsdata• Markedsdata• Brancheanalyser/Markedsanalyser
Virksomhedsdata
• CVR.dk: www.eogs.dk• Navne og Numre: www.nnerhverv.dk• Greens: www.greens.dk• Kompass:• http://www.kompass.com/kinl/index.php• Andre (Dunn & Bradsheet): www.dialogweb.com
Statistiske data
• Officielle data. Statistiske kontorer– Fx Statistikbanken www.statistikbanken.dk– Andre:
http://www.dst.dk/OmDS/Bib/links/danmark.aspx

Danmarks Statistikbank www.statistikbanken.dk
• Opbygning: 17 emneområder• Hvordan finder man de ønskede tal?
1.Via Emneområderne 2. Via Søgefunktionen
• Præsentationsmuligheder– Tabel– Kurvediagram– Søjlediagram

Eurostat
• http://epp.eurostat.cec.eu.int
Siden oktober 2004 gratis adgang

OECD
• To adgange:• www.oecd.org
En offentlige site, hvor der er en del statistiske informationer
• www.sourceoecd.orgEn betalingssite med ALT hvad OECD producerer (Rapporter, statistik etc.)

Marketingdatabaser
• Consumers Europe• European Marketing Data Statistics• International Marketing Data Statistics
www.euromonitor.comNet eller papir?

Branche/markedsanalyser
Udenrigsministeriethttp://www.um.dk/
Euromonitor www.euromonitor.comReuters Business Insight
http://www.reutersbusinessinsight.com/autologin.asp
Dialog (Thomson Business Intelligence)www.dialogweb.com

Portaler
• AUB www.aub.aau.dk• Bizigate www.bizigate.dk

Standardmarkedsanalyser
• Data fra ACNielsen AIM omkring livsstil og forbrugsmønstre
• Gallup mediedata (pris og dækning)
• MOSAIC: geografisk segmentering

ACNielsen AIM
• Market*Monitor giver indblik i livsstil og forbrugsmønstre
• Indsamling via postale spørgeskemaer• Omkring 20.000 svar pr. år• For nærmere præsentation se
http://dk.acnielsen.com/products/index.shtml

Access database• Via databasen kan man lave
et udtræk til efterfølgende behandling i SPSS
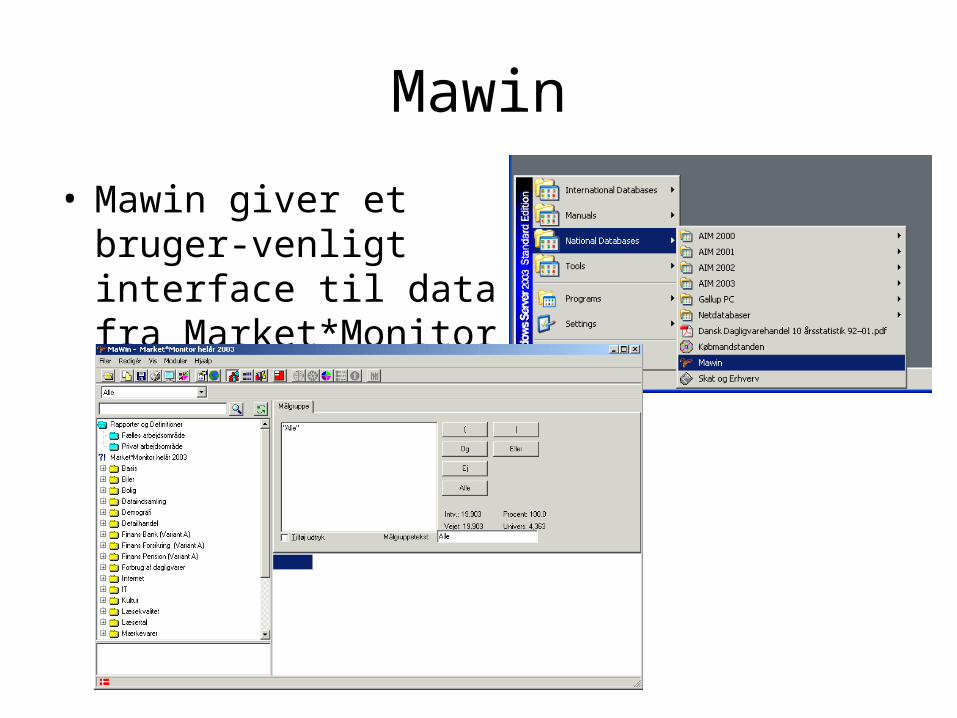
Mawin
• Mawin giver et bruger-venligt interface til data fra Market*Monitor
Gallup
• Gallup måler via Index Danmark/Gallup danskernes mærkevare og medieforbrug– trykte, outdoor og bio/tv/radiomedier
• Kombineres ovenstående med priser er det muligt at lave en medieanalyse
• For nærmere præsentation se http://www.gallup.dk/page.aspx?pageid=17

GallupPC
• Gallup PC benytter en undersøgelse kombineret med en prisdatabase
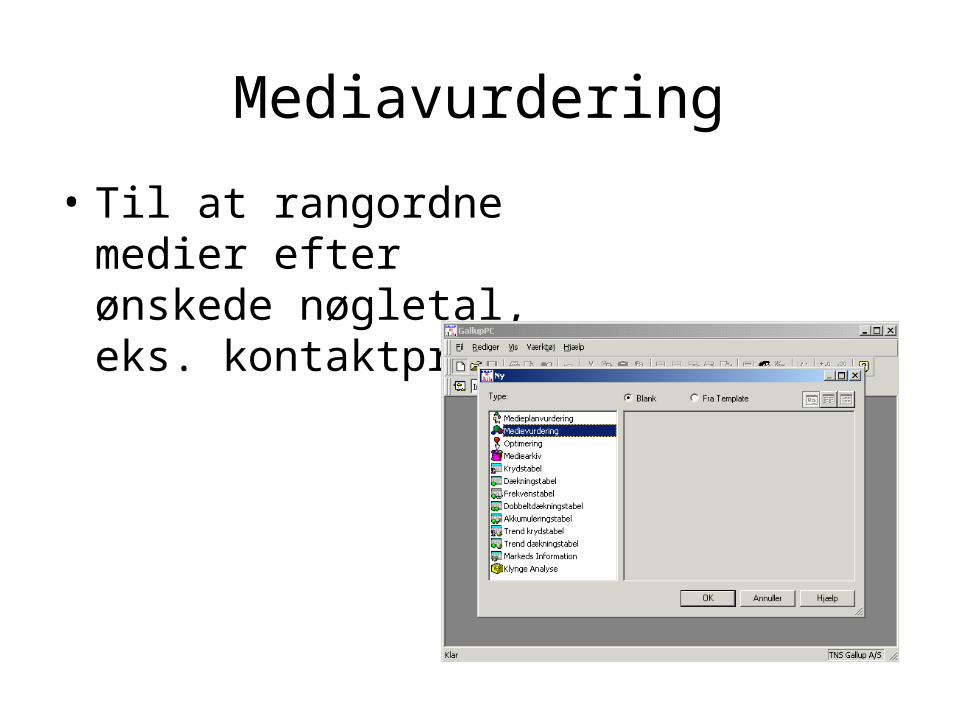
Mediavurdering
• Til at rangordne medier efter ønskede nøgletal, eks. kontaktpris

Dækningstabel
• Til at vise medievaner i forskellige målgrupper

MOSAIC• http://www.postdanmark.dk/contentfull.dk?content=/cms/da-dk/erhverv/dm-breve/mosaic.
htm&menufile=/cms/da-dk/menufiles/erhverv.xml&lang=dk

Øvelse i On-line søgning
• Instituttet har fået en forespørgsel fra World Economic Forum, om vi vil indgå som partner og i den forbindelse stå for den danske del af deres survey, der er grundlaget for publikationen World Competitiveness Report (WCR).
• Giv en beskrivelse af indholdet af WCR og en vurdering af den anvendte metode med med henblik på reliabilitet og validitet i form af en PP-præsentation, som mailes til [email protected] senest mandag d.15.2.2010 kl. 12.


