
Coordinated weighted sampling for estimating
aggregates over multiple weight assignments
Edith Cohen, AT&T ResearchHaim Kaplan, Tel Aviv UniversityShubho Sen, AT&T Research

Data model
• Universe U of items:
i1 i2 i3 i4 …………
w1(i1) w1(i2) w1(i3) w1(i4)w2(i1) w2(i2) w2(i3) w2(i4)
w3(i1) w3(i2) w3(i3) w3(i4)
Multiple weight assignments defined over the items
IP addressestraffic day 1
traffic day 2
traffic day 3

Data model (example)
• Universe U of items:
i1 i2 i3 i4
w1(i1) w1(i2) w1(i3) w1(i4)w2(i1) w2(i2) w2(i3) w2(i4)
w3(i1) w3(i2) w3(i3) w3(i4)
facebook usersmale friends
female friends
online per day
…………

Data model (example)
• Universe U of items:
i1 i2 i3 i4 …………
w1(i1) w1(i2) w1(i3) w1(i4)w2(i1) w2(i2) w2(i3) w2(i4)
w3(i1) w3(i2) w3(i3) w3(i4)
customers
wait time item 1wait time item 2wait time item 3

Data model (example)
• Universe U of items:
i1 i2 i3 i4 …………
w1(i1) w1(i2) w1(i3) w1(i4)w2(i1) w2(i2) w2(i3) w2(i4)
w3(i1) w3(i2) w3(i3) w3(i4)
license plates
GW bridge day 1GW bridge day 2GW bridge day 3

Data model (example)
• Universe U of items:
i1 i2 i3 i4 …………
w1(i1) w1(i2) w1(i3) w1(i4)w2(i1) w2(i2) w2(i3) w2(i4)
w3(i1) w3(i2) w3(i3) w3(i4)
web pages
bytes
out links
in links

Aggregation queries
• Selection predicate d(i) over items in U
• compute the sum of the weights of all items for which the predicate holds:
| ( )
( )i d i true
w i
Examples:
• Total number of links out of pages of some web site
• Total number of flows into a particular network

This work:Aggregates depending on more than one
weight function• Selection predicate d(i) over items in U
• Want to compute the sum of f(i) for all items for which the predicate holds:
| ( )
( )i d i true
f i
f(i) depends on some subset of the weights given to i
Simple examples: f(i) = maxbwb(i), f(i) = minbwb(i),
f(i)=maxbwb(i)-minbwb(i)

Data model (example)
• Universe U of items:
i1 i2 i3 i4 …………
w1(i1) w1(i2) w1(i3) w1(i4)w2(i1) w2(i2) w2(i3) w2(i4)
w3(i1) w3(i2) w3(i3) w3(i4)
customers
wait time item 1wait time item 2wait time item 3
f(i) = maxbwb(i) aggregated over a subset gives the total waiting time of these customers

Data model
• Universe U of items:
i1 i2 i3 i4 …………
w1(i1) w1(i2) w1(i3) w1(i4)w2(i1) w2(i2) w2(i3) w2(i4)
w3(i1) w3(i2) w3(i3) w3(i4)
IP addressestraffic day 1
traffic day 2
traffic day 3
f(i) = maxbwb(i)-minbwb(i) aggregated over a network gives sum of maximum changes in # of flows

• Massive data volumes, too large to store or to transport elsewhere
• w1 may not be available when we process w2, etc, collected at different place/time
• Many different types of queries (d(i),f(i)), not known in advance
Challenges
Exact aggregation can be very resource consuming or simply impossible
Challenge: which summary to keep and how to estimate the aggregate ??
Desirable Properties of Sampling Scheme:
• Scalability: efficient on data streams and distributed data, decouple the summarization of different sets
• Applicable to a wide range of d(i), f(i)
• Good estimators: unbiased, small variance
Keep a sample
Solution: Use Sampling
•Independent (Bernoulli) with probability kw(i)/W
Poisson, PPS sampling
•k times without replacement
Order (bottom-k) sampling (includes PPSWOR, priority sampling (Rosen 72, Rosen 97, CK07, DLT 07)
• Methods can be implemented efficiently in a stream/reservoir/distributed setting
•Order (bottom-k) sampling dominates other methods (fixed sample size, with unbiased estimators [CK07, DLT07] )
Sampling a single weight function

Rank-based definition of Order/bottom-k sampling
• For each item draw a random rank value from some distribution fw(i)
• Order/bottom-k: Pick the k smallest-ranked items to your sample
• r(i)=u(i)/w(i) : priority order samples
• r(i)=-ln(u(i))/w(i) : PPSWOR order samples
( )u i U[0,1]Rank distributions: (The seed)

Independent sampling: Get a sample from each weight function independently
Coordinated Sampling: If w2(i) ≥ w1(i) then r2(i) ≤ r1(i).
For example by using the same seed u(i) for all wi:
r1(i) = u(i)/w1(i) r2(i) = u(i)/w2(i)
Relations between samples by different weight function
Can be achieved efficiently via hashing

• Coordination is critical for tight estimates
• We develop estimators for coordinated samples and analyze them
Coordination is critical
A lot of previous work on coordination in the context of survey sampling and when weights are uniform..

( ) ( ) ( )i Q i Q S
a Q a i a i
Horvitz Thompson Estimators [HT52]
a(Q) is an unbiased estimator of w(Q)
HT estimator: Give each item i an adjusted weight a(i)
Let p(i) be the prob. that item i is sampled
If i is in sample, a(i)=w(i)/p(i) (otherwise a(i) = 0 )
( )[ ( )] ( ) (1 ( ))0 ( )
( )
w iE a i p i p i w i
p i

Using HT for order samples
• Cannot compute p(i) from an order sample • Therefore cannot compute HT adjusted
weights a(i)=w(i)/p(i) p(i)?
Problem
• For item i, if we can find a partition of the sample space such that we can compute the conditioned p(i) for item i for the cell that the sampled set belongs to
• Then apply HT using that conditioned p(i)
p1(i)
p2(i)p4(i)
p3(i) p5(i)
p6(i)
Obtain unbiased adjusted weights for each item
Solution: Apply HT on partitions

Estimators for aggregates over multiple weights
| ( )
min ( )bb
i d i true
w i
Suppose we want to estimate:
We have a sample for each weight function using independent or coordinated ranks

Estimator for
Identify the items i for which d(i)=true and you know minbwb(i)
(=Items contained in all samples)
Compute p(i), the probability of such item to be sampled for all weight functions (conditioned in a subspace that depends on the other ranks)
| ( )
min ( )bb
i d i true
w i
Set a(i) = minbwb(i)/p(i)
Sum up these adjusted weights

Independent vs Coordinated
Variance is small when p(i) is large
2 1 ( )var[ ( )] min ( )
( )b
b
p ia i w i
p i
Coordinated sketches have larger p(i)

Estimator for
Identify the items i for which d(i)=true and you know maxbwb(i)
If you see all weights then you know maxbwb(i)But you never see them all if minbwb(i) = 0
| ( )
max ( )bb
i d i true
w i

Estimator for | ( )
max ( )bb
i d i true
w i
If the largest weight you see has rank smaller than minb{kth smallest rank of an item I\{i}} then you know it’s the maximum.
Use the consistency of the ranks:

Estimator for | ( )
max ( )bb
i d i true
w i
Compute p(i), the probability of this to happen
Set a(i) = minbwb(i)/p(i)
Sum up these adjusted weights
If the largest weight you see has rank smaller than minb{kth smallest rank of an item I\{i}} then you know it’s the maximum.

More estimators
Now we can get an unbiased estimator for the L1 difference:
(min ( ) min ( ))b bb bw i w i
Can prove that this estimator is nonnegative

Empirical EvaluationData sets:• IP packet traces: Items: (src,dest,src-port,dest-port). wb: total # of bytes in hour b
• Netflix data sets: Items: movies. wb: total # of ratings in month b
• Stock data: Items: ticker symbols
wb: high value on day b
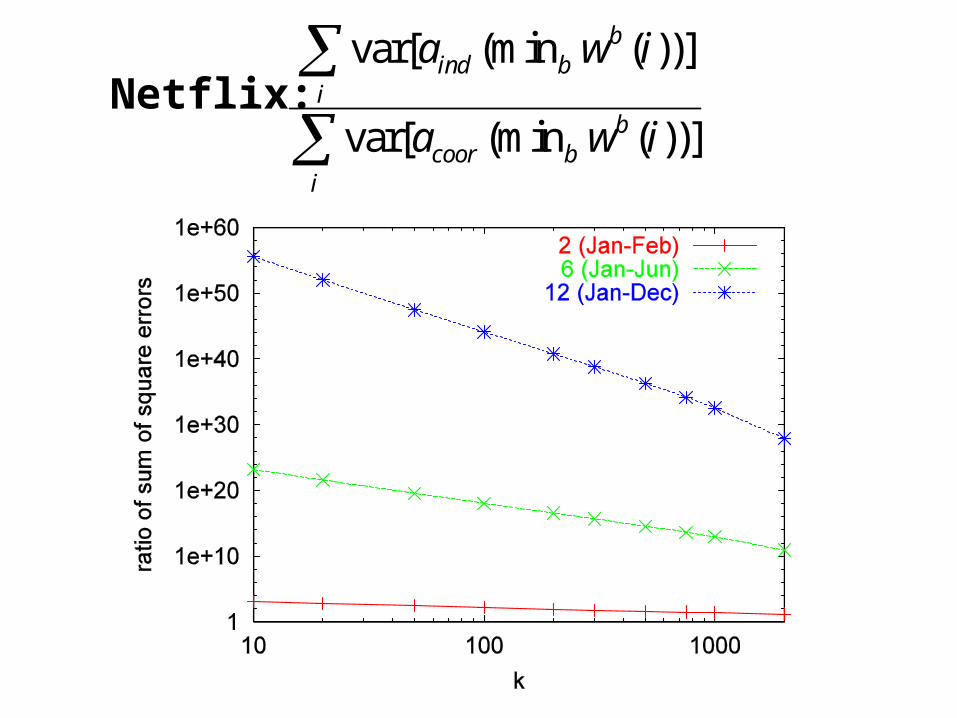
Netflix: var[ (min ( ))]
var[ (min ( ))]
bind b
ib
coor bi
a w i
a w i
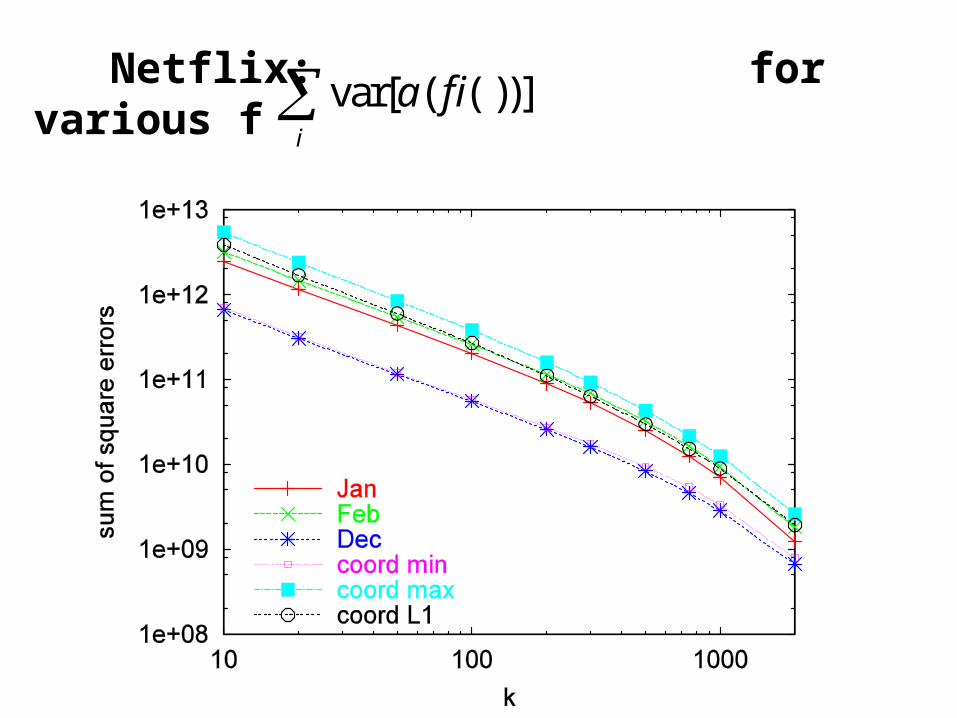
Netflix: for various f var[ ( ( ))]i
a f i

Summary
• Coordinated sketches improves accuracy and sometimes estimating is not feasible without it
• It can be achieved with little overhead using state of the art sampling techniques

Thank you!

Application: Sensor nodes recording daily vehicle traffic in different locations in a city
• Items: vehicles (license plate numbers)
• Sets: All vehicles observed at a particular location/date
Example queries:
• Number of distinct vehicles in Manhattan on election day (size of the union of all Manhattan locations on election day)
• Number of trucks with PA license plates that crossed both the Hudson and the East River on June 18, 2009

Application: Items are IP addresses. Sets h1,…,h24 correspond to destination IP’s observed in different 1-hour time periods.
Example Queries: number of distinct IP dests
• In the first 12 hours (size of union of h1,…,h12)
• In at most one/at least 4 out of h1,…,h24
• In the intersection of h9,…,h17 (all business hours)
• Same queries restricted to: blacklisted IP’s, servers in a specific country etc.
Uses: Traffic Analysis, Anomaly detection

Application: Text/HyperText corpus: items are features/terms, sets are documents (or vice versa)
Example Queries:
•Number of distinct hyperlinks to financial news websites from websites in the .edu domain
•Fraction of pages citing A that also cite B
•Similarity (Jaccard coefficient) of two documents
Uses: research, duplicate elimination, similarity search or clustering

Application: Market basket data set. Items are consumers/baskets, subsets are goods (or vice versa)
Example queries:
• Likelihood of purchasing beer if diapers were purchased
• Number of baskets from zip code 07932 containing shampoo
• Number of consumers purchasing baby food and not diapers
Uses: Marketing, placement, pricing, choosing products

Rank-based definition of sampling
• For each item draw a random rank value from some distribution fw(i)
•Poisson: Pick all items with rank value below Tau(k)
•Order/bottom-k: Pick the k smallest-ranked items to your sample
• r(i)=u/w(i) : Poisson PPS, priority order samples• r(i)=-ln(u)/w(i) : PPSWOR order samples
u U[0,1]Rank distributions:

Horvitz Thompson Estimators [HT52]
Let p(i) be the prob. that item i is sampled
If i is in the sample a(i)=w(i)/p(i) (otherwise a(i) = 0 )
a(i) is an unbiased estimator of w(i)
( )[ ( )] ( ) (1 ( ))0 ( )
( )
w iE a i p i p i w i
p i
Give each item i an adjusted weight a(i):

Rank Conditioning Estimator for single bottom-k sample set [CK07, DLT07]
A
0.10
0.38
0.04
0.15
0.870.79
0.62
0.510.42
0.94
4-sample of A
< 0.42
Use the principal of applying HT on a partition
For item i in sample, partition is based on the kth smallest rank value among all other items (excluding i) in the sample being some fixed value.
In this specific case, k=4 and the fixed value = 0.42.Compute p(i) : the probability that the rank value of i is smaller than 0.42.
For priority order samples, r(i)=u/w(i); p(i)=prob(r(i)<0.42)= min{1,0.42w(i)}; a(i)=w(i)/p(i)=max{w(i),100/42}


