CONTRA COSTA COUNTY I-680 CORRIDOR SYSTEM MANAGEMENT PLAN (CSMP)
FINAL REPORT
March 2015
EXECUTIVE SUMMARY
System Metrics Group, Inc.
Contra Costa County I-680 Corridor System Management Plan
Final Report Executive Summary
Table of Contents Stakeholder Outreach ..................................................................................................................... 1
Corridor Description ....................................................................................................................... 2
Corridor Performance and Trends .................................................................................................. 4
Bottleneck Identification and Causality .......................................................................................... 8
Modeling approach ......................................................................................................................... 9
comprehensive travel demand Evaluation Results ........................................................................ 9
Freeway Traffic modeling results .................................................................................................. 11
Conclusions and Recommendations ............................................................................................. 12
List of Exhibits Exhibit ES-1: Contra Costa County I-680 CSMP Corridor ................................................................ 3 Exhibit ES-2: Contra Costa County SMF Place Types ...................................................................... 3 Exhibit ES-3: I-680 CSMP Corridor Pollutants ................................................................................. 4 Exhibit ES-4: I-680 CSMP Corridor Mode Shares ............................................................................ 5 Exhibit ES-5: I-680 NB Average Weekday Hourly Delay.................................................................. 7 Exhibit ES-6: I-680 SB Average Weekday Hourly Delay .................................................................. 7 Exhibit ES-7: I-680 NB Travel Time Reliability (2010) ..................................................................... 7 Exhibit ES-8: I-680 SB Travel Time Reliability (2010) ...................................................................... 7 Exhibit ES-9: I-680 Bottlenecks ....................................................................................................... 8 Exhibit ES-10: I-680 CSMP Scenarios, Projects, and Results ......................................................... 10
System Metrics Group, Inc. Page ES-I

Contra Costa County I-680 Corridor System Management Plan
Final Report Executive Summary
The Contra Costa County Interstate 680 (I-680) Corridor System Management Plan (CSMP) Final Report was developed by the California Department of Transportation (Caltrans) District 4 San Francisco Bay Area office in coordination with the Contra Costa County Transportation Authority (CCTA) and the Metropolitan Transportation Commission (MTC). This is the first second-generation CSMP in the State and it builds on the first generation CSMPs developed around the State as part of a requirement by the California Transportation Commission (CTC) for corridors receiving funding from the voter-approved Proposition 1B Corridor Mobility Improvement Account (CMIA). The initial round of CSMPs aimed to measure how the corridor was performing, understand why it performed that way, and recommended system management strategies to maintain the performance improvements gained through the CMIA funds. This second-generation CSMP builds on the previous effort and also incorporates three new planning elements into corridor system management:
• Smart Mobility Framework (SMF) - The Caltrans SMF aims to improve the movement of people and freight while enhancing California’s economic, environmental, and human resources. This CSMP includes a pilot evaluation of the corridor to identify opportunities to meet the priorities and values of Smart Mobility.
• Complete Streets Analysis - The I-680 CSMP also included a Complete Streets analysis of the corridor to identify opportunities to make Complete Streets a routine part of Caltrans’ system planning. To meet the California Complete Streets Act of 2008, Caltrans adopted Deputy Directive-64-R1, Complete Streets-Integrating the Transportation System (2008) to provide for the safe mobility for all users appropriate to the function and context of facilities on the State Highway System.
• The use of the new simulation tool TOPL (Tools for Operational Planning ) - This CSMP effort is
the first large-scale demonstration of the TOPL tool currently under development by Partners for Advanced Transportation Technology (PATH) at the University of California at Berkeley. In collaboration with the Caltrans District 4 Division of Traffic Operations, the TOPL analytical package is designed to provide quick quantitative assessments of congestion relief strategies for freeways and urban arterials. This will allow planners and engineers to test system operational improvements to benefit travelers without relying on major infrastructure expansion projects. If successful, this tool may replace the often used FREQ tool which is no longer being supported.
STAKEHOLDER OUTREACH This study began in February 2012 and was guided by a Staff Working Group (SWG) composed of Caltrans District 4 and headquarters engineering and planning staff, CCTA planning staff, MTC planning staff, PATH researchers, the SMF pilot study consultant team, and an I-680 CSMP consultant team that oversaw the technical analysis and managed the outreach for the study. Caltrans also solicited input from a Technical Advisory Committee (TAC) made up of representatives from local jurisdictions, transit agencies, Congestion Management Agencies, and other key stakeholders.
System Metrics Group, Inc. Page ES-1
Contra Costa County I-680 Corridor System Management Plan
Final Report Executive Summary
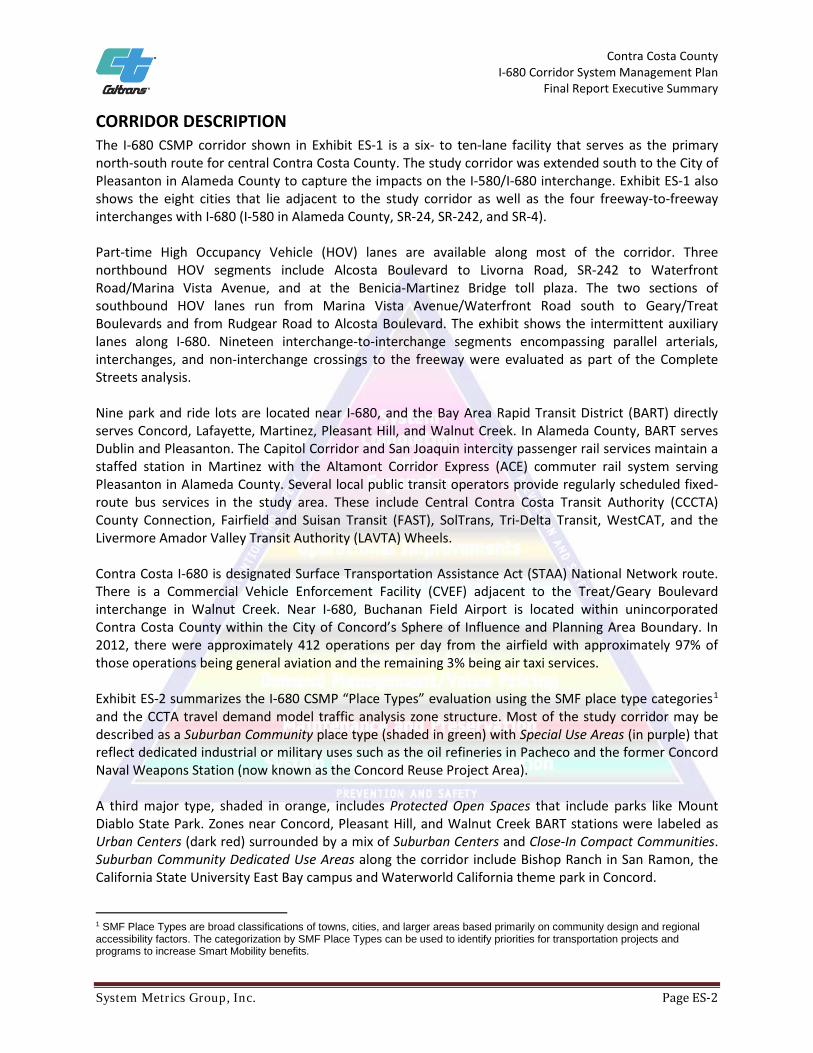
CORRIDOR DESCRIPTION The I-680 CSMP corridor shown in Exhibit ES-1 is a six- to ten-lane facility that serves as the primary north-south route for central Contra Costa County. The study corridor was extended south to the City of Pleasanton in Alameda County to capture the impacts on the I-580/I-680 interchange. Exhibit ES-1 also shows the eight cities that lie adjacent to the study corridor as well as the four freeway-to-freeway interchanges with I-680 (I-580 in Alameda County, SR-24, SR-242, and SR-4). Part-time High Occupancy Vehicle (HOV) lanes are available along most of the corridor. Three northbound HOV segments include Alcosta Boulevard to Livorna Road, SR-242 to Waterfront Road/Marina Vista Avenue, and at the Benicia-Martinez Bridge toll plaza. The two sections of southbound HOV lanes run from Marina Vista Avenue/Waterfront Road south to Geary/Treat Boulevards and from Rudgear Road to Alcosta Boulevard. The exhibit shows the intermittent auxiliary lanes along I-680. Nineteen interchange-to-interchange segments encompassing parallel arterials, interchanges, and non-interchange crossings to the freeway were evaluated as part of the Complete Streets analysis. Nine park and ride lots are located near I-680, and the Bay Area Rapid Transit District (BART) directly serves Concord, Lafayette, Martinez, Pleasant Hill, and Walnut Creek. In Alameda County, BART serves Dublin and Pleasanton. The Capitol Corridor and San Joaquin intercity passenger rail services maintain a staffed station in Martinez with the Altamont Corridor Express (ACE) commuter rail system serving Pleasanton in Alameda County. Several local public transit operators provide regularly scheduled fixed-route bus services in the study area. These include Central Contra Costa Transit Authority (CCCTA) County Connection, Fairfield and Suisan Transit (FAST), SolTrans, Tri-Delta Transit, WestCAT, and the Livermore Amador Valley Transit Authority (LAVTA) Wheels. Contra Costa I-680 is designated Surface Transportation Assistance Act (STAA) National Network route. There is a Commercial Vehicle Enforcement Facility (CVEF) adjacent to the Treat/Geary Boulevard interchange in Walnut Creek. Near I-680, Buchanan Field Airport is located within unincorporated Contra Costa County within the City of Concord’s Sphere of Influence and Planning Area Boundary. In 2012, there were approximately 412 operations per day from the airfield with approximately 97% of those operations being general aviation and the remaining 3% being air taxi services. Exhibit ES-2 summarizes the I-680 CSMP “Place Types” evaluation using the SMF place type categories1 and the CCTA travel demand model traffic analysis zone structure. Most of the study corridor may be described as a Suburban Community place type (shaded in green) with Special Use Areas (in purple) that reflect dedicated industrial or military uses such as the oil refineries in Pacheco and the former Concord Naval Weapons Station (now known as the Concord Reuse Project Area). A third major type, shaded in orange, includes Protected Open Spaces that include parks like Mount Diablo State Park. Zones near Concord, Pleasant Hill, and Walnut Creek BART stations were labeled as Urban Centers (dark red) surrounded by a mix of Suburban Centers and Close-In Compact Communities. Suburban Community Dedicated Use Areas along the corridor include Bishop Ranch in San Ramon, the California State University East Bay campus and Waterworld California theme park in Concord.
1 SMF Place Types are broad classifications of towns, cities, and larger areas based primarily on community design and regional accessibility factors. The categorization by SMF Place Types can be used to identify priorities for transportation projects and programs to increase Smart Mobility benefits.
System Metrics Group, Inc. Page ES-2

Contra Costa County I-680 Corridor System Management Plan
Final Report Executive Summary
Exhibit ES-1: Contra Costa County I-680 CSMP Corridor
Source: System Metrics Group, Inc. analysis of existing facilities.
Exhibit ES-2: Contra Costa County SMF Place Types
Source: System Metrics Group, Inc. analysis of CCTA travel demand model traffic analysis zones.
System Metrics Group, Inc. Page ES-3
Contra Costa County I-680 Corridor System Management Plan
Final Report Executive Summary
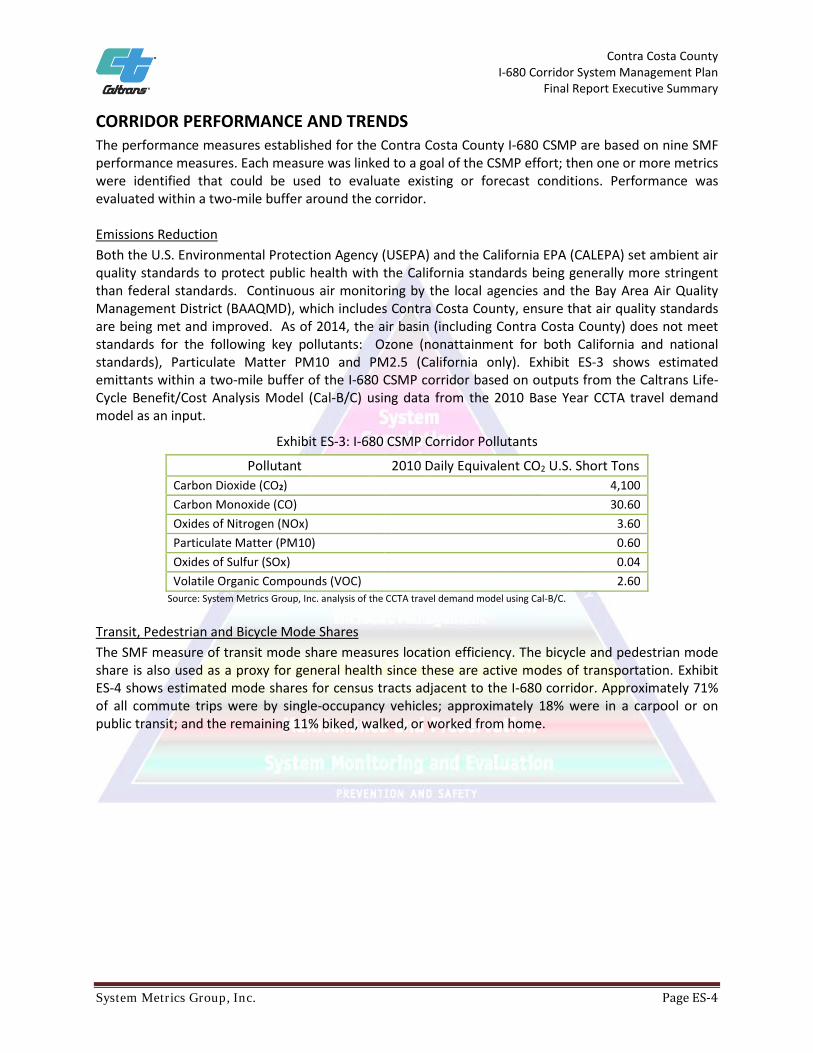
CORRIDOR PERFORMANCE AND TRENDS The performance measures established for the Contra Costa County I-680 CSMP are based on nine SMF performance measures. Each measure was linked to a goal of the CSMP effort; then one or more metrics were identified that could be used to evaluate existing or forecast conditions. Performance was evaluated within a two-mile buffer around the corridor. Emissions Reduction Both the U.S. Environmental Protection Agency (USEPA) and the California EPA (CALEPA) set ambient air quality standards to protect public health with the California standards being generally more stringent than federal standards. Continuous air monitoring by the local agencies and the Bay Area Air Quality Management District (BAAQMD), which includes Contra Costa County, ensure that air quality standards are being met and improved. As of 2014, the air basin (including Contra Costa County) does not meet standards for the following key pollutants: Ozone (nonattainment for both California and national standards), Particulate Matter PM10 and PM2.5 (California only). Exhibit ES-3 shows estimated emittants within a two-mile buffer of the I-680 CSMP corridor based on outputs from the Caltrans Life-Cycle Benefit/Cost Analysis Model (Cal-B/C) using data from the 2010 Base Year CCTA travel demand model as an input.
Exhibit ES-3: I-680 CSMP Corridor Pollutants
Pollutant 2010 Daily Equivalent CO2 U.S. Short Tons Carbon Dioxide (CO2) 4,100 Carbon Monoxide (CO) 30.60 Oxides of Nitrogen (NOx) 3.60 Particulate Matter (PM10) 0.60 Oxides of Sulfur (SOx) 0.04 Volatile Organic Compounds (VOC) 2.60
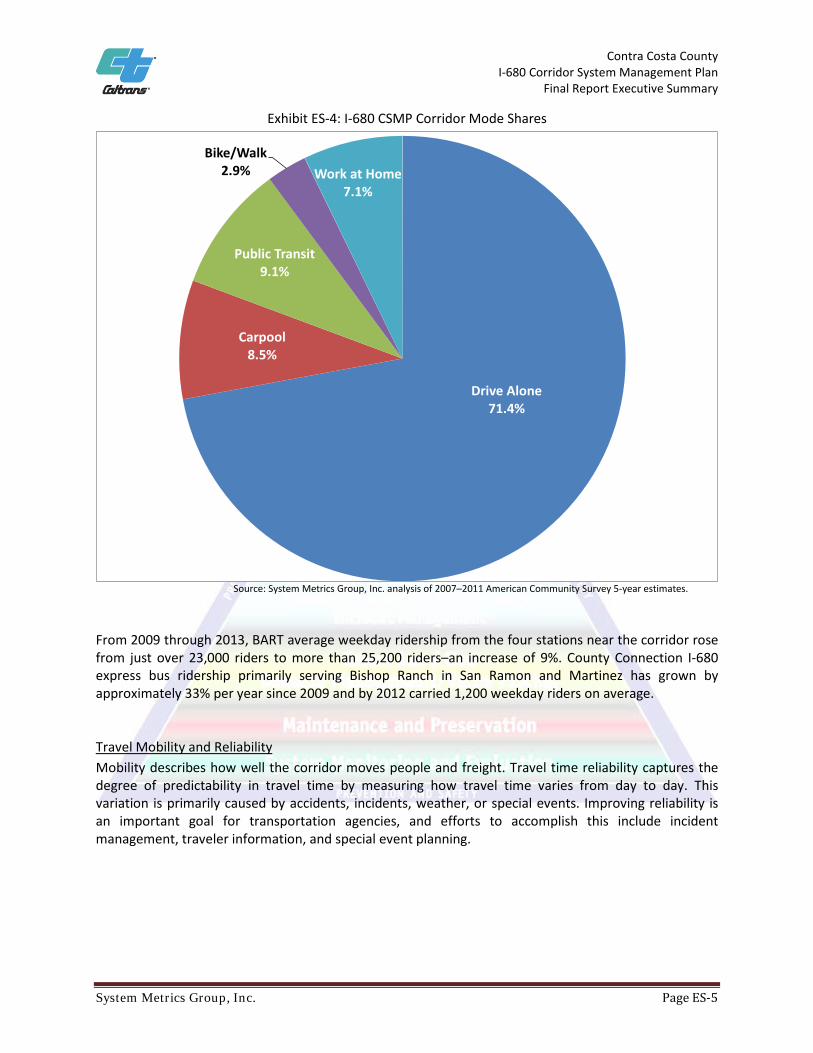
Source: System Metrics Group, Inc. analysis of the CCTA travel demand model using Cal-B/C. Transit, Pedestrian and Bicycle Mode Shares The SMF measure of transit mode share measures location efficiency. The bicycle and pedestrian mode share is also used as a proxy for general health since these are active modes of transportation. Exhibit ES-4 shows estimated mode shares for census tracts adjacent to the I-680 corridor. Approximately 71% of all commute trips were by single-occupancy vehicles; approximately 18% were in a carpool or on public transit; and the remaining 11% biked, walked, or worked from home.
System Metrics Group, Inc. Page ES-4
Contra Costa County I-680 Corridor System Management Plan
Final Report Executive Summary
Exhibit ES-4: I-680 CSMP Corridor Mode Shares
Source: System Metrics Group, Inc. analysis of 2007─2011 American Community Survey 5-year estimates.
From 2009 through 2013, BART average weekday ridership from the four stations near the corridor rose from just over 23,000 riders to more than 25,200 riders–an increase of 9%. County Connection I-680 express bus ridership primarily serving Bishop Ranch in San Ramon and Martinez has grown by approximately 33% per year since 2009 and by 2012 carried 1,200 weekday riders on average. Travel Mobility and Reliability Mobility describes how well the corridor moves people and freight. Travel time reliability captures the degree of predictability in travel time by measuring how travel time varies from day to day. This variation is primarily caused by accidents, incidents, weather, or special events. Improving reliability is an important goal for transportation agencies, and efforts to accomplish this include incident management, traveler information, and special event planning.
Drive Alone71.4%
Carpool8.5%
Public Transit9.1%
Bike/Walk2.9% Work at Home
7.1%
System Metrics Group, Inc. Page ES-5

Contra Costa County I-680 Corridor System Management Plan
Final Report Executive Summary
The SMF pilot evaluation evaluated the multimodal mobility level of service (LOS) for transit and pedestrian and bicycle modes at the intersection and link levels at seven arterial locations adjacent to I-680. Multimodal reliability was also assessed qualitatively as part of that pilot effort. The Complete Streets evaluation examined parallel bicycle and pedestrian facilities to identify issues which resulted in recommended treatments for connectivity and mobility at the following highest-priority segments:
• El Pintado Road to Stone Valley Road • Stone Valley Road to Livorna Road • Livorna Road to Rudgear Road • Concord Avenue to Pacheco Boulevard/Arthur Road • Pacheco Boulevard/Arthur Road to Marina Vista Road/Waterfront Road.
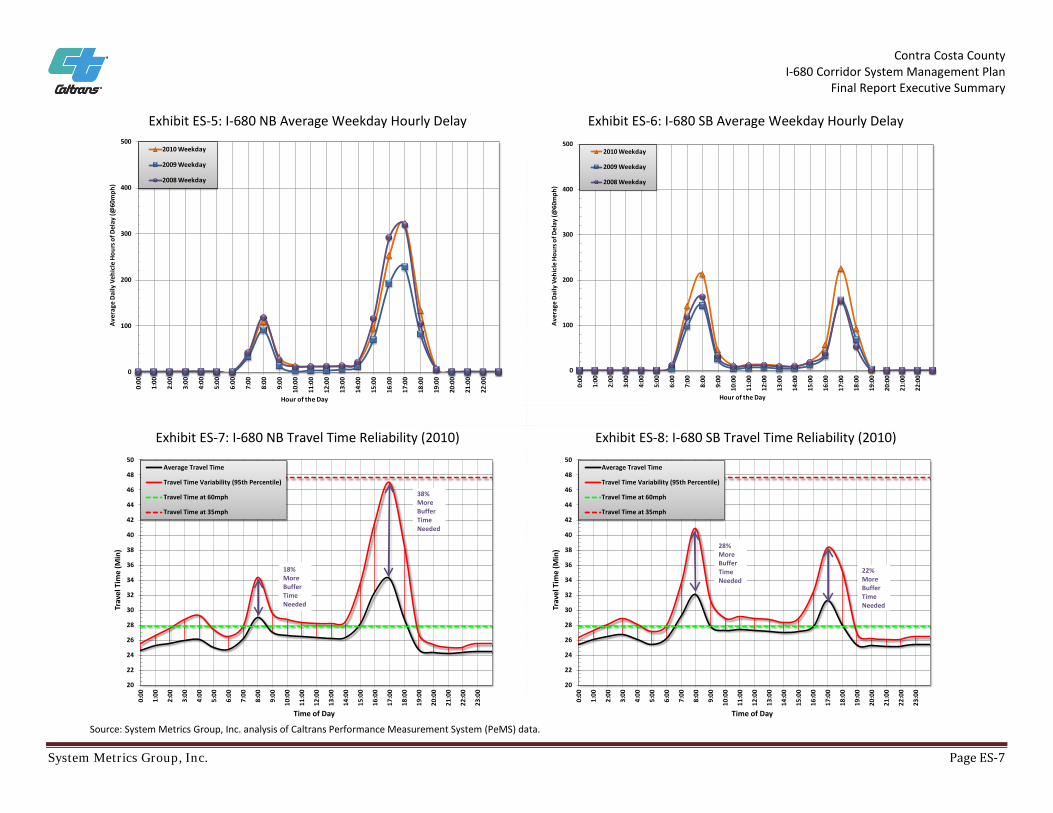
Exhibits ES-5 and ES-6 show the 2008─2010 I-680 freeway average weekday vehicle-hours of delay by hour for each direction. Due to data availability issues in recent years, more current results are not presented. These two exhibits show the peaking characteristics of the freeway and how they change from one year to the next. The charts show that congestion has grown since the economic recession in 2009. The northbound PM peak period is the most congested period on the freeway. In the southbound direction, both time periods experience approximately the same level of delay. To measure freeway reliability, the study team used data from the California Performance Measurement System (PeMS) to estimate the “buffer index,” which reflects the additional time required beyond the average travel time to ensure an on-time arrival 95 percent of the time (e.g., 19 out of 20 workdays per month). Severe events, such as collisions, could cause longer travel times, but the 95th percentile represents a balance between days with major events (e.g., accidents) and more “average” travel days. Exhibit ES-7 presents travel time variability for the northbound direction. The 5:00 PM peak hour was the slowest hour in that direction as well as the most unreliable, requiring 46 minutes for an on-time arrival 95 percent of the time. In the southbound direction, the most unreliable hours were the 8:00 AM and 5:00 PM peak hours, with both experiencing similar average travel times. However, the 8:00 AM hour required a buffer time of nearly 40 minutes to ensure an on-time arrival, while the PM peak hour required about 36 minutes.
System Metrics Group, Inc. Page ES-6
Contra Costa County I-680 Corridor System Management Plan
Final Report Executive Summary
Exhibit ES-5: I-680 NB Average Weekday Hourly Delay Exhibit ES-6: I-680 SB Average Weekday Hourly Delay
Exhibit ES-7: I-680 NB Travel Time Reliability (2010) Exhibit ES-8: I-680 SB Travel Time Reliability (2010)
Source: System Metrics Group, Inc. analysis of Caltrans Performance Measurement System (PeMS) data.
0
100
200
300
400
5000:
00
1:00
2:00
3:00
4:00
5:00
6:00
7:00
8:00
9:00
10:0
0
11:0
0
12:0
0
13:0
0
14:0
0
15:0
0
16:0
0
17:0
0
18:0
0
19:0
0
20:0
0
21:0
0
22:0
0
Aver
age
Daily
Veh
icle
Hou
rs o
f Del
ay (@
60m
ph)
Hour of the Day
2010 Weekday
2009 Weekday
2008 Weekday
0
100
200
300
400
500
0:00
1:00
2:00
3:00
4:00
5:00
6:00
7:00
8:00
9:00
10:0
0
11:0
0
12:0
0
13:0
0
14:0
0
15:0
0
16:0
0
17:0
0
18:0
0
19:0
0
20:0
0
21:0
0
22:0
0
Aver
age
Daily
Veh
icle
Hou
rs o
f Del
ay (@
60m
ph)
Hour of the Day
2010 Weekday
2009 Weekday
2008 Weekday
20
22
24
26
28
30
32
34
36
38
40
42
44
46
48
50
0:00
1:00
2:00
3:00
4:00
5:00
6:00
7:00
8:00
9:00
10:0
0
11:0
0
12:0
0
13:0
0
14:0
0
15:0
0
16:0
0
17:0
0
18:0
0
19:0
0
20:0
0
21:0
0
22:0
0
23:0
0
Trav
el T
ime
(Min
)
Time of Day
Average Travel Time
Travel Time Variability (95th Percentile)
Travel Time at 60mph
Travel Time at 35mph
18% More Buffer Time Needed
38% More Buffer Time Needed
20
22
24
26
28
30
32
34
36
38
40
42
44
46
48
50
0:00
1:00
2:00
3:00
4:00
5:00
6:00
7:00
8:00
9:00
10:0
0
11:0
0
12:0
0
13:0
0
14:0
0
15:0
0
16:0
0
17:0
0
18:0
0
19:0
0
20:0
0
21:0
0
22:0
0
23:0
0
Trav
el T
ime
(Min
)
Time of Day
Average Travel Time
Travel Time Variability (95th Percentile)
Travel Time at 60mph
Travel Time at 35mph
28% More Buffer Time Needed
22% More Buffer Time Needed
System Metrics Group, Inc. Page ES-7

Contra Costa County I-680 Corridor System Management Plan
Final Report Executive Summary
BOTTLENECK IDENTIFICATION AND CAUSALITY Major bottlenecks are the primary cause of congestion. A bottleneck is a location where traffic demand exceeds the effective carrying capacity of the roadway, typically caused by a sudden reduction in effective capacity, such as when a lane drop occurs or when heavy merging and weaving take place near on- and off-ramps. The study team identified both major controlling and minor bottlenecks (minor bottlenecks include hidden bottlenecks that are overtaken by queuing from a downstream bottleneck or by reduced traffic flow from an upstream bottleneck). Exhibit ES-9 describes each bottleneck and provides a summary of the causes of each bottleneck.
Exhibit ES-9: I-680 Bottlenecks
NB On From Stoneridge Dr (Pleasanton) 028.91 R19.371
NB On From Crow Canyon Rd 035.85 R4.44 (3:30PM-6:30PM) NB On merging. Usually resolves jso Greenbrook Ave
NB On From Sycamore Valley Rd 038.26 R6.72 Some slowing at NB on-ramp, but downstream El Cerro bottleneck sometimes queues past this location
NB On From El Pintado Road/El Cerro Blvd 040.24 R8.84 High volumes at El Cerro On
NB On From Livorna Rd 042.79 R11.398 Minor slowing
NB Off To WB SR-24/Ygnacio Valley Rd Off/Olympic On 045.99 014.49 Lane drop from 5 to 3 lanes. Combination of SR-24/ I-680/ Olympic On auxiliary lane ending and curvature/geometrics that cause weaving issues
NB Off To N Main St 047.02 015.52 Lane drop from 6 to 5 lanes at NB Off to N Main St
NB On From Lawrence Way/NB Off To Treat Blvd 047.24 015.73 High on/off ramp volumes at Lawrence Way On/Treat Off
9.9 Solano County Line 057.16 025.66
SB Off to Stoneridge Dr (Pleasanton) 029.05 R19.511
SB On From Sycamore Valley Rd 038.03 R6.636 Minor intermittent slowing. Not a major bottleneck. On-ramp surges can contribute to slowing.
Approx 1/(2.0+/-)
SB On From Stone Valley Rd 041.60 R10.208 7:00AM-9:00AM Some slowing. Not a major bottleneck, but could become one in the future. Relatively high AM on-ramp volumes can contribute to slowing.
4.6/(1.5+/-)
SB On From Livorna Rd 042.79 R11.481 7:00AM-9:00AM/ (4:00PM-6:00PM)
Lane drop from 5 to 4 to 3 lanes in succession. Some queuing in #1 Lane jno HOV (at AbsPM=44.4) due to anticipation of HOV lane ingress by HOVs
Lane Drop jso SB Off to North Main 047.38 15.883 6:30AM-9:00AM Lane drop at SB off ramp
Solano County Line 057.16 25.657
XXX - Controlling bottleneck locationYYY - Minor bottleneck/slowingZZZ - Not a bottleneck location
Average Duration AM/(PM)
Causality
North
boun
d
6.9/(1.0+/-)
End of corridor. Not a bottleneck
4.4/(1.5+/-)
7:00AM-9:00AM/ (3:30PM-6:30PM)
Dir
Length of Bottleneck
Area/ (Expected
Queue Length)
Bottleneck Location Absolute Postmile
Caltrans Postmile
Sout
hbou
nd
19.0
End of corridor. Not a bottleneck
9.8/(3.0-4.0+/-)
End of corridor. Not a bottleneck
7.0/(4.25 - 4.5+/-)
(3:00PM-7:00PM)
End of corridor. Not a bottleneck
System Metrics Group, Inc. Page ES-8

Contra Costa County I-680 Corridor System Management Plan
Final Report Executive Summary
MODELING APPROACH Mitigation strategies were tested using two different models as follows:
• Comprehensive Travel Demand Modeling – The CCTA travel demand model was used to comprehensively evaluate mitigation strategies. This evaluation included diversion results between freeways and arterials which local stakeholders of different improvements. Stakeholders communicated to Caltrans that diversion is a critical factor for their cities. The CCTA travel demand model was also used to evaluate the impact of increased active transportation investments.
• Freeway Traffic Modeling – The TOPL model was used to evaluate traffic flows, impacts on existing and future bottlenecks, and incident management. Such analysis is not possible with travel demand models. TOPL modeling involved first calibrating the model to current conditions, including locations and severity of existing bottlenecks. Next, a horizon model was developed to represent likely 2025 conditions. Finally, short and medium term mitigation strategies were modeled and compared against existing and the horizon year model.
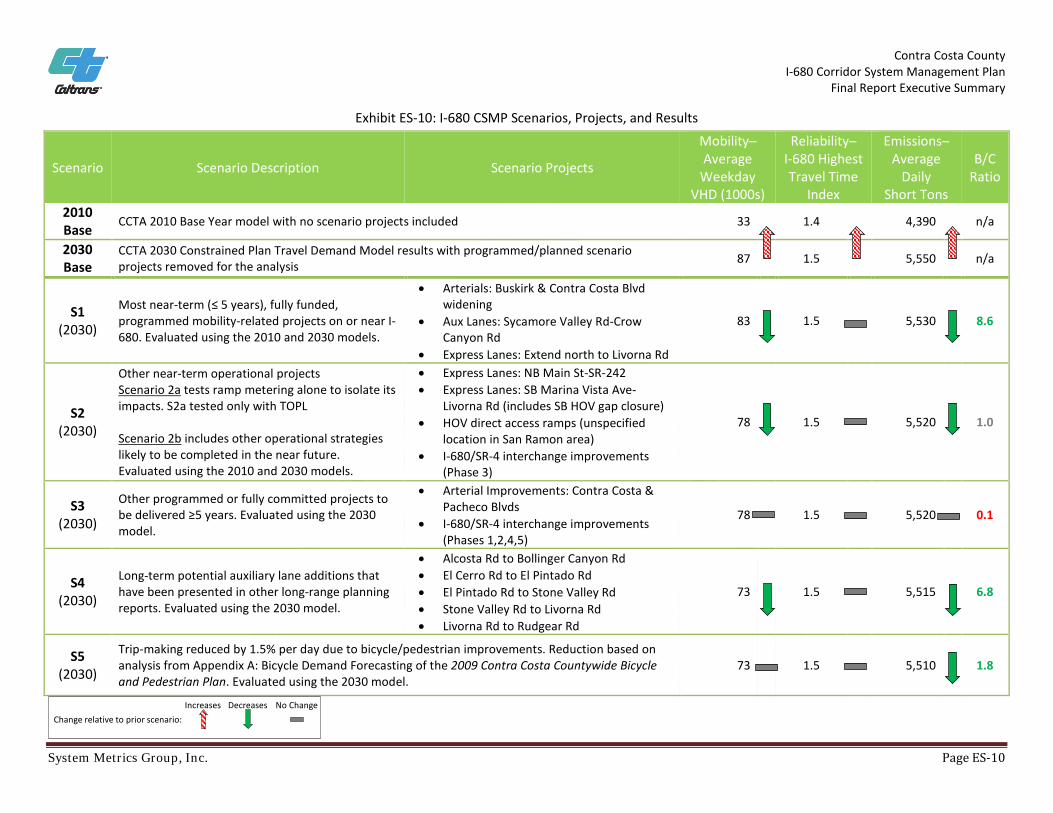
COMPREHENSIVE TRAVEL DEMAND EVALUATION RESULTS To test mitigation strategies and their potential impact on bottlenecks identified in the previous section, a framework was developed to combine multiple projects into evaluation scenarios. These scenarios were evaluated using the CCTA 2010 base year and 2030 constrained travel demand models. The framework for this CSMP differs from traditional alternatives evaluations that focus on comparing competing alternatives among one another and selecting a locally preferred alternative. For the I-680 CSMP, scenarios build on previous scenarios as long as the incremental scenario results show an acceptable level of performance improvement. Exhibit ES-10 lists the tested scenarios and their associated projects. Each project was identified from existing programming and planning documents and presented to the TAC for approval. In addition to model performance results from the 2010 base year and 2030 constrained CCTA models, the exhibit also summarizes the results for each scenario tested. A benefit/cost analysis was performed using the California Benefit/Cost (Cal-B/C) model to estimate benefits in three areas: travel time, vehicle operating costs, and emissions.
The analysis does not capture the benefits after the 20-year lifecycle or benefits received outside the study area or due to improvements in transit travel times. For example, the I-680/SR-4 interchange improvement project will have impacts on SR-4 well beyond the I-680 CSMP study area that were not captured in this analysis. Project costs were obtained from the 2009 County Transportation Plan, the MTC Regional Transportation Plan/Sustainable Communities Strategy, and the Caltrans Transportation System Development Plan, as well as from CCTA.
System Metrics Group, Inc. Page ES-9
Contra Costa County I-680 Corridor System Management Plan
Final Report Executive Summary
Exhibit ES-10: I-680 CSMP Scenarios, Projects, and Results
Scenario Scenario Description Scenario Projects
Mobility─ Average
Weekday VHD (1000s)
Reliability─ I-680 Highest Travel Time
Index
Emissions─ Average
Daily Short Tons
B/C Ratio
2010 Base CCTA 2010 Base Year model with no scenario projects included 33 1.4 4,390
n/a
2030 Base
CCTA 2030 Constrained Plan Travel Demand Model results with programmed/planned scenario projects removed for the analysis 87 1.5 5,550 n/a
S1 (2030)
Most near-term (≤ 5 years), fully funded, programmed mobility-related projects on or near I-680. Evaluated using the 2010 and 2030 models.
• Arterials: Buskirk & Contra Costa Blvd widening
• Aux Lanes: Sycamore Valley Rd-Crow Canyon Rd
• Express Lanes: Extend north to Livorna Rd
83
1.5 5,530
8.6
S2 (2030)
Other near-term operational projects Scenario 2a tests ramp metering alone to isolate its impacts. S2a tested only with TOPL Scenario 2b includes other operational strategies likely to be completed in the near future. Evaluated using the 2010 and 2030 models.
• Express Lanes: NB Main St-SR-242 • Express Lanes: SB Marina Vista Ave-
Livorna Rd (includes SB HOV gap closure) • HOV direct access ramps (unspecified
location in San Ramon area) • I-680/SR-4 interchange improvements
(Phase 3)
78
1.5 5,520
1.0
S3 (2030)
Other programmed or fully committed projects to be delivered ≥5 years. Evaluated using the 2030 model.
• Arterial Improvements: Contra Costa & Pacheco Blvds
• I-680/SR-4 interchange improvements (Phases 1,2,4,5)
78 1.5 5,520 0.1
S4 (2030)
Long-term potential auxiliary lane additions that have been presented in other long-range planning reports. Evaluated using the 2030 model.
• Alcosta Rd to Bollinger Canyon Rd • El Cerro Rd to El Pintado Rd • El Pintado Rd to Stone Valley Rd • Stone Valley Rd to Livorna Rd • Livorna Rd to Rudgear Rd
73
1.5 5,515
6.8
S5 (2030)
Trip-making reduced by 1.5% per day due to bicycle/pedestrian improvements. Reduction based on analysis from Appendix A: Bicycle Demand Forecasting of the 2009 Contra Costa Countywide Bicycle and Pedestrian Plan. Evaluated using the 2030 model.
73 1.5 5,510
1.8
IncreasesChange relative to prior scenario:
Decreases No Change
System Metrics Group, Inc. Page ES-10

Contra Costa County I-680 Corridor System Management Plan
Final Report Executive Summary
FREEWAY TRAFFIC MODELING RESULTS TOPL modeling shows that most existing bottlenecks are significantly alleviated with short term projects, including both phases of Express lanes, the recently completed auxiliary lanes, and ramp metering. Congestion and bottlenecks do return by 2025 to levels similar to existing conditions. Therefore, longer term, additional investment will be required. Specifically, the longer term auxiliary projects in Scenario 4 will be needed to address future congestion. Other specific findings of the traffic analysis include:
• For ramp metering in the near future, several ramps should be considered for expansion in order to avoid ramp queues spilling onto the arterials.
• Northbound ramps that should be considered for expansion include: o Lawrence Way on-ramp o Buskirk on-ramp o Crow Canyon EB on-ramp o El Cerro on-ramp
• Southbound ramps that should be considered for expansion include:
o Geary Road on-ramp o N. Main on-ramp o Bollinger Canyon WB on-ramp o Willow Pass WB on-ramp o Monument on-ramp o El Cerro on-ramp
• Longer term, as demand increases, additional ramps will likely need to be expanded as
well. As part of their standard practice, Caltrans metering staff will monitor all metered ramps and develop mitigation strategies as back-ups occur.
• Improved incident management can significantly reduce non-recurrent congestion (i.e., congestion due to collisions and other incidents). TOPL was used to compare impacts of an accident that forces closure of one lane at Rudgear Road for 45 minutes. The results were then compared to an accident that forces the same closure for only 20 minutes. The difference represents a hypothetical improvement in incident clearance. Such an improvement would conservatively save travelers more than 325 hours of delay.
Additional benefits on other corridors such as SR-4 or I-580 were not included in the traffic analysis and are likely substantial. Therefore, TOPL results only reflect impacts on the I-680.
System Metrics Group, Inc. Page ES-11
Contra Costa County I-680 Corridor System Management Plan
Final Report Executive Summary
CONCLUSIONS AND RECOMMENDATIONS This section summarizes the conclusions and recommendations of the I-680 CSMP based primarily on the results of benefit-cost analyses using the CCTA travel demand model as well as TOPL traffic modeling. Caution should always be used when making decisions based on modeling alone since project selection and programming are based on a combination of regional and inter-regional plans and needs. Regional and local acceptance for a project, availability of funding, and the planning and engineering requirements are all critical for the successful implementation of a project. The I-680 CSMP represents the second generation of CSMPs and includes the testing of Caltrans’ SMF principles, the integration of Complete Streets into corridor planning, and an evaluation of a new traffic simulation tool in TOPL. Conclusions related to the new aspects of this CSMP include:
• The SMF principles, place types, and performance measures were incorporated into this CSMP
planning process. The SMF principles were reflected in the corridor objectives as well as the performance metrics. The SMF Place Types were applied. However, given that Priority Development Areas (PDAs) were recently defined by the Regional Transportation Plan (RTP)/Sustainable Community Strategy (SCS) adopted by MTC, subsequent corridor studies, like this I-680 CSMP, can document PDAs around the corridor rather than apply the SMF Place Types. The MMLOS analysis demonstrated that the HCM 2010 methodology can be applied with limited data collection to capture the interaction among modes on parallel arterials. However, additional resources would be needed to conduct a more detailed MMLOS analysis for the entire corridor, and such an analysis should include stakeholders to select locations for study.
• The Complete Streets analysis was very useful and identified specific areas for potential improvements that were not included in previous CSMPs. In fact, it is strongly recommended to include similar or even more detailed analysis for corridor studies in the future.
The following specific conclusions and recommendations are based on the results of the comprehensive travel demand modeling:
• All scenarios assumed that planned transit projects are implemented and took into consideration the resulting increase in transit ridership.
• All scenarios tested show benefit-cost ratios greater than or equal to 1.0, which indicate that each bundle of projects appear to have positive impacts on the corridor. Note that benefits can extend beyond the analysis corridor (e.g., SR-4 widening at the I-680 interchange has benefits well-beyond the 2-mile buffer around the I-680 freeway).
• Scenarios 1 and 2 are short-term scenarios that are planned to be implemented in the next few years. Of these two scenarios, Scenario 1, the extension of the Express Lanes to Livorna Road and the construction of the Crow Canyon Road/Sycamore Valley Road auxiliary lane, is expected to produce significant travel time savings on both the freeway facility and on local arterials in the San Ramon and Danville areas.
• Scenario 2 produces the lowest expected benefit-cost ratio (1.0), but the SR-4 interchange improvements may provide benefits along SR-4 that could be higher than estimated in the 2-
System Metrics Group, Inc. Page ES-12
Contra Costa County I-680 Corridor System Management Plan
Final Report Executive Summary
mile buffer around the I-680 freeway interchange. The direct access ramp may produce increases in local, arterial traffic adjacent to the proposed ramp, but will reduce traffic volumes at other locations. “Scenario 2a” representing corridor-wide ramp metering implementation could not be analyzed by the travel demand model. However, it was analyzed using the TOPL model (see below)
• In the longer term, the Scenario 3 improvements produce a modest 2.1 to 1 benefit-cost ratio.
This is due to the high cost of the SR-4 interchange improvements. As described above, the SR-4 benefits may extend beyond the I-680/SR-4 interchange and are not accounted for in this analysis.
• Scenario 4 shows a high benefit-cost ration of 17.2 to 1. This scenario constructs relatively low-cost, auxiliary lanes in the southern part of the corridor extending to the Alamo area, where they currently do not exist. This draws traffic off of local arterials and improves flows on the I-680.
• Scenario 5 is a sketch-level, 1.5 percent VMT, reduction strategy assuming full build-out of the 605-mile bicycle and pedestrian development plan, outlined in the 2009 Contra Costa County Comprehensive Bicycle Plan. This high-level assessment should be further refined in the future, using more updated cost data based on more detailed planning.
The following are conclusions related to TOPL modeling: • After significant review and modifications, TOPL provided reasonable, defensible results.
• TOPL reasonably predicted the benefits from the recently completed auxiliary lanes northbound
at Crow Canyon.
• TOPL helped identify ramps that should be examined for potential expansion in order to avoid spillage onto local arterials once ramp metering has been implemented.
• TOPL should not be used by public agencies until:
o Documentation is provided o A User Group is assembled to guide product development, documentation, and training o A Graphical User Interface is developed to facilitate and simplify use of TOPL o Research is conducted and improvements made related to merges and weaves and
other technical issues. The combination of both modeling efforts show that the Contra Costa I-680 CSMP corridor will evolve operationally by incorporating ramp metering, priced managed lanes, and auxiliary lanes in the short-term that will continue to provide long-term benefits including reducing pressure on local arterials and streets. The Contra Costa I-680 CSMP also identified opportunities for implementation of Complete Streets along the corridor, whenever feasible. It is important to stress that CSMPs should be updated on a regular basis, and these new efforts should be advanced in future efforts. The continual updating of the CSMP is particularly important since traffic conditions and patterns can change over time and differ from current projections. After projects are delivered, it is also useful to compare actual results with ones estimated in this document so that models can be further improved.
System Metrics Group, Inc. Page ES-13


