
Construction Productivity
Productivity Measurement and Benchmarking

Productivity By popular definition productivity simply refers to the general
efficiency of an organization or individual
The output of any aspect of production per unit of input
Economic measure of output of a worker, machine, or an entire national economy in the creation of goods and services to produce wealth
In the business world, productivity measures investment in capital, such as buildings, machines, raw materials & in labour against the profits from the sale of the product

Productivity A company that most minimizes input and maximizes output has the
highest productivity
A total concept that addresses the key elements of competition i.e. innovation, cost, quality and delivery
Should be viewed as value adding in addition to optimizing
Construction is a labour intensive process
Manpower is one of the productive resources in construction
Construction productivity largely depends upon human performance
Reliable measures of productivity is output per work-hour being achieved by workers

Why is Productivity Important? Extremely vital performance measurement tool within the
construction industry
Due to size of construction industry productivity trends carry immense consequences for the economy as a whole
Productivity growth is important to an individual enterprise, an industry or an economy
Construction industry accounts for 3 – 8% of the GDP in most countries

Why is Productivity Important? Productivity improvement in construction industry may
have a significant impact on improving GDP
Productivity growth is the key determinant of international competitiveness in the long term
Improving relative productivity growth improves a country’s competitive position
The construction industry – most challenging and demanding still many opportunities for productivity improvement

Factors Affecting Construction Labour Productivity Project uniqueness
Technology
Management
Labour organization
Real wage trends
Construction training

Factors having adverse effect on productivity Overtime and or Fatigue Errors and omissions in plans and specifications Multitude of change orders Design complexity and Design completeness Stacking of trades Dilution of supervision High accident rate Jurisdictional disputes Work rules and restrictive work practices Availability of skilled labour Reassignment of manpower from task to task Material location – above ground level/above floor level Adverse temperature or weather Inadequate lighting

Regulations of various types High absenteeism High turnover Material shortages Ground water level Attitude of the workforce Crew size and composition Economic conditions & level of unemployment Size and duration of the project Timeliness of decisions Impractical QA / QC tolerances Uncontrolled breaks Time of the day & day of the week Inadequate temporary facilities: parking, change / rest rooms etc

Quality and Productivity Folklore True Relationship Outmoded relationship Modern view of Relationship
QualityQuantity
Quality
Quantity
Improvement of Process – TQM
Leads to greater uniformity of product
Reduces mistakes and rework
Reduces waste of manpower, machine,time and materals
Increases output with lowered cost
Other Benefits
Better competitive position
Happier people on the job
More jobs
Improved morale

Quality and Productivity Deming’s Quality Chain Reaction
Quality
Customer Satisfaction
Market Share
Productivity
Prices
Costs
Profits
Improve Quality Costs decrease because of less rework, fewer mistakes, delays, snags, better use of machine, time and materials
Productivity improves

Productivity and Safety Worldwide – construction industry produces more injuries than other
industries
Construction industry – often criticized for poor performance (low productivity, waste, health and safety problems)
Strongest relations exist between work organizational factors, working conditions & health & absenteeism
Research shows that occupational safety and health improved (less health complaints and less accidents) when working conditions and work organization ameliorated
Improving safety improves productivity

Methods of Improving ProductivityThe following factors can lead to the improvement in productivity: Training programs for labour Incentives in contract for good performance Enough tools in working place and proper planning Optimizing site facilities Availability of resources Competition between crews, areas or shifts Good supervision and optimum manpower Short interval scheduling Innovative materials and equipment Time lapse film analysis for critical activities Cost reporting and work sampling of critical activities
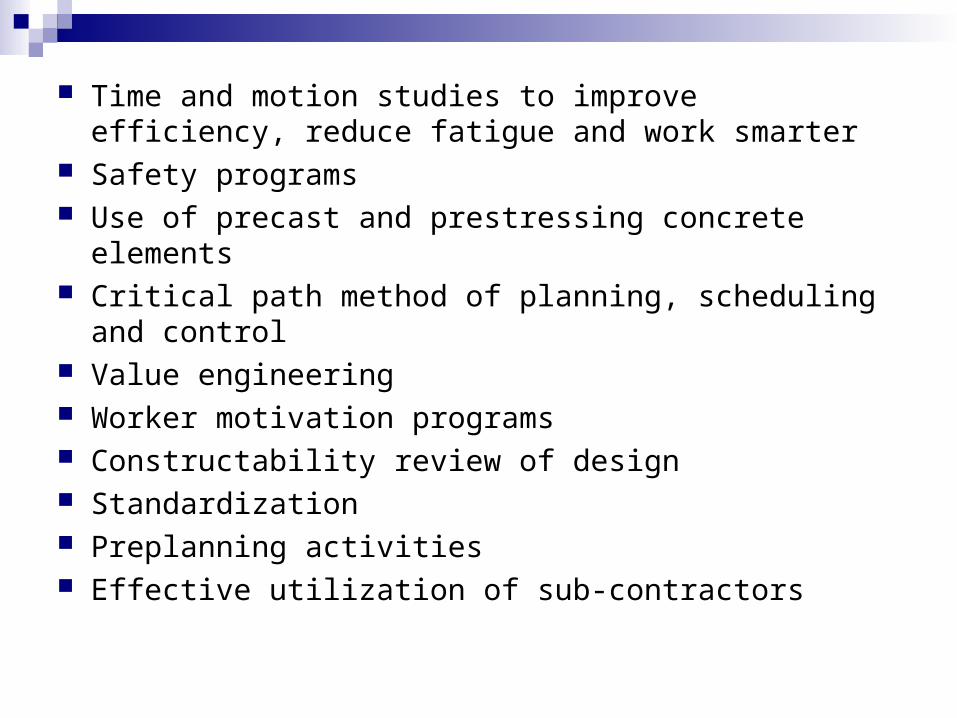
Time and motion studies to improve efficiency, reduce fatigue and work smarter
Safety programs Use of precast and prestressing concrete elements Critical path method of planning, scheduling and control Value engineering Worker motivation programs Constructability review of design Standardization Preplanning activities Effective utilization of sub-contractors

Productivity CalculationInputs OutputWork hours Value of work (Rs)
Quantities
Equipment
Rupees
Materials
Energy
Capital
Conversion Factor

Models of Productivity Economic Model
TFP = Total Value of Output / Total Value of Input
= Output (Rs) / Input (Rs)
Where TFP is the total factor productivity and
Input = Labour + Material + Equipment + Energy + Capital
Project Specific Model (Construction)
Productivity = Output (Activity unit) / Input (Rs) = Sq. mts / Rupees

Activity Oriented Model Measured in terms of Labour Productivity Can be measured in two ways: a) Output / Input or b) Input / Output Input can be in terms of Cost or Man hours and
Output can be in terms of Unit of work performed Generally the second model i.e. Input / Output is
used to measure the productivity but again the choice depends on the monitoring party

Input and output being the same the productivity comparison depends on the following factors Size of the Job Material Availability Schedule of Activities Connection or interlinking of activities Support operations Location
Therefore a comparison of productivity can only be made if the conditions are similar and also the activities are similar.

Major causes leading to poor productivity
Congestion Sequencing Lack of materials
A high variability in the unit productivity value is an indication of poor productivity and a low variability indicates good productivity

Productivity Benchmarking Benchmarking is a systematic process of searching for the best
practices, innovative ideas and highly effective operating procedures that lead to superior performance
Purpose of Benchmarking a) Analyze the operations to - Identify the critical cost components and areas for improvement - Reduction in the cycle time of activities
b) To get knowledge of the competition & industry leaders c) To incorporate the best of the best – learn & emulate the best d) To gain superiority over competitors

Types of Benchmarking Internal- Comparison among similar operations within
one’s own organization Competitive- This is comparison to the best of the direct
competitors Functional- Comparison of the methods with the companies
with similar processes in the same function outside one’s country

Types of Benchmarking
Generic
- Comparison of work processes to others who have innovative, exemplar work processes
Cooperative
- Contacting the best in class firms and asking them for knowledge sharing
Collaborative
- A group of firms sharing knowledge about a particular activity
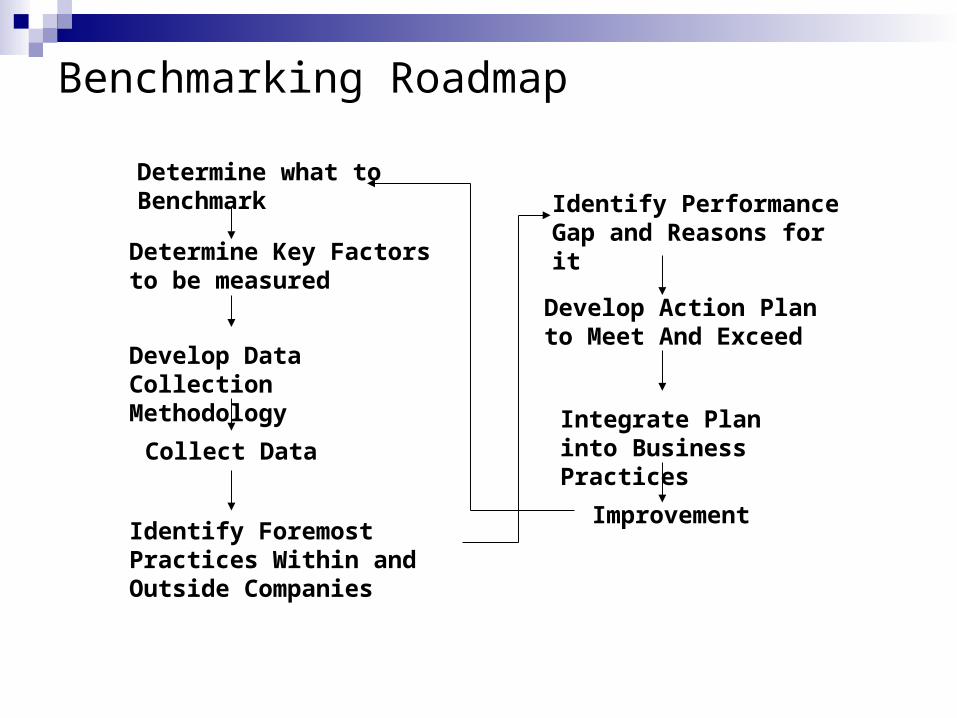
Benchmarking Roadmap
Determine what to Benchmark
Determine Key Factors to be measured
Develop Data Collection Methodology
Collect Data
Identify Foremost Practices Within and Outside Companies
Identify Performance Gap and Reasons for it
Develop Action Plan to Meet And Exceed
Integrate Plan into Business Practices
Improvement

Benchmarking Scope
Products and Services
Business Processes
Performance Measures

Performance Indicators Benchmarking is essentially for continuous
improvement of any organization
Parameter for benchmarking should be based on Key Performance Indicator (KPI)
There can be many KPI’s in the construction industry to measure the job performances
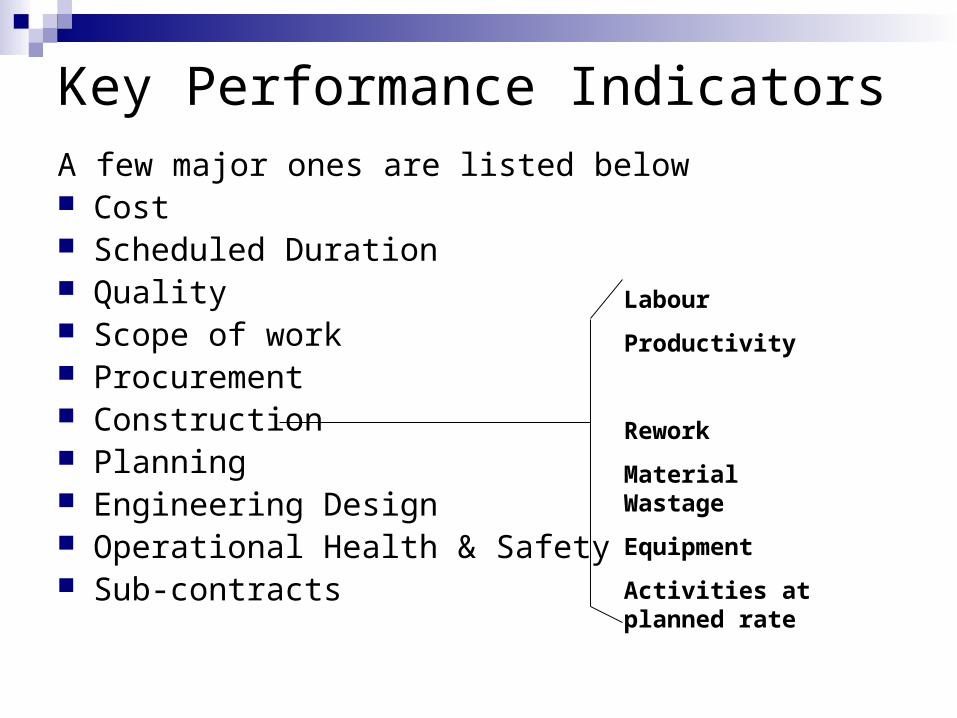
Key Performance IndicatorsA few major ones are listed below Cost Scheduled Duration Quality Scope of work Procurement Construction Planning Engineering Design Operational Health & Safety Sub-contracts
Labour
Productivity
Rework
Material Wastage
Equipment
Activities at planned rate

Labour Productivity Study
The study focused on evolving a framework for benchmarking Labour Productivity for building projects in India
Data were collected from 39 sites through questionnaire and from 12 buildings project through personal interviews
The sites were located in Mumbai, Bangalore, Chennai, Hyderabad and Delhi
Labour productivity for these activities is benchmarked by comparing productivity levels both within and among the regions
Observed productivity at national level is compared with the international levels

Benchmarking in Context of Construction Industry
Major portion of buildings project cost consists of the following activities
Concreting Formwork Masonry Reinforcements
Labour productivity can be benchmarked very well based on these four activities
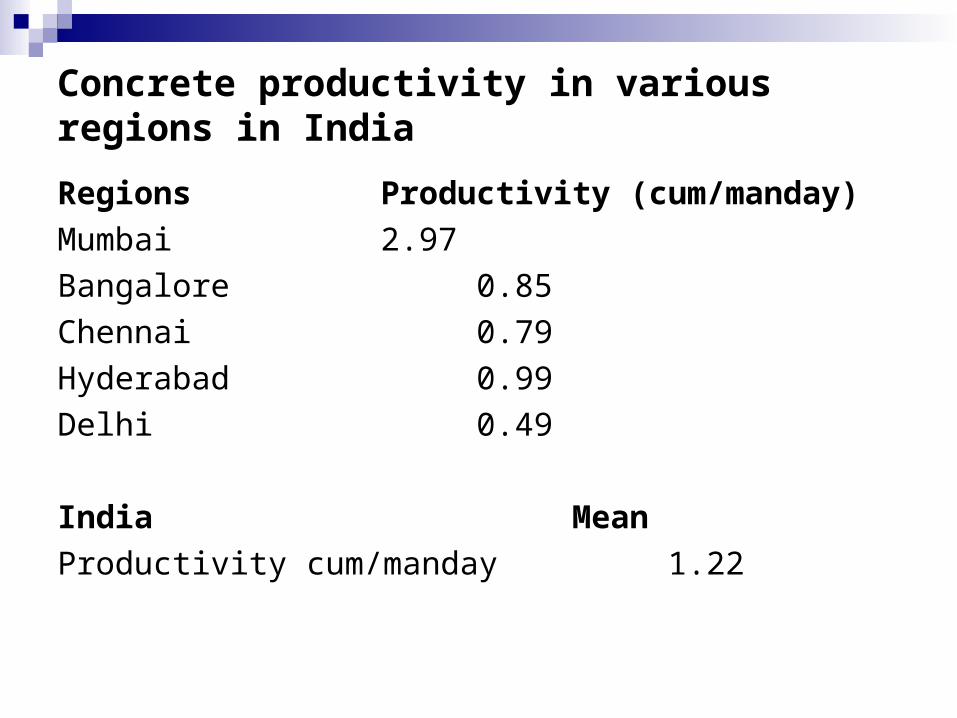
Concrete productivity in various regions in India
Regions Productivity (cum/manday)
Mumbai 2.97
Bangalore 0.85
Chennai 0.79
Hyderabad 0.99
Delhi 0.49
India Mean
Productivity cum/manday 1.22

Comparison of Concrete Productivity with International Standards
Country M’hr/cum cum/M’dayUS 1.00 8.02England 1.50 5.35China 3.69 2.17Netherlands 1.24 6.47Japan 1.29 6.22Korea 1.26 6.36Saudi Arabia 1.88 4.27Turkey 2.32 3.44India 2.69 2.97

Labour Productivity for Formwork Depends on factors like:
- Type of Formwork system used- Quantity of formwork used- Type of Structure- Shifting methods- Labour skills- Resource availability- Safety and other issues

Formwork productivity in various regions in IndiaRegions Productivity (Sqm/Manday)Mumbai 1.42Bangalore 1.90Chennai 2.19Hyderabad 1.65Delhi 1.10
India MeanProductivity Sqm/Manday 1.7

Formwork productivity in various countriesCountry M’hr/Sqm Sqm/M’day
US 0.82 9.79England 1.23 6.53China 3.02 2.65Netherlands 1.01 7.90Japan 1.05 7.59Korea 1.53 7.77Saudi Arabia 1.54 5.21Turkey 1.90 4.20India 4.71 1.70

Labour Productivity for Masonry
Depends on factors like- Size of Block- Method of shifting- Lead and shift- Labour skill- Type of Structure- Safety and other issues

Brick masonry productivity in various countriesCountry M’hr/cum cum/M’day
US 2.35 3.40
England 3.53 2.27
China 8.70 0.92
Netherlands 2.92 2.74
Japan 3.03 2.64
Korea 2.96 2.7
Saudi Arabia 4.42 1.81
Turkey 5.48 1.46
India 6.35 1.26

Labour Productivity for Reinforcement
• Depends on the factors like• Diameter of bar• Bar bending schedule• Quantity of reinforcement• Method of transport• Availability of bar bending and cutting machine• Skill of labour• Type of Structure• Safety

Reinforcement productivity in various regions in IndiaRegions Productivity (Kg / Man Day)
Mumbai 108
Bangalore 86
Chennai 82
Hyderabad 79
Delhi 56
India 90.5 (Mean)

Conclusions
Construction productivity levels in India are low compared to international levels
The reasons identified for low productivity included less degree of mechanization, conventional practices, lack or training and low focus on productivity by management
The data used in the study is from large companies executing large building projects. There is a need to study the productivity levels in other types of projects

Thank You


