
Webinar on the Total Market Approach for Condom Programming
W. Douglas Evans, Ph.D.
The George Washington University
21 June 2016
[email protected] @douge66
Condom Branding & The Total Market Approach in LMIC
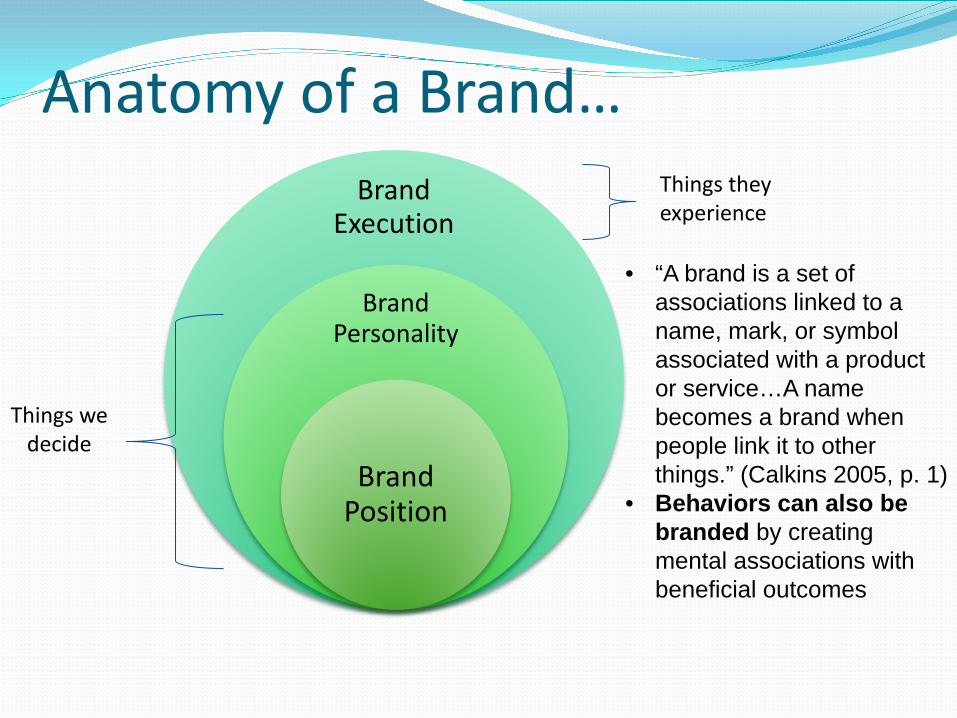
Anatomy of a Brand… Brand
Execution
Brand Personality
Brand Position
Things we decide
Things they experience
• “A brand is a set of associations linked to a name, mark, or symbol associated with a product or service…A name becomes a brand when people link it to other things.” (Calkins 2005, p. 1)
• Behaviors can also be branded by creating mental associations with beneficial outcomes
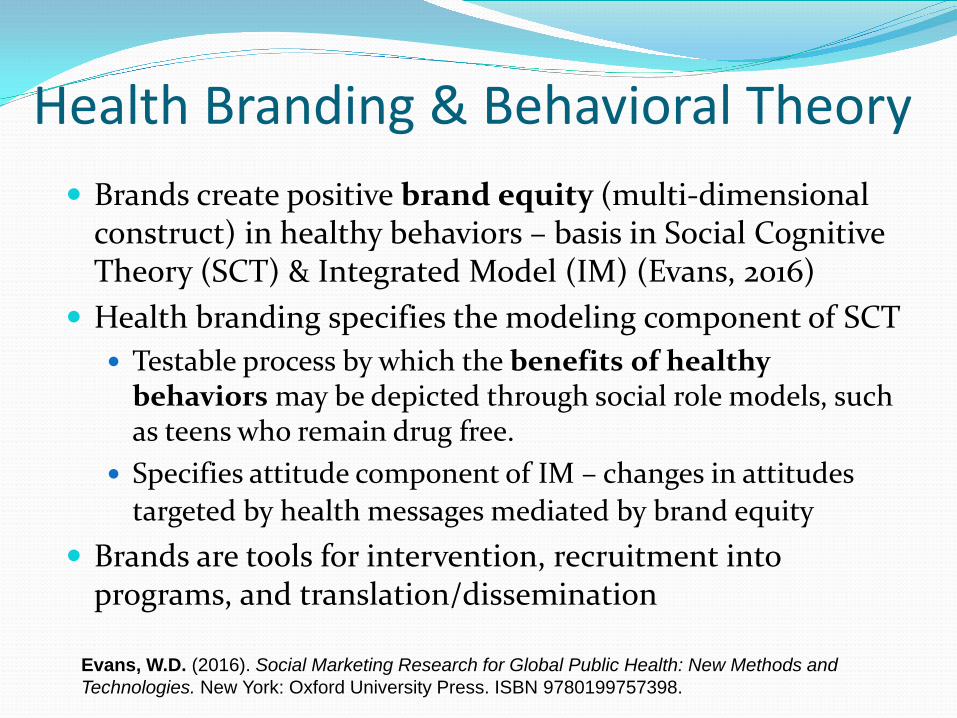
Health Branding & Behavioral Theory Brands create positive brand equity (multi-dimensional
construct) in healthy behaviors – basis in Social Cognitive Theory (SCT) & Integrated Model (IM) (Evans, 2016)
Health branding specifies the modeling component of SCT Testable process by which the benefits of healthy
behaviors may be depicted through social role models, such as teens who remain drug free.
Specifies attitude component of IM – changes in attitudes targeted by health messages mediated by brand equity
Brands are tools for intervention, recruitment into programs, and translation/dissemination
Evans, W.D. (2016). Social Marketing Research for Global Public Health: New Methods and Technologies. New York: Oxford University Press. ISBN 9780199757398.

Example Conceptual Model

Case Study 1 – Evaluation of PSI-Zimbabwe’s Protector Plus (P+) How can we use all 4 Ps of marketing to create socially
marketed condom brands that people want to ‘buy’? Recent study evaluated brand management and brand
equity in P+ (Evans et al., 2011) Zimbabwe increased socially marketed condom prices
in late 2009 – what effect did that have? Evaluate the effect of the price increase and whether
Zimbabweans willing to pay more for condoms. What is potential effect on TMA in Zimbabwe?
Evans, W.D., Taruberekera, N., Longfield, K., Snider, J. (2011). Brand Equity and Willingness to Pay for Condoms in Zimbabwe. BMC Reproductive Health, 8:29, DOI:10.1186/1742-4755-8-29.

Quantitative Study Design Brand Current users Lapsed users
Protector Plus 200 200
Free/Government sector 200 0
Non-users 0 200
• The study used a stratified sample to compare current P+ users to users of free/government provided condoms and lapsed users (those who have not used P+ condoms in past 3 months).

Willingness to Pay Higher Prices: Ordered Logistic Regression Sample Includes All Users
Protector Plus Free/Government
Brand Equity Scales
Odds Ratio p-value Odds Ratio p-value
Satisfaction/loyalty 2.17 <0.001 1.68 0.038
Perceived quality 0.84 0.434 1.88 0.042
Leadership/popularity 1.44 0.073 1.00 0.987
Perceived value 1.09 0.675 3.08 0.001
Brand personality 1.83 0.007 1.20 0.480
Market Barriers 1.70 <0.001 n/a
• Current P+ users are more willing to pay given higher brand loyalty,
personality associations and lower market barriers. Free condom users are willing to pay more given higher loyalty, quality, and value.
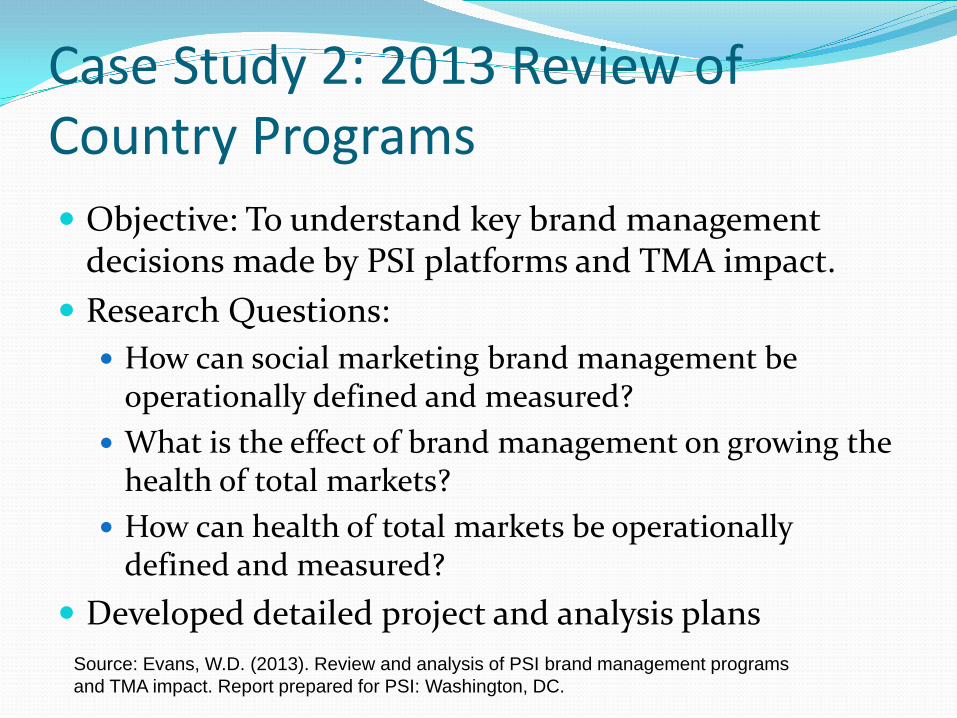
Case Study 2: 2013 Review of Country Programs Objective: To understand key brand management
decisions made by PSI platforms and TMA impact. Research Questions:
How can social marketing brand management be operationally defined and measured?
What is the effect of brand management on growing the health of total markets?
How can health of total markets be operationally defined and measured?
Developed detailed project and analysis plans
Source: Evans, W.D. (2013). Review and analysis of PSI brand management programs and TMA impact. Report prepared for PSI: Washington, DC.

Project Plan Retrospective analysis of brand management actions that
could affect the health of markets in a select set of countries in which PSI works Kenya, Madagascar, Mozambique, Nigeria, and Tanzania for
analysis based on comparability (platform, per capita GDP)
Use existing national-level data sets, DHS and/or other health of markets and account for co-variates over time
Account for variation in markets over time due to ‘external’ factors, such as changes in funding levels and media
Account for type, reach, frequency of brand management Develop composite measure of brand management

Mixed Methods Approach Coding scheme based on 20 brand management
actions (4-6 per category of 4 Ps) Each action weighted equally; used results in
quantitative coding of brand management Identification of comparable data points for
quantitative data (e.g., DHS in 2008 and 2011 with brand management actions quantified in between)
Regression analyses: DVs – Consistent condom use, condom use with CSW, condom use at last sex; IV – brand management factor score; Co-variates
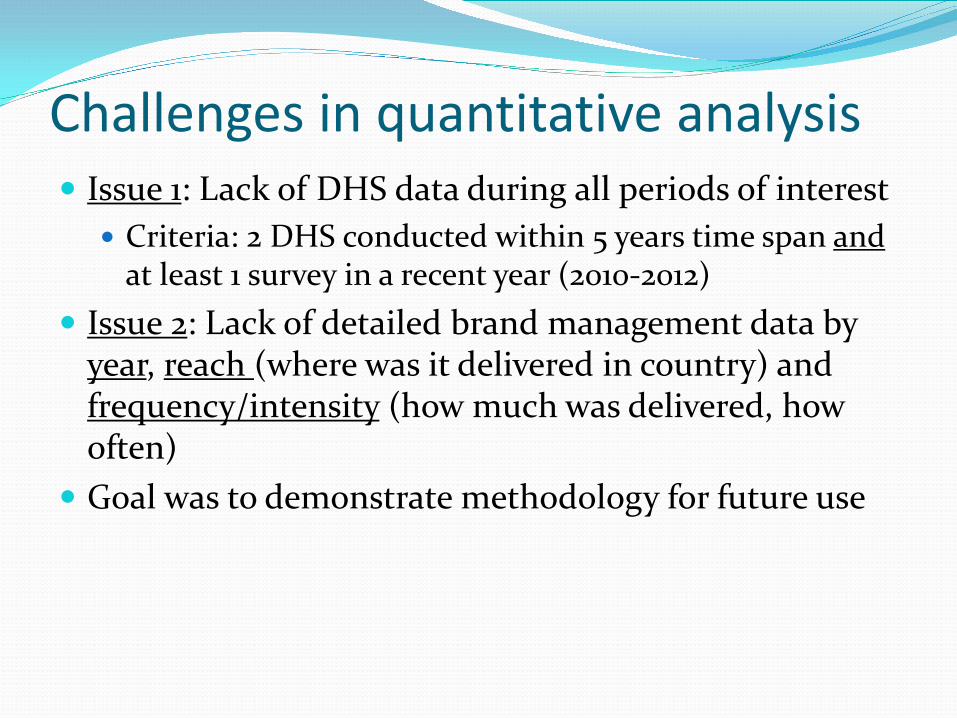
Challenges in quantitative analysis Issue 1: Lack of DHS data during all periods of interest
Criteria: 2 DHS conducted within 5 years time span and at least 1 survey in a recent year (2010-2012)
Issue 2: Lack of detailed brand management data by year, reach (where was it delivered in country) and frequency/intensity (how much was delivered, how often)
Goal was to demonstrate methodology for future use

Multivariable methods Multivariable logistic regression models examined condom
use at last sexual intercourse with regular partner, in each year, and then using a model combining both years of data, with the year of survey included as a indicator variable.
DV was male use of condom at last sexual intercourse with a regular partner, with predictors including a dichotomous indicator for any awareness of condom brand, and a variable representing imputed level of funding.
Adjusted for socio-demographic variables (age, education, marital status).
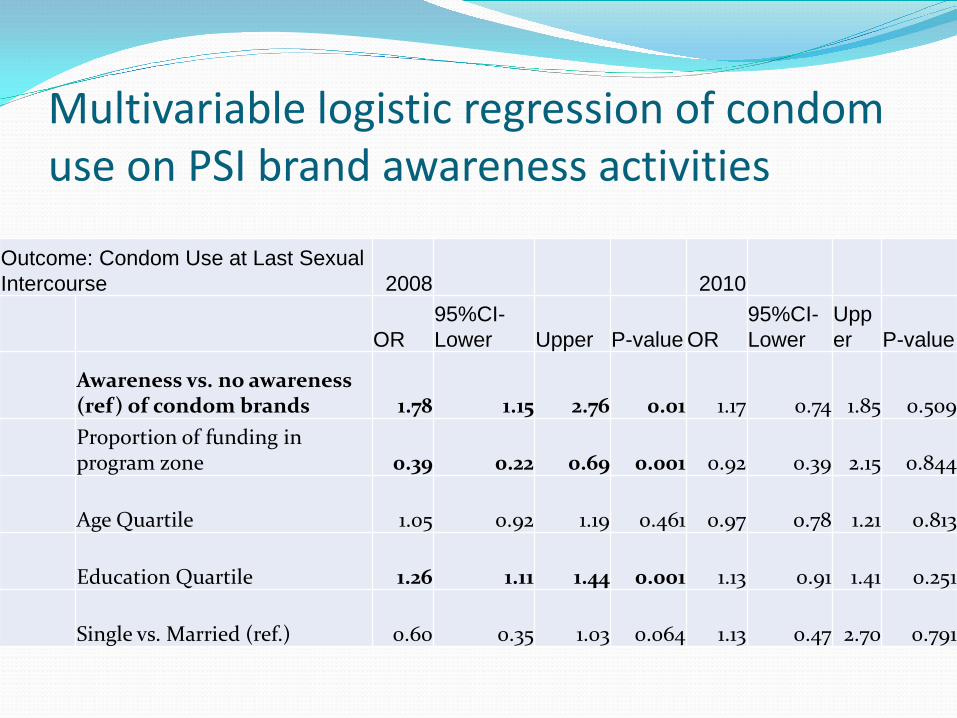
Multivariable logistic regression of condom use on PSI brand awareness activities
Outcome: Condom Use at Last Sexual Intercourse 2008 2010
OR 95%CI- Lower Upper P-value OR
95%CI- Lower
Upper P-value
Awareness vs. no awareness (ref) of condom brands 1.78 1.15 2.76 0.01 1.17 0.74 1.85 0.509 Proportion of funding in program zone 0.39 0.22 0.69 0.001 0.92 0.39 2.15 0.844
Age Quartile 1.05 0.92 1.19 0.461 0.97 0.78 1.21 0.813
Education Quartile 1.26 1.11 1.44 0.001 1.13 0.91 1.41 0.251
Single vs. Married (ref.) 0.60 0.35 1.03 0.064 1.13 0.47 2.70 0.791
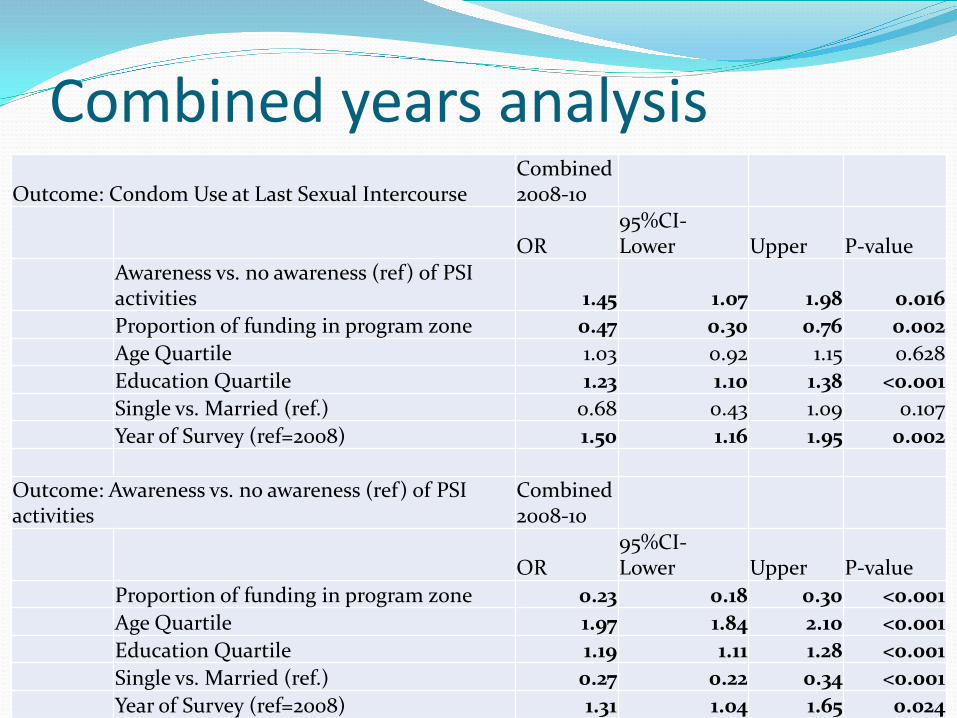
Combined years analysis Outcome: Condom Use at Last Sexual Intercourse
Combined 2008-10
OR 95%CI- Lower Upper P-value
Awareness vs. no awareness (ref) of PSI activities 1.45 1.07 1.98 0.016 Proportion of funding in program zone 0.47 0.30 0.76 0.002 Age Quartile 1.03 0.92 1.15 0.628 Education Quartile 1.23 1.10 1.38 <0.001 Single vs. Married (ref.) 0.68 0.43 1.09 0.107 Year of Survey (ref=2008) 1.50 1.16 1.95 0.002
Outcome: Awareness vs. no awareness (ref) of PSI activities
Combined 2008-10
OR 95%CI- Lower Upper P-value
Proportion of funding in program zone 0.23 0.18 0.30 <0.001 Age Quartile 1.97 1.84 2.10 <0.001 Education Quartile 1.19 1.11 1.28 <0.001 Single vs. Married (ref.) 0.27 0.22 0.34 <0.001 Year of Survey (ref=2008) 1.31 1.04 1.65 0.024

Discussion & Conclusions Qualitative results suggest that brands are being actively managed,
with most active management occurring in place and product domains Large fluctuations in promotion activities between countries and over
time within countries (dark periods) Opportunities to peg price to competition and to differentiate brand
lines based on price Demonstrated a methodology for evaluating brand management as a
variable in condom use behavior Preliminary results suggest importance of brand awareness in behavior
change with a TMA approach

Next Steps Need better data on brand management dosage: 1) reach,
frequency of activities; 2) costs/location of activities Without detailed data on dosage, difficult to determine
effects of brand management activities Need system for collecting brand management data on
routine basis (could be an easy to use online form) Recommendations:
Implement brand management measurement systems Use this methodology with data derived from new system Evaluate effects over a multi-year time period


![RH Condom Wrkshp Session10 en[1]](https://cdn.vdocuments.us/doc/165x107/577dab7f1a28ab223f8c8106/rh-condom-wrkshp-session10-en1.jpg)


