Condition & Use Survey of Listed
Buildings in Wales
2013 Update
An overview of the risk, condition and occupancy
profiles of the Listed Buildings of Wales at the end of
the 2013 survey cycle.
The Handley Partnership Consulting Civil & Structural Engineers
Historic Building Consultants
V2a
Introduction
Regular Buildings at Risk surveys have been carried out
across Wales for more than fifteen years. These surveys
give an invaluable view of the changing condition, use
and risk status of the stock of listed buildings of the
country.
In general, each local authority area is resurveyed every
five years. For some areas three complete inspection
programmes have now been completed and from the
data collected it is possible to quantify a number of key
indicators and to identify clear trends.
In addition to the basic condition and occupancy profile
for each building, information is also collected on the
condition and predominant materials of all main building
elements. The elemental condition data allows problem
areas to be identified and the likely rate of change to be
predicted, and the material type data gives a way to
measure the proportion of non-traditional building
materials within the listed building stock, together with
their geographic and building type distribution.
The regular reassessment of the buildings means that
there is a continuous updating of the data sample for the
country as a whole. However, due to the way in which
the reassessments have been programmed, the
estimates for the changes over time for some areas are a
little more current than for others. That said, during the
last year a significant proportion of reassessments have
been carried out1. This gives change data which is
representative for the country as a whole for most
building types and for most regions.
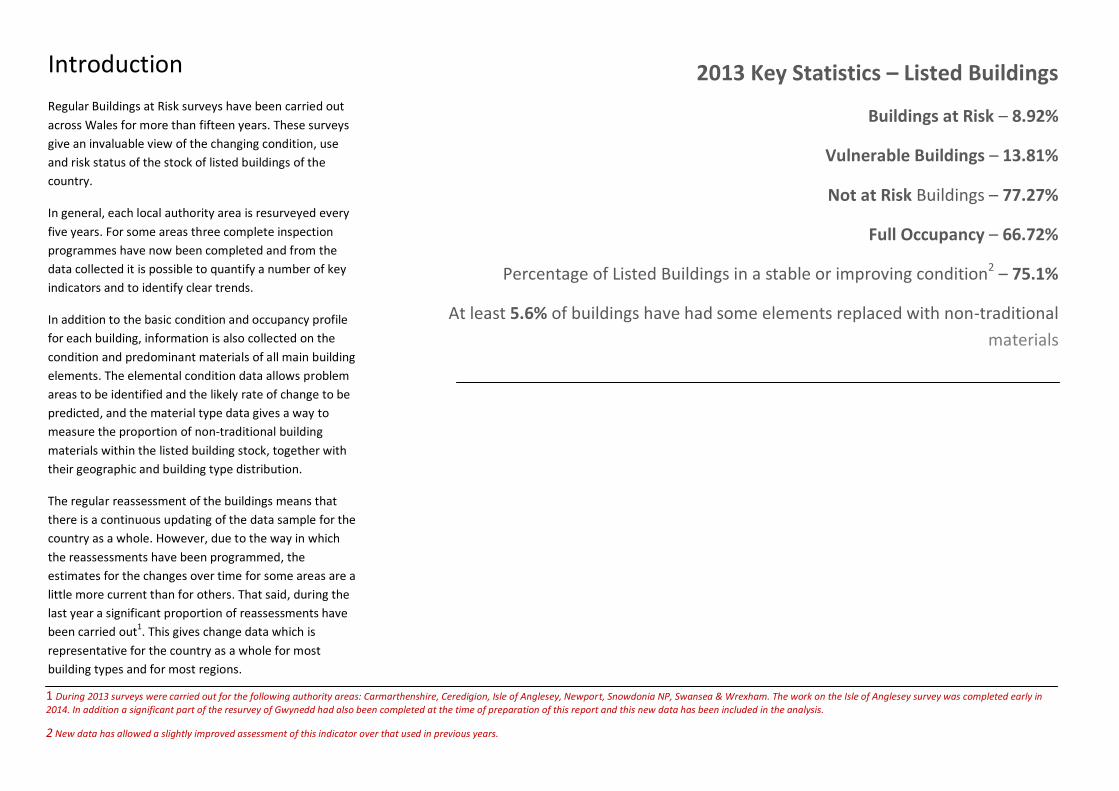
2013 Key Statistics – Listed Buildings
Buildings at Risk – 8.92%
Vulnerable Buildings – 13.81%
Not at Risk Buildings – 77.27%
Full Occupancy – 66.72%
Percentage of Listed Buildings in a stable or improving condition2 – 75.1%
At least 5.6% of buildings have had some elements replaced with non-traditional
materials
1 During 2013 surveys were carried out for the following authority areas: Carmarthenshire, Ceredigion, Isle of Anglesey, Newport, Snowdonia NP, Swansea & Wrexham. The work on the Isle of Anglesey survey was completed early in 2014. In addition a significant part of the resurvey of Gwynedd had also been completed at the time of preparation of this report and this new data has been included in the analysis.
2 New data has allowed a slightly improved assessment of this indicator over that used in previous years.
Overview
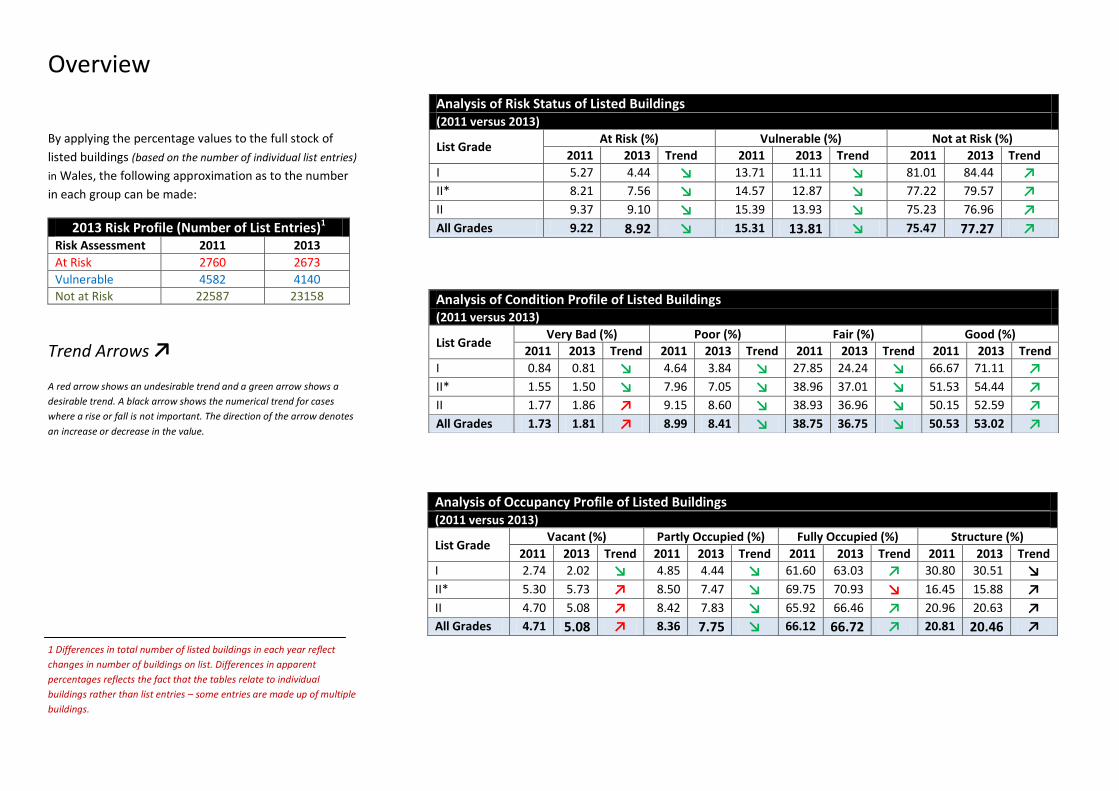
By applying the percentage values to the full stock of
listed buildings (based on the number of individual list entries)
in Wales, the following approximation as to the number
in each group can be made:
2013 Risk Profile (Number of List Entries)1 Risk Assessment 2011 2013
At Risk 2760 2673
Vulnerable 4582 4140
Not at Risk 22587 23158
Trend Arrows ↗
A red arrow shows an undesirable trend and a green arrow shows a
desirable trend. A black arrow shows the numerical trend for cases
where a rise or fall is not important. The direction of the arrow denotes
an increase or decrease in the value.
1 Differences in total number of listed buildings in each year reflect
changes in number of buildings on list. Differences in apparent
percentages reflects the fact that the tables relate to individual
buildings rather than list entries – some entries are made up of multiple
buildings.
Analysis of Condition Profile of Listed Buildings (2011 versus 2013)
List Grade Very Bad (%) Poor (%) Fair (%) Good (%)
2011 2013 Trend 2011 2013 Trend 2011 2013 Trend 2011 2013 Trend
I 0.84 0.81 ↘ 4.64 3.84 ↘ 27.85 24.24 ↘ 66.67 71.11 ↗ II* 1.55 1.50 ↘ 7.96 7.05 ↘ 38.96 37.01 ↘ 51.53 54.44 ↗ II 1.77 1.86 ↗ 9.15 8.60 ↘ 38.93 36.96 ↘ 50.15 52.59 ↗ All Grades 1.73 1.81 ↗ 8.99 8.41 ↘ 38.75 36.75 ↘ 50.53 53.02 ↗
Analysis of Occupancy Profile of Listed Buildings (2011 versus 2013)
List Grade Vacant (%) Partly Occupied (%) Fully Occupied (%) Structure (%)
2011 2013 Trend 2011 2013 Trend 2011 2013 Trend 2011 2013 Trend
I 2.74 2.02 ↘ 4.85 4.44 ↘ 61.60 63.03 ↗ 30.80 30.51 ↘ II* 5.30 5.73 ↗ 8.50 7.47 ↘ 69.75 70.93 ↘ 16.45 15.88 ↗ II 4.70 5.08 ↗ 8.42 7.83 ↘ 65.92 66.46 ↗ 20.96 20.63 ↗ All Grades 4.71 5.08 ↗ 8.36 7.75 ↘ 66.12 66.72 ↗ 20.81 20.46 ↗
Analysis of Risk Status of Listed Buildings (2011 versus 2013)
List Grade At Risk (%) Vulnerable (%) Not at Risk (%)
2011 2013 Trend 2011 2013 Trend 2011 2013 Trend
I 5.27 4.44 ↘ 13.71 11.11 ↘ 81.01 84.44 ↗ II* 8.21 7.56 ↘ 14.57 12.87 ↘ 77.22 79.57 ↗ II 9.37 9.10 ↘ 15.39 13.93 ↘ 75.23 76.96 ↗ All Grades 9.22 8.92 ↘ 15.31 13.81 ↘ 75.47 77.27 ↗

Risk status
There has been a continuing fall in the percentage of
buildings at risk between 2011 and 2013. Recent survey
works would tend to suggest that the rate of risk
reduction is starting to slow. The surveys carried out
during 2013 include areas for which no previous
compatible survey was available, and one for which the
previous survey was carried out over ten years ago. It
follows from this that it is a little difficult to fully assess
this slowdown. Further data will be gathered during the
current year, which will assist with this.
There has been a fall in the percentage of buildings of all
grades which are at risk. Changes in the smaller grade I
and grade II* building groups may be masked by the
effect of the new areas added to the data set. It appears
that the importance of buildings listed at grade II* may
not be being matched by action. Additionally, the types
of buildings that are listed at this grade often present
significant challenges for recovery once they have fallen
into disrepair or have become unoccupied. Early action
can therefore be far more cost-effective.
There has been a significant reduction in the percentage
of buildings which are in a vulnerable state. Whilst it
must be appreciated that it does not follow that
buildings always move between the ‘At Risk’ and ‘Not at
Risk’ categories via this group, there is evidence to
suggest that there has been some improvement to
buildings in this group. Part of the reduction is also
related to a slight change in the assessments applied to
bridges to take account of new data which tends to
support a number being moved from the ‘vulnerable’ to
the ‘not at risk’ classifications.
Whilst the overall movement in levels of risk and
vulnerability is positive, this trend is not repeated in all
building types and in all areas. More details on this
variation are set out in later sections.
Condition Profile
The overall building condition profile again shows a
generally positive trend. There is a slight rise in the
proportion of buildings considered to be in a 'very bad'
condition. Again, in part, this reflects the addition of new
areas to the dataset, but there does seem to be a slight
worsening in condition of some of the more problematic
buildings in the stock. This may be occurring as the
number of more easily recovered buildings in the stock
reduces over time.
Almost 90% of all buildings are in a ‘good’ or ‘fair’
condition. Despite the changes in the sample this
number appears to be broadly stable.
Occupancy Profile
The occupancy profile changes give some cause for
concern. These show that there has been an overall
increase in the percentage of buildings which are vacant.
There is also a reduction in the percentage which is
partly occupied. This may suggest that there has been a
total cessation of use in some buildings which did see at
least some use in the past.
Overall, this distribution suggests a complex picture, with
wide variations in the use profiles of different building
types and in different areas. New buildings have been
added to the sample since the previous review and this
may have a minor effect on the overall occupancy profile
statistics. It does not, however, change the overall
situation.
KEY INFORMATION
The proportion of Buildings at Risk has fallen
between 2011 and 2013 from 9.22% to 8.92%.
The proportion of buildings in a ‘good’ condition
has increased between 2011 and 2013 from
50.53% to 53.02%.
The proportion of vacant buildings has increased
slightly between 2011 and 2013, but the
proportion of buildings which are fully occupied
has also increased slightly. New additions to the
sample may have affected this. Vacancy levels in
listed public houses are increasing in some areas
and use of telephone call boxes is, in general,
very low.
Grade II* buildings need to receive more
attention than at the present time.
The rate of reduction in risk and vulnerability
appears to have slowed in recent times.
Defects & Rate of Change
Changes over time are assessed in two ways: Firstly, the
actual change in the various profiles can be calculated by
analysis of the results for each of the comparable
periodic surveys. Secondly, by looking at the profiles of
defects and levels of use in each building, an assessment
as to the potential future rate of change can be made.
The two methods of assessment can often give
apparently differing outputs, but it must be kept in mind
that, in the first case, the actual change is being
measured and, in the second, the likelihood of future
change is being predicted.
Buildings which are at risk or which are in a vulnerable
state can often give few clues to the full extent of their
fragility. Generally, a building does not collapse or decay
rapidly without the imposition of some external factor
such as extreme weather, impact damage or a localised
item failure. The way in which the HAA1 analysis part of
the Buildings at Risk survey is assessed seeks to point out
the relative level of fragility of buildings and, hence, to
give an estimate of the likely potential rate of decay
when the building is subject to external detrimental
factors.
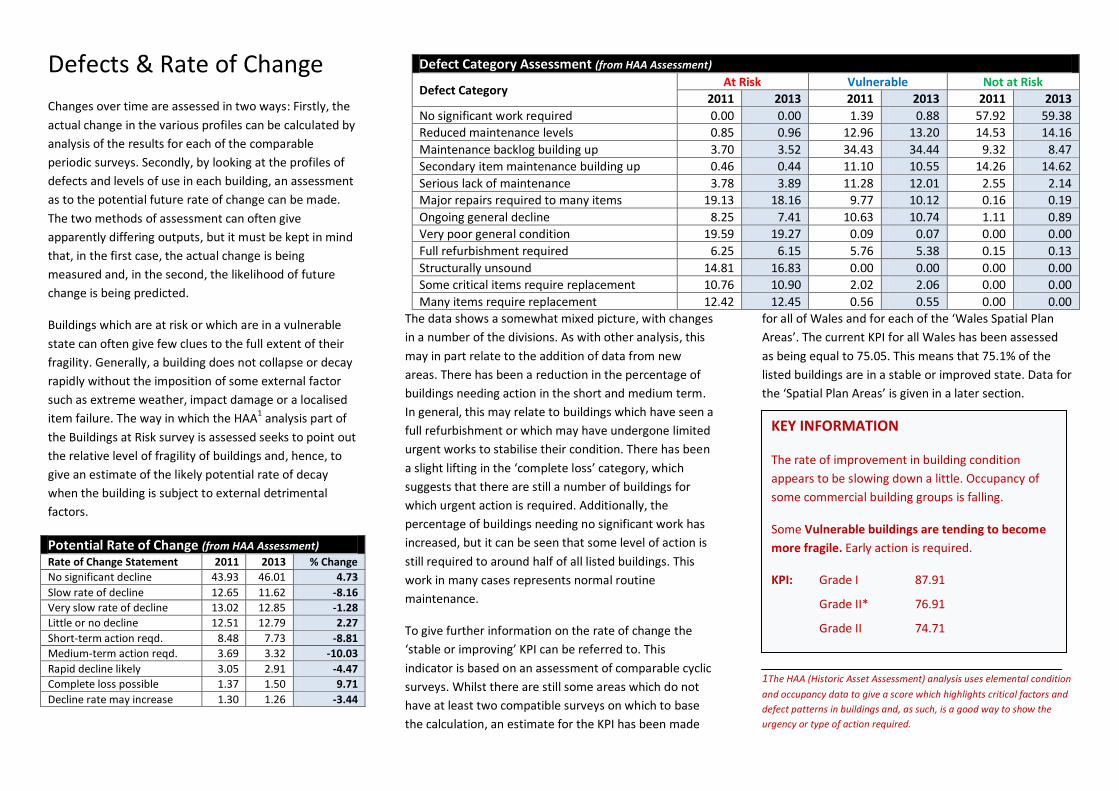
Potential Rate of Change (from HAA Assessment) Rate of Change Statement 2011 2013 % Change
No significant decline 43.93 46.01 4.73
Slow rate of decline 12.65 11.62 -8.16
Very slow rate of decline 13.02 12.85 -1.28
Little or no decline 12.51 12.79 2.27
Short-term action reqd. 8.48 7.73 -8.81
Medium-term action reqd. 3.69 3.32 -10.03
Rapid decline likely 3.05 2.91 -4.47
Complete loss possible 1.37 1.50 9.71
Decline rate may increase 1.30 1.26 -3.44
The data shows a somewhat mixed picture, with changes
in a number of the divisions. As with other analysis, this
may in part relate to the addition of data from new
areas. There has been a reduction in the percentage of
buildings needing action in the short and medium term.
In general, this may relate to buildings which have seen a
full refurbishment or which may have undergone limited
urgent works to stabilise their condition. There has been
a slight lifting in the ‘complete loss’ category, which
suggests that there are still a number of buildings for
which urgent action is required. Additionally, the
percentage of buildings needing no significant work has
increased, but it can be seen that some level of action is
still required to around half of all listed buildings. This
work in many cases represents normal routine
maintenance.
To give further information on the rate of change the
‘stable or improving’ KPI can be referred to. This
indicator is based on an assessment of comparable cyclic
surveys. Whilst there are still some areas which do not
have at least two compatible surveys on which to base
the calculation, an estimate for the KPI has been made
for all of Wales and for each of the ‘Wales Spatial Plan
Areas’. The current KPI for all Wales has been assessed
as being equal to 75.05. This means that 75.1% of the
listed buildings are in a stable or improved state. Data for
the ‘Spatial Plan Areas’ is given in a later section.
1The HAA (Historic Asset Assessment) analysis uses elemental condition
and occupancy data to give a score which highlights critical factors and
defect patterns in buildings and, as such, is a good way to show the
urgency or type of action required.
Defect Category Assessment (from HAA Assessment)
Defect Category At Risk Vulnerable Not at Risk
2011 2013 2011 2013 2011 2013
No significant work required 0.00 0.00 1.39 0.88 57.92 59.38
Reduced maintenance levels 0.85 0.96 12.96 13.20 14.53 14.16
Maintenance backlog building up 3.70 3.52 34.43 34.44 9.32 8.47
Secondary item maintenance building up 0.46 0.44 11.10 10.55 14.26 14.62
Serious lack of maintenance 3.78 3.89 11.28 12.01 2.55 2.14
Major repairs required to many items 19.13 18.16 9.77 10.12 0.16 0.19
Ongoing general decline 8.25 7.41 10.63 10.74 1.11 0.89
Very poor general condition 19.59 19.27 0.09 0.07 0.00 0.00
Full refurbishment required 6.25 6.15 5.76 5.38 0.15 0.13
Structurally unsound 14.81 16.83 0.00 0.00 0.00 0.00
Some critical items require replacement 10.76 10.90 2.02 2.06 0.00 0.00
Many items require replacement 12.42 12.45 0.56 0.55 0.00 0.00
KEY INFORMATION
The rate of improvement in building condition
appears to be slowing down a little. Occupancy of
some commercial building groups is falling.
Some Vulnerable buildings are tending to become
more fragile. Early action is required.
KPI: Grade I 87.91
Grade II* 76.91
Grade II 74.71
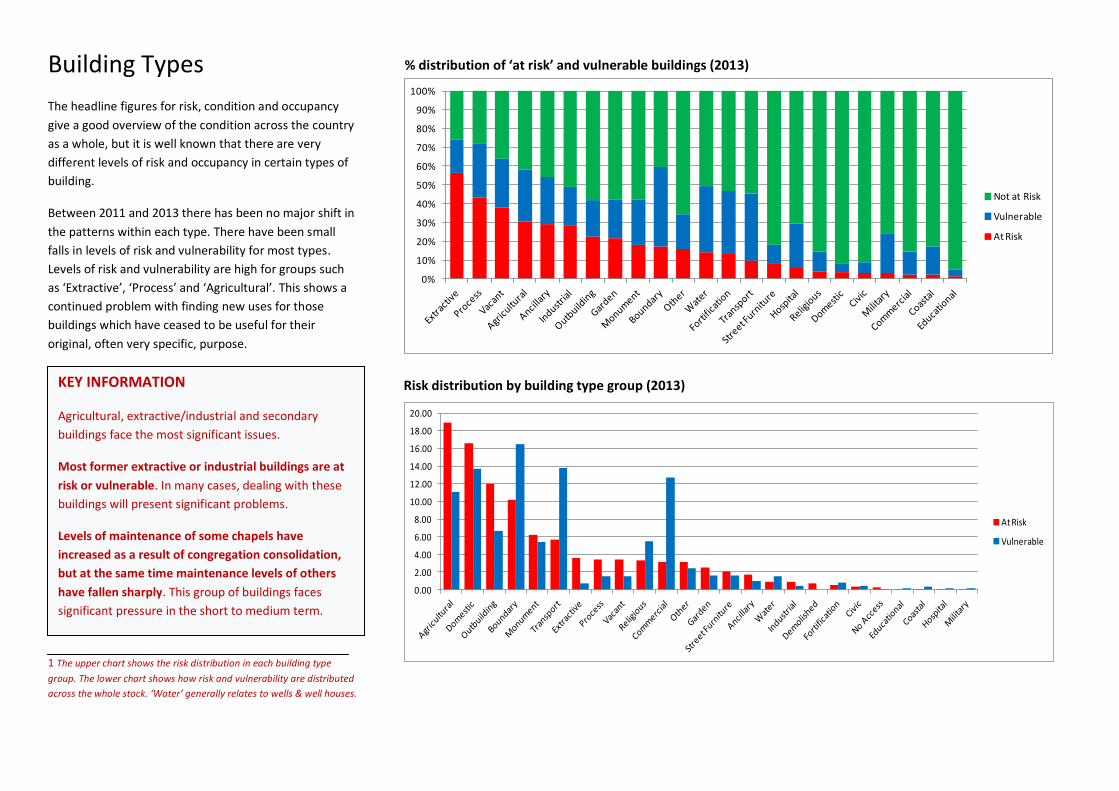
Building Types
The headline figures for risk, condition and occupancy
give a good overview of the condition across the country
as a whole, but it is well known that there are very
different levels of risk and occupancy in certain types of
building.
Between 2011 and 2013 there has been no major shift in
the patterns within each type. There have been small
falls in levels of risk and vulnerability for most types.
Levels of risk and vulnerability are high for groups such
as ‘Extractive’, ‘Process’ and ‘Agricultural’. This shows a
continued problem with finding new uses for those
buildings which have ceased to be useful for their
original, often very specific, purpose.
1 The upper chart shows the risk distribution in each building type
group. The lower chart shows how risk and vulnerability are distributed
across the whole stock. ‘Water’ generally relates to wells & well houses.
Risk distribution by building type group (2013)
% distribution of ‘at risk’ and vulnerable buildings (2013)
KEY INFORMATION
Agricultural, extractive/industrial and secondary
buildings face the most significant issues.
Most former extractive or industrial buildings are at
risk or vulnerable. In many cases, dealing with these
buildings will present significant problems.
Levels of maintenance of some chapels have
increased as a result of congregation consolidation,
but at the same time maintenance levels of others
have fallen sharply. This group of buildings faces
significant pressure in the short to medium term.
Boundary structures such as walls and gates are often
neglected leading to high levels of vulnerability.
0%
10%
20%
30%
40%
50%
60%
70%
80%
90%
100%
Not at Risk
Vulnerable
At Risk
0.00
2.00
4.00
6.00
8.00
10.00
12.00
14.00
16.00
18.00
20.00
At Risk
Vulnerable
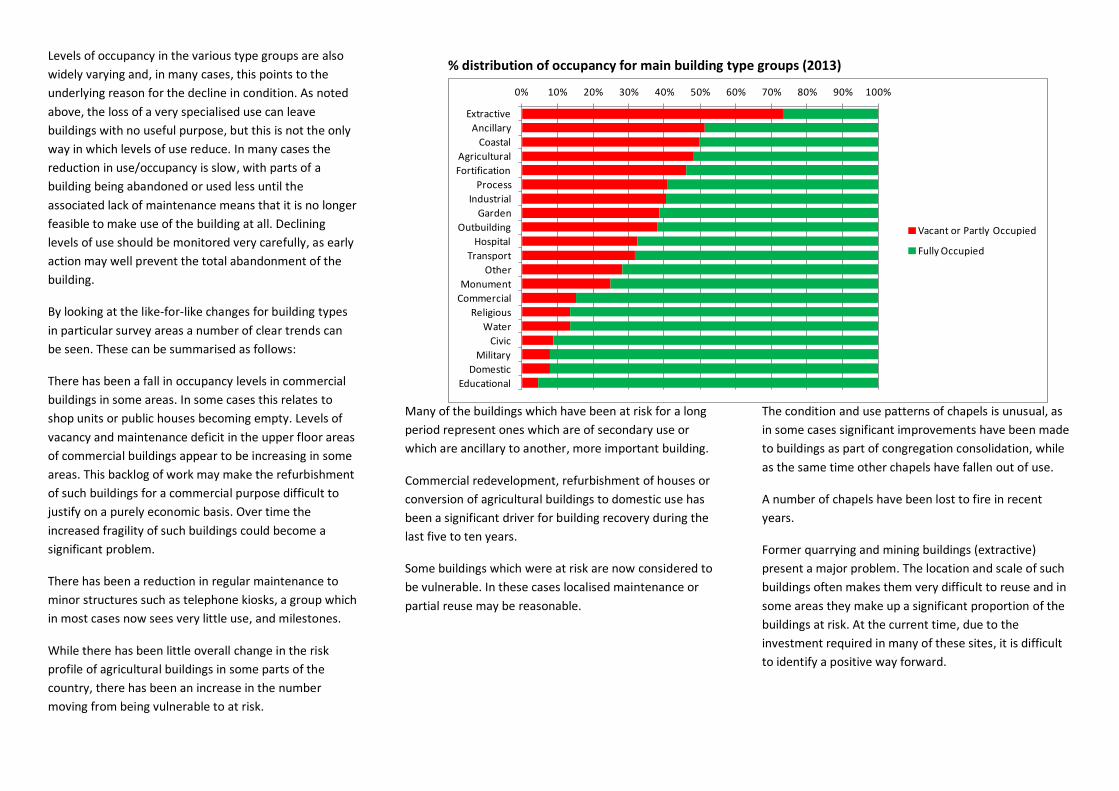
Levels of occupancy in the various type groups are also
widely varying and, in many cases, this points to the
underlying reason for the decline in condition. As noted
above, the loss of a very specialised use can leave
buildings with no useful purpose, but this is not the only
way in which levels of use reduce. In many cases the
reduction in use/occupancy is slow, with parts of a
building being abandoned or used less until the
associated lack of maintenance means that it is no longer
feasible to make use of the building at all. Declining
levels of use should be monitored very carefully, as early
action may well prevent the total abandonment of the
building.
By looking at the like-for-like changes for building types
in particular survey areas a number of clear trends can
be seen. These can be summarised as follows:
There has been a fall in occupancy levels in commercial
buildings in some areas. In some cases this relates to
shop units or public houses becoming empty. Levels of
vacancy and maintenance deficit in the upper floor areas
of commercial buildings appear to be increasing in some
areas. This backlog of work may make the refurbishment
of such buildings for a commercial purpose difficult to
justify on a purely economic basis. Over time the
increased fragility of such buildings could become a
significant problem.
There has been a reduction in regular maintenance to
minor structures such as telephone kiosks, a group which
in most cases now sees very little use, and milestones.
While there has been little overall change in the risk
profile of agricultural buildings in some parts of the
country, there has been an increase in the number
moving from being vulnerable to at risk.
Many of the buildings which have been at risk for a long
period represent ones which are of secondary use or
which are ancillary to another, more important building.
Commercial redevelopment, refurbishment of houses or
conversion of agricultural buildings to domestic use has
been a significant driver for building recovery during the
last five to ten years.
Some buildings which were at risk are now considered to
be vulnerable. In these cases localised maintenance or
partial reuse may be reasonable.
The condition and use patterns of chapels is unusual, as
in some cases significant improvements have been made
to buildings as part of congregation consolidation, while
as the same time other chapels have fallen out of use.
A number of chapels have been lost to fire in recent
years.
Former quarrying and mining buildings (extractive)
present a major problem. The location and scale of such
buildings often makes them very difficult to reuse and in
some areas they make up a significant proportion of the
buildings at risk. At the current time, due to the
investment required in many of these sites, it is difficult
to identify a positive way forward.
% distribution of occupancy for main building type groups (2013)
0% 10% 20% 30% 40% 50% 60% 70% 80% 90% 100%
Extractive
Ancillary
Coastal
Agricultural
Fortification
Process
Industrial
Garden
Outbuilding
Hospital
Transport
Other
Monument
Commercial
Religious
Water
Civic
Military
Domestic
Educational
Vacant or Partly Occupied
Fully Occupied
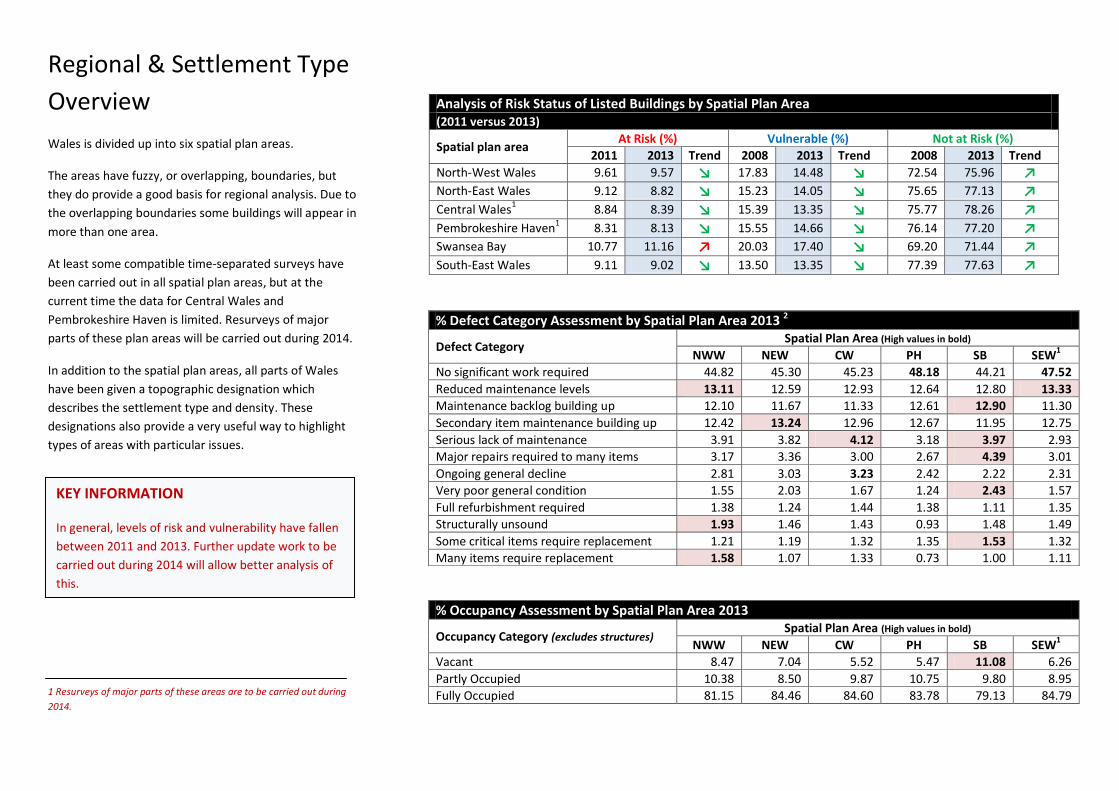
Regional & Settlement Type
Overview
Wales is divided up into six spatial plan areas.
The areas have fuzzy, or overlapping, boundaries, but
they do provide a good basis for regional analysis. Due to
the overlapping boundaries some buildings will appear in
more than one area.
At least some compatible time-separated surveys have
been carried out in all spatial plan areas, but at the
current time the data for Central Wales and
Pembrokeshire Haven is limited. Resurveys of major
parts of these plan areas will be carried out during 2014.
In addition to the spatial plan areas, all parts of Wales
have been given a topographic designation which
describes the settlement type and density. These
designations also provide a very useful way to highlight
types of areas with particular issues.
1 Resurveys of major parts of these areas are to be carried out during
2014.
Analysis of Risk Status of Listed Buildings by Spatial Plan Area (2011 versus 2013)
Spatial plan area At Risk (%) Vulnerable (%) Not at Risk (%)
2011 2013 Trend 2008 2013 Trend 2008 2013 Trend
North-West Wales 9.61 9.57 ↘ 17.83 14.48 ↘ 72.54 75.96 ↗ North-East Wales 9.12 8.82 ↘ 15.23 14.05 ↘ 75.65 77.13 ↗ Central Wales1 8.84 8.39 ↘ 15.39 13.35 ↘ 75.77 78.26 ↗ Pembrokeshire Haven1 8.31 8.13 ↘ 15.55 14.66 ↘ 76.14 77.20 ↗ Swansea Bay 10.77 11.16 ↗ 20.03 17.40 ↘ 69.20 71.44 ↗ South-East Wales 9.11 9.02 ↘ 13.50 13.35 ↘ 77.39 77.63 ↗
% Defect Category Assessment by Spatial Plan Area 2013 2
Defect Category Spatial Plan Area (High values in bold)
NWW NEW CW PH SB SEW1
No significant work required 44.82 45.30 45.23 48.18 44.21 47.52
Reduced maintenance levels 13.11 12.59 12.93 12.64 12.80 13.33
Maintenance backlog building up 12.10 11.67 11.33 12.61 12.90 11.30
Secondary item maintenance building up 12.42 13.24 12.96 12.67 11.95 12.75
Serious lack of maintenance 3.91 3.82 4.12 3.18 3.97 2.93
Major repairs required to many items 3.17 3.36 3.00 2.67 4.39 3.01
Ongoing general decline 2.81 3.03 3.23 2.42 2.22 2.31
Very poor general condition 1.55 2.03 1.67 1.24 2.43 1.57
Full refurbishment required 1.38 1.24 1.44 1.38 1.11 1.35
Structurally unsound 1.93 1.46 1.43 0.93 1.48 1.49
Some critical items require replacement 1.21 1.19 1.32 1.35 1.53 1.32
Many items require replacement 1.58 1.07 1.33 0.73 1.00 1.11
% Occupancy Assessment by Spatial Plan Area 2013
Occupancy Category (excludes structures) Spatial Plan Area (High values in bold)
NWW NEW CW PH SB SEW1
Vacant 8.47 7.04 5.52 5.47 11.08 6.26
Partly Occupied 10.38 8.50 9.87 10.75 9.80 8.95
Fully Occupied 81.15 84.46 84.60 83.78 79.13 84.79
KEY INFORMATION
In general, levels of risk and vulnerability have fallen
between 2011 and 2013. Further update work to be
carried out during 2014 will allow better analysis of
this.

In general, levels of risk and vulnerability have fallen in
the spatial plan areas, the one area which varies from
this being Swansea Bay.
The defect analysis would suggest that there is a wide
range of issues at play in this area - from a number of
buildings which have long-standing issues to a general
reduction in maintenance levels.
Pembrokeshire Haven and Central Wales have the lowest
levels of risk. As noted previously, update surveys are to
be carried out during 2014. This will give a better
understanding of the reason for the low level.
The KPI assessment (for areas with up-to-date data) shows
broad consistency. The figure for the Swansea Bay area
does give some cause for concern and further detailed
analysis of this area is required. Initial analysis suggests
that the Swansea City Council area KPI is significantly
higher than that for the area as a whole. It follows from
this that other parts of the area have a lower KPI.
There are very clear differences in the risk profiles for
the topographic designations. Generally, it can be said
that the more ‘rural’ in nature a building is, the higher
the likelihood that it will be at risk or vulnerable. That
said, there are clear issues developing in the most
densely populated areas. This needs to be monitored in
the future. Notwithstanding this, the assessment shows
that rural buildings are under most pressure at the
current time. This ties in with the distribution of building
types in such areas and the change in use of many of the
rural buildings.
It can also be seen that there are significant differences
across the more urban groups. These differences give a
good insight into the types of areas suffering from
decline.
1 This table shows the % risk distribution for each topographic group.
2 This table shows how the overall number of buildings in each risk
category is distributed by topographic groups – hence it is an indication
of the magnitude of the problem in each group.
3 A significant part of this area is due to be resurveyed in 2014.
4 Very little of this area has compatible time-change survey data at the
present time. This figure is therefore based on a very small sample and
should not be treated with caution. A significant part of the area will be
resurveyed during 2014.
Distribution of Risk Status by Topography Designation 20112
Topography Designation Risk Distribution for Topography Type Risk Distribution for Topo. Group
At Risk Vulnerable Not at Risk At Risk Vulnerable Not at Risk
Urban > 10000 population – Less Sparse 17.70 20.31 20.62 19.19 22.55 23.95
Urban > 10000 population – Sparse 1.48 2.25 3.32
Town & Fringe – Less Sparse 10.41 13.08 15.34 17.30 21.62 31.32
Town & Fringe – Sparse 6.89 8.54 15.98
Village, Hamlet & Isolated – Less Sparse 26.85 22.82 17.53 63.52 55.82 44.74
Village, Hamlet & Isolated – Sparse 36.67 33.01 27.21
Analysis of Risk Status by Topography Designation 20131
Topography Designation Risk Profile for Topography Type % Difference from All Wales Value
At Risk Vulnerable Not at Risk At Risk Vulnerable Not at Risk
Urban > 10000 population – Less Sparse 7.77 13.80 78.43 -12.88 -0.05 1.50
Urban > 10000 population – Sparse 4.39 10.32 85.29 -50.78 -25.28 10.38
Town & Fringe – Less Sparse 6.36 12.38 81.25 -28.68 -10.33 5.16
Town & Fringe – Sparse 4.35 8.34 87.31 -51.28 -39.60 13.00
Village, Hamlet & Isolated – Less Sparse 12.55 16.51 70.95 40.64 19.54 -8.18
Village, Hamlet & Isolated – Sparse 11.34 15.80 72.86 27.07 14.41 -5.70
Distribution of Risk Status by Topography Designation 20132
Topography Designation Risk Distribution for Topography Type Risk Distribution for Topo. Group
At Risk Vulnerable Not at Risk At Risk Vulnerable Not at Risk
Urban > 10000 population – Less Sparse 17.70 20.31 20.62 19.19 22.55 23.95
Urban > 10000 population – Sparse 1.48 2.25 3.32
Town & Fringe – Less Sparse 10.41 13.08 15.34 17.30 21.62 31.32
Town & Fringe – Sparse 6.89 8.54 15.98
Village, Hamlet & Isolated – Less Sparse 26.85 22.82 17.53 63.52 55.82 44.74
Village, Hamlet & Isolated – Sparse 36.67 33.01 27.21
KPI Assessment Spatial Plan Area KPI
North-West Wales 73.58
North-East Wales 75.21
Central Wales3 75.58
Pembrokeshire Haven4 65.15
Swansea Bay 70.63
South East Wales 75.33
KEY INFORMATION
Rural buildings are more likely to be at risk or
vulnerable than ones in more urban locations.
There are significant variations within each of the
spatial plan areas.
Levels of building vacancy in the Swansea Bay area
are relatively high.
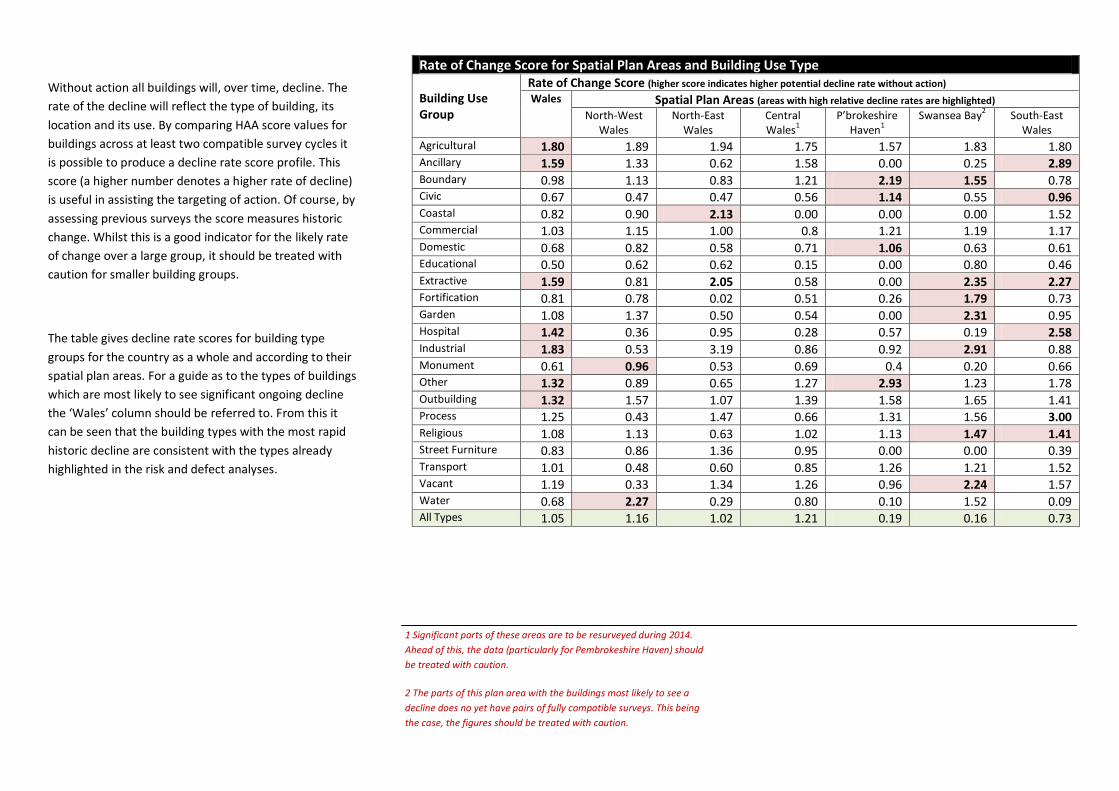
Without action all buildings will, over time, decline. The
rate of the decline will reflect the type of building, its
location and its use. By comparing HAA score values for
buildings across at least two compatible survey cycles it
is possible to produce a decline rate score profile. This
score (a higher number denotes a higher rate of decline)
is useful in assisting the targeting of action. Of course, by
assessing previous surveys the score measures historic
change. Whilst this is a good indicator for the likely rate
of change over a large group, it should be treated with
caution for smaller building groups.
The table gives decline rate scores for building type
groups for the country as a whole and according to their
spatial plan areas. For a guide as to the types of buildings
which are most likely to see significant ongoing decline
the ‘Wales’ column should be referred to. From this it
can be seen that the building types with the most rapid
historic decline are consistent with the types already
highlighted in the risk and defect analyses.
1 Significant parts of these areas are to be resurveyed during 2014.
Ahead of this, the data (particularly for Pembrokeshire Haven) should
be treated with caution.
2 The parts of this plan area with the buildings most likely to see a
decline does no yet have pairs of fully compatible surveys. This being
the case, the figures should be treated with caution.
Rate of Change Score for Spatial Plan Areas and Building Use Type
Building Use Group
Rate of Change Score (higher score indicates higher potential decline rate without action) Wales Spatial Plan Areas (areas with high relative decline rates are highlighted)
North-West Wales
North-East Wales
Central Wales
1
P’brokeshire Haven
1
Swansea Bay2 South-East
Wales
Agricultural 1.80 1.89 1.94 1.75 1.57 1.83 1.80 Ancillary 1.59 1.33 0.62 1.58 0.00 0.25 2.89 Boundary 0.98 1.13 0.83 1.21 2.19 1.55 0.78 Civic 0.67 0.47 0.47 0.56 1.14 0.55 0.96 Coastal 0.82 0.90 2.13 0.00 0.00 0.00 1.52 Commercial 1.03 1.15 1.00 0.8 1.21 1.19 1.17 Domestic 0.68 0.82 0.58 0.71 1.06 0.63 0.61 Educational 0.50 0.62 0.62 0.15 0.00 0.80 0.46 Extractive 1.59 0.81 2.05 0.58 0.00 2.35 2.27 Fortification 0.81 0.78 0.02 0.51 0.26 1.79 0.73 Garden 1.08 1.37 0.50 0.54 0.00 2.31 0.95 Hospital 1.42 0.36 0.95 0.28 0.57 0.19 2.58 Industrial 1.83 0.53 3.19 0.86 0.92 2.91 0.88 Monument 0.61 0.96 0.53 0.69 0.4 0.20 0.66 Other 1.32 0.89 0.65 1.27 2.93 1.23 1.78 Outbuilding 1.32 1.57 1.07 1.39 1.58 1.65 1.41 Process 1.25 0.43 1.47 0.66 1.31 1.56 3.00 Religious 1.08 1.13 0.63 1.02 1.13 1.47 1.41 Street Furniture 0.83 0.86 1.36 0.95 0.00 0.00 0.39 Transport 1.01 0.48 0.60 0.85 1.26 1.21 1.52 Vacant 1.19 0.33 1.34 1.26 0.96 2.24 1.57 Water 0.68 2.27 0.29 0.80 0.10 1.52 0.09 All Types 1.05 1.16 1.02 1.21 0.19 0.16 0.73
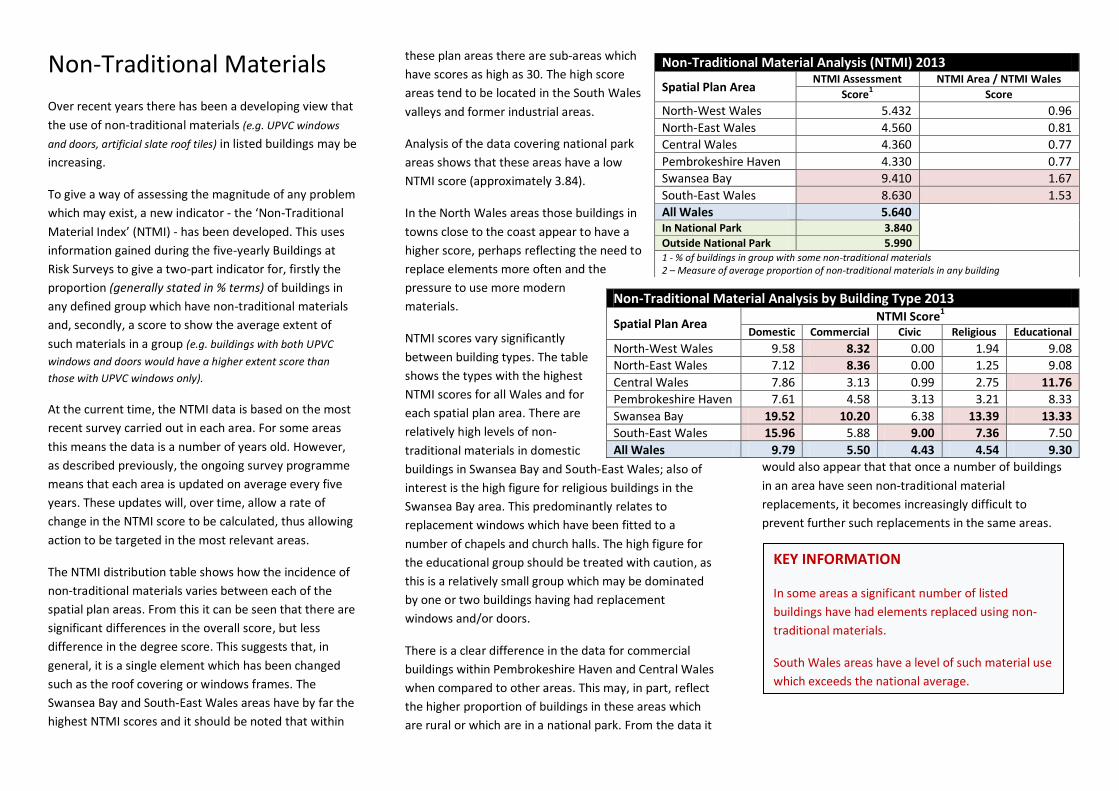
Non-Traditional Materials
Over recent years there has been a developing view that
the use of non-traditional materials (e.g. UPVC windows
and doors, artificial slate roof tiles) in listed buildings may be
increasing.
To give a way of assessing the magnitude of any problem
which may exist, a new indicator - the ‘Non-Traditional
Material Index’ (NTMI) - has been developed. This uses
information gained during the five-yearly Buildings at
Risk Surveys to give a two-part indicator for, firstly the
proportion (generally stated in % terms) of buildings in
any defined group which have non-traditional materials
and, secondly, a score to show the average extent of
such materials in a group (e.g. buildings with both UPVC
windows and doors would have a higher extent score than
those with UPVC windows only).
At the current time, the NTMI data is based on the most
recent survey carried out in each area. For some areas
this means the data is a number of years old. However,
as described previously, the ongoing survey programme
means that each area is updated on average every five
years. These updates will, over time, allow a rate of
change in the NTMI score to be calculated, thus allowing
action to be targeted in the most relevant areas.
The NTMI distribution table shows how the incidence of
non-traditional materials varies between each of the
spatial plan areas. From this it can be seen that there are
significant differences in the overall score, but less
difference in the degree score. This suggests that, in
general, it is a single element which has been changed
such as the roof covering or windows frames. The
Swansea Bay and South-East Wales areas have by far the
highest NTMI scores and it should be noted that within
these plan areas there are sub-areas which
have scores as high as 30. The high score
areas tend to be located in the South Wales
valleys and former industrial areas.
Analysis of the data covering national park
areas shows that these areas have a low
NTMI score (approximately 3.84).
In the North Wales areas those buildings in
towns close to the coast appear to have a
higher score, perhaps reflecting the need to
replace elements more often and the
pressure to use more modern
materials.
NTMI scores vary significantly
between building types. The table
shows the types with the highest
NTMI scores for all Wales and for
each spatial plan area. There are
relatively high levels of non-
traditional materials in domestic
buildings in Swansea Bay and South-East Wales; also of
interest is the high figure for religious buildings in the
Swansea Bay area. This predominantly relates to
replacement windows which have been fitted to a
number of chapels and church halls. The high figure for
the educational group should be treated with caution, as
this is a relatively small group which may be dominated
by one or two buildings having had replacement
windows and/or doors.
There is a clear difference in the data for commercial
buildings within Pembrokeshire Haven and Central Wales
when compared to other areas. This may, in part, reflect
the higher proportion of buildings in these areas which
are rural or which are in a national park. From the data it
would also appear that that once a number of buildings
in an area have seen non-traditional material
replacements, it becomes increasingly difficult to
prevent further such replacements in the same areas.
Non-Traditional Material Analysis (NTMI) 2013
Spatial Plan Area NTMI Assessment NTMI Area / NTMI Wales
Score1 Score
North-West Wales 5.432 0.96
North-East Wales 4.560 0.81
Central Wales 4.360 0.77
Pembrokeshire Haven 4.330 0.77
Swansea Bay 9.410 1.67
South-East Wales 8.630 1.53
All Wales 5.640 In National Park 3.840
Outside National Park 5.990 1 - % of buildings in group with some non-traditional materials 2 – Measure of average proportion of non-traditional materials in any building
Non-Traditional Material Analysis by Building Type 2013
Spatial Plan Area NTMI Score1
Domestic Commercial Civic Religious Educational
North-West Wales 9.58 8.32 0.00 1.94 9.08
North-East Wales 7.12 8.36 0.00 1.25 9.08
Central Wales 7.86 3.13 0.99 2.75 11.76
Pembrokeshire Haven 7.61 4.58 3.13 3.21 8.33
Swansea Bay 19.52 10.20 6.38 13.39 13.33
South-East Wales 15.96 5.88 9.00 7.36 7.50
All Wales 9.79 5.50 4.43 4.54 9.30
KEY INFORMATION
In some areas a significant number of listed
buildings have had elements replaced using non-
traditional materials.
South Wales areas have a level of such material use
which exceeds the national average.
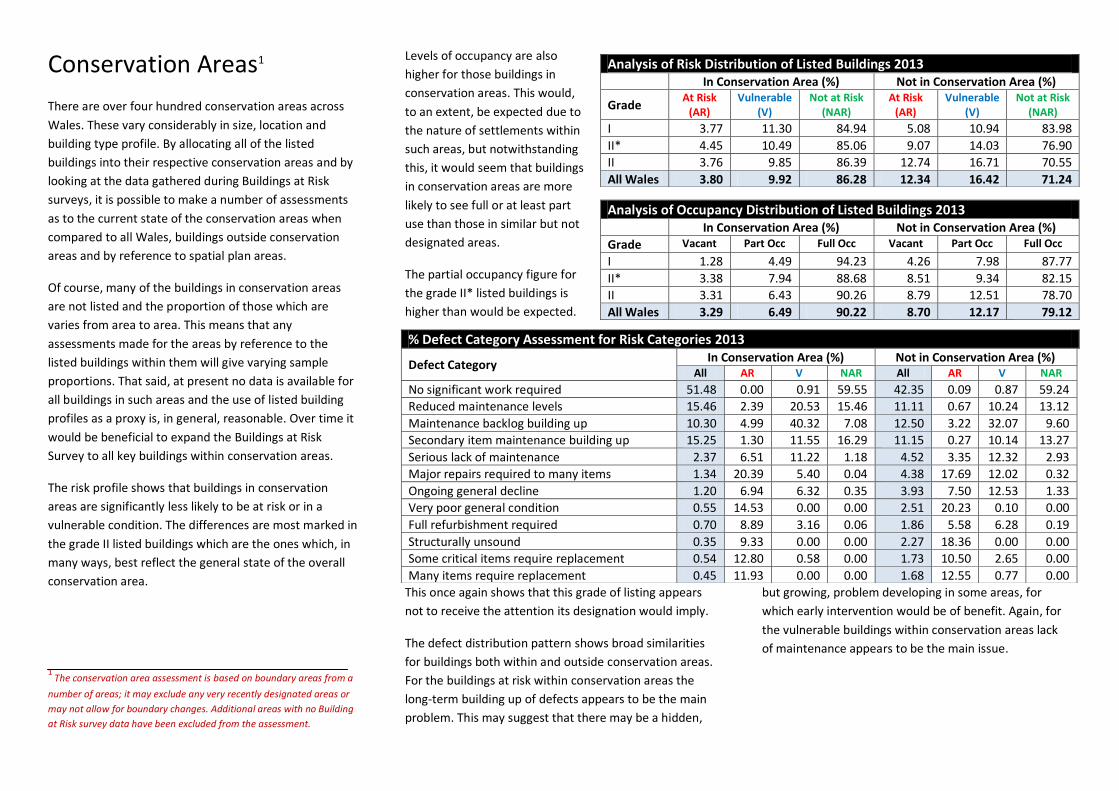
Conservation Areas1
There are over four hundred conservation areas across
Wales. These vary considerably in size, location and
building type profile. By allocating all of the listed
buildings into their respective conservation areas and by
looking at the data gathered during Buildings at Risk
surveys, it is possible to make a number of assessments
as to the current state of the conservation areas when
compared to all Wales, buildings outside conservation
areas and by reference to spatial plan areas.
Of course, many of the buildings in conservation areas
are not listed and the proportion of those which are
varies from area to area. This means that any
assessments made for the areas by reference to the
listed buildings within them will give varying sample
proportions. That said, at present no data is available for
all buildings in such areas and the use of listed building
profiles as a proxy is, in general, reasonable. Over time it
would be beneficial to expand the Buildings at Risk
Survey to all key buildings within conservation areas.
The risk profile shows that buildings in conservation
areas are significantly less likely to be at risk or in a
vulnerable condition. The differences are most marked in
the grade II listed buildings which are the ones which, in
many ways, best reflect the general state of the overall
conservation area.
1 The conservation area assessment is based on boundary areas from a
number of areas; it may exclude any very recently designated areas or
may not allow for boundary changes. Additional areas with no Building
at Risk survey data have been excluded from the assessment.
Levels of occupancy are also
higher for those buildings in
conservation areas. This would,
to an extent, be expected due to
the nature of settlements within
such areas, but notwithstanding
this, it would seem that buildings
in conservation areas are more
likely to see full or at least part
use than those in similar but not
designated areas.
The partial occupancy figure for
the grade II* listed buildings is
higher than would be expected.
This once again shows that this grade of listing appears
not to receive the attention its designation would imply.
The defect distribution pattern shows broad similarities
for buildings both within and outside conservation areas.
For the buildings at risk within conservation areas the
long-term building up of defects appears to be the main
problem. This may suggest that there may be a hidden,
but growing, problem developing in some areas, for
which early intervention would be of benefit. Again, for
the vulnerable buildings within conservation areas lack
of maintenance appears to be the main issue.
Analysis of Occupancy Distribution of Listed Buildings 2013 In Conservation Area (%) Not in Conservation Area (%)
Grade Vacant Part Occ Full Occ Vacant Part Occ Full Occ
I 1.28 4.49 94.23 4.26 7.98 87.77
II* 3.38 7.94 88.68 8.51 9.34 82.15
II 3.31 6.43 90.26 8.79 12.51 78.70
All Wales 3.29 6.49 90.22 8.70 12.17 79.12
% Defect Category Assessment for Risk Categories 2013
Defect Category In Conservation Area (%) Not in Conservation Area (%)
All AR V NAR All AR V NAR
No significant work required 51.48 0.00 0.91 59.55 42.35 0.09 0.87 59.24
Reduced maintenance levels 15.46 2.39 20.53 15.46 11.11 0.67 10.24 13.12
Maintenance backlog building up 10.30 4.99 40.32 7.08 12.50 3.22 32.07 9.60
Secondary item maintenance building up 15.25 1.30 11.55 16.29 11.15 0.27 10.14 13.27
Serious lack of maintenance 2.37 6.51 11.22 1.18 4.52 3.35 12.32 2.93
Major repairs required to many items 1.34 20.39 5.40 0.04 4.38 17.69 12.02 0.32
Ongoing general decline 1.20 6.94 6.32 0.35 3.93 7.50 12.53 1.33
Very poor general condition 0.55 14.53 0.00 0.00 2.51 20.23 0.10 0.00
Full refurbishment required 0.70 8.89 3.16 0.06 1.86 5.58 6.28 0.19
Structurally unsound 0.35 9.33 0.00 0.00 2.27 18.36 0.00 0.00
Some critical items require replacement 0.54 12.80 0.58 0.00 1.73 10.50 2.65 0.00
Many items require replacement 0.45 11.93 0.00 0.00 1.68 12.55 0.77 0.00
Analysis of Risk Distribution of Listed Buildings 2013 In Conservation Area (%) Not in Conservation Area (%)
Grade At Risk
(AR) Vulnerable
(V) Not at Risk
(NAR) At Risk
(AR) Vulnerable
(V) Not at Risk
(NAR)
I 3.77 11.30 84.94 5.08 10.94 83.98
II* 4.45 10.49 85.06 9.07 14.03 76.90
II 3.76 9.85 86.39 12.74 16.71 70.55
All Wales 3.80 9.92 86.28 12.34 16.42 71.24


