
8/20/2019 Concentrated solar power plants Review and design methodology.pdf
http://slidepdf.com/reader/full/concentrated-solar-power-plants-review-and-design-methodologypdf 1/16
Concentrated solar power plants: Review and design methodology
H.L. Zhang a,n, J. Baeyens b, J. Degreve a, G. Caceres c
a Department of Chemical Engineering, Chemical and Biochemical Process Technology and Control Section, Katholieke Universiteit Leuven, Heverlee 3001, Belgiumb School of Engineering, University of Warwick, Coventry, UK c Facultad de Ingenierıa y Ciencias, Universidad Adolfo Ibanez, Santiago, Chile
a r t i c l e i n f o
Article hi story:
Received 17 November 2012
Received in revised form24 January 2013
Accepted 26 January 2013Available online 15 March 2013
Keywords:
Concentrated solar power plants
Design methodology
Solar towers
Hourly beam irradiation
Plant simulation
a b s t r a c t
Concentrated solar power plants (CSPs) are gaining increasing interest, mostly as parabolic trough
collectors (PTC) or solar tower collectors (STC). Notwithstanding CSP benefits, the daily and monthly
variation of the solar irradiation flux is a main drawback. Despite the approximate match betweenhours of the day where solar radiation and energy demand peak, CSPs experience short term variations
on cloudy days and cannot provide energy during night hours unless incorporating thermal energy
storage (TES) and/or backup systems (BS) to operate continuously. To determine the optimum design
and operation of the CSP throughout the year, whilst defining the required TES and/or BS, an accurate
estimation of the daily solar irradiation is needed. Local solar irradiation data are mostly only available
as monthly averages, and a predictive conversion into hourly data and direct irradiation is needed to
provide a more accurate input into the CSP design. The paper (i) briefly reviews CSP technologies and
STC advantages; (ii) presents a methodology to predict hourly beam (direct) irradiation from available
monthly averages, based upon combined previous literature findings and available meteorological data;
(iii) illustrates predictions for different selected STC locations; and finally (iv) describes the use of the
predictions in simulating the required plant configuration of an optimum STC.
The methodology and results demonstrate the potential of CSPs in general, whilst also defining the
design background of STC plants.
& 2013 Elsevier Ltd. All rights reserved.
Contents
1. Introduction . . . . . . . . . . . . . . . . . . . . . . . . . . . . . . . . . . . . . . . . . . . . . . . . . . . . . . . . . . . . . . . . . . . . . . . . . . . . . . . . . . . . . . . . . . . . . . . . . . . . . . 467
1.1. Solar irradiance as worldwide energy source . . . . . . . . . . . . . . . . . . . . . . . . . . . . . . . . . . . . . . . . . . . . . . . . . . . . . . . . . . . . . . . . . . . . . . 467
1.2. Concentrated solar power plants. . . . . . . . . . . . . . . . . . . . . . . . . . . . . . . . . . . . . . . . . . . . . . . . . . . . . . . . . . . . . . . . . . . . . . . . . . . . . . . . 467
2. CSP technologies . . . . . . . . . . . . . . . . . . . . . . . . . . . . . . . . . . . . . . . . . . . . . . . . . . . . . . . . . . . . . . . . . . . . . . . . . . . . . . . . . . . . . . . . . . . . . . . . . . 467
2.1. Generalities . . . . . . . . . . . . . . . . . . . . . . . . . . . . . . . . . . . . . . . . . . . . . . . . . . . . . . . . . . . . . . . . . . . . . . . . . . . . . . . . . . . . . . . . . . . . . . . . 467
2.1.1. Solar power towers . . . . . . . . . . . . . . . . . . . . . . . . . . . . . . . . . . . . . . . . . . . . . . . . . . . . . . . . . . . . . . . . . . . . . . . . . . . . . . . . . . .468
2.1.2. Parabolic trough collector . . . . . . . . . . . . . . . . . . . . . . . . . . . . . . . . . . . . . . . . . . . . . . . . . . . . . . . . . . . . . . . . . . . . . . . . . . . . . . 469
2.1.3. Linear Fresnel reflector . . . . . . . . . . . . . . . . . . . . . . . . . . . . . . . . . . . . . . . . . . . . . . . . . . . . . . . . . . . . . . . . . . . . . . . . . . . . . . . . 470
2.1.4. Parabolic dish systems. . . . . . . . . . . . . . . . . . . . . . . . . . . . . . . . . . . . . . . . . . . . . . . . . . . . . . . . . . . . . . . . . . . . . . . . . . . . . . . . . 470
2.1.5. Concentrated solar thermo-electrics . . . . . . . . . . . . . . . . . . . . . . . . . . . . . . . . . . . . . . . . . . . . . . . . . . . . . . . . . . . . . . . . . . . . . . 471
2.2. Comparison of CSP technologies . . . . . . . . . . . . . . . . . . . . . . . . . . . . . . . . . . . . . . . . . . . . . . . . . . . . . . . . . . . . . . . . . . . . . . . . . . . . . . . . 4713. Past and current SPT developments . . . . . . . . . . . . . . . . . . . . . . . . . . . . . . . . . . . . . . . . . . . . . . . . . . . . . . . . . . . . . . . . . . . . . . . . . . . . . . . . . . . 472
4. Enhancing the CSP potential . . . . . . . . . . . . . . . . . . . . . . . . . . . . . . . . . . . . . . . . . . . . . . . . . . . . . . . . . . . . . . . . . . . . . . . . . . . . . . . . . . . . . . . . . 472
4.1. Thermal energy storage systems . . . . . . . . . . . . . . . . . . . . . . . . . . . . . . . . . . . . . . . . . . . . . . . . . . . . . . . . . . . . . . . . . . . . . . . . . . . . . . . . 472
4.2. Backup systems . . . . . . . . . . . . . . . . . . . . . . . . . . . . . . . . . . . . . . . . . . . . . . . . . . . . . . . . . . . . . . . . . . . . . . . . . . . . . . . . . . . . . . . . . . . . . 473
5. Computing global and diffuse solar hourly irradiation. . . . . . . . . . . . . . . . . . . . . . . . . . . . . . . . . . . . . . . . . . . . . . . . . . . . . . . . . . . . . . . . . . . . . 474
5.1. Background information . . . . . . . . . . . . . . . . . . . . . . . . . . . . . . . . . . . . . . . . . . . . . . . . . . . . . . . . . . . . . . . . . . . . . . . . . . . . . . . . . . . . . . 474
5.2. The adopted model approach and equations . . . . . . . . . . . . . . . . . . . . . . . . . . . . . . . . . . . . . . . . . . . . . . . . . . . . . . . . . . . . . . . . . . . . . . 474
5.2.1. Estimating the daily irradiation. . . . . . . . . . . . . . . . . . . . . . . . . . . . . . . . . . . . . . . . . . . . . . . . . . . . . . . . . . . . . . . . . . . . . . . . . . 474
5.2.2. Sequence of days . . . . . . . . . . . . . . . . . . . . . . . . . . . . . . . . . . . . . . . . . . . . . . . . . . . . . . . . . . . . . . . . . . . . . . . . . . . . . . . . . . . . . 475
Contents lists available at SciVerse ScienceDirect
journal homepage: www.elsevier.com/locate/rser
Renewable and Sustainable Energy Reviews
1364-0321/$- see front matter & 2013 Elsevier Ltd. All rights reserved.
http://dx.doi.org/10.1016/j.rser.2013.01.032
n Corresponding author. Tel.: þ 32 16 322695; fax: þ 32 16 322991.
E-mail address: [email protected] (H.L. Zhang).
Renewable and Sustainable Energy Reviews 22 (2013) 466–481

8/20/2019 Concentrated solar power plants Review and design methodology.pdf
http://slidepdf.com/reader/full/concentrated-solar-power-plants-review-and-design-methodologypdf 2/16
5.2.3. Estimation of the hourly diffuse and beam radiation . . . . . . . . . . . . . . . . . . . . . . . . . . . . . . . . . . . . . . . . . . . . . . . . . . . . . . . . . 475
5.2.4. Shortcut estimates, based on recorded temperatures. . . . . . . . . . . . . . . . . . . . . . . . . . . . . . . . . . . . . . . . . . . . . . . . . . . . . . . . . 475
6. Model parameters . . . . . . . . . . . . . . . . . . . . . . . . . . . . . . . . . . . . . . . . . . . . . . . . . . . . . . . . . . . . . . . . . . . . . . . . . . . . . . . . . . . . . . . . . . . . . . . . . 476
6.1. Common measurement methods of solar radiation . . . . . . . . . . . . . . . . . . . . . . . . . . . . . . . . . . . . . . . . . . . . . . . . . . . . . . . . . . . . . . . . . 476
6.2. Available information. . . . . . . . . . . . . . . . . . . . . . . . . . . . . . . . . . . . . . . . . . . . . . . . . . . . . . . . . . . . . . . . . . . . . . . . . . . . . . . . . . . . . . . . . 476
6.3. Selected locations. . . . . . . . . . . . . . . . . . . . . . . . . . . . . . . . . . . . . . . . . . . . . . . . . . . . . . . . . . . . . . . . . . . . . . . . . . . . . . . . . . . . . . . . . . . . 477
7. Results and discussion. . . . . . . . . . . . . . . . . . . . . . . . . . . . . . . . . . . . . . . . . . . . . . . . . . . . . . . . . . . . . . . . . . . . . . . . . . . . . . . . . . . . . . . . . . . . . . 477
7.1. Calculations of H 0, H and H b . . . . . . . . . . . . . . . . . . . . . . . . . . . . . . . . . . . . . . . . . . . . . . . . . . . . . . . . . . . . . . . . . . . . . . . . . . . . . . . . . . . 477
7.2. Methodology to apply the predictions in CSP design. . . . . . . . . . . . . . . . . . . . . . . . . . . . . . . . . . . . . . . . . . . . . . . . . . . . . . . . . . . . . . . . 478
8. Conclusions . . . . . . . . . . . . . . . . . . . . . . . . . . . . . . . . . . . . . . . . . . . . . . . . . . . . . . . . . . . . . . . . . . . . . . . . . . . . . . . . . . . . . . . . . . . . . . . . . . . . . . 480References . . . . . . . . . . . . . . . . . . . . . . . . . . . . . . . . . . . . . . . . . . . . . . . . . . . . . . . . . . . . . . . . . . . . . . . . . . . . . . . . . . . . . . . . . . . . . . . . . . . . . . . . . . . 480
1. Introduction
1.1. Solar irradiance as worldwide energy source
More energy from the sunlight strikes the earth in 1 h than all
of the energy consumed by humans in an entire year. In fact, solar
energy dwarfs all other renewable and fossil-based energy
resources combined.
We need energy – electrical or thermal – but in most cases
where and when it is not available. Low cost, fossil-based
electricity has always served as a significant cost competitor for
electrical power generation. To provide a durable and widespread
primary energy source, solar energy must be captured, stored and
used in a cost-effective fashion.
Solar energy is of unsteady nature, both within the day (day–
night, clouds) and within the year (winter–summer). The capture
and storage of solar energy is critical if a significant portion of the
total energy demand needs to be provided by solar energy.
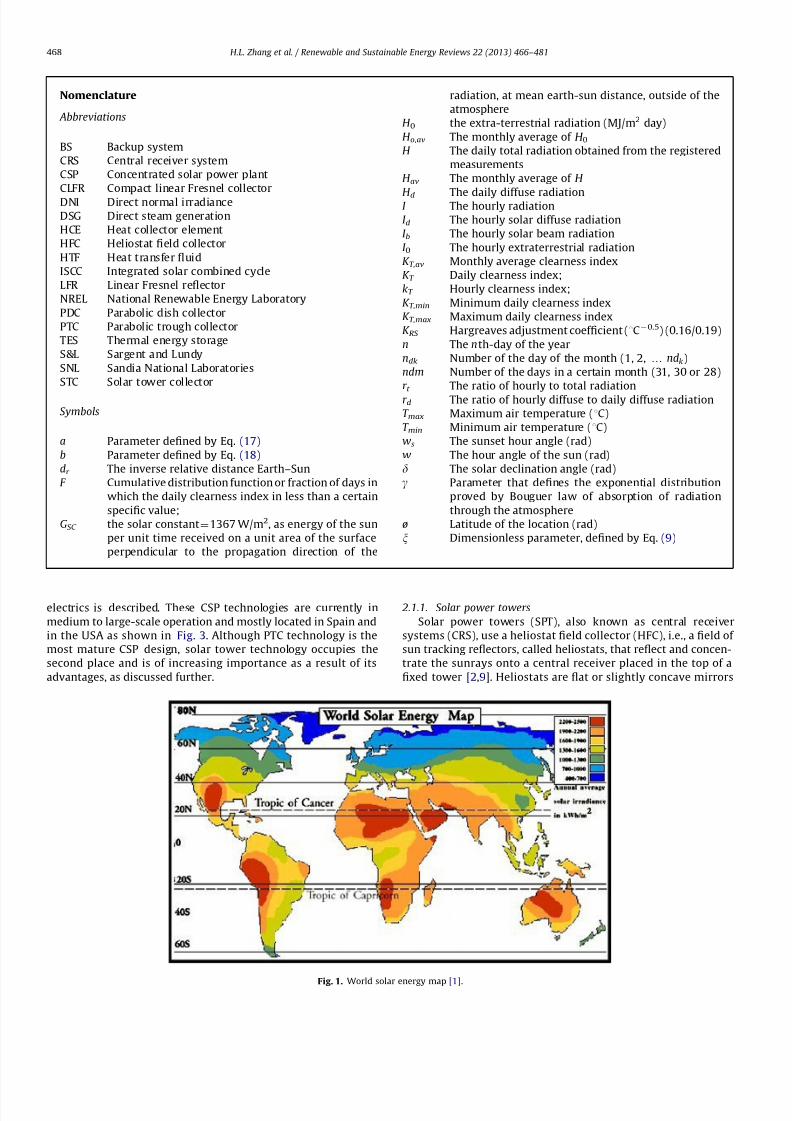
Fig. 1 illustrates the world solar energy map. Most of the
countries, except those above latitude 451N or below latitude
451S, are subject to an annual average irradiation flux in excess of
1.6 MW h/m2, with peaks of solar energy recorded in some ‘‘hot’’
spots of the Globe, e.g., the Mojave Desert (USA), the Sahara and
Kalahari Deserts (Africa), the Middle East, the Chilean AtacamaDesert and North-western Australia.
1.2. Concentrated solar power plants
Concentrated solar power plants are gaining increasing interest,
mostly by using the parabolic trough collector system (PTC),
although solar power towers (SPT) progressively occupy a signifi-
cant market position due to their advantages in terms of higher
efficiency, lower operating costs and good scale-up potential.
The large-scale STC technology was successfully demon-
strated by Torresol in the Spanish Gemasolar project on a
19.9 MWel-scale [2].
Notwithstanding CSP benefits, the varying solar radiation flux
throughout the day and throughout the year remains a mainproblem for all CSP technologies: despite the close match
between hours of the day in which energy demand peaks and
solar irradiation is available, conventional CSP technologies
experience short term variations on cloudy days and cannot
provide energy during night hours. In order to improve the overall
yield in comparison with conventional systems, the CSP process
can be enhanced by the incorporation of two technologies, i.e.,
thermal energy storage (TES) and backup systems (BS). Both
systems facilitate a successful continuous and year round opera-
tion, thus providing a stable energy supply in response to
electricity grid demands. To determine the optimum design and
operation of the CSP throughout the year, whilst additionally
defining the capacity of TES and required BS, an accurate estima-
tion of the daily solar irradiation is needed. Solar irradiation data
for worldwide locations are mostly only available as monthly
averages, and a predictive conversion into hourly data and
direct irradiation is needed to provide a more accurate input
into the CSP design. Considering that a CSP plant will only
accept direct normal irradiance (DNI) in order to operate, a
clear day model is required for calculating the suitable
irradiation data.
The procedure, outlined in the present paper, combines pre-
vious theoretical and experimental findings into a general method
of calculating the hourly beam irradiation flux. The basis was
previously outlined by Duffie and Beckmann [3], and uses the Liu
and Jordan [4] generalized distributions of cloudy and clear days,
later modified by Bendt et al. [5], then by Stuart and Hollands [6]
and finally by Knight et al. [7].
The present paper has therefore the following specific
objectives:
review the CSP technologies and discuss solar power tower
advantages compared to the other technologies;
estimate the hourly beam irradiation flux from available
monthly mean global irradiation data for selected locations,
and compare the results obtained of monthly data with
calculations from the temperatures recorded at the locations; select an appropriate plant configuration, and present design
preliminary recommendations using predicted hourly beam
irradiation data.
In general, the study will demonstrate the global potential of
implementing the SPT technology, and will help to determine the
most suitable locations for the installation of SPT plants.
2. CSP technologies
2.1. Generalities
Concentrated solar power (CSP) is an electricity generationtechnology that uses heat provided by solar irradiation concen-
trated on a small area. Using mirrors, sunlight is reflected to a
receiver where heat is collected by a thermal energy carrier
(primary circuit), and subsequently used directly (in the case of
water/steam) or via a secondary circuit to power a turbine and
generate electricity. CSP is particularly promising in regions with
high DNI. According to the available technology roadmap [8], CSP
can be a competitive source of bulk power in peak and inter-
mediate loads in the sunniest regions by 2020, and of base load
power by 2025 to 2030.
At present, there are four available CSP technologies (Fig. 2):
parabolic trough collector (PTC), solar power tower (SPT), linear
Fresnel reflector (LFR) and parabolic dish systems (PDS). Addi-
tionally, a recent technology called concentrated solar thermo-
H.L. Zhang et al. / Renewable and Sustainable Energy Reviews 22 (2013) 466–481 467
8/20/2019 Concentrated solar power plants Review and design methodology.pdf
http://slidepdf.com/reader/full/concentrated-solar-power-plants-review-and-design-methodologypdf 3/16
electrics is described. These CSP technologies are currently in
medium to large-scale operation and mostly located in Spain and
in the USA as shown in Fig. 3. Although PTC technology is the
most mature CSP design, solar tower technology occupies the
second place and is of increasing importance as a result of its
advantages, as discussed further.
2.1.1. Solar power towers
Solar power towers (SPT), also known as central receiver
systems (CRS), use a heliostat field collector (HFC), i.e., a field of
sun tracking reflectors, called heliostats, that reflect and concen-
trate the sunrays onto a central receiver placed in the top of a
fixed tower [2,9]. Heliostats are flat or slightly concave mirrors
Fig. 1. World solar energy map [1].
Nomenclature
Abbreviations
BS Backup system
CRS Central receiver system
CSP Concentrated solar power plant
CLFR Compact linear Fresnel collector
DNI Direct normal irradiance
DSG Direct steam generation
HCE Heat collector element
HFC Heliostat field collector
HTF Heat transfer fluid
ISCC Integrated solar combined cycle
LFR Linear Fresnel reflector
NREL National Renewable Energy Laboratory
PDC Parabolic dish collector
PTC Parabolic trough collector
TES Thermal energy storage
S&L Sargent and Lundy
SNL Sandia National Laboratories
STC Solar tower collector
Symbols
a Parameter defined by Eq. (17)
b Parameter defined by Eq. (18)dr The inverse relative distance Earth–SunF Cumulative distribution function or fraction of days in
which the daily clearness index in less than a certain
specific value;GSC the solar constant¼1367 W/m2, as energy of the sun
per unit time received on a unit area of the surface
perpendicular to the propagation direction of the
radiation, at mean earth-sun distance, outside of the
atmosphereH 0 the extra-terrestrial radiation (MJ/m2 day)
H o,av The monthly average of H 0H The daily total radiation obtained from the registered
measurementsH av The monthly average of H
H d The daily diffuse radiationI The hourly radiationI d The hourly solar diffuse radiationI b The hourly solar beam radiation
I 0 The hourly extraterrestrial radiationK T,av Monthly average clearness indexK T Daily clearness index;kT Hourly clearness index;
K T,min Minimum daily clearness indexK T,max Maximum daily clearness indexK RS Hargreaves adjustment coefficient (1C0.5) (0.16/0.19)
n The nth-day of the yearndk Number of the day of the month (1, 2, y ndk)ndm Number of the days in a certain month (31, 30 or 28)r t The ratio of hourly to total radiation
r d The ratio of hourly diffuse to daily diffuse radiationT max Maximum air temperature (1C)T min Minimum air temperature (1C)ws The sunset hour angle (rad)
w The hour angle of the sun (rad)
d The solar declination angle (rad)
g Parameter that defines the exponential distribution
proved by Bouguer law of absorption of radiation
through the atmosphereø Latitude of the location (rad)
x Dimensionless parameter, defined by Eq. (9)
H.L. Zhang et al. / Renewable and Sustainable Energy Reviews 22 (2013) 466–481468

8/20/2019 Concentrated solar power plants Review and design methodology.pdf
http://slidepdf.com/reader/full/concentrated-solar-power-plants-review-and-design-methodologypdf 4/16
that follow the sun in a two axis tracking. In the central receiver,
heat is absorbed by a heat transfer fluid (HTF), which then
transfers heat to heat exchangers that power a steam Rankine
power cycle. Some commercial tower plants now in operation use
direct steam generation (DSG), others use different fluids, includ-
ing molten salts as HTF and storage medium [9]. The concentrat-
ing power of the tower concept achieves very high temperatures,
thereby increasing the efficiency at which heat is converted into
electricity and reducing the cost of thermal storage. In addition,
the concept is highly flexible, where designers can choose from awide variety of heliostats, receivers and transfer fluids. Some
plants can have several towers to feed one power block.
2.1.2. Parabolic trough collector
A parabolic trough collector (PTC) plant consists of a group of
reflectors (usually silvered acrylic) that are curved in one dimen-
sion in a parabolic shape to focus sunrays onto an absorber tube
that is mounted in the focal line of the parabola. The reflectors
and the absorber tubes move in tandem with the sun as it daily
crosses the sky, from sunrise to sunset [9,10]. The group of
parallel connected reflectors is called the solar field.
Typically, thermal fluids are used as primary HTF, thereafter
powering a secondary steam circuit and Rankine power cycle.
Other configurations use molten salts as HTF and others use a
direct steam generation (DSG) system.
The absorber tube (Fig. 4), also called heat collector element
(HCE), is a metal tube and a glass envelope covering it, with either
air or vacuum between these two to reduce convective heat losses
and allow for thermal expansion. The metal tube is coated with a
Fig. 2. Currently available CSP Technologies:(a) STP; (b)PTC; (c) LFR; (d) PDC [8].
USA
40.1%
Spain57.9%
Iran1.4%
Italy0.4%
Australia0.2%
Germany0.1%
Parabolic
Trough
96.3%
Solar
Tower
3.0%
Parabolic
Dish
0.1%
Linear
Fresnel0.7%
Fig. 3. Installed operational CSP power (March 2011), by country and by technology [10].
Fig. 4. Absorber element of a parabolic trough collector [9].
H.L. Zhang et al. / Renewable and Sustainable Energy Reviews 22 (2013) 466–481 469
8/20/2019 Concentrated solar power plants Review and design methodology.pdf
http://slidepdf.com/reader/full/concentrated-solar-power-plants-review-and-design-methodologypdf 5/16
selective material that has high solar irradiation absorbance and
low thermal remittance. The glass-metal seal is crucial in redu-
cing heat losses.
2.1.3. Linear Fresnel reflector
Linear Fresnel reflectors (LFR) approximate the parabolic shape
of the trough systems by using long rows of flat or slightly curved
mirrors to reflect the sunrays onto a downward facing linearreceiver. The receiver is a fixed structure mounted over a tower
above and along the linear reflectors. The reflectors are mirrors
that can follow the sun on a single or dual axis regime. The main
advantage of LFR systems is that their simple design of flexibly
bent mirrors and fixed receivers requires lower investment costs
and facilitates direct steam generation, thereby eliminating the
need of heat transfer fluids and heat exchangers. LFR plants are
however less efficient than PTC and SPT in converting solar energy
to electricity. It is moreover more difficult to incorporate storage
capacity into their design.
A more recent design, known as compact linear Fresnel
reflectors (CLFR), uses two parallel receivers for each row of
mirrors and thus needs less land than parabolic troughs to
produce a given output [11].The first of the currently operating
LFR plants, Puerto Errado 1 plant (PE 1), was constructed in
Germany in March 2009, with a capacity of 1.4 MW. The success
of this plant motivated the design of PE 2, a 30 MW plant to be
constructed in Spain. A 5 MW plant has recently been constructed
in California, USA.
2.1.4. Parabolic dish systems
Parabolic dish collectors (PDC), concentrate the sunrays at a
focal point supported above the center of the dish. The entire
system tracks the sun, with the dish and receiver moving in
tandem. This design eliminates the need for a HTF and for cooling
water. PDCs offer the highest transformation efficiency of any CSP
system. PDCs are expensive and have a low compatibility with
respect of thermal storage and hybridization [11]. Promoters
claim that mass production will allow dishes to compete with
larger solar thermal systems [11]. Each parabolic dish has a low
power capacity (typically tens of kW or smaller), and each dish
produces electricity independently, which means that hundreds
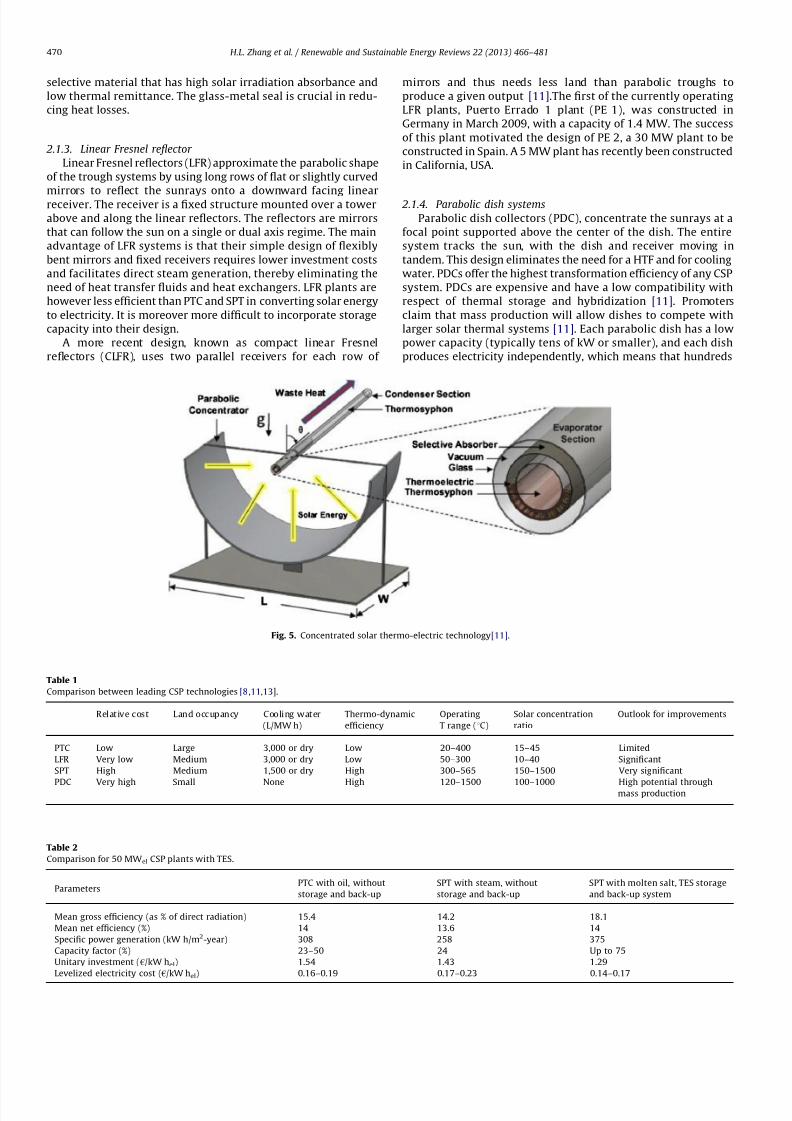
Fig. 5. Concentrated solar thermo-electric technology[11].
Table 1
Comparison between leading CSP technologies [8,11,13].
Relative cost Land occupancy Cooling water
(L/MW h)
Thermo-dynamic
efficiency
Operating
T range (1C)
Solar concentration
ratio
Outlook for improvements
PTC Low Large 3,000 or dry Low 20–400 15–45 Limited
LFR Very low Medium 3,000 or dry Low 50–300 10–40 Significant
SPT High Medium 1,500 or dry High 300–565 150–1500 Very significant
PDC Very high Small None High 120–1500 100–1000 High potential throughmass production
Table 2
Comparison for 50 MWel CSP plants with TES.
Parameters PTC with oil, without
storage and back-up
SPT with steam, without
storage and back-up
SPT with molten salt, TES storage
and back-up system
Mean gross efficiency (as % of direct radiation) 15.4 14.2 18.1
Mean net efficiency (%) 14 13.6 14
Specific power generation (kW h/m2-year) 308 258 375
Capacity factor (%) 23–50 24 Up to 75
Unitary investment (h/kW hel) 1.54 1.43 1.29
Levelized electricity cost (h/kW hel) 0.16–0.19 0.17–0.23 0.14–0.17
H.L. Zhang et al. / Renewable and Sustainable Energy Reviews 22 (2013) 466–481470
8/20/2019 Concentrated solar power plants Review and design methodology.pdf
http://slidepdf.com/reader/full/concentrated-solar-power-plants-review-and-design-methodologypdf 6/16
or thousands of them are required to install a large scale plant like
built with other CSP technologies [11].
Maricopa Solar Project is the only operational PDC plant, with
a net capacity of 1.5 MW. The plant began operation on January
2010 and is located in Arizona, USA.
2.1.5. Concentrated solar thermo-electrics
As well as with photovoltaic systems, direct conversion of
solar energy into electricity can also be achieved with concen-trated solar thermo-electric (CST) technology. Solar thermo-
electric devices can convert solar thermal energy, with its induced
temperature gradient, into electricity. They can also be modified
to be used as a cooling or heating technology [11]. Recently, CSP
technologies have been combined with thermo-electrics in order
to achieve higher efficiencies [11]. A concentrated solar thermo-
electric power generator typically consists of a solar thermal
collector and a thermo-electric generator (Fig. 5). Heat is
absorbed by the thermal collector, then concentrated and con-
ducted to the thermo-electric generator, where the thermal
resistance of the generator creates a temperature difference
between the absorber plate and the fluid, which is proportional
to the heat flux. The current cost of thermo-electric materials
hampers the widespread use of CSTs.
2.2. Comparison of CSP technologies
Within the commercial CSP technologies, parabolic trough
collector (PTC) plants are the most developed of all commercially
operating plants [12]. Table 1 compares the technologies on the
basis of different parameters.
In terms of cost related to plant development, SPT and PDC
systems are currently more expensive, although future
developments and improvements [13] will alter levelized energy
cost projections, as presented by Sandia National Laboratories
(SNL) and by Sargent & Lundy Consulting Group (S&L): SPT will be
the cheaper CSP technology in 2020.
In terms of land occupancy, considering the latest improve-
ments in CSP technologies, SPT and LFR require less land than PTC
to produce a given output. Additionally, PDC has the smallest land
requirement among CSP technologies [8,12].
Water requirements are of high importance for those locationswith water scarcity, e.g., in most of the deserts. As in other
thermal power generation plants, CSP requires water for cooling
and condensing processes, where requirements are relatively
high: about 3000 L/MW h for PTC and LFR plants (similar to a
nuclear reactor) compared to about 2000 L/MW h for a coal-fired
power plant and only 800 L/MW h for a combined-cycle natural
gas power plant. SPT plants need less water than PTC (1500 L/
MW h) [8]. Dishes are cooled by the surrounding air, so they do
not require cooling water. Dry cooling (with air) is an effective
alternative as proven by the plants under construction in North
Africa [8]. However, it is more costly and reduces efficiencies. Dry
cooling systems installed on PTC plants located in hot deserts,
reduce annual electricity production by 7% and increase the cost
of the produced electricity by about 10% [8]. However, the
efficiency reduction caused by dry cooling is lower for SPT than
for PTC. The installation of hybrid wet and dry cooling systems
reduces water consumption while minimizing the performance
penalty. As water cooling is more effective, operators of hybrid
systems tend to use only dry cooling in the winter when cooling
needs are lower, then switch to combined wet and dry cooling
during the summer.
A higher concentrating ratio of the sun enables the possibility
to reach higher working temperatures and better thermodynamic
efficiencies. On SPT plants, the large amount of irradiation focused
on a single receiver (200–1000 kW/m2) minimizes heat losses,
simplifies heat transport and reduces costs [13].
In terms of technology outlooks, SPT shows promising
advances, with novel HTF being developed and achieving higher
temperatures to improve the power cycle efficiencies. Moreover,higher efficiencies reduce the cooling water consumption, and
higher temperatures can considerably reduce storage costs.
A tentative comparison of 50 MWel CSP plants with TES [13,14]
is presented in Table 2. The capacity factor is defined as the ratio
of the actual output over a year and its potential output if the
plant had been operated at full nameplate capacity. Capacity
factors of CSP-plants without storage and back-up systems are
always low, due to the lacking power production after sunset and
before sunrise.
Table 3
PS20, Sierra sun tower and Gemasolar technical parameters [19].
Characteristics PS 20 Sierra sun tower Gemasolar
Tur bine net cap acit y 2 0 MWel 5 MWel 19.9 MWel
Solar field area 150,000 m2 27,670 m2 304,750 m2
Number of heliostats 1,255 24,360 2,650
Heat transfer fluid Water Water Molten salt
Receiver outlet temperature 2,550–300 1C 440 1C 565 1C
Backup fuel Natural gas Natural gas Natural gas
Storage capacity 1 h (No storage) 15 h
(molten salt)
Capacity factor Approx. 27% A pprox. 30% 70–75%
Table 4
Experimental solar power towers [12].
Project Country Power Heat transfer fluid Storage medium Operating since
PSA SSPS-CRS Spain 0.5 MWel Liquid sodium Sodium 1981
EURELIOS Italy 1 MWel Steam Nitrate salt/water 1981
SUNSHINE Japan 1 MWel Steam Nitrate salt/water 1981
Solar One USA 10 MWel Steam Oil/rock 1982
PSA CESA-1 Spain 1 MWel Steam Nitrate salt 1983
MSEE/Cat B USA 1 MWel Molten nitrate Nitrate salt 1984
THEMIS France 2.5 MWel Hi-Tec salt Hi-Tec salt 1984
SPP-5 Russia 5 MWel Steam Water/steam 1986
TSA Spain 1 MWel Air Ceramic 1993
Solar Two USA 10 MWel Molten nitrate Nitrate salt 1996
Consolar Israel 0.5 MWth Pressurized air Fossil hybrid 2001
Solgate Spain 0.3 MWel Pressurized air Fossil hybrid 2002
Eureka Spain 2 MWel Superheated steam Pressurized H2O 2009
Julich Germany 1.5 MWel Air Air/ceramic 2009
CSIRO SolarGas Australia 0.5 MWth Water/gas – 2005
CSIRO Brayton Australia 1 MWth Air – 2011
H.L. Zhang et al. / Renewable and Sustainable Energy Reviews 22 (2013) 466–481 471

8/20/2019 Concentrated solar power plants Review and design methodology.pdf
http://slidepdf.com/reader/full/concentrated-solar-power-plants-review-and-design-methodologypdf 7/16
A lower cost in SPT technology is mainly due to a lower
thermal energy storage costs, which benefits from a larger
temperature rise in the SPT compared to the PTC systems
[14,15]. A higher annual capacity factor and efficiency in SPT is
mainly possible due to the thermal storage, which enables a
continuous and steady day-night output [14,16].
Additionally, in SPT plants, the whole piping system is con-
centrated in the central area of the plant, which reduces the size
of the piping system, and consequently reduces energy losses,material costs and maintenance [2,8]. In this scenario, solar
towers with molten salt technology could be the best alternative
to parabolic trough solar power plants. Considering all mentioned
aspects, SPT has several potential advantages. For both SPT and
PTC technology, abundant quality data of main specific compo-
nents are known [3,12,17,18], thus facilitating a more accurate
analysis of the technology.
3. Past and current SPT developments
The early developments included the PS 10 and a slightly
improved PS 20 (Planta Solar 10 and 20) [18] of respective
capacities 11 and 20 MWel, built near Sevilla. The plant technol-
ogies involve glass-metal heliostats, a water thermal energystorage system (1 h), and cooling towers. A natural gas back-up
is present [18,19]. The Sierra Sun Tower is the third commercial
SPT plant in the world, and the first of the United States. It consist
of two modules with towers of 55 m height, total net turbine
capacity of 5 MWel and constructed on approximately 8 ha. It
began production in July 2009. Gemasolar is the fourth and
newest commercial SPT plant in the world, as it began production
in April 2011. It is the first commercially operating plant to apply
molten salts as heat transfer fluid and storage medium [2,19]. It is
located on 185 ha near Sevilla, Spain. The molten salt energy
storage system is capable of providing 15 h of electricity produc-
tion without sunlight, which enables the plant to provide elec-
tricity for 24 consecutive hours. Table 3 shows the main
characteristics of the PS 20, Sierra Sun Tower and Gemasolar SPT.
Additional pilot-SPT plants have been built and developed
around the world since 1981, as illustrated in Table 4 [12].
Commercial SPT plants are also being implemented, either in
the design or in the construction phase, as illustrated in Table 5.Recently additional large-scale projects have been announced for
e.g., Morocco, Chile, the USA, and the Republic of South Africa.
(RSA). The RSA announced an initiative of 5000 MW [20]. These
projects are not considered in Table 5, for current lack of detailed
information.
4. Enhancing the CSP potential
As stated before, the CSP potential can be enhanced by the
incorporation of two technologies in order to improve the
competitiveness towards conventional systems: Thermal energy
storage (TES) and backup systems (BS). Both systems offer the
possibility of a successful year round operation, providing a stable
energy supply in response to electricity grid demands [2,3].
4.1. Thermal energy storage systems
Thermal energy storage systems (TES) apply a simple princi-
ple: excess heat collected in the solar field is sent to a heat
exchanger and warms the heat transfer fluid (HTF) going from the
cold tank to the hot tank. When needed, the heat from the hot
tank can be returned to the HTF and sent to the steam generator
(Fig. 6). In the absence of storage capacity, on the sunniest hours,
Fig. 6. Thermal energy storage system in a parabolic trough collector plant [8].
Table 5
Developing solar power tower projects [19].
Project Country Nominal power output HTF Storage medium Projected to start operation
BrightSource Coyote springs 1 Nevada, USA 200 MWel Water – July 2014
BrightSource Coyote springs 2 Nevada, USA 200 MWel Water – July 2015
BrightSource PG&E 5 California, USA 200 MWel Water – July 2016
BrightSource PG&E 6 California, USA 200 MWel Water – December 2016
BrightSource PG&E 7 California, USA 200 MWel Water – July 2017
Crescent Dunes Solar Energy Project (Tonopah) Nevada, USA 110 MWel Molten salt Molten salt Octob er 2 01 3
Gaskell sun tower California, USA 245 MWel Water – May 2012
Ivanpah Solar Electric Generating Station (ISEGS) California, USA 370 MWel Water – October 2013
Rice Solar Energy Project (RSEP) California, USA 150 MWel Molten salt Molten salt Octob er 2 01 3
H.L. Zhang et al. / Renewable and Sustainable Energy Reviews 22 (2013) 466–481472
8/20/2019 Concentrated solar power plants Review and design methodology.pdf
http://slidepdf.com/reader/full/concentrated-solar-power-plants-review-and-design-methodologypdf 8/16
plant operators defocus some unneeded solar collectors to avoid
overheating the HTF. Storage avoids losing the daytime surplus
energy while extending the production after sunset.
Two types of thermal storage are necessary to maintain a
constant supply through the year, Short and Long term energy
storage. Short term thermal energy storage collects and stores
surplus daytime energy for nighttime consumption. Long term
thermal energy storage is less obvious, since involving storage in
spring and summer for autumn and winter months. Currently,only sensible heat is stored. The significant improvement by using
latent heat storage (phase change materials) or even chemical
heat storage (reversible endothermic/exothermic synthesis) is in
full development [21], with chemical heat being considered more
suitable for long term thermal energy storage.
Thermal storage can be achieved directly or indirectly. Liquids
e.g., mineral oil, synthetic oil, silicone oil, molten salts, can be
used for sensible heat in direct thermal storage systems. For
molten salts, the desired characteristics for sensible heat usage
are high density, low vapor pressure, moderate specific heat, low
chemical reactivity and low cost [21]. Indirect storage is where
HTF circulates heat, collected in the absorbers, and then pumped
to the thermal energy storage system. The storage material (solid
material) absorbs heat from the HTF in heat exchangers, while the
solid material and the HTF are in thermal contact.
The thermal storage capacity can be varied in order to meet
different load requirements, and different options are possible,
depending on the storage capacity included, i.e., (i) with a small
storage only, if electricity is only produced when the sunshine is
available; (ii) in a delayed intermediate load configuration, where
solar energy is collected during daytime, but with an extended
electricity production, or a production only when demand peaks;
(iii) in a fully continuous mode, with a sufficiently large storage
capacity to cover electricity production between sunset and
sunrise (e.g., Gemasolar).
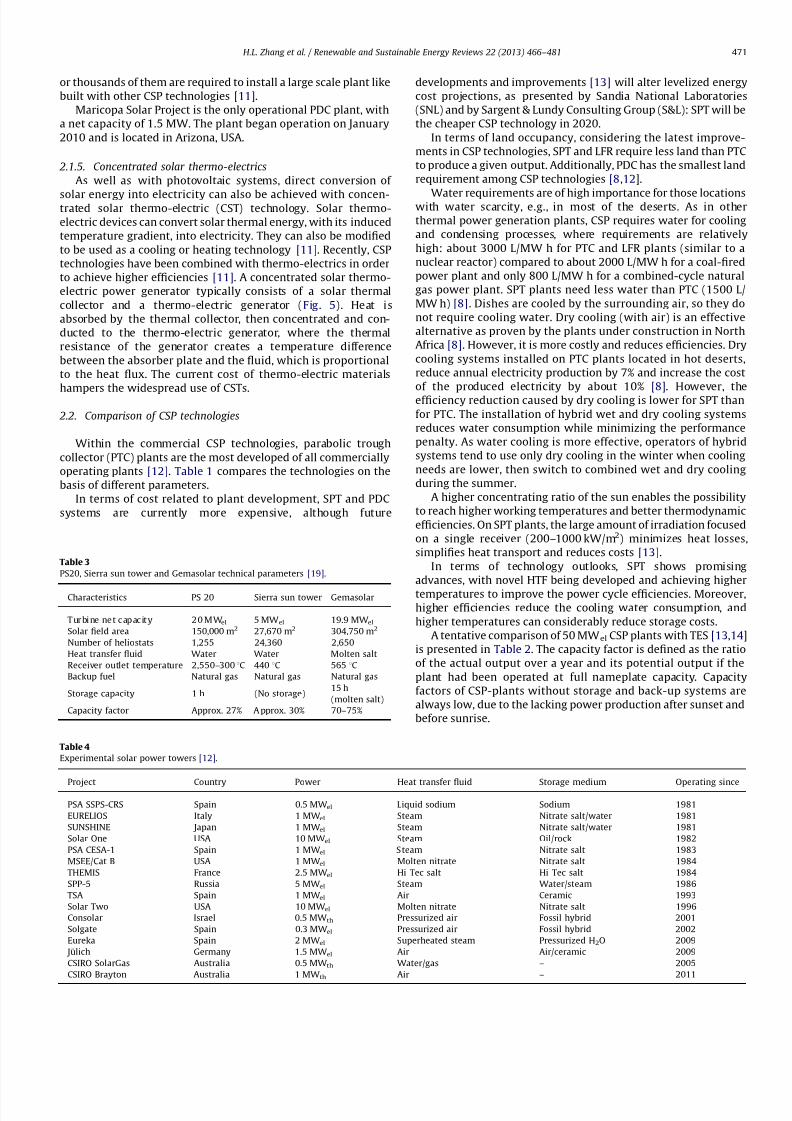
In order to select optimum sensible heat storage materials, the
heat capacity plays a major role [11,21], and values are illustrated
in Fig. 7.
Molten single salts tend to be expensive [11],as illustrated inFig. 8.
The molten nitrate salt, used as HTF and storage medium, is a
combination of 60 wt% sodium nitrate (NaNO3) and 40 wt%
potassium nitrate (KNO3). It is a stable mixture and has a low
vapor pressure. It can be used within a temperature range of
260 1C to 621 1C. However, as the temperature decreases, it
starts to crystallize at 238 1C and solidifies at 221 1C [21].
4.2. Backup systems
CSP plants, with or without storage, are commonly equipped
with a fuel backup system (BS), that helps to regulate production
and to guarantee a nearly constant generation capacity, especially
in peak periods. CSP plants equipped with backup systems are
called hybrid plants. Burners can provide energy to the HTF, to the
storage medium, or directly to the power block. The integration of
the BS can moreover reduce investments in reserve solar field and
storage capacity. CSP can also be used in a hybrid mode by adding
a small solar field to a fossil fuel fired power plant. These systems
are called integrated solar combined cycle plants (ISCC). As the
solar share is limited, such hybridization only limits fuel use. Apositive aspect of solar fuel savers is their relatively low cost:
Fig. 7. Heat capacity of different storage materials, (kW h/m3) versus melting
points (1K) [11].
Fig. 8. Cost of different storage materials (US$/kW h) versus melting points (1K) [10].
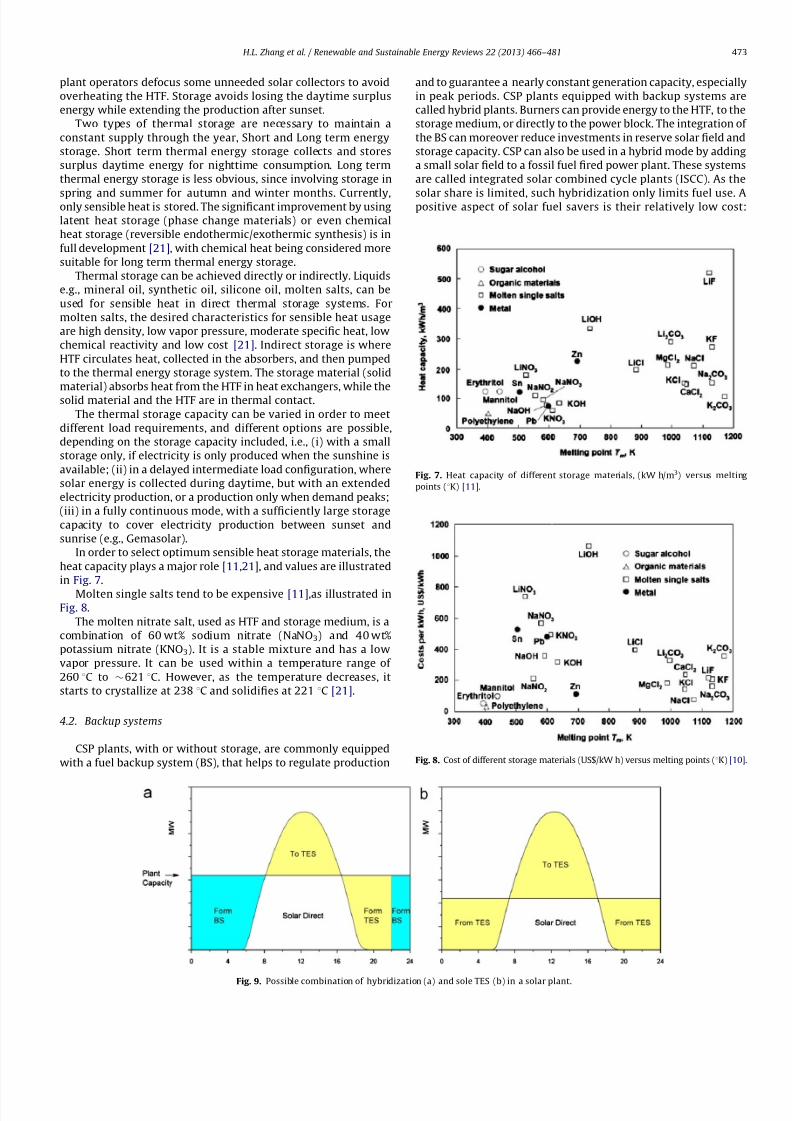
Fig. 9. Possible combination of hybridization (a) and sole TES (b) in a solar plant.
H.L. Zhang et al. / Renewable and Sustainable Energy Reviews 22 (2013) 466–481 473

8/20/2019 Concentrated solar power plants Review and design methodology.pdf
http://slidepdf.com/reader/full/concentrated-solar-power-plants-review-and-design-methodologypdf 9/16
with the steam cycle and turbine already in place, only compo-
nents specific to CSP require additional investment.
Fig. 9 shows a typical performance for a CSP plant enhanced
with thermal energy storage system and backup system, in a
constant generation at nominal capacity.
5. Computing global and diffuse solar hourly irradiation
5.1. Background information
To determine the optimum design and operation of the CSP
throughout the year, whilst additionally defining the potential of
TES and required BS, an accurate estimation of the daily solar
irradiation is needed. Solar irradiation data for worldwide loca-
tions are mostly only available as monthly averages (see Section
6), and a predictive conversion into hourly data and direct
irradiation is needed to provide a more accurate input into the
CSP design. It is therefore necessary to apply a methodology that
converts these values into hourly databases. Considering that a
CSP plant will only accept direct normal irradiance (DNI) in order
to operate, a clear day model is required for calculating the
appropriate irradiation data.Although numerous researchers (o2000) have generated
calculation procedures for obtaining synthetic data on a daily or
hourly basis [7,22–32], the present paper updates and combines
the essentials of these different publications into expressions of
daily distributions and hourly variations for any selected location,
starting from the monthly average solar irradiation value, by
generating a sequence of daily and hourly solar irradiation values.
Such a sequence must represent the trend of solar irradiation in a
specific area, with respect to the values observed, the monthly
average value and its distribution (the ‘‘good and bad’’ days).
The essential parameter is a dimensionless clearness index
variable, defined as the ratio of the horizontal global solar
irradiation and the horizontal global extra-terrestrial solar irra-
diation, defined as a monthly, a daily, and an hourly
characteristic.
In general, the meteorological variable solar radiation is
neither completely random, nor completely deterministic. Highly
random for short periods of time (days, hours), it is deterministic
for longer periods of time (months, years). The extra-terrestrial
solar irradiation can be predicted accurately for any place and
time, since the specific atmospheric conditions of a given area will
determine the random characteristics of the solar irradiation at
ground level.
5.2. The adopted model approach and equations
5.2.1. Estimating the daily irradiation
Before obtaining hourly data, estimations of daily irradiationmust be calculated first, as shown below.
First, it is necessary to compute the monthly average clearness
index for each month and location, which is defined as:
K T ,av ¼ H av=H o,av ð1Þ
Where H av is the monthly average irradiation, obtained from the
registered measurements, as discussed in Section 6, and H o,av is
the monthly average extraterrestrial irradiation. H o is computed
for each day and location by the following formula:
H o ¼ ð24 60=pÞGSC dr ½cosðøÞcosðdÞcosðw sÞ þw ssinðøÞsinðdÞ ð2Þ
With
H o the extra-terrestrial radiation (MJ/m2
day)
Gsc the solar constant¼1367 W/m2, as energy of the sun per
unit time received on a unit area of the surface perpen-
dicular to the propagation direction of the radiation, at
mean earth-sun distance, outside of the atmosphere.
dr the inverse relative distance Earth–Sun, as defined
below in Eq. (3)ws the sunset hour angle, as defined in Eq. (4) [10]
d the solar declination angle, as defined by Eq. (5)
ø the latitude of the location (rad)n the nth day of the year (1–365)
dr ¼ 1þ 0:033cosð2pn=365Þ ð3Þ
The sunset hour angle, when the incidence angle is 901, as is
needed for CSP plants [33], is defined as:
cosðw sÞ ¼ tanðøÞtanðdÞ ð4Þ
The declination angle is defined by the equation of Cooper [34] as:
d ¼ 23:45sin½2pð284þnÞ=365 ð5Þ
As a result, the daily extra-terrestrial irradiation can be expressed
by Eq. (6)
H o ¼ ð24 60=pÞGSC dr ½cosðøÞcosðdÞcosðw sÞ þw ssinðøÞsinðdÞ ð6Þ
Liu and Jordan [4] studied the statistical characteristics of solar
irradiation, using the clearness index (a measure of the atmo-
spheric transmittance) as a random variable. They demonstrated
that the hourly clearness index was related to the monthly
average value. Bendt et al. [5] thereafter proposed a frequency
distribution of daily clearness index values, staring from monthly
average values. Initially based upon irradiation studies in the USA,
this approach has been validated for different worldwide loca-
tions [33–36].
The distribution to the frequency of days with a value of the
clearness index K T has an exponential correlation throughout the
month ranging between the minimum and maximum values
recorded.
The correlation is expressed as:
f ðKTÞ ¼ egK T ,min
2egK T
h i= egK
T ,min2egK
T ,max
h i ð7Þ
Where g is a dimensionless parameter that defines the particular
exponential distribution, given by:
g ¼ 1:498þ½1:184x227:182eð1:5xÞ=ðK T ,maxK T ,minÞ ð8Þ
Where x is also a dimensionless parameter given by:
x ¼ ðK T ,maxK T ,minÞ=ðK T ,maxK T ,avÞ ð9Þ
The minimum and maximum values of K T K T,max and K T,min
respectively, are given by:
K T ,min ¼ 0:05 ð10Þ
K T ,max ¼ 0:6313þ0:267K T ,av11:9ðK T ,av0:75Þ8 ð11Þ
To obtain a daily clearness index, Knight et al. [7] define daily K T as a function of ndk the day of the month and ndm as the number
of days of the month, with (ndk – 0.5 )/ndm ¼a:
KT ¼ ð1=gÞ ln ð12aÞegK T ,min
þaegK T ,,max
n oh i ð12Þ
Finally, the daily total irradiation, H , is obtained following Eqs.
(1) and (12), where the daily clearness index is multiplied with
daily extra-terrestrial irradiation H 0.
H ¼ K T :H 0 ð13Þ
In summary, with all mentioned equations solved, artificial
months with artificial daily total radiations (H ) are created, where
months are ordered from the lowest to highest radiation level.
H.L. Zhang et al. / Renewable and Sustainable Energy Reviews 22 (2013) 466–481474

8/20/2019 Concentrated solar power plants Review and design methodology.pdf
http://slidepdf.com/reader/full/concentrated-solar-power-plants-review-and-design-methodologypdf 10/16
5.2.2. Sequence of days
Daily total radiation data results from Eqs. (1) and (13) are
obtained in a predefined sequence through the month by varying
radiation levels in an ascending and descending pattern;. How-
ever, the sequence of days in which they succeed each other is
unknown, and obviously does not strictly follow an ascending or
descending order, but rather present a random occurrence
sequence.
Knight et al.[7] and Graham et al. [37,38] apply a separatemethodology to obtain the 31 clearness indexes which succeed
each other in a month (with 31 days) and propose a particular
sequence to organize the clearness indexes as shown in Table 6.
This technique is currently used to generate typical years in
simulation programs such as TRNSYS [23].
5.2.3. Estimation of the hourly diffuse and beam radiation
As CSP plants accept only DNI, diffuse irradiation is subtracted
from the global irradiation to obtain the beam irradiation, which
is the one we are interested. Direct irradiation follows a constant
direct direction, whilst diffuse irradiation is the part of the global
irradiation that follows different directions due to interactions
with the atmosphere (See Fig. 10).
The daily diffuse irradiation (H d ) is defined by the Erbscorrelations [39]: the daily total diffuse fraction depends on the
sunset hour angle (ws ) and is defined as:
For wsr81.41
H d=H ¼ 120:2727K T þ 2:4495K 2T 11:951K 3T þ 9:3879K 4T if K T o0:715
¼ 0:143 if K T Z0:715
ð14Þ
For wsZ81.41
H d=H ¼ 1þ0:2832K T 2:5557K 2T þ 0:8448K 3T if K T o0:715
¼ 0:175 if K T Z0:715 ð15Þ
With H and H d calculated for each day.
The hourly irradiation (I ) is obtained by the ratio of hourly todaily total irradiation (r t ) which is defined by the following
equation from Collares–Pereira and Rabl [39] as function of the
hour angle (w in radians) and the sunset hour angle (wS):
r t ¼ I =H ¼ ðp=24Þ½a þbcosðw Þf½cosðw Þcosðw sÞ=½sinðw sÞpw scosðw sÞ=180g
ð16Þ
With a and b constants given by:
a ¼ 0:409þ 0:5016sinðw s60p=180Þ ð17Þ
b ¼ 0:66090:4767sinðw s60p=180Þ ð18Þ
Based on Liu and Jordan [4], assuming that I d=H d is the same as
I 0=H 0 , where is I 0 the hourly extra-terrestrial irradiation, the
hourly diffuse irradiation I d is obtained as the ratio of hourlydiffuse to daily diffuse irradiation r d, which is defined as:
r d ¼ I d=H d ¼ ðp=24Þf½cosðw Þcosðw sÞ=½sinðw sÞpw scosðw sÞ=180g
ð19Þ
Finally, hourly beam irradiation I b is calculated by subtracting I dfrom I .
As a result, hourly global and beam irradiation data for every
day of the year (typical year of 365 days) are obtained for each
location, which will be used as an input for the heliostat field.
The results of the calculations will be given and discussed in
Section 7.
5.2.4. Shortcut estimates, based on recorded temperatures
The previous methodology related the radiation flux to the
sunshine duration. A considerable amount of information is todayavailable on the relationship between the solar irradiation and
other meteorological parameters such as cloud-cover, amount of
rain, humidity and/or temperature. The parameter that has the
largest measurement network is the ambient temperature, and a
shortcut method to relate the extra-terrestrial solar irradiation to
the average daily solar irradiation.
These different methods were reviewed by Gajo et al. [40],
relating H to T max, T min or T mean.
The authors found that the original Hargreaves method per-
formed overall best for different locations.
The Hargreaves method predicts K T as:
K T ¼ kRS ðT max2T minÞ0:5 ð20Þ
The adjustment coefficient kRS is empirical and differs for‘interior’ or ‘coastal’ regions:
for ‘interior’ locations, where land mass dominates and air
masses are not strongly influenced by a large water body,kRS 0.16;
for ‘coastal’ locations, situated on or adjacent to the coast of a
large land mass and where air masses are influenced by a
nearby water body, kRS 0.19.
The temperature difference method is recommended for loca-
tions where it is not appropriate to import radiation data from a
regional station, either because homogeneous climate conditions
Fig. 10. Direct and diffuse irradiation.
Table 6
Sequence model of the daily clearness indexes.
Mean clearness index ( K T,av ) S eque nce of days t hr oug h t he month
K T,av o¼0.45 24-28-11-19-18-3-2-4-9-20-14-23-8-16-21-26-15-10-22-17-5-1-6-29-12-7-31-30-27-13-25
0.45o K T,av o¼0.55 24-27-11-19-18-3-2-4-9-20-14-23-8-16-21-7-22-10-28-6-5-1-26-29-12-17-31-30-15-13-25
K T,av
4
0.55 24-27-11-4-18-3-2-19-9-25-14-23-8-16-21-26-22-10-15-17-5-1-6-29-12-7-31-20-28-13-30
H.L. Zhang et al. / Renewable and Sustainable Energy Reviews 22 (2013) 466–481 475

8/20/2019 Concentrated solar power plants Review and design methodology.pdf
http://slidepdf.com/reader/full/concentrated-solar-power-plants-review-and-design-methodologypdf 11/16
do not occur, or because data for the region are lacking. For island
conditions, the methodology of Eq. (20) is not appropriate due to
moderating effects of the surrounding water body.
Since T max and T min data are indeed widely available, the
Hargreaves K T -values can be used in the methodology of Section
5.1, and results of the both methods will be illustrated in Section 7.
6. Model parameters
6.1. Common measurement methods of solar radiation
Solar radiation can be measured with pyranometers, radio-meters or solarimeters. The instruments contain a sensor installed
on a horizontal surface that measures the intensity of the total
solar radiation, i.e., both direct and diffuse radiation from cloudy
conditions. The sensor is often protected and kept in a dry
atmosphere by a glass dome that should be regularly wiped
clean. Where pyranometers are not available, solar radiation is
usually estimated from the duration of bright sunshine. The
actual duration of sunshine, n, is measured with a Campbell–
Stokes sunshine recorder. This instrument records periods of
bright sunshine by using a glass globe that acts as a lens. The
sun rays are concentrated at a focal point that burns a hole in a
specially treated card mounted concentrically with the sphere.
The movement of the sun changes the focal point throughout the
day and a trace is drawn on the card. If the sun is obscured, the
trace is interrupted. The hours of bright sunshine are indicated by
the lengths of the line segments.
6.2. Available information
There are two reliable sources that provide information on the
two of the most basic meteorological parameters: monthly mean
temperature and solar radiation. These sources are the NASA
website [41] and TUTIEMPO [42]. NASA has produced a grid map
of the longitude. The solar radiation data are an estimate that has
been produced from satellite-based scans of terrestrial cloud-cover. Note that NASA does not provide the mean-daily maximum
and minimum temperature. TUTIEMPO on the other hand pro-
vides daily mean, maximum and minimum temperature data for
any given location. The data are based on measurements carried
out by a wide network of meteorological stations and hence these
latter data are very reliable. Note that the NASA data are available
on a mean-monthly basis, whereas TUTIEMPO are downloadable
on a day-by-day basis. It is important to remember that NASA
data are based on satellite observations that represent inferred
values of irradiation; in contrast, TUTIEMPO provides ground-
measured data for temperature. Hence, if reliable regressions are
available between irradiation and mean temperature, then the
latter data may be used to obtain more realistic estimates of
irradiation.
Table 7
Selected locations with basic data.
Location Latitude
(rad)
Longitude
(rad)
H av (Jan)
(kW h/m2 day)
H av (Jul)
(kW h/m2 day)
Jan Jul
T max (1C) T min (1C) T max (1C) T min (1C)
Chuquicamata, Chile 22.5 68.9 8.32 4.99 25.2 5.8 21.1 1.5
Upington, RSA 28.5 21.08 7.93 3.89 36.7 20.5 21.5 1.5
Geraldton, Australia 28.78 114.61 8.28 3.41 33.6 19.3 19.7 9.1
Sevilla, Spain 37.41 5.98 2.56 7.80 15.9 7.6 35.7 19.9Font Romeu, France 42.5 2.03 1.81 6.17 9.5a 0.1a 26.9a 14.2a
Marrakech , Morocco 3 1.6 8 3.49 7.26 21.4 6.6 37.3 19.8
Sainshand, Mongolia 44.89 110.14 2.21 6.11 18.5b 34.7b 23.5b 9.4b
Ely, USA 39.3 114.85 2 .56 7.38 3.3 13 31.3 9.7
a Data taken from nearby Albi.b Data taken from nearby Ulan Bator.
Fig. 11. Calculated values of H 0.Fig. 12. Calculated average monthly clearness index by the model [Eq. (1)]
and by the Hargreaves method [Eq. (21)] at Upington (RSA).
H.L. Zhang et al. / Renewable and Sustainable Energy Reviews 22 (2013) 466–481476

8/20/2019 Concentrated solar power plants Review and design methodology.pdf
http://slidepdf.com/reader/full/concentrated-solar-power-plants-review-and-design-methodologypdf 12/16
6.3. Selected locations
To illustrate the use of the methodology of Sections 5, 8
locations were selected because of being already associated with
CSP, or announced as potential sites for STP. The essential data of
the locations are given is Table 7.
7. Results and discussion
7.1. Calculations of H 0, H and H b
Having developed the underlying equations of the calculation
method in Section 5, and using the data acquisition of Section 6,
the present section will illustrate the use of the data obtained.The monthly extra-terrestrial irradiation, H 0, computed by Eq.
(6), is illustrated in Fig. 11 for different latitudes in both hemi-
spheres and shows the seasonal dependence, whilst also illustrat-
ing the maximum and minimum values obtained throughout
the year.
To proceed with the calculation of the monthly average
clearness index, K T,av Eq. (1) is used together with NASA-data
[41]. Results are illustrated as example in Fig. 12 for the Upington
location. The Figure also includes the results obtained from the
Hargreaves method [Eq. (21)] using TUTIEMPO-data [42]. Clearly,
both methods provide similar results of K T,av for most of the
months, however with higher Hargreaves-values in Spring and
Autumn. The model approach thus provides slightly more con-
servative K T,av values, and is recommended for design.The daily total irradiation is thereafter obtained by applying
the daily clearness index, K T , and the daily extra-terrestrial
irradiation H 0. Fig. 13 shows the model-predicted total daily
irradiation, ordered in ascending daily pattern for Upington, for
a summer month (January) and a winter month (July). The
monthly average H, calculated by Eq. (13) in January and July, is
7.92 kW h/m2-day and 3.92 kW h/m2-day, respectively. Similar
evolutions can be obtained for the other selected locations.
Applying the Knight et al. [7] sequence model for the daily
clearness indexes, as function of K T,av transforms the ascending
nature of the consecutive days into a wave-function, although
monthly average values of H remain unchanged.
A similar evolution can be predicted using daily K T -values
resulting from the daily T max and T min data, according to Eq. (21).
Fig. 13. The total daily radiation for Upington in (a), January (summer) and (b), July (winter).
Fig. 14. The monthly average I d /I ratio for Chuquicamata (Chile).
Fig. 15. The daily solar beam irradiation, H b, on the 15th of January and on
the 15th of July , for different locations in both the Southern and Northern
Hemisphere.
H.L. Zhang et al. / Renewable and Sustainable Energy Reviews 22 (2013) 466–481 477

8/20/2019 Concentrated solar power plants Review and design methodology.pdf
http://slidepdf.com/reader/full/concentrated-solar-power-plants-review-and-design-methodologypdf 13/16
These results are also shown in Fig. 13. Clearly, the Hargreaves
approach provides a more constant H -value throughout the
month since not respecting an ascending daily pattern. The
monthly average value of H (H RG) is closely related to the model
predictions: 7.56 kW h/m2-day in January, and 4.07 kW h/m2-day
in July, i.e., a deviation of 4.5% and 3.8% only with the pre-cited
values of the model-predicted average values.
The most important result towards CSP design requires the
direct (beam) irradiation, obtained by withdrawing the diffuseirradiation, H d, from the total irradiation, H , according to Eqs. (14)
and (15).
The ratio of the diffuse to total irradiation is illustrated for
Chuquicamata in Fig. 14: the more cloudy winter season (April–
August) is reflected in the higher value of the ratio.
The resulting beam radiation, H b, for representative days in
Summer and winter, for all locations, is shown in Fig. 15, whereas
a more detailed monthly average evolution for some locations, is
shown in Fig. 16.
Finally, a complete hourly evolution can be predicted by the
model, as illustrated in Fig. 17, where the radiation flux can be
seen to increase from sunrise to noon, and thereafter decreasing
again till sunset.
It is also clear that the selection of the CSP nominal capacity
will be a compromise between the seasons, accounting for the
capability of thermal storage, and the use of a backup system.
7.2. Methodology to apply the predictions in CSP design
Having established the annual, monthly and daily levels of
direct (beam) solar irradiation, its impact on the power yield of
the CSP can be assessed. To do so, it should be remembered that
each of the operations of the overall CSP-layout has its own
efficiency, reflected in its overall efficiency. The projected overall
efficiency of CSP plants was assessed by S&L and SNL, as
presented in Table 8, including projected increased efficiencies
as a result of present and future improvements.The efficiencies of the essential components has been reported
by S&L, and represented in Table 9.
Considering that about 10% of the generated electricity will be
used internally for the plant utilities (mostly pumping), 90% of the
combined efficiencies do indeed vary between 14 and 18%.
The final CSP performance simulation follows the strategy of
Fig. 18, with a specific algorithm to be used, in terms of DNI, TES
and BS, as previously presented in Fig. 9.
DNI is calculated on hourly bases
The total energy flux reflected by the heliostat field is
calculated
The expected nominal capacity of the plant is selected
21 consecutive days of lowest radiation levels are selected to
coincide with the maintenance period, thus limiting losses
during plant stand-still
From a given starting day of the year, e.g., January 1st., at 6:00
a.m., and repeated for all hours of the year, the following
different options need to be assessed:
If the solar thermal flux exceeds the required value tooperate the plant at nominal capacity, only solar thermal
energy will be used, whilst excess solar energy is stored in
the HTF hot storage tank. The BS-system is not used, and
additional excess solar thermal energy cannot be used;
If the solar thermal flux is insufficient to meet the nominal
capacity, but enough thermal energy is stored in the hot
tank, no BS is needed, and the plant will operate on
combined solar radiation and stored energy;
If the combined solar thermal flux and energy stored are
insufficient, the plant needs to operate in its hybrid con-
figuration, using the BS to meet the thermal requirements.
The detailed simulations are extensive, and are not included in
the present paper. They will be reported upon in a follow-up
Table 8
Projected overall CSP efficiency.
Year of projection 2004 2004 2008 2008 2020 2020
Annual overall CSP efficiency (%) 13.0 13.7 16.1 16.6 17.3 18.1
Source of estimation S&L SNL S&L SNL S&L SNL
Table 9
Values of CSP-component efficiencies.
Component Efficiency (%)
Solar field 48–50
TES 499
Power block 40
Fig. 17. Hourly evolution at the 15th of the respective months, in Chuquicamata
(Chile).
Fig. 16. Evolution of the average monthly direct (beam) irradiation in 8 locations.
H.L. Zhang et al. / Renewable and Sustainable Energy Reviews 22 (2013) 466–481478
8/20/2019 Concentrated solar power plants Review and design methodology.pdf
http://slidepdf.com/reader/full/concentrated-solar-power-plants-review-and-design-methodologypdf 14/16
paper, considering the application of the solar tower collector,
with molten salt HTF/TES, and with natural gas-fired BS. The
turbine capacity will be 19.9 MWel, chosen because of the
extensive data available for the Gemasolar plant (Spain). Such
simulations will be carried out for those locations where the
annual average daily irradiation flux exceeds 4 kW h/m2-day.
Due to parasitics (electricity use within the plant for pumps,
cooling towers, compressors, instrumentation and controls, light-
ing, heat tracing,.), estimated at 10% for a Gemasolar-type hybrid
application, the net output to the grid will be 17.9 MWel during the
period of operation. The annual power yield of the hybrid Gema-
solar plant is 110 GW h/year [2]. The specific energy production,i.e., the ratio of total annual grid energy and the rated net power
output of the plant is therefore 110,000/17.9¼ 6145 h/year. For
total of 8760 h/year, the overall yield is 70.1%, assumed realistic in
view of the annual maintenance period (zero production), short
duration disturbances, and very low solar irradiation in winter. As
will be shown hereafter for the Chiquicamata example, 69.5 GW h/
year will be generated from the solar energy alone (the remaining
turbine power being generated by the back-up natural gas system).
The average net solar yield thus represents 69,500/17.9 ¼3882 h/
year, or 44.3% (for the 8760 h annual operation).
For the simulations, it is considered that the plant works with
a thermodynamic cycle in a steady state.
If a total energy production needed from the turbine is
19.9 MWel, the efficiencies of the different CSP components willdetermine the hourly heat flow along the system, from heliostats
to turbine and grid. The system flow sheet is illustrated in Fig. 19,
and the additional required information for each step of the
sequence is given below in different notes.
The total energy of 19.9 MWel in the steam turbine must be
reached each hour, with part of this energy added to the molten
salts in the receiver (reflected by the heliostat field), and the rest
of the energy added by the storage system, and/or by the back-up
system (when receiver and storage energies are insufficient)
according to Fig. 9 and the strategy of Fig. 18. By simulating the
plant performance at the heliostat and receiver levels, the addi-
tional energy required by the storage system and the backup
system can be determined. Molten salt properties at each point of
the thermodynamic cycle are fixed and known
Note 1. Heliostat field
Since the heliostats follow the sun by a two-axis tracking, no
correction for the incident angle y must be made (cos y¼1), and I bcorresponds to the real hourly irradiation at the heliostat field.
First, the energy reflected by the heliostat field must be calculated
each hour, where hourly radiation data is extracted from thecalculations of Sections 5 and 6 before. The total energy reflected
by the heliostat field and concentrated in the receiver is then
determined by the heliostat field efficiency and the heliostat field
reflective surface area. The heliostat field efficiency (ZHF ) is mostly
characterized by its reflectivity, optical efficiency, heliostat corrosion
avoidance and cleanliness. A value of 48 to 50% is commonly used
(Table 9).
Note 2. Receiver
The reflected energy is concentrated in the receiver, which acts
as a heat exchanger where circulating molten salts absorbs solar
energy. Total energy absorbed by molten salts is determined by
the receiver efficiency, where receiver thermal losses are primar-
ily driven by the thermal emissivity of the receiver panels
Heliostats Field
Characteristics
Solar Radiation Data
Thermal Energy
Storage Characteristics
Plant Efficiencies
Plant Restrictions
Hourly Stored Energy
Demand Supplied by
Solar Energy
Short and Long Term
Backup Requirements
Fig. 18. Performance simulation method.
Heliostatfield
Receiver Thermal
fieldcircuit
Storagetanks
Steamgeneration
Turbine Grid
Parasitics (10%)
Fig. 19. Sequence of the components of the SPT.
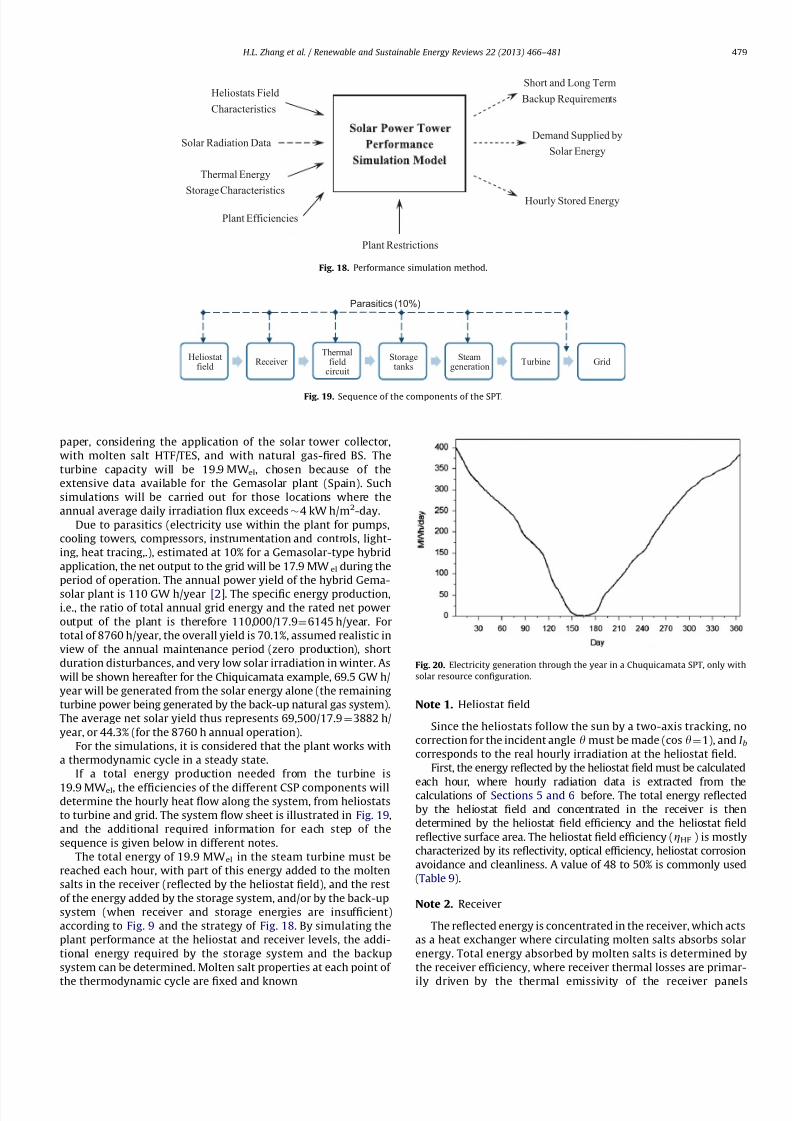
Fig. 20. Electricity generation through the year in a Chuquicamata SPT, only with
solar resource configuration.
H.L. Zhang et al. / Renewable and Sustainable Energy Reviews 22 (2013) 466–481 479

8/20/2019 Concentrated solar power plants Review and design methodology.pdf
http://slidepdf.com/reader/full/concentrated-solar-power-plants-review-and-design-methodologypdf 15/16
(radiation losses) and by the receiver temperature. Commonly,
radiation losses are ‘‘51% [14].
Note 3. THF Circuit and THF storage
Piping and tank losses are very limited, due to the efficient
isolation applied, normally again o1% [14].
Note 4. Steam generation and reheated Rankine cycle
The efficiencies to be considered include the design point turbine
cycle efficiency; start-up losses; partial load operation, and steam
generation system efficiency. Losses due to minimum turbine load
requirements do not apply since the plant has a thermal storage and
back-up system. Commonly, a value of 40% is assigned to the overall
efficiency of the thermal power block of the plant (Table 9).
Note 5. Parasitics (in-plant energy use)
The parasitic consumption considers internal electricity usage
mostly in heliostat tracking, THF pumps, condensate pumps,
feedwater pumps, cooling water pumps, cooling tower fans and
electrical heat tracing system, but additionally in instrumenta-
tion, controls, computers, valve actuators, air compressors, and
lighting. A maximum 10% [13] was measured by Sargent and
Lundy Consulting Group
Considering component efficiencies, a simple estimation of
solar to electricity efficiency (Zsolar) of the plant can be obtained
by using component efficiencies to calculate the total efficiency of
energy transformation.
Zsolar ¼ ZHF Zrec Zpiping Zstorage Zcycle ð1ZparasiticÞ A
Where,
ZHF : Heliostat field efficiency,
Zrec: Receiver efficiency,
Zpiping: Piping efficiency,
Zstorage: Thermal storage efficiency,Zcycle: Power block gross efficiency,
Zparasitic: Parasitics, A ¼ Plant availability (capacity factor).
Initial results of the simulation for the Chuquicamata
initiative, reveal that the solar generation will account for
69.5 GW h/year, in the case of a conservative 13% overall
efficiency.
Figs. 20 and 21 provide some indications of the simulated
results. The zero production between days 150 and 180 corre-
spond with the supposed annual shut-down period for overall
maintenance.
Provided overall efficiencies will increase over the coming
years, due to technical improvements, the solar energy contribu-
tion will increase, thus reducing the required backup, as will be
discussed in a follow-up paper, considering the overall design of
the SPT plant.
8. Conclusions
To determine the optimum design and operation of the CSP
throughout the year, whilst defining the required TES and/or BS,
an accurate estimation of the direct daily solar irradiation
is needed
The paper develops the underlying equations to calculate the
monthly extra-terrestrial irradiation, H 0,
the monthly average clearness index, K T,av the daily total
irradiation, and the direct (beam) irradiation.
Results of the model approach is given for 8 selected locations,
in both Northern and Southern hemisphere.
Having established the annual, monthly and daily levels of
direct (beam) solar irradiation, its impact on the power yield of
the CSP can be assessed. The projected overall efficiency of CSP
plants was assessed and included in a CSP performance simula-
tion, according to a proposed strategy. Initial simulation resultsare illustrated for a 19.9 MWel Solar Power Tower project, with
molten salts as HTF, and operating in an hybrid way (including
heat storage and back up fuel). In the assesses example, solar
generation will account for 69.5 GW h/year, in the case of a
conservative 13% overall efficiency. Provided overall efficiencies
will increase over the coming years, due to technical improve-
ments, the solar energy contribution will increase, thus reducing
the required backup, as will be discussed in a follow-up paper,
considering the overall design of the SPT plant.
References
[1] /http://www.alternative-energy-resources.net/solarenergydisadvantages.
htmlS.
Fig. 21. Monthly backup requirements in the Chuquicamata SPT, in hybrid operating mode.
H.L. Zhang et al. / Renewable and Sustainable Energy Reviews 22 (2013) 466–481480

8/20/2019 Concentrated solar power plants Review and design methodology.pdf
http://slidepdf.com/reader/full/concentrated-solar-power-plants-review-and-design-methodologypdf 16/16
[2] /http://www.torresolenergy.com/TORRESOL/gemasolar-plant/enS.[3] Duffie J, Beckmann W. Solar engineering of thermal processes. 3rd ed.. USA:
John Wiley and Sons; 2006.[4] Liu BYH, Jordan RC. The interrelationship and characteristic distribution of
direct, diffuse and total solar radiation. Solar Energy 1960;4:1–19.[5] Bendt P, Collares-Pereira M, Rabl A. The frequency distribution of daily
insolation values. Solar Energy 1981;27:1–5.[6] Stuart R, Hollands K. A probability density function for the beam transmit-
tance. Solar Energy 1988;40:463–7.[7] Knight K, Klein K, Duffie J. A methodology for the synthesis of hourly weather
data. Solar Energy 1991;46:109–20.
[8] OECD/IEA, technology roadmap, concentrating solar power, 2010.[9] Muller-Steinhagen H, Trieb F. Concentrating solar power: a review of the
technology. Ingenia 2004;18:43–50.[10] Llorente I, Alvarez JL, Blanco D. Performance model for parabolic trough solar
thermal power with thermal storage: comparison to operating plant data.Solar Energy 2011;85:2443–60.
[11] Barlev D, Vidu R, Stroeve P. Innovation in concentrated solar power. SolarEnergy Materials & Solar Cells 2011;95(10):2703–25.
[12] SolarPACES, annual Reports, 2006, 2007, 2008, 2009, 2010. Downloadablefrom: /http://www.solarpaces.org/Library/AnnualReports/annualreports.htmS.
[13] Sargent and Lundy Consulting Group, assessment of parabolic trough andpower tower solar technology cost and performance forecasts, NationalRenewable Energy Laboratory, 2003.
[14] Ortega J, Burgaleta J, Tellex F. Central receiver system solar power plant usingmolten salt as heat transfer fluid, May 2008.
[15] Pitz-Paal R, Dersch J, Milow B, Tellez F, Ferriere A, Langnickel U., et al.Development steps for concentrating solar power technologies with max-
imum impact on cost reduction, 2005. Available at: /http://pre.ethz.ch/publications/journals/full/j138.pdf S.[16] Pitz-Paal R, Dersch J, Milow B, Romero M, Tellez F, Ferriere A., et al. European
Concentrated Solar Thermal Road-Mapping-Executive Summary, CEECOSTAR Contract: SES6-CT-2003-502578. (2005) 144.
[17] Stine W, Geyer M. Power from the Sun, 2001, /http://www.powerfromthesun.net/book.htmlS.
[18] Abengoa solar website. /http://www.abengoa.esS.[19] N.R.E.L. Website, with the collaboration of SolarPaces,/http://www.nrel.gov/
csp/solarpaces/S.[20] /www.guardian.co.uk/environment/2010/oct25/
south-africa-solar-power-plantS.[21] Fernandes D, Pitie F, Caceres G, Baeyens J. Thermal energy storageHow
previous findings determine current research priorities. Energy 2012;39(1):246–57.
[22] Klein SA, Beckman WA. TRNSYS V14.2 (1996). A transient system simulationtool.
[23] Petrakis M, Kambezidis HD, Lykoudis S, Adamopoulos AD, Kassomenos P,Michaelides IM, et al. Generation of a typical meteorological year for Nicosia
Cyprus. Renewable Energy 1998;13(3):381–8.
[24] Pissimanis D, Karras G, Notaridou V, Gavra K. The generation of a typicalmeteorological year for the city of Athens. Solar Energy 2000;40:405–11.
[25] Aguiar RJ, Collares-Pereira M, Conde JP. Simple procedure for generating
sequences of daily radiation values using a library of Markov transitionmatrices. Solar Energy 1988;40:269–79.
[26] Aguiar RJ, Collares-Pereira MTAG. a time-dependent, autoregressive, Gaus-sian model for generating synthetic hourly radiation. Solar Energy
1992;46:167–74.[27] Amato U, Andretta A, Bartoli B, Coluzzi B, Cuomo V. Markow Processes and
Fourier analysis as a tool to describe and simulate daily solar irradiance. Solar
Energy 1986;37:179–94.[28] Graham VA, Hollands KGT, Unny TE. A time series model for K, with
application to global synthetic weather generation. Solar Energy 1988;40:
83–92.[29] Graham VA, Hollands KGT. A method to generate synthetic hourly solar
radiation globally. Solar Energy 1990;44:333–41.[30] Gordon JM, Reddy TA. Time series analysis of daily horizontal solar radiation.
Solar Energy 1988;41:215–26.[31] Mora-Lopez LL, Sodracj de Cardona M. Characterization and simulation of
hourly exposure series of global radiation. Solar Energy 1997;60:257–70.[32] Mora-Lopez LL, Sodracj de Cardona M. Multiplicative ARMA models to
generate hourly series of global irradiation. Solar Energy 1998;63:283–91.[33] Tham Y, Muneer T, Davison B. Estimation of hourly averaged solar irradia-
tion: evaluation of models. Building Services Engineering Research and
Technology 2010;31(1):9–25.[34] Muneer T, Fairooz F. Quality control of solar radiation and sunshine
measurements-lessons learnt from processing worldwide database. BuildingServices Engineering Research and Technology 2002;23(3):151–66.
[35] Hawas MM, Muneer T. Study of diffuse and global radiation characteristics in
India. Energy Conversion and Management 1984;24(2):143–9.[36] Badescu V, Gueymard CA, Cheval S, Oprea C, Baciu M, Dumitrescu A, et al.
Computing global and diffuse solar hourly irradiation on clear sky. Reviewand testing of 54 models. Renewable and Sustainable Energy Reviews
2012;16:1636–56.[37] Graham VA, Hollands KGT, Unny T. A time series model for Kt with
application to global synthetic weather generation. Solar Energy 1988;40(2):83–92.
[38] Graham VA, KGT. Hollands. A method to generate synthetic hourly solarradiation globally. Solar Energy 1990;44(6):333–41.
[39] Tham Y, Muneer T, Davidson B. Estimation of hourly averaged solar irradia-tion: evluation of models. Building Service Engineering Research and Tech-nology 2010;31(1):9–25.
[40] Gajo EJ, Etxebarria S, Tham Y, Aldali Y, Muneer T. Inter-relationship betweenmean-daily irradiation and temperature, and decomposition models for
hourly irradiation and temperature. International Journal of Low-carbonTechnologies 2011;6:22–37.
[41] /http://eosweb.larc.nasa.gov/cgi-bin/sse/[email protected] S.
[42] /http://www.tutiempo.net/en/S.
H.L. Zhang et al. / Renewable and Sustainable Energy Reviews 22 (2013) 466–481 481


