
Computer Science &
Information Technology 20


Sundarapandian Vaidyanathan
Jan Zizka
Computer Science &
Information Technology
The Fourth International Conference on Computer Science, Engineering
and Applications (CCSEA-2014)
Chennai, India, March 07~08, 2014
AIRCC

Volume Editors
Sundarapandian Vaidyanathan,
R & D Centre,
Vel Tech University, India
E-mail: [email protected]
Jan Zizka,
Mendel University in Brno, Czech Republic
E-mail: [email protected]
ISSN : 2231 - 5403
ISBN : 978-1-921987-29-8
DOI : 10.5121/csit.2014.4301 - 10.5121/csit.2014.4312
This work is subject to copyright. All rights are reserved, whether whole or part of the material is
concerned, specifically the rights of translation, reprinting, re-use of illustrations, recitation,
broadcasting, reproduction on microfilms or in any other way, and storage in data banks.
Duplication of this publication or parts thereof is permitted only under the provisions of the
International Copyright Law and permission for use must always be obtained from Academy &
Industry Research Collaboration Center. Violations are liable to prosecution under the
International Copyright Law.
Typesetting: Camera-ready by author, data conversion by NnN Net Solutions Private Ltd.,
Chennai, India

Preface
The Fourth International Conference on Computer Science, Engineering and Applications (CCSEA-2014)
was jointly organized by AIRCC and Vel Tech Dr. RR & Dr. SR Technical University, Chennai, India and
conducted at the Vel Tech Dr. RR & Dr. SR Technical University during March 7-8, 2014. The First
International Conference on Information Technology, Control, Chaos, Modeling and Applications
(ITCCMA-2014), Third International Conference on Embedded Systems and Applications (EMSA-2014),
Second International Conference on Data Mining and Knowledge Management Process (DKMP-2014),
Third International Conference on Cloud Computing: Services and Architecture (CLOUD-2014) and Third
International Conference on Software Engineering and Applications (SEA-2014) were collocated with the
CCSEA-2014. The conferences attracted many local and international delegates, presenting a balanced
mixture of intellect from the East and from the West.
Computer Science and Information Technology (CS & IT) series is an open-access Computer Science
Conference Proceedings (CSCP) series and the goal of this series is to bring together researchers and
practitioners from academia and industry to focus on understanding CS & IT and to establish new
collaborations in these areas. Authors are invited to contribute to the conference by submitting articles that
illustrate research results, projects, survey work and industrial experiences describing significant advances
in all areas of Computer Science and Information Technology.
The ITCCMA-2014, CCSEA-2014, EMSA-2014, DKMP-2014, CLOUD-2014 and SEA-2014 Committees
rigorously invited submissions for many months from researchers, scientists, engineers, students and
practitioners related to the relevant themes and tracks of the workshop. This effort guaranteed submissions
from an unparalleled number of internationally recognized top-level researchers. All the submissions
underwent a strenuous peer review process which comprised expert reviewers. These reviewers were
selected from a talented pool of Technical Committee members and external reviewers on the basis of their
expertise. The papers were then reviewed based on their contributions, technical content, originality and
clarity. The entire process, which includes the submission, review and acceptance processes, was done
electronically. All these efforts undertaken by the Organizing and Technical Committees led to an exciting,
rich and a high quality technical conference program, which featured high-impact presentations for all
attendees to enjoy, appreciate and expand their expertise in the latest developments in computer network
and communications research.
In closing, ITCCMA-2014, CCSEA-2014, EMSA-2014, DKMP-2014, CLOUD-2014 and SEA-2014
brought together researchers, scientists, engineers, students and practitioners to exchange and share their
experiences, new ideas and research results in all aspects of the main workshop themes and tracks, and to
discuss the practical challenges encountered and the solutions adopted. The book is organized as a
collection of papers from the ITCCMA-2014, CCSEA-2014, EMSA-2014, DKMP-2014, CLOUD-2014
and SEA-2014
We would like to thank the General and Program Chairs, organization staff, the members of the Technical
Program Committees and external reviewers for their excellent and tireless work. We sincerely wish that all
attendees benefited scientifically from the conference and wish them every success in their research. It is
the humble wish of the conference organizers that the professional dialogue among the researchers,
scientists, engineers, students and educators continues beyond the event and that the friendships and
collaborations forged will linger and prosper for many years to come.
Sundarapandian Vaidyanathan
Jan Zizka


Organization
General Chairs
David C. Wyld Southeastern Louisiana University, USA
Natarajan Meghanathan Jackson State University, USA
Steering Committee
Abdul Kadhir Ozcan The American University, Cyprus
Brajesh Kumar Kaushik Indian Institute of Technology - Roorkee, India
Dhinaharan Nagamalai Wireilla Net Solutions PTY Ltd, Australia
Eric Renault Institut Telecom–Telecom SudParis, France
John Karamitsos University of the Aegean, Samos, Greece
Khoa N. Le University of Western Sydney, Australia
Program Committee Members
A Vadivel National Institute of Technology Trichy, India
A.G.Ananth R.V. College of Engineering-Bangalore, India
A.Kannan K.L.N. College of Engineering, India
Abdellatif BERKAT Abou-Bekr Belkadd University (Tlemcen), Algeria
Achhman Das Dhomeja University of Sindh, Pakistan
Ajay K Sharma Dr B R Ambedkar NIT, India
Alejandro Regalado Mendez Universidad del Mar. Mexico
Alvin Lim Auburn University, USA
Amandeep Singh Thethi Guru Nanak Dev University Amritsar, India
Asghar gholamian Babol University of Technology, Iran
Ashok kumar Sharma YMCA Institute of Engineering, India
Ayad salhieh Australian College at Kuwait, Kuwait
Azween Bin Abdullah Universiti Teknologi Petronas, Malaysia
Balaji Raj N JJ College of Engineering and Technology, India
Binod Kumar Pattanayak Siksha O Anusandhan University, India
Buket Barkana University of Bridgeport, USA
Carlos E. Otero The University of Virginia's College at Wise, USA
Ch.V.Rama Rao Gudlavalleru Engineering College, India
Choudhari Bhagwati Chaturvedi College of Engineering, India
D.Minnie Madras Christian College, India
Deepak Laxmi Narasimha University of Malaya, Malaysia
Denivaldo LOPES Federal University of Maranhao - UFMA, Brazil
Dinesh Chandrajain University of RGPV, India
Ferdin Joe J Prathyusha Institute of Tech. & Management, India
G.M. Nasira Sasurie College of Engineering, India

Hao Shi Victoria University, Australia
Hao-En Chueh Yuanpei University, Taiwan, R.O.C.
Henrique J. A. Holanda UERN - Universidade do Estado do Rio Grande do
Norte
Indrajit Bhattacharya Kalyani Govt. Engg. College, India
Jalel Akaichi University of Tunis, Tunisia
Jestin Joy Federal Institute of Science and Technology, India
Jyoti Singhai Electronics and Communication Deptt-MANIT, India
Jyotirmay Gadewadikar Alcorn State University, USA
K. Chitra Govt Arts College for Women, India
kalikiri nagi reddy NBKR Institute of Science & Technology, India
Khoa N. Le University of Western Sydney, Australia
Krishna Prasad E S N Ponnekanti (KP) Aditya Engineering College-Kakinada, India
Krishnaveni Avinashilingam University for Women, India
L.Jaba Sheela Anna University, India
lakshmi Rajamani Osmania University, India
Lylia Abrouk University of Burgundy, France
M. Dinakaran VIT University – Vellore, India
M. P. Singh National Institute of Technology Patna, India
M.Hemalatha Karpagam University, India
M.P Singh National Instituite of Technology, India
M.Pravin Kumar K.S.R College of Engineering, India
Madhan KS Infosys Technologies Limited, India.
Michel Owayjan AUST, Lebanon
Mohammed Ali Hussain Sri Sai Madhavi Institute of Science & Tech., India
Mohd. Ehmer Khan Al Musanna College of Technology, Sultanate of Oman
Monika Verma Punjab Technical University, India
Narottam C. Kaushal NIT Hamirpur, India
Nitiket N Mhala B.D.College of Engineering - Sewagram, India
Nour Eldin Elmadany Arab Acadmy for Science and Technology, Egypt
P.Ashok Babu D.M.S.S.V.H. College of Engineering, India
P.Shanmugavadivu Gandhigram Rural Institute - Deemed University, India
P.Thiyagarajan Pondicherry University, India
Patrick Seeling University of Wisconsin, USA
Pravin P. Karde HVPM's College of Engg. & Tech. - Amravati, India
Premanand K.Kadbe Vidya Pratishthan's College of Engineering, India
R. Murali Dr. Ambedkar Institute of Technology, Bangalore
R.Baskaran Anna University - Chennai, India
Rahul Vishwakarma Tata Consultancy Services,ACM, India
Raman Maini Punjabi University, India
Richard Millham University of Bahamas, Bahamas
Roberts Masillamani Hindustan University, India
S.Sapna K.S.R College of Engineering, India
S.Senthilkumar NIT - Tiruchirappalli, India
Salman Abdul Moiz Centre for Development of Advanced Computing, India
Sandhya Tarar Gautam Buddha University, India
Sanjay K, Dwivedi Ambedkar Central University Lucknow, India
Sanjay Singh Manipal University, India

Sanjoy Das Jawaharlal Nehru University, India
Sherif S. Rashad Morehead State University, USA
Shin-ichi Kuribayashi Seikei University, Japan
Shrirang.Ambaji.Kulkarni National Institute of Engineering, India
Sundarapandian V Vel Tech Dr. RR & Dr. SR Technical University, India
T Venkat Narayana Rao Hyderabad ITM , India
Tien D. Nguyen Coventry University, UK
Tuli Bakshi Calcutta Institute of Technology(WBUT), India
Utpal Biswas University of Kalyani, India
V.Radha Avinashilingam University, India
Vijayanandh. R Bharathiar Univ, India
Wichian Sittiprapaporn Mahasarakham University, Thailand
wided oueslati l'institut superieur de gestion de tunis, Tunisia
Zuhal Tanrikulu Bogazici University, Turkey
Technically Sponsored by
Computer Science & Information Technology Community (CSITC)
Software Engineering & Security Community (SESC)
Digital Signal & Image Processing Community (DSIPC)
Organized By
ACADEMY & INDUSTRY RESEARCH COLLABORATION CENTER (AIRCC)
& VEL TECH UNIVERSITY

TABLE OF CONTENTS
Computer Science, Engineering and Applications
Image Segmentation by Modified Map-ML Estimations……………..…………… 1
Mrudula Karande and D. B. Kshirsagar
Energy and Latency Aware Application Mapping Algorithm & Optimization
for Homogeneous 3D Network on Chip…………………………..………..……… 13
Vaibhav Jha, Sunny Deol, Mohit Jha and G K Sharma
An Efficient Feature Selection in Classification of Audio File……..……..……… 29
Jayita Mitra and Diganta Saha
Study on Performance Improvement of Oil Paint Image Filter Algorithm Using
Parallel Pattern Library……………………………...……………………………… 39
Siddhartha Mukherjee
High Level View of Cloud Security : Issues and Solutions………………………… 51
Venkata Narasimha Inukollu, Sailaja Arsi and Srinivasa Rao Ravuri
Multiple DAG Applications Scheduling on a Cluster of Processors……………… 63
Uma Boregowda and Venugopal Chakravarthy
Embedded Systems and Applications
Task & Resource Self-Adaptive Embedded Real-Time Operating System
Micorkernel for Wireless Sensor Nodes…………………………………………… 75
Xing Kexing, Zuo Decheng, Zhou Haiying and HOU Kun-Mean
Analysis of Signal Transition Activity in FIR Filters Implemented by Parallel
Multiplier Accumulator Based on Modified Booth Algorithm…………………… 85
T.S. Udhaya Suriya and P.Rangarajan
Data Mining & Knowledge Management Process
Big Data : Paving the Road to Improved Customer Support Efficiency………… 95
Ajay Parashar

Cloud Computing : Services and Architecture
Cloud-Based Multi-Tenancy Model for Self-Service Portal……………………… 103
Jitendra Maan and Niranjan Mantha
Design Architecture-Based on Web Server and Application Cluster in Cloud
Environment………………………………………………………………………… 111
Gita Shah, Annappa and K.C.Shet
Software Engineering and Applications
Rich Internet Applications, Platforms and Tools - A Paradigm Shift in Web
User Experience………………………………………………………….………… 121
Jitendra Maan and Niranjan Mantha

Sundarapandian et al. (Eds) : CCSEA, EMSA, DKMP, CLOUD, SEA - 2014
pp. 01–12, 2014. © CS & IT-CSCP 2014 DOI : 10.5121/csit.2014.4301
IMAGE SEGMENTATION BY MODIFIED MAP-ML
ESTIMATIONS
Mrudula Karande1 and Prof. D. B. Kshirsagar
2
1Department of Information Technology, K. K. Wagh Polytechnic,
Nashik, India [email protected]
2Department of Computer Engg, S.R. E.S. COE, Kopargaon, India
ABSTRACT
Though numerous algorithms exist to perform image segmentation there are several issues
related to execution time of these algorithm. Image Segmentation is nothing but label relabeling
problem under probability framework. To estimate the label configuration, an iterative
optimization scheme is implemented to alternately carry out the maximum a posteriori (MAP)
estimation and the maximum likelihood (ML) estimations. In this paper this technique is
modified in such a way so that it performs segmentation within stipulated time period. The
extensive experiments shows that the results obtained are comparable with existing algorithms.
This algorithm performs faster execution than the existing algorithm to give automatic
segmentation without any human intervention. Its result match image edges very closer to
human perception.
KEYWORDS
Maximum a Posteriori, Maximum Likelihood, graphcut
1. INTRODUCTION
Image Segmentation is part of Image analysis which leads us to automated comprehension of the
image by the computer. There has been tremendous work done in the field of Image analysis.
Many researchers have developed numerous algorithms to achieve segmentation but till this date
no algorithm has surpassed the segmentation performed by the humans. Also there are issues
regarding the execution time of these algorithms. Since tremendous amount of time is spent in
performing the various complex tasks it takes more time. There has been always a quest for
segmentation algorithm which will work with all types of images and give good performance. In
this paper we had modified the pixel relabeling algorithm in such a way it ultimately leads to
faster execution which gives comparable results with the original existing algorithm [1].
1.1 Related Work
Available image segmentation algorithms can be classified into two groups: contour-based
approaches and region-based approaches. Contour-based approaches try to find the boundaries of
objects in an image, while region-based approaches attempt to split an image into connected
regions. In contour-based approach we generally start with some spline curve and we refine it by

2 Computer Science & Information Technology (CS & IT)
shrink and expansion operations minimizing energy function. One problem existing in these
algorithms is that they are easy to get trapped in local minima. In addition, they need manually
specified initial curves close to the objects of interest. Region-based approaches try to classify an
image into multiple consistent regions or classes. Thresholding is the simplest segmentation
method but its performance is usually far from satisfactory.
Watershed segmentation [2] is one of the traditional region-based approaches. It is used for
images containing touching objects. It finds high intensity regions and low intensity regions. It
suffers from over-segmentation. The various morphological operations are used to handle this
problem. Usually, watershed is used for the segmentation of foreground and background (two-
class) of an image. For a general color image with many different regions, it often gives a bad
result. Hence it is not used widely.
The K-means algorithm [3] is the basic one. However, the K-means is not good enough because it
does not take account of the spatial proximity of pixels. It is, thus, often used in the initialization
step for other approaches.
Expectation-maximization (EM) [4] performs segmentation by finding a Gaussian mixture model
in an image feature space. EM is not suitable for images containing different number of regions.
The disadvantage of EM is that it does not change the number of regions during the segmentation,
which leads to wrong segmentation. Theoretically, the minimum description length (MDL)
principle [4] can be used to alleviate this problem, but the segmentation has to be carried out
many times with different region numbers to find the best result. This takes a large amount of
computation, and the theoretically best result may not accord with this perception.
In [5], a mean shift algorithm is proposed for image segmentation. Mean shift is a nonparametric
clustering technique which neither requires to know the number of clusters in advance nor
constrains the shapes of the clusters However, it often obtains over-segmented results for many
natural images.
Recently, a number of graph-based approaches are developed for image segmentation. Shi and
Malik's [6] normalized cuts are able to capture intuitively salient parts in an image. Normalized
cuts are one of the popular spectral clustering algorithms. Normalized cuts are not suitable for
image segmentation because adhoc approximations are to be considered to relax the NP-hard
computational problem. These vague approximations are ambiguous leading to unsatisfactory
results. Also, due to this, spectral clustering algorithms suffer from the expensive computational
cost.
Another popular segmentation approach based upon MRFs is graphcut algorithm [7]. This
algorithm relies on human interaction, and solves the two-class segmentation problem only, i.e.,
separating an image into only background and object regions, with some manually given seed
points.
In [9], authors have used Fuzzy Rule based graphcut to achieve perfect segmentation. This
method definitely gives better results but is time consuming for segmenting large number of
images.
All of the above techniques have their advantages and disadvantages. Some techniques suffer
from over-segmentation while some of the techniques suffer from under-segmentation. The
MAP-ML [1] algorithm overcomes the disadvantages in above algorithms and gives result more
closely to human perception.

Computer Science & Information Technology (CS & IT) 3
We are going to implement the MAP-ML algorithm on the Berkeley database containing 500
natural images of size 321 x 481 (or 481x321), with ground truth segmentation results obtained
from human subjects for evaluating segmentation algorithm and we will compare the results with
those obtained by state-of-the-art image segmentation algorithms such as Mean Shift and
Normalized Cuts. Section 2 introduces the probability framework used in the algorithm. Section 3
discusses the proposed modified MAP-ML Algorithm. Section 4 discusses the results obtained.
Section 5 concludes our work.
2. PROBABILISTIC MODEL
For a given image P, the features of every pixel p are expressed by a 4-D vector
I(p)=((p), (p), (p), (p))T (1)
where (p), (p), (p) are the components of p in the L*a*b*color space, and (p) denotes the
texture feature of p. In this seminar, the texture contrast defined in [2] (scaled from [0, 1] to
[0,255]) is chosen as the texture descriptor. Fig. 3.4 shows an example of the features.
The task of image segmentation is to group the pixels of an image into relevant regions. If the
problem is formulated as a labeling problem, the objective is then to find a label configuration
= where is the label of pixel p denoting which region this pixel is grouped into.
Generally speaking, a “good” segmentation means that the pixels within a region i should share
homogeneous features represented by a vector () that does not change rapidly except on the
region boundaries. The introduction of () allows the description of a region, with which high
level knowledge or learned information can be incorporated into the segmentation. Suppose that
there are k possible region labels.
A 4-D vector
() = ((), (), (), ()) (2)
is used to describe the properties of label (region), where the four components of () have the
similar meanings to those of the corresponding four components of I(p).
Let = () be the union of the region features. If P and are known, the segmentation is to
find an optimal label configuration, which maximizes the posterior possibility of the label
configuration.
= (, ) (3)
where can be obtained by either a learning process or an initialized estimation. However, due to
the existence of noise and diverse objects in different images, it is difficult to obtain that is
precise enough. Thus, an iterative method is used to solve the segmentation problem.
Suppose that and are the estimation results in the nth iteration. Then the iterative formulas
for optimization are defined as
! = (|, ) (4)
! = ( !|, ) (5)

4 Computer Science & Information Technology (CS & IT)
This iterative optimization is preferred because (4) can be solved by the MAP estimation, and (5)
by the ML estimation.
2.1. MAP Estimation
Given an image P and the potential region features , f is inferred by the Bayesian law, i.e.,
Pr(|, ) can be obtained by
Pr(|, ) = %&(',(|))%& ())%& (',() ∝ (, |) () (6)
which is a MAP estimation problem and can be modeled using MRFs.
Assuming that the observation of the image follows an independent identical distribution,
Pr(, |) is defined as
Pr(φ, P|f) α ∏ exp (−D(p, f44∈% , φ)) (7)
where 78, , 9 is the data penalty function which imposes the penalty of a pixel p with a label
for given . The data penalty function is defined as
78, , 9 = ||() − 89||:
= (() − ()): + (() − ()): + (() − ()): + (() − ()): (8)
MRF’s whose clique potentials involve pairs of neighboring pixels only is considered. Thus
Pr () ∝ exp (− ∑ ∑ =,>>∈?()∈( ( , >)) (9)
where N(p) is the neighborhood of pixel p. =,>(, >), called the smoothness penalty function, is
a clique potential function, which describes the prior probability of a particular label
configuration with the elements of the clique(p, q). The smoothness penalty function is defined as
follows using a generalized Potts model [7]:
=,>8, >9 = @. exp BC∆(,>)E F . G( ≠ >) = @. exp BC|IJ()CIJ(>)|
E F . G( ≠ >) (10)
where ∆(, K) = −|() − (K)|, called brightness contrast, denotes how different the
brightnesses of p and q, c>0 is a smoothness factor, σ > 0 is used to control the contribution of
∆(, K) to the penalty, and T(.) is 1 if its argument is true and 0 otherwise. =,>(, >), depicts
two kinds of constraints. The first enforces the spatial smoothness; if two neighboring pixels are
labeled differently, a penalty is imposed. The second considers a possible edge between p and q;
if two neighboring pixels cause a larger ∆, then they have greater likelihood to be partitioned into
two regions.
In this algorithm, the boundaries of the segmentation result are pulled to match the darker pixels
which are more likely to be edge pixels.
From (6), (7), and (9) the equation can be written as,
Pr(|, ) ∝ 8∏ exp 8−7(, , )9∈( 9. exp 8− ∑ ∑ =,>>∈?()∈( ( , >)9 (11)
Taking the logarithm of (11), the following energy function is as:

Computer Science & Information Technology (CS & IT) 5
L(, ) = ∑ 7(, , )∈( + ∑ ∑ =,>>∈?()∈( ( , >) (12)
where L(, ) ∝ − log Pr (|, ). It includes two parts: the data term
LP = ∑ 7(, , )∈( (13)
and the smoothness term
LQRSST = ∑ ∑ =,>>∈?()∈( ( , >) (14)
From (12), it is clear that maximizing Pr(|, ) is equivalent to minimizing the Markov energy
L(, ) for a given .In this paper, graphcut algorithm is used to solve this minimization
problem.
2.2. ML Estimation
A 4-D vector (i) given by equation 2 is used to describe the properties of label (region). The ML
estimation = () is obtained, where
() = !URV
∑ ())WXY (15)
with Z[Y being the number of pixels within region i. Here (15) is exactly the equation to obtain
(i), (i), (i) and (i) and in (2).
3. PROPOSED MODIFIED MAP-ML ALGORITHM
The MAP-ML [1] is used to segment the image by each object in the same image. The algorithm
starts with finding the texture and contrast feature of every pixel present in the image. The texture
and contrast feature is used to segment the outline of the each object in the image and labelling is
used to delete the unwanted portion of the image and segment each object by each color. The K-
means Algorithm is used for initializations of the regions. The MAP estimation is used to detect
the edges of the image and the color space is used to segment the images by colors. The graph cut
algorithm is an unsupervised algorithm used for over segmentation and computation problem. We
had modified the existing MAP-ML [1] algorithm and the modified algorithm is given below:

6 Computer Science & Information Technology (CS & IT)
After step 4.1, it is possible that two non adjacent regions are given the same label. The MAP
estimation is an NP-hard problem. Boykov et al. [8] proposed to obtain an approximate solution
via finding the minimum cuts in a graph model. Minimum cuts can be obtained by computing the
maximum flow between the terminals of the graph. In [8], an efficient Maxflow algorithm is
given for solving the binary labelling problem. In addition, an algorithm, called α expansion with
the Maxflow algorithm embedded, is presented to carry out multiple labelling iteratively. In this
algorithm, the α expansion algorithm is used to perform step 4.1. To increase the speed of the
algorithm we had used Maxflow 3.01 algorithm.
In the original MAP-ML Algorithm [1], the authors had initiated the MAP-ML algorithm with
default 10 labels and then in the iteration each region is labelled uniquely. Since the number of
labels is unique and increases with each iteration, the time to execute the MAP Estimation goes
up. So instead of that we had kept the initial number of labels=10 by default but we had not
uniquely labelled the regions so thereby the image will have utmost 10 or less than 10 labels
hence the time to take the MAP Estimation is less comparative to original MAP-ML Algorithm.
To achieve the equivalent result as the original we had calculated the standard deviation (camera
noise) for each image automatically since it will be different for each image. It is calculated by
taking expectation of all the pairs of neighbors in an image. So we had obtained results as near as
possible to the original algorithm in less amount of time.
Briefly we can say that the modified algorithm has three enhancements over Original MAP-ML:
1) Use of Maxflow 3.01 Algorithm with the reuse trees option
2) Unlike original algorithm the regions are not labelled uniquely
3) For every image sigma (standard deviation) is calculated. Sigma is an important factor
used in deciding the smoothness penalty for an image. Here it is calculated based on
average value of all pairs of neighbors in an image.
4. EXPERIMENTAL RESULTS Our algorithm is tested on the Berkeley benchmark for evaluating segmentation algorithms and
compares the results with those obtained by state-of-the-art image segmentation algorithms. The
Berkeley database contains 500 natural images of size 321 x 481 (or 481 x 321), with ground
truth segmentation results obtained from human subjects.
The compared algorithms in these experiments include: Mean Shift (MS) [5] and Normalized cuts
(NC) [6]. In this algorithm, the initial cluster number in the K-means algorithm is set to 10 and
the smoothness factor c is 100. The region number in NC is set to 20, which is the average
number of segments marked by the human subjects in each image.
In the MS algorithm the default parameters used are hs=15, hr=13, and the minimal region=20
pixels are chosen. Since NC cannot handle an image of size 321 x 481(or 481 x 321) due to the
overflow of the memory, all the input images for them are shrunk into a size 214 x 320 (or 320 x
214), and the segmentation results are enlarged to their original sizes.
All the above experiments had been conducted on Intel Core 2 Duo 2.2 GHz 4GB RAM
Windows 7 platform. The code has been developed in JAVA which makes it portable.

Computer Science & Information Technology (CS & IT) 7
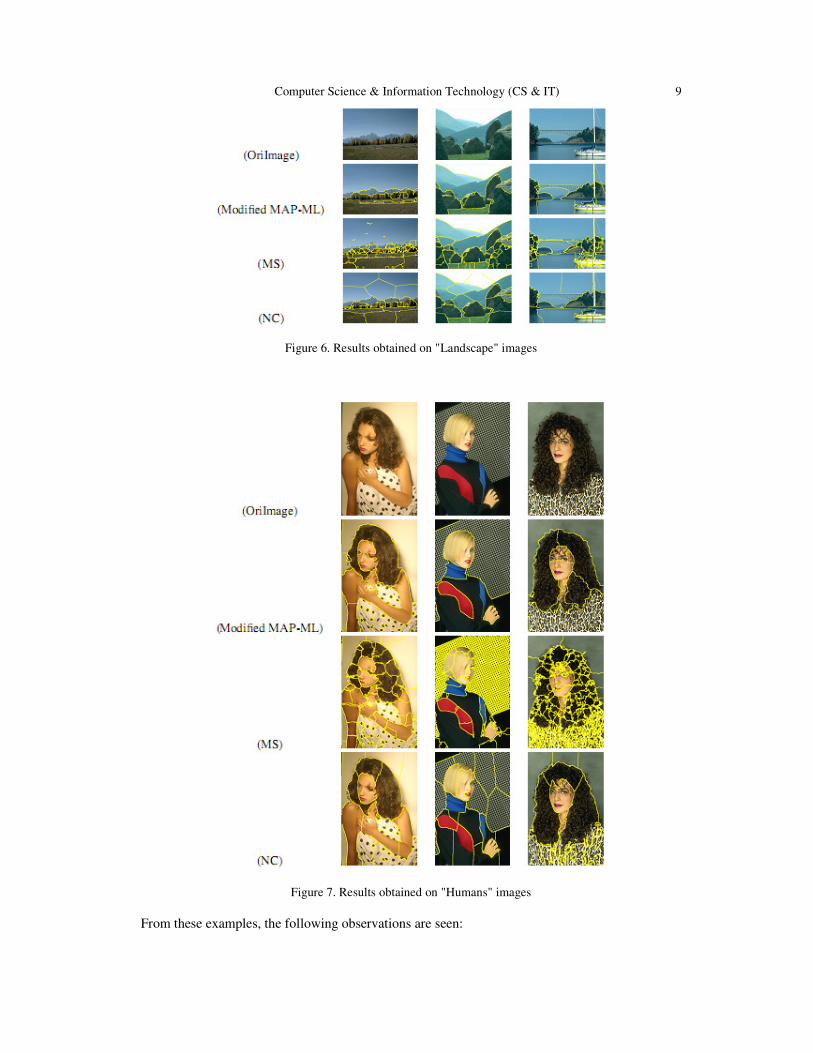
4.1. Qualitative Comparison Results
The part of the images in the Berkeley benchmark is classified into 7 sets ("Landscape",
"Grassplot and Sky", "Craft", "Human", "Bird", "Felid" and "Buildings"), and show the
segmentation results obtained by the three algorithms in Figure 1-7.
Figure 1. Results obtained on "Bird" images
Figure 2. Results obtained on "Buildings" images

8 Computer Science & Information Technology (CS & IT)
Figure 3. Results obtained on "Feline" images
Figure 4. Results obtained on "Craft" images
Figure 5. Results obtained on "GrassPlot and Sky" images
Computer Science & Information Technology (CS & IT) 9
Figure 6. Results obtained on "Landscape" images
Figure 7. Results obtained on "Humans" images
From these examples, the following observations are seen:

10 Computer Science & Information Technology (CS & IT)
NC tends to partition an image into regions of similar sizes, resulting in the region boundaries
different from the real edges. MS give strongly over-segmented results. Compared with these
other algorithms, it is easy to see that this algorithm obtains the best results, in which the
generated boundaries match the real edges well and the segmented regions are in accordance with
human perception.
4.2. Quantitative Comparisons Results
Quantitative comparisons are also important for objectively evaluating the performance of the
algorithms. There have been several measures proposed for this purpose. Region differencing and
boundary matching are two of them. Region differencing measures the extent to which one
segmentation can be viewed as a refinement of the other. Boundary matching measures the
average displacement error of boundary pixels between the results obtained by an algorithm and
the results obtained from human subjects. However, these two measures are not good enough for
segmentation evaluation. For example, a segmentation result with each pixel being one region
obtains the best score using these two measures. A strongly over-segmented result, which does
not make sense to human visual perception, may be ranked good.
In these experiments, two more stable and significant measures, variation of information (VoI)
and probabilistic rand index (PRI) are used to compare the performances of the three algorithms,
to objectively evaluate image segmentation algorithms. Consider a set of ground truths, labelled
by K persons, S1, S2… SK, of an image consisting of N pixels. Let Stest be the segmentation
result to be compared with the ground truths. Then the PRI value is defined as
\(]^Q , ]_) = !B?
:F∑ [>
CaWbc> (1 − >)!CaWb] (16)
where (p, q) is a pixel pair in the image, @> = G(fghijh = f>
ghijh) denotes the event of a pair of
pixels p and q having the same label in the test result Stest ,and > = !k ∑ G(f
gl = f>gl)k
_X!
is regarded as the probability of p and q having the same label. The VoI value is defined as
=m(]^Q , ]_) = !k ∑ [n(]^Q_ ) + n(]_) − 2(]^Q , ]_)] (17)
where H and I denote the entropy and the mutual information, respectively.
VoI is an information-based measure which computes a measure of information content in each
of the segmentations and how much information one segmentation gives about the other. It is
related to the conditional entropies between the region label distributions of the segmentations.
PRI compares an obtained segmentation result with multiple ground truth images through soft
non uniform weighting of pixel pairs as a function of the variability in the ground truth set. The
value of VoI falls in [0,∞], and the smaller, the better. The value of PRI is in [0,1], and the larger,
the better.
The average values of PRI and VoI for the three algorithms are given in Table 1. In this table, the
second column shows the average PRI and VoI values between different human subjects, which
are the best scores. From these results, one can see that this algorithm outperforms the other
algorithms because it obtains the smallest VoI value and the largest PRI value. Among other
algorithms, MS gives sometimes better PRI values to this algorithm. However, their VoI values
are much larger than algorithm.

Computer Science & Information Technology (CS & IT) 11
Table 1. Average Values of PRI and VOI on the images.
To demonstrate the performances of these algorithms on each image, the PRI and VOI curves are
shown in Figure 8 (default 10 labels) and Figure 9 (default 20 labels). It is clearly observed
that modified algorithm performs the best. There is slight trade off between speed and accuracy in
the modified MAP-ML Algorithm. The elapsed time calculated between original MAP-ML and
modified MAP-ML Algorithm is shown in Figure 10.
Figure 8. PRI and VOI values achieved on individual images by the three algorithms when default labels
are 10. The values are plotted in increasing order.
Figure 9. PRI and VOI values achieved on individual images by the three algorithms when default labels
are 20. The values are plotted in increasing order.
Figure 10. Elapsed time Comparison between Original MAP-ML and Modified MAP-ML Algorithm when
default labels are a) 10 and b) 20. The values are plotted in increasing order.

12 Computer Science & Information Technology (CS & IT)
4.3. Application
So far, general segmentation has two main applications. The first one is the group of algorithms
for specific objects, like for medical image. The second one is as a part of the algorithms for the
other algorithms, like recognition, classification; et al. Good segmentation results may improve
the final results. This image segmentation can be used as a part of video surveillance system such
that our final goal is to cutout the moving objects video sequences and track the objects.
5. CONCLUSION
We had implemented our modified MAP-ML algorithm which gives comparable results with the
original MAP-ML algorithm performing the image segmentation. Thus from the experimental
results we had successfully shown that the modified MAP-ML algorithm takes less time to
execute as compared to the original MAP-ML algorithm giving nearly same results as the original
algorithm.
REFERENCES
[1] Shifeng Chen, Liangliang Cao, Yueming Wang, Jianzhuang Liu (September 2010), "Image
Segmentation by MAP-ML Estimations", IEEE Trans. on Image Processing, vol. 19, No. 9, pp. 2254-
2264.
[2] L. Vincent and P. Soille, "Watersheds in digital spaces: An efficient algorithm based on immersion
simulations", IEEE Trans. Pattern Anal. Mach. Intell., vol.13, no. 6, pp. 583-598, Jun.1991.
[3] R. Duda, P. Hart, and D. Stork, "Pattern Classification", 2nd ed. Hoboken, NJ: Wiley, 2001.
[4] C. Carson, S. Belongie, H. Greenspan, and J. Malik, "Blobworld: Image segmentation using
expectation-maximization and its application to image querying", IEEE Trans. Pattern Anal. Mach.
Intell., vol. 24, no. 8, pp. 1026-1038, Aug. 2002.
[5] D. Comaniciu and P. Meer, "Mean shift: A robust approach toward feature space analysis", IEEE
Trans. Pattern Anal. Mach. Intell., vol. 24, no. 5, pp. 603-619, May 2002.
[6] J. Shi and J. Malik, "Normalized cuts and image segmentation", IEEE Trans. Pattern Anal. Mach.
Intell., vol. 22, no. 8, pp. 888-905, Aug. 2000.
[7] V. Kolmogorov and R. Zabih, "What energy functions can be minimized via graph cuts?", IEEE
Trans. Pattern Anal. Mach. Intell., vol. 26, no. 2, pp. 147-159, Feb. 2004.
[8] Y. Boykov, O. Veksler, and R. Zabih, "Fast approximate energy minimization via graph cuts", IEEE
Trans. Pattern Anal. Mach. Intell., vol.23, no. 11, pp. 1222-1239, Nov.2001.
[9] Muhammad Rizwan, Khokher, Abdul Ghafoor, Adil Masood Siddiqui, "GraphCuts based Image
Segmentation using Fuzzy Rule Based System", IEEE Radio Engineering, vol . 21, no. 4, Dec 2012,
pp. 1236-1245.
AUTHORS Mrudula Karande received the B.E. (Comp) degree from the Nagpur University of India, in
2001, the M.E.(Comp. Engg) degree from the Pune University, in 2013 in first class. She is
working as the Head of the Department of Information Technology in K. K. Wagh
Polytechnic, Nashik India. Her research interests include image processing and data mining.
Prof. D. B. Kshirsagar received the B.E. (CSE), Computer Engineering, from the Walchand
College of Engineering, Sangli, M.E. (CSE), Engineering degree from Shivaji University in
first class with distinction and is currently pursuing Phd. He is working as the Prof. and the
Head of the Department of Computer Engg in S. R. E. S. COE Kopargaon, India. His
research interests include image processing.

Sundarapandian et al. (Eds) : CCSEA, EMSA, DKMP, CLOUD, SEA - 2014
pp. 13–27, 2014. © CS & IT-CSCP 2014 DOI : 10.5121/csit.2014.4302
ENERGY AND LATENCY AWARE APPLICATION
MAPPING ALGORITHM & OPTIMIZATION FOR
HOMOGENEOUS 3D NETWORK ON CHIP
Vaibhav Jha1, Sunny Deol
1, Mohit Jha
2 and G K Sharma
1
1Department of Computer Science & Engineering, Indian Institute of
Information Technology and Management, Gwalior, Madhya Pradesh 474015 [email protected],[email protected]
2Department of Electrical Engineering, Jabalpur Engineering College,
Jabalpur, Madhya Pradesh 482011 [email protected]
ABSTRACT
Energy efficiency is one of the most critical issue in design of System on Chip. In Network On
Chip (NoC) based system, energy consumption is influenced dramatically by mapping of
Intellectual Property (IP) which affect the performance of the system. In this paper we test the
antecedently extant proposed algorithms and introduced a new energy proficient algorithm
stand for 3D NoC architecture. In addition a hybrid method has also been implemented using
bioinspired optimization (particle swarm optimization) technique. The proposed algorithm has
been implemented and evaluated on randomly generated benchmark and real life application
such as MMS, Telecom and VOPD. The algorithm has also been tested with the E3S benchmark
and has been compared with the existing algorithm (spiral and crinkle) and has shown better
reduction in the communication energy consumption and shows improvement in the
performance of the system. Comparing our work with spiral and crinkle, experimental result
shows that the average reduction in communication energy consumption is 19% with spiral and
17% with crinkle mapping algorithms, while reduction in communication cost is 24% and 21%
whereas reduction in latency is of 24% and 22% with spiral and crinkle. Optimizing our work
and the existing methods using bio-inspired technique and having the comparison among them
an average energy reduction is found to be of 18% and 24%.
KEYWORDS
Network on Chip, Mapping, 3D Architecture, System on Chip, Optimization
1. INTRODUCTION
The scaling of microchip technologies has resulted into large scale Systems-on-Chip (SoC), thus
it has now become important to consider interconnection system between the chips. The
International Technology Road-map for Semiconductors depicts the on-chip communication
issues as the limiting factors for performance and power consumption in current and next
generation SoCs [1] [2] [3]. Thus Network on chip has not only come up with an alternative for
the SoC, it has also solved the problem faced in the traditional bus based architecture and is an
efficient approach towards optimal designs. Although various works has been done in the
optimization of the design and the major area where the design need to be focused are Topology,
Scheduling, Mapping, and Routing [2]. Each area plays an important role in delivering better
14 Computer Science & Information Technology (CS & IT)
performance of the system, but in this paper stress is been given on the mapping of the IP core
onto the 3d architecture.
By mapping of the IP core we mean, assigning the task in the form of the characterization graph
to the given architecture following the design constraint such as area, latency, communication
energy and communication cost which should be minimum. As today’s application are becoming
much more complex their average communication bandwidth are in Gbps and as technology is
scaling down, in future a single application would be running on single core thus the bandwidth
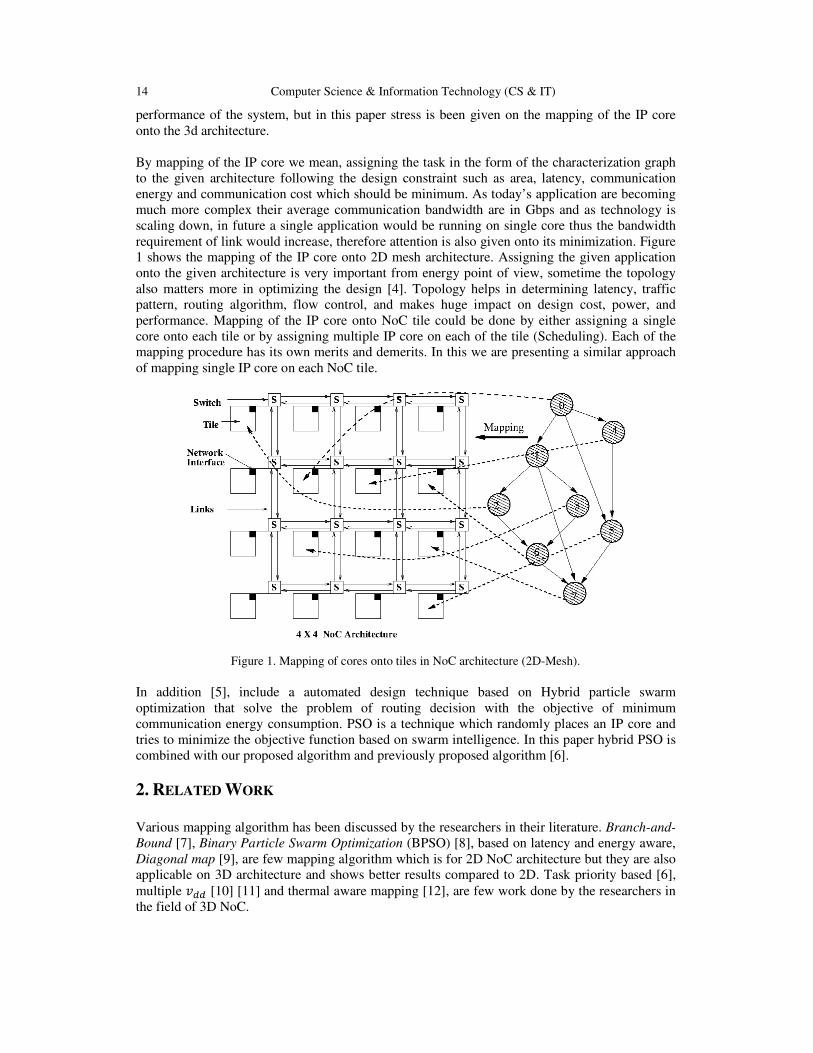
requirement of link would increase, therefore attention is also given onto its minimization. Figure
1 shows the mapping of the IP core onto 2D mesh architecture. Assigning the given application
onto the given architecture is very important from energy point of view, sometime the topology
also matters more in optimizing the design [4]. Topology helps in determining latency, traffic
pattern, routing algorithm, flow control, and makes huge impact on design cost, power, and
performance. Mapping of the IP core onto NoC tile could be done by either assigning a single
core onto each tile or by assigning multiple IP core on each of the tile (Scheduling). Each of the
mapping procedure has its own merits and demerits. In this we are presenting a similar approach
of mapping single IP core on each NoC tile.
Figure 1. Mapping of cores onto tiles in NoC architecture (2D-Mesh).
In addition [5], include a automated design technique based on Hybrid particle swarm
optimization that solve the problem of routing decision with the objective of minimum
communication energy consumption. PSO is a technique which randomly places an IP core and
tries to minimize the objective function based on swarm intelligence. In this paper hybrid PSO is
combined with our proposed algorithm and previously proposed algorithm [6].
2. RELATED WORK
Various mapping algorithm has been discussed by the researchers in their literature. Branch-and-
Bound [7], Binary Particle Swarm Optimization (BPSO) [8], based on latency and energy aware,
Diagonal map [9], are few mapping algorithm which is for 2D NoC architecture but they are also
applicable on 3D architecture and shows better results compared to 2D. Task priority based [6],
multiple [10] [11] and thermal aware mapping [12], are few work done by the researchers in
the field of 3D NoC.

Computer Science & Information Technology (CS & IT) 15
Energy and performance aware mapping using Branch and Bound (PBB) [7] maps the IP core on
the basis of the PBB technique in which mapping complexity increases exponentially as the
number of the core increases. Another concept of mapping in which the author has focused on
latency and energy using the BPSO [8] has proposed mapping as the NP-hard problem and thus
the heuristic approach is needed for finding the solution. Author has compared result with the
Genetic algorithm and found BPSO optimal. In D-map [9] procedure, mapping is based on the
concept that IP core which is communicating maximum with the rest of the core should be placed
on those NoC tile which has greater number of the neighboring tile attached to it thus in 2D
architecture diagonal tiles are having maximum number of the neighboring tiles.
In mapping procedure using multiple Kostas and Dimitrios, [10] [11] has claimed energy of
the system could be saved either applying better mapping or the routing procedure or by
supplying less voltage to the system and making the design itself optimal. As not each of the
router function every time so author divided the whole of the architecture into two layer and each
of the layer functioning at different voltage of and
. IP core with greater
communication volume are placed onto layer with and those with low in
when
they need to communicate they do with level converter. In his continuing paper [10] author has
compared results with different benchmark of MWD, MPEG, VOPD, MMS etc.
In [6] author has proposed two different method of mapping procedure on 3D NoC design
Crinkle and Spiral and task are organized on the task priority list which is based on the basis of
the maximum communication volume or maximum out-degree. In [12], author has targeted
communication aware used the Genetic algorithm for finding out the optimal mapping solution.
In [8], author proposed a heuristic mapping algorithm based on chaotic discrete particle swarm
optimization technique. The algorithm resolves the mapping problem to optimize the delay and
energy consumption and showing better results than genetic algorithm. In [5], author proposed a
routing technique, based on the Hybrid Particle Swarm Optimization (PSO) Algorithm is applied
on the 2D-Mesh NoC platform to balance the link load and this algorithm is combined with
genetic algorithm, and shown a better results. In [13] author has proposed optimal multi-objective
mapping algorithm for NoC architecture.
3. DEFINITIONS
Definition 1: An application characterization graph (APCG) G = (C,A) is a directed graph, where
each vertex represents selected IP/core, and each directed arc , characterizes the
communication from to . Each , has application specific information such as:
• v(, ) is the arc volume from vertex to , i.e. the communication volume (bits) from
to .
• b(, ) is the arc bandwidth requirement from vertex to .
Definition 2: A NoC architecture can be uniquely described by the triple Arch( T(R, Ch, L), PR ,
(C) ), where:
1) T(R,Ch,L) is directed graph describing the topology. The routers (R), channels (Ch) and the
Layers (L) in the network have following attributes:
a) ∀ (ch) Ch, w(ch) gives the bandwidth of the network channels.
b) ∀ (r) R, I(ch, r) gives the buffer size(depth) of the channel ch, located at router r.
c) ∀ (r) R, Pos(r) specifies the position of router r in the floor plan.
d) ∀ (l) L, Layer(l) specifies the layer of topology.

16 Computer Science & Information Technology (CS & IT)
2) PR(r,s,d) describes the communication paradigm adopted in the network.
s,d,r R, n ⊂ R defines the routing policy at router r for all packets with source s and
destination d.
3) Ω : C → R, maps each core C to a router. For direct topologies each router is connected
to a core, while in indirect topologies some routers are connected only to other routers.
4. PROBLEM FORMULATION
As we are aiming for the minimization of the total communication energy and the total
communication energy () depends on Latency, number of hops count, links energy, and
switch energy [7] [13], therefore minimization of each of these factor will result into reduction of
global . Thus our problem has been formulated as:
Given an APCG G(C,A) and a network topology T(R, Ch, L);
Find a mapping function Ω : C → R which maps each core ϵ C in the APCG to a router r ϵ R
in T(R, Ch, L) so that we get :
min ∑ v(, ) × (( ),! "#)
such that:
∀ ϵ C, map() T
∀ ≠ ϵ C, map() ≠ map ( )
where e(, ) is the average energy consumption of sending 1-bit of data from tile % to % on
which core and are mapped respectively.
Various energy consumption model has been discussed in [7][2], the 1 bit energy consumption in
the NoC architecture as proposed in [7] which is calculated as:
&," = ()* × +,-
+ !()* − 1# × 1,- (1)
where , 1,- is the per bit link energy, +,-
is per bit switch energy , &,"
is the total energy
when one bit is moved from tile 2 to tile 2 , ()* represent the total number of the hops.
Based on below proposed algorithm performance of the system will increased as our approach
reduces the number of hops between source and destination. The performance of the system is
evaluated on the basis of total communication cost which is calculated as
Cost = ∑ 4,"×∀ 56,7,8…|;|,< ()*( i, j )
Latency: In a network, latency is a synonym for delay, is an expression of how much time it takes
for a packet of data to get from one designated point to another and so that average latency is
calculated as:
=%(>?@ = ∑ ()*∀ 56,7,8…|;|,< × ABCC. EBFGC × H
J

Computer Science & Information Technology (CS & IT) 17
where, H = constant related to delay
J = Total number of times transfer occurred of communication volume between source and
destination.
5. PROPOSED ALGORITHM
Assignment of an IP core onto the given architecture is called a mapping. When we map an IP
core onto the given architecture we always try to place those core which is communicating
maximum(B, K) closer to each other, limiting the number of hops travelled by data between
two related cores, thus the gets reduced. As in 2D architecture diagonal tiles(tiles with
degree 4) are having greater number of communicating links, so placing BK onto these tile
and placing rest of unmapped core w.r.t this mapped core onto neighboring tile would reduce the
number of hop count thus would minimize [9].
Similar approach when carried out with the 3D NoC in which the topology is 2D layered
architecture shown in Figure 2, the diagonal tiles of each layer has four adjacent links and one
uplinks and downlinks each. The mapping of highest out-degree core onto diagonal tiles gives the
flexibility of assigning highest communicating unmapped cores much closer to mapped cores.
This helps to minimize the number of hops travelled by data between two communicating core,
which is our aim to minimize the total energy consumption. Question arises how to find the IP
core and arrange them such that it could be mapped in regular fashion. In this paper we have used
the concept of maximum out degree. We find those cores which is having maximum out degree
and order them in an array of descending order, if there are two or more IP cores which is having
same number of the out-degree then we differentiate them on the basis of the Rank which is
calculated as:
Ranking (AB) = ∑ (BCC, + BCC ,)∀ 56,7,8…|;|,<
where BCC, represents the communication volume(in bits) transferred from B to B .
The core to be mapped next is the unmapped core which communicates maximum with the
mapped core.
Figure 2. Mapping of highest out-degree cores onto diagonal tiles (shown in dark shaded).
After arranging the IP cores on the basis of the out-degree and rank, the core with maximum out-
degree is mapped onto the diagonal tiles. Each layer in the architecture is having only one tile
which comes in the list of the diagonal tiles to which these highest out-degree IP core will be

18 Computer Science & Information Technology (CS & IT)
mapped. While mapping we leave the diagonal end tiles as it is having at most only three tile to
which it can communicate. After mapping the core onto the diagonal tile the position of the next
unmapped core is found on the basis of the lozenge shape, in which we apply two rotation namely
L and M rotation. L rotation works out in clockwise direction for odd numbered column and M in
anti-clockwise direction for even numbered column discussed in literature [9]. While mapping the
IP core onto the each layer we apply this rotation for intra-layer tiles only for finding the position
of the next empty tile, but during the mapping process their is possibility that position of the next
empty tile could not be there in the same layer so we need to change the layer. While applying the
rotation we need to change the level of the rotation, the maximum number of the level which can
be changed in each rotation is 2×(n-1), where n is the dimension of the architecture(n×n×n). In
calculation of the energy, latency is also important which is dependent on the routing procedure.
In our work we have used the XYZ routing algorithm for finding out the number of the hops
count.
Following the Algorithm 1 the number of hops count between the two related cores is reduced,
which in turn reduces the total communication energy consumption given in Equation 1.
Algorithm 1 Mapping Algorithm for 3D NoC
--------------------------------------------------------------------------------------------------------------------
Input: APCG G(C,A) and (n×n×n) 3D NoC Topology T(R, Ch, L).
Output: Array M[ ] containing corresponding tile numbers for ∈ C.
1: Initialize: Mapped[ ] = -1;UnMapped[ ] = ∈ C
2: Mapping()
3: Sort ( ∈ C)
4: Store in OD[ ]. in descending order of outdegree & Ranking().
5: for i = 0 to n − 3 do
6: OD[ i ].mapto() → ((7 + ( + 1 ) × (P + 1); 7: Mapped[ i ] = OD[i];
8: Remove OD[ i ] from UnMapped[ ];
9: end for
10: while UnMapped[ ] ≠ empty do
11: for all ∈ UnMapped[ ], select where:
12: max comm(i,j) where i ∈ UnMapped[ ] , j ∈ Mapped[ ];
13: positionof(j); //(row, column, layer) of
14: colno = (j.mapto())%n
15: if (colno% 2 ≠ 0) then
16: while (flag = 0) do
17: alpharotation()
18: if empty tile found then
19: return %R, set flag = 1;
20: else
21: layer+ + || layer- - || (both)
22: alpharotaion()
23: end if
24: end while
25: else
26: while flag = 0 do
27: betarotation()
28: if empty tile found then
29: return %R, set flag = 1
30: else
31: layer+ + || layer- - || (both)

Computer Science & Information Technology (CS & IT) 19
32: betarotation()
33: end if
34: end whilereturns empty tile(%R) using Lozenge shape path.
35: OD[ i ].mapto() → %R
36: Mapped[i] = OD[ i ]
37: Remove OD[ i ] from UnMapped[ ]
38: end if
39: end while
40: calculate_energy() calculates energy for the mapping generated.
--------------------------------------------------------------------------------------------------------------------
6. BIO-INSPIRED OPTIMIZATION ALGORITHMS
In this section brief description of the implemented algorithms like Hybrid PSO, Hybrid ARPSO
and Hybrid QPSO is discussed.
6.1 Particle Swarm Optimization (PSO)
Particle Swarm Optimization (PSO) is based on the movement and intelligence of swarms [14].
The fundamental idea behind PSO is the mechanism by which the birds in a flock (swarm) and
the fishes in a school (swarm) cooperate while searching for food. Each member of the swarm
called particle, represents a potential solution of the problem under consideration. Each particle in
the swarm relies on its own experience as well as the experience of its best neighbor. Each
particle has an associated fitness value. These particles move through search space with a
specified velocity in search of optimal solution. Each particle maintains a memory which helps it
in keeping the track of the best position it has achieved so far. This is called the particle0s
personal best position (pbest) and the best position the swarm has achieved so far is called global
best position (gbest). After each iteration, the pbest and gbest are updated for each particle if a
better or more dominating solution (in terms of fitness) is found. This process continues
iteratively, until either the desired result is converged upon, or its determined that an acceptable
solution cannot be found within computational limits. In search of an optimal solution particles
may trap in local optimal solution, therefore some heuristics can be used to help particles get out
of local optimum. It is proved that PSO Algorithm 2 for IP mapping has worked much better than
various proposed algorithms for routing and task mapping in NoC.
Due to a decrease of diversity (because of clustering of particle) in search space, the PSO tends to
suffer from problem of premature convergence which leads to sub optimal solution. The attractive
and repulsive PSO (ARPSO) algorithm proposed in [15] overcomes the problem of premature
convergence. ARPSO switches between two phases to find an optimal solution:
1) Attraction Phase
2) Repulsion Phase.
In Attraction Phase, particle attracts each other, as in the basic PSO algorithm. In Repulsion
Phase, the individual particle is attracted by its own previous best position (pbest) and repelled by
the global best position (gbest). In this way there is neither total attraction nor total repulsion but
a balance between two.
Algorithm 2 PSO Algorithm for IP Mapping
--------------------------------------------------------------------------------------------------------------------
Let G[ ] be the current best particle after various simulations.
Let nb_eval keeps track on the evaluation number in a simulation.

20 Computer Science & Information Technology (CS & IT)
Let n_exec keeps track on the simulation number, it is initialized to 0.
Let total_cost_min is the minimum energy achieved in a simulation.
Let min_cost is the minimum energy achieved in all simulations executed.
Input: APCG, NoC Topology
Output: Mapping Sequence
1: n_exec ← n_exec + 1
2: for s = 0 to S do
3: initialize X[s] and V [s] randomly
4: X[s].f ← objfn(s) evaluating total_cost(objective function) using Equation 1
5: P[s] ← X[s] local best position of the T) particle
6: end for
7: P[best] ← min_total_cost(P[s])
8: while nb_eval < eval_max do
9: for s = 0 to S do
10: update V [s] and X[s] using equation 2 and 3
11: X[s].f ← objfn(S)
12: if X[s].f < P[s].f then
13: P[s] ← X[s] updating local best position of the T) particle
14: end if
15: if X[s].f < P[s].f then
16: P[s] ← P[best] updating global best position
17: end if
18: end for
19: total_cost_min ← P[best]
20: end while
21: if total_cost_min < min_cost then
22: min_cost ← total_cost_min
23: G[ ] ← P[best]
24: end if
25: if n_exec < n_exec_max then
26: goto 1
27: end if
--------------------------------------------------------------------------------------------------------------------
qPSO proposed in [16], another variant of PSO in which authors present the hybridization of PSO
with quadratic approximation operator (QA), is implemented to solve IP mapping problem to get
an optimal NoC design. The hybridization is performed by splitting the whole swarm into two sub
swarms in such a way that the PSO operators are applied on one sub swarm, whereas the QA
operator is applied on the other sub swarm, ensuring that both sub swarms are updated using the
global best particle of the entire swarm.
Figure 3. A particle representing a solution.
Basic PSO algorithm is implemented to find the optimal solution for IP mapping problem in NoC
designs. Dimension or size (D) of the particle is set equal to the number of tiles in the NoC
topology. Firstly, initial population with discrete values is generated having number of particles
equal to the swarm size (S) and each particle is initialized with the initial velocity (V) and
position (X). Particle for IP mapping is represented as shown in Figure 3, () IP is mapped on UV,

Computer Science & Information Technology (CS & IT) 21
where n is the index in particle. For IP mapping problem objective or fitness function (f) is to
minimize Total Communication Cost described in Equation (1). Then these particles move into
the search space in search of an optimal solution by updating their velocity and position towards
its previous best solution (P[s]) and the global best solution (P[best]) using Equations (2) & (3).
RW6 = X
R + (Y6(0, 6) × ![4T% − UR# + (Y7(0, 7) × (\4T% − U
R ) (2)
and,
URW6
= UR
+ ]RW6^ (3)
where,
_P` : gives floor value of i
R : velocity of agent i at iteration k
w : weighting function
6 and 7 : acceleration coefficients
rand : uniformly distributed random number between 0 and 1
UR
: current position of agent i at iteration k
A modification is done in the position updating equation, the floor value of the updated velocity
is added to the previous position for getting the new position of the particle, since the search
space of IP mapping problem is discrete and the new velocity of particle may be real. For
generating the integral position the floor value of velocity is taken. For performing experiments
the values of various parameters for PSO are shown in Table 1(based on intensive experiments).
Table 1
PSO PARAMETERS AND THEIR VALUES
Parameter Value
6 1.2
7 1.3
w 0.721348
Swarm Size (S) 200
Dimension of the Search Space (D) No. of tiles
Maximum No. of Simulations 100
Maximum No. of function evaluations in each simulation 150000
Similarly, ARPSO is also applied to this problem, modification of the particle’s position in
repulsion phase of ARPSO is mathematically modeled according to the following equations:
RW6 = X
R + (Y6(0, 6) × ![4T% − UR# − (Y7(0, 7) × (\4T% − U
R ) (4)
and,
URW6
= UR
+ ]RW6^ (5)
ARPSO is applied to solve the IP mapping problem in NoC design for all the four benchmarks
considered. The procedure to implement ARPSO is same as basic PSO except one parameter i.e.
ator, which is the number of evaluations after which algorithm enter into repulsion phase from
attraction phase. For performing experiments the values of various parameters for ARPSO are
shown in Table 2 (based on intensive experiments).

22 Computer Science & Information Technology (CS & IT)
Similarly, qPSO is also applied, the parameter settings for qPSO are shown in Table 3 (based on
intensive experiments).
It is worth mentioning that DMAP proposed in [9] is one of the best mapping algorithms in terms
of communication energy consumption as it results in a fraction of second. By having the DMAP
result and knowing evolutionary nature of PSO algorithm, different mappings with all reasonable
ranges of communication energy can be obtained. To do this, DMAP result is injected into
population initialization step as a particle in basic PSO algorithm, this result in a new PSO
algorithm named HPSO (Hybrid PSO). DMAP result is also injected into population initialization
step as a particle in Attractive-Repulsive PSO (ARPSO), qPSO algorithms, this result in a new
PSO algorithms named HARPSO, HqPSO shown in Figure 4.
Table 2
ARPSO PARAMETERS AND THEIR VALUES
Parameter Value
6 1.2
7 1.3
w 0.721348
ator 5000
Swarm Size (S) 200
Dimension of the Search Space (D) No. of tiles
Maximum No. of Simulations 100
Maximum No. of function evaluations in each simulation 150000
Table 3
QPSO PARAMETERS AND THEIR VALUES
Parameter Value
6 2.8
7 1.3
w 0.719
Coefficient of Hybridization (CH) 30%
Swarm Size (S) 200
Dimension of the Search Space (D) No. of tiles
Maximum No. of Simulations 100
Maximum No. of function evaluations in each simulation 150000
Figure 4. The procedure to achieve optimal mapping solution using HPSO, HARPSO and HQPSO.

Computer Science & Information Technology (CS & IT) 23
7. EXPERIMENT RESULTS
In this section we present our experimental results derived from simulations of a combination of
different real life applications and E3S benchmark. Our algorithm is compared with two other
NoC-targeted mapping algorithms, and results are illustrated and analyzed in details.
Our proposed algorithm has been implemented in C++ and tested with different real life
applications (Video Object Plane Decoder (VOPD), Telecom, MMS (Multi-Media System),
MWD (Multi-Window Display)), randomly generated benchmarks using TGFF [17] and with
E3S benchmark. These tasks are mapped over 3×3×3 3D NoC architecture. We have worked out
with XYZ-routing algorithm which provides a deadlock free minimal routing technique. Results
obtained are compared with results of various proposed approaches like Spiral, Crinkle which are
proposed in literature [6].
Various parameter constraints that have been taken for performing the experiment are shown in
Table 4. Number of benchmark over which the system has been tested having a 16 tasks VOPD,
16 task MMS, 12 tasks Multi window display, 16 tasks Telecom, 27 task random application and
E3S(Embedded System Synthesis Benchmarks Suite) application which has 24 tasks auto
industrial, 12 tasks consumer, 13 tasks networking, 5 tasks office automation.
Figure 5. Energy Consumption with different benchmarks using various approaches.
By implementing existing and our proposed algorithms and comparing their result, we found that
our algorithm gives optimal result. Testing our proposed algorithm with real life application,
random benchmarks and E3S benchmark, we have noticed that our approach give better result
(Figure 5) and provide improvement in the communication energy consumption (Figure 9). As
discussed above, the average improvement in latency with various benchmarks is shown in Figure
10.

24 Computer Science & Information Technology (CS & IT)
Figure 6. Comparison of Hybridization technique of pso algorithm with Our, Spiral, Crinkle & shows
optimal energy consumption results with various benchmarks.
Figure 7. Comparison of Hybridization technique of arpso algorithm with Our, Spiral, Crinkle & shows
optimal energy consumption results with various benchmarks.
Implementing various optimization technique like hybrid particle swarm optimization, ARPSO,
QPSO and comparing the result of Hybrid PSO+Our approach, Hybrid PSO+Spiral and Hybrid
PSO+Crinkle is shown in Figure 6 and the comparison of Hybrid ARPSO+Our approach, Hybrid
ARPSO+Spiral and Hybrid ARPSO+Crinkle is shown in Figure 7 and the comparison result for
Hybrid QPSO+Our approach, Hybrid QPSO+Spiral and Hybrid QPSO+Crinkle is shown in
Figure 8 provide optimal results compare to mapping algorithms. Improvement in the
consumption of energy is shown in Figure 11 which is the average of above discussed, all
optimization algorithm.

Computer Science & Information Technology (CS & IT) 25
Figure 8. Comparison of Hybridization technique of qpso algorithm with Our, Spiral, Crinkle & shows
optimal energy consumption results with various benchmarks.
Figure 9. Energy Consumption reduction in % with various benchmarks.
Table 4.
BIT ENERGY VALUES FOR LINK AND SWITCH
Link Switch
0.449pJ 0.284pJ
8. CONCLUSION
In this paper, an efficient energy aware mapping algorithm for 3D NoC has been proposed. As
each of the mapping procedure aim at minimizing the number of the hops count between the two
communicating core, thus our proposed algorithm also reduced the number of the hops count. On

26 Computer Science & Information Technology (CS & IT)
3D architecture the diagonal tiles of each layer is having greater number of the links so when this
algorithm is tried with various real life application and E3S benchmarks, showed better reduction
in the communication energy as compared to other mapping algorithm such as crinkle and spiral.
Since the number of tiles in the 3D NoC architecture is more so this architecture shows better
results when tried with an application having greater number of the IP cores. Thus trying the
design with random benchmark generated using TGFF [17] shows better result as compared to
existing techniques. Compared to the Hybrid PSO and the proposed algorithm, has a better
optimization effect when combined with various mapping algorithm.
Figure 10. Average Latency reduction in % with various benchmarks.
Figure 11. Average energy consumption reduction in % with various benchmarks in case of optimization
algorithms.
ACKNOWLEDGEMENT
I would like to thank “ABV- Indian Institute of Information Technology & Management Gwalior”
for providing me the excellent research oriented environment.
REFERENCES
[1] T. Bjerregaard and S. Mahadevan, (2006) “A survey of research and practices of network-on-chip,”
ACM Computing Surveys (CSUR), vol. 38, no. 1, p. 1.
[2] U. Ogras, J. Hu, and R. Marculescu, (2005) “Key research problems in noc design: a holistic
perspective,” in Proceedings of the 3rd IEEE/ACM/IFIP international conference on
Hardware/software codesign and system synthesis. ACM, pp. 69–74.
[3] W. Dally and B. Towles, (2001) “Route packets, not wires: On-chip interconnection networks,” in
Design Automation Conference, 2001. Proceedings. IEEE, pp. 684–689.

Computer Science & Information Technology (CS & IT) 27
[4] R. Marculescu, U. Ogras, L. Peh, N. Jerger, and Y. Hoskote, (2009) “Outstanding research problems
in noc design: system, microarchitecture, and circuit perspectives,” Computer-Aided Design of
Integrated Circuits and Systems, IEEE Transactions on, vol. 28, no. 1, pp. 3–21.
[5] X. Chuan-pei, Y. Xiao-feng, and C. Yu-qian, (oct. 2009) “A technique for noc routing based on
hybrid particle swarm optimization algorithm,” in Genetic and Evolutionary Computing, 2009.
WGEC ’09. 3rd International Conference on, pp. 607 –610.
[6] S. Saeidi, A. Khademzadeh, and K. Navi, (2010) “Task priority based application mapping algorithm
for 3-d mesh network on chip,” Journal of Communication and Computer, vol. 7, no. 12, pp. 14–20.
[7] J. Hu and R. Marculescu, (2005) “Energy-and performance-aware mapping for regular noc
architectures,” Computer-Aided Design of Integrated Circuits and Systems, IEEE Transactions on,
vol. 24, no. 4, pp. 551–562.
[8] W. Lei and L. Xiang, (2010) “Energy-and latency-aware noc mapping based on chaos discrete
particle swarm optimization,” in Communications and Mobile Computing (CMC), 2010 International
Conference on, vol. 1. IEEE, pp. 263–268.
[9] S. Agrawal, D. Sant, and G. Sharma, (2010) “An efficient energy-and bandwidth-aware mapping
algorithm for regular noc architecture,” in Proceedings of the Third International Workshop on
Network on Chip Architectures. ACM, pp. 51–55.
[10] K. Siozios, I. Anagnostopoulos, and D. Soudris, (2010) “Multiple vdd on 3d noc architectures,” in
Electronics, Circuits, and Systems (ICECS), 2010 17th IEEE International Conference on. IEEE, pp.
831–834.
[11] K. Siozios, I. Anagnostopoulos, and D. Soudris, (2010) “A highlevel mapping algorithm targeting 3d
noc architectures with multiple vdd,” in VLSI (ISVLSI), 2010 IEEE Computer Society Annual
Symposium on. IEEE, pp. 444–445.
[12] C. Addo-Quaye, (2005) “Thermal-aware mapping and placement for 3-d noc designs,” in SOC
Conference, 2005. Proceedings. IEEE International. IEEE, pp. 25–28.
[13] V. C. G. Ascia and M. Palesi, (September, 2004) “Multi-objective mapping for mesh based noc
architectures,” in Proceedings of International Workshop hardware/software codesign System
Synthesis, pp. 182–187.
[14] J. Kennedy, R. Eberhart et al., (1995) “Particle swarm optimization,” in Proceedings of IEEE
international conference on neural networks, vol. 4. Perth, Australia, pp. 1942–1948.
[15] J. Riget and J. Vesterstrøm, (2002) “A diversity-guided particle swarm optimizer-the ARPSO,” Dept.
Comput. Sci., Univ. of Aarhus, Aarhus, Denmark, Tech. Rep, vol. 2, p. 2002.
[16] K. Deep and J. Bansal, (2009) “Hybridization of particle swarm optimization with quadratic
approximation,” OPSEARCH, vol. 46, no. 1, pp. 3–24.
[17] R. Dick, D. Rhodes, and W. Wolf, (1998) “Tgff: task graphs for free,” in Proceedings of the 6th
international workshop on Hardware/software codesign. IEEE Computer Society, pp. 97–101.
AUTHORS Vaibhav Jha has received his Master of Technology degree in specialization VLSI
Design from Indian Institute of Information Technology and Management Gwalior
in 2012. He has completed his Bachelors of Engineering degree in 2009. His
academic research interest is in the area of Real time system, High Performance
Computing, System on Chip, Distributed System, Computer Architecture,
Databases, Networking and Communication.
Sunny Deol, Master of Technology degree in Computer Science and Engineering
from Indian Institute of Information Technology and Management Gwalior 2012.
He has completed his Bachelor degree in Computer Science in 2010. Area of
Interest includes Network on Chip, high speed network, Soft Computing,
Embedded System and Computer Networks and Communication.

28 Computer Science & Information Technology (CS & IT)
INTENTIONAL BLANK

Sundarapandian et al. (Eds) : CCSEA, EMSA, DKMP, CLOUD, SEA - 2014
pp. 29–38, 2014. © CS & IT-CSCP 2014 DOI : 10.5121/csit.2014.4303
AN EFFICIENT FEATURE SELECTION IN
CLASSIFICATION OF AUDIO FILES
Jayita Mitra 1 and Diganta Saha
2
1Assistant Professor, Dept. of IT, Camellia Institute of Technology,
Kolkata, India [email protected]
2Associate Professor, Department of CSE, Jadavpur University, Kolkata, India
ABSTRACT
In this paper we have focused on an efficient feature selection method in classification of audio files.
The main objective is feature selection and extraction. We have selected a set of features for further
analysis, which represents the elements in feature vector. By extraction method we can compute a
numerical representation that can be used to characterize the audio using the existing toolbox. In this
study Gain Ratio (GR) is used as a feature selection measure. GR is used to select splitting attribute
which will separate the tuples into different classes. The pulse clarity is considered as a subjective
measure and it is used to calculate the gain of features of audio files. The splitting criterion is
employed in the application to identify the class or the music genre of a specific audio file from
testing database. Experimental results indicate that by using GR the application can produce a
satisfactory result for music genre classification. After dimensionality reduction best three features
have been selected out of various features of audio file and in this technique we will get more than
90% successful classification result.
KEYWORDS
Data Mining, Feature Extraction, Audio Classification, Gain Ratio, Pulse Clarity
1. INTRODUCTION
Data mining is the process of analyzing the data and discovering previously unknown pattern
from large dataset. The data sources can be any databases, the web, data warehouses,
transactional data, data streams, spatial data, or information repositories. The aim of this process
is to extract information and summarizing it into an understandable structure for further use. Data
mining functionalities include discovering frequent patterns, associations, and correlations;
classification and regression; and clustering analysis are found in [1].
Classification is the task of generalizing known structure to apply to the new dataset. Data
classification is a two-step process learning or training phase and classification step. In learning
phase a classification model is constructed which describes a predetermined set of data classes or
concepts. In case of classification the test data are used to estimate the accuracy of the
classification rules. The accuracy of a classifier on a test data set is the percentage of the test data
set tuples that are correctly classified by the classifier. If the accuracy of the classifier is
considered acceptable, the classifier can be used to classify future data set for which the class
labels unknown.

30 Computer Science & Information Technology (CS & IT)
Feature selection is the process of selecting a subset of relevant features by eliminating features
with no predictive information and selected features are further used in classifier model
construction. The data set may contain redundant or irrelevant features. Redundant features are
not providing any information in comparing to currently selected features, and irrelevant features
provide no useful information in any context. Feature selection techniques are often used in
domains where there are many features and comparatively few data points. The basic objectives
of this technique are to avoid overfitting, provide faster and cost-effective models and
improvement of model performance and efficiency. The usefulness of feature selection is to
reduce the noise for improvement of accuracy of classification, interpretable features to identify
the function type and dimensionality reduction to improve the computational cost. Feature
extraction is a special form of dimensionality reduction in which extracted features are selected
such a manner that the feature set will extract relevant information from large data set to achieve
the goal using reduced data set.
An attribute selection measure provides rankings for each attribute describing a set of training
tuples mentioned in [1]. The attribute which is having maximum value for the measure is chosen
as splitting attribute. The splitting criterion indicates the splitting attribute and may also indicate a
split-point or a splitting subset. More specifically it selects an attribute by determining the best
way to separate or partition the tuples into individual classes.
The paper [2] briefly focused on feature construction, feature ranking, multivariate feature
selection, efficient search methods, and feature validity assessment methods. It also described
filters that select variables by ranking them with correlation coefficients. The subset selection
method is also discussed here. It also includes wrapper methods that assess subsets of variables
according to their usefulness to a given predictor.
The paper is organized as follows: Section II starts by describing the literature survey and related
work of this paper. Section III includes system design and module description. Feature selection
is introduced in Section IV. Section V mainly focused on Gain Ratio. We briefly discuss data
analysis and experimental evaluation in Section VI. Finally, we conclude the paper in the last
section.
2. LITERATURE SURVEY AND RELATED WORK
Most of the previous studies on data mining applications in various fields use the variety of data
types i.e., text, image audio and video in a variety of databases. Different methods of data mining
are used to extract the hidden patterns and knowledge discovery. For this purpose knowledge of
the domain is very necessary. The variety of data should be collected to create the database in the
specific problem domain. The next steps in this process are selection of specific data for data
mining, cleaning and transformation of data, extracting patterns for knowledge generation and
final interpretation of the patterns and knowledge generation described in [3].
In this paper, the estimation of this primary representation is based on a compilation of state-of-
the-art research in this area, enumerated in this section. Different studies and research works have
been conducted on feature selection and audio classification by employing different features and
methods.
A new feature selection algorithm FCBF is implemented and evaluated through experiments
comparing with three feature selection algorithm introduced in [4]. The method also focuses on
efficiency and effectiveness of feature selection in supervised learning where data content
irrelevant or redundant features. George Forman [5] described a comparative study of feature
selection metrics for the high dimensional domain of text classification which is focused on

Computer Science & Information Technology (CS & IT) 31
support vector machines and 2-class problems. It also focuses on the method for selecting one or
two metrics that have the best chances of obtaining the best performance for a dataset. A
multiclass classification strategy for the use of SVMs to solve the audio classification problem
and achieve lower error rates is presented in [6]. For content based audio retrieval, it proposes a
new metric, called distance-from-boundary (DFB). An SVM based approach to classification and
segmentation of audio streams which achieves high accuracy described in [7]. It proposed a set of
features for the representation of audio streams, including band periodicity and spectrum flux.
Various audio files, i.e., music, background sound and speeches were analyzed and classified
with respect to various features extracted in a different perspective. Mainly KNN and SVM
method are used for this purpose. S. Pfeiffer et al. [8] presented a theoretical framework and
application of automatic audio content analysis using some perceptual features. Saunders [9]
described a speech/music classifier based on simple features such as zero-crossing rate. Scheirer
et al. [10] introduced features for audio classification and performed experiments with different
classification models. An efficient method [11] presented for effective feature subset selection,
which builds upon known strengths of the tree ensembles from large, dirty, and complex data sets
(in 2009). Research work [12] to evaluate feature selection algorithms for financial credit-risk
evaluation decisions and the selected features are used to develop a predictive model for financial
credit-risk classification using a neural network (in 2010). S. Maldonado et al. [13] presented an
embedded method that simultaneously selects relevant features during classifier construction by
penalizing each feature’s use in the dual formulation of SVM (in 2011). Unifying framework
mentioned in [14] for feature selection based on dependence maximization between the selected
features and the labels of an estimation problem, using the Hilbert-Schmidt Independence
Criterion proposed in 2012. In 2013, Mauricio Schiezaro and Helio Pedrini introduces feature
selection method based on the Artificial Bee Colony approach [15], that can be used in several
knowledge domains through the wrapper and forward strategies and the method has been widely
used for solving optimization problems. Many other works have been conducted to enhance audio
classification algorithms. The basic objectives of research works are to increase the efficiency of
the classification process and reduce the rate of error.
The current open issues of data mining are based on (a) development of unifying theory, (b)
information network analysis, (c) process-related, biological and environmental problems, and (d)
dealing with complex, non-static, unbalanced, high dimensional and cost-sensitive data.
Handling of historical and real-time data simultaneously is very difficult for analytics system
found in [16]. The significance of the statistical result is very important in comparing to random
output. In future we have to concentrate on more research work with practical and theoretical
analysis to provide new methods and technique in the field of distributed data mining.
Representation of large data set and space required for storing the data these two are very
important factors. In case of compression less space is required but there is no loss of
information. The 2012 IDC study on Big Data [17] mentioned that in 2012, 23% of the digital
universe would be useful for Big Data if tagged and analyzed. But at present only 3% of the
potentially useful data is tagged, and even less is analyzed.
3. SYSTEM DESIGN
The Figure 1 depicted various stages of the whole process starting from database creation to
classification phase. At first we have created a training database of classified and non-classified
audio files. Classified audio file database is consisting of various .wav files of different music
genre. In the second phase various features of an audio file are identified. Then numerical values
of each feature are extracted from individual audio files for creating feature vector in the third
step of system design. The next phase deals with the data analysis part. After that range of each
feature for every music class is identified for further processing. In fifth step gain ratio is

32 Computer Science & Information Technology (CS & IT)
calculated with respect to pulse clarity to identify the splitting attribute. Three splitting attributes
with maximum gain ratio is already selected and then in sixth phase, a threshold value of each
feature is calculated. The next phase describes classification of audio files from testing database.
In the last step we concentrate on result analysis and calculation of successful classification and
rate of error.
Figure 1. System Design
4. FEATURE SELECTION The development of internet technology is widely increasing the use of multimedia data i.e.,
image, audio and video. In this paper our focus is on audio and music. Data mining techniques
can be used to discover relevant similarities between music for the purpose of classifying it in a
more objective manner. The backbone of most music information retrieval systems is the features
extracted from audio file. The effectiveness of this recording is dependent on the ability to
classify and retrieve the audio files in terms of their sound properties. Audio files basically of
three types i.e. speech, music and background sound. Male and female speech files are available
in .wav file format. Music files are classified into two categories - classical and non-classical
music. According to genre of the track the classical music is subdivided into the chamber and
orchestral. Rock, Pop, Jazz and Blues are various genres of non-classical music. Rock and Pop
music is sub classified to hard rock, soft rock, techno and hip-hop music. For these work totals 11

Computer Science & Information Technology (CS & IT) 33
genres of music are identified. An important phase of audio classification is feature selection. In
order to obtain high accuracy for classification and segmentation, it is very important to select
good features of audio files. Generally audio file analysis is based on the nature of the waveform.
So the features have been selected on the basis of their numerical values. Before feature
extraction, an audio signal is converted into a general format, which is .wav format. Selected
features of an audio file are sampling rate (in Hz.), temporal length (seconds/sample), rms energy,
low energy, tempo (in bpm), pulse clarity, zero crossing rate (per second), roll off (in Hz.),
Spectral irregularity, Pitch (in Hz.) and inharmonicity. The numerical value of each feature is
computed using MIRToolBox for further analysis. RMS Energy of an audio file is represented in
the Figure 2.
Figure 2. RMS Energy
5. GAIN RATIO
Information Gain and Gain Ratio are used in this work as attribute selection measures. Node N
holds the tuples of partition D. The expected information needed to classify a tuple in D is as
follows:
m
Info(D) = - ∑Pi log2(Pi)
i=1
where Pi is the nonzero probability that an arbitrary tuple in D belongs to class Ci and is estimated
by |Ci,D|/|D|.
To partition the tuple in D on some attribute A having v distinct values a1, a2,…..av. Attribute A
can be used to split D into v partitions D1, D2, …… Dv, where Dj contains those tuples in D that
have outcome aj of A. The expected information required to classify is,
v
InfoA(D) = ∑ |Dj|/|D| × Info(Dj)
j=1
where |Dj|/|D| = weight of jth partition.
Information Gain is, Gain(A) = Info(D) - InfoA(D)
By splitting the training data set D into v partitions on attribute A Splitting Information is
calculated as follows:

34 Computer Science & Information Technology (CS & IT)
v
SplitInfoA(D) = - ∑ |Dj|/|D| × log2 (|Dj|/|D|)
j=1
and the Gain Ratio is, GainRatio(A) = Gain(A) / SplitInfoA(D).
6. DATA ANALYSIS AND EXPERIMENTAL EVALUATION
The audio files of training database are already classified and the numerical values of each feature
of a specific audio file are extracted using MIRToolBox. MIRToolbox is a Matlab toolbox
dedicated to the extraction of musically related features from audio recordings. It has been
designed in particular with the objective of enabling the computation of a large range of features
from databases of audio files, which can be applied to statistical analyses described in [18].
MIRToolBox application is used with MATLAB 2012 to compute the numerical values of
selected features. The files of testing database are processed and input to the application to
identify the music genre of that specific audio file. The following commands are executed in a
MIRToolBox application to calculate the numerical values of individual features for all files:
miraudio('b1.wav')
mirlength('b1', 'Unit', 'Second')
mirrms('ragtime')
r1 = mirrms('b1', 'Frame')
mirlowenergy(r1)
mirtempo('b1', 'Autocor')
mirpulseclarity('b1', 'MaxAutocor')
mirzerocross('b1', 'Per', 'Second')
mirrolloff('b1', 'Threshold', .85)
mirregularity('b1', 'Jensen')
mirpitch('b1', 'Autocor')
mirinharmonicity('b1', 'f0', 450.8155)
6.1 Non-Classified Audio File Database
Total 52 .wav files are collected for creating non-classified Database. Extracted numerical values
of this feature of non-classified audio files are stored in a dataset. The data values of individual
features of non-classified audio files are plotted and analyzed in a waveform and linear values are
identified. Temporal Length of non-classified audio files is represented in Figure 3. Then the data
values of individual features are subdivided into three groups- high, medium and low on the basis
of their range of values. Pulse clarity is considered as a high-level musical dimension that
conveys how easily in a given musical piece, listeners can perceive the underlying rhythmic or
metrical pulsation. This Characterization of music plays an important role in musical genre
recognition described in [19] which allows discrimination between genres
Figure 3. Temporal Length

Computer Science & Information Technology (CS & IT) 35
but that differ in the degree of emergence of the main pulsation over the rhythmic texture. The
notion of pulse clarity is considered in this study as a subjective measure and it is used to
calculate the gain of features of all audio files. Roll Off has the highest information gain among
features, so it is selected as the splitting attribute. The gain ratio of each feature is calculated for
audio file analysis in respect to the feature pulse clarity. Table 1 consists of gain ratio of each
feature in respect of various music classes. The Roll Off feature with the maximum gain ratio is
selected as the splitting attribute in case of non-classified audio files.
Table 1. Gain_Ratio of Non-Classified Audio Files
Feature Gain Gain Ratio
Sampling Rate .2923 .164
Temporal Length .0048 .00687
RMS Energy .0412 .0513
Low energy .0214 .0198
Tempo .1022 .1228
Zero Crossing Rate .1562 .0996
Roll Off .3037 .2428
Spectral Irregularity .1392 .0981
Pitch .0412 .0262
Inharmonicity .0445 .1159
6.2 Classified Audio File Database The Classified Database is consisting of 110 audio files which is based on some basic classes i.e.,
Blues, Classical, Chamber, Orchestral, Jazz, Pop, Hip Hop, Techno, Rock, Hard rock and Soft
rock music. 10 .mp3 files for each class are collected for the creation of the database. Then the
files are converted into .wav format for processing. The sampling rate of all files is fixed to 44100
Hz. These extracted values are saved in a database for further analysis. The data values of
individual features are plotted and analysed for all classes. From the graph layout we can get the
minimum and maximum range of a specific feature for a particular music class. Figure 4 shows
the data ranges of various features. Based on different ranges the data sets are divided into three
groups – low, medium and high.
Figure 4. Feature_DataRange
After that information gain and gain ratio are calculated in respect to pulse clarity of each feature
corresponding to a particular music class. Maximum and average values of gain ratio are
calculated as MaxGain and AvgGain respectively for individual feature. Then threshold value is
calculated from the average value of MaxGain and AvgGain. Figure 5 Shows that, Roll off, Zero

36 Computer Science & Information Technology (CS & IT)
Crossing rate and Tempo have maximum threshold value. So these three features are selected as
the main criterion to classify an audio file.
Figure 5. GainRatio_PulseClarity
We’ve developed an application in PHP to implement the different functionalities i.e., feature
extraction and classification. Training databases of classified and non-classified audio files and
testing database are also created using MySQL. At first, an audio file from testing database is
entered into the application for feature extraction and the numerical values of each feature of the
audio file are displayed. From this data value system can identify the class of that music file. In
this method, three splitting attributes which have a maximum gain ratio can be easily calculated
from the gain_ratio table. For classification phase, the values of Roll of, Zero Crossing rate and
Tempo are fixed to threshold value which is already calculated and selected as the basic criterion
of classification. The threshold value of each feature is calculated as follows:
ThresholdFi = [(MaxFi + AvgFi)/2+ (MaxFi - AvgFi)/4]
During the classification phase of an audio file (from testing database) the system compares the
values with threshold values. If the values are less than or equal to threshold value then it is
successfully classified and music class is identified. Out of 110 music files 9 files are not
classified as the value exceeds the threshold limit.
Figure 6. Classification Result
Figure 6 represents the classification result on testing database. All test music files of classes
Blues, Classical, Chamber and Soft rock are classified successfully and no error occurs. For
improvement of efficiency of classification and to get the optimal solution threshold value plays
an important role. 91.82% files of testing database are correctly classified and the error rate of
unsuccessful classification is 8.18%. So, our approach is effective with respect to music genre
classification accuracy in [20]. By dimensionality reduction top three features have been selected
which are used for classification. The classification result is not affected by this method and we
can improve the percentage of successful classification above 90%, which can further improve in
the future on the basis of performance of the system and the result of success and error in
classification.
Computer Science & Information Technology (CS & IT) 37
7. CONCLUSIONS This approach includes the method to consistently and precisely identify the features that take
part in the classification of an audio file. We have described in detail an audio classification
scheme that uses Gain Ratio to select splitting attribute for classification into various music
genres. This research work presented here is based on feature selection, extraction, analysis of
data, feature selection using gain ratio and finally a classification stage using splitting criterion.
For calculation of gain ratio we have included Pulse Clarity feature which has high discrimination
power among different features and it ensures that the system can achieve high accuracy. All
audio files are of .wav format and the sampling rates are fixed. The audio files belonging to any
particular music genre share a similarity in a range of values of their features and hence make it
possible to discover the pattern and then classify the audio file accordingly. This work
emphasizes both the theoretical concept as well as gives insight into the practical application
program. Experimental results showed that the scheme is very effective and the total accuracy
rate is over 90%. There are many interesting directions that can be explored in the future. To
achieve this, we need to concentrate on the selection of more audio features that can be used to
characterize the audio content. In the future, our audio classification scheme will be improved to
discriminate more audio classes, speeches, background music or any other sound. We will also
focus on developing an effective scheme to apply data mining techniques to improve the
efficiency of the classification process. The future scope of the work is to improve the quality of
the audio file by improving the quality of sound by reducing the noise.
REFERENCES
[1] Jiawei Han,Micheline Kamber, Jian Pei. Data Mining: Concepts and Technique. Morgan
Kaufmann Publishers In; 3rd Revised edition, 2011 page no. 340.
[2]] Isabelle Guyon and Andre Elisseeff. An Introduction to Variable and Feature Selection, Journal of
Machine Learning Research 3 (2003) 1157-1182, Published 3/03.
[3] Neelamadhab Padhy, Dr. Pragnyaban Mishra , and Rasmita Panigrahi. The survey of data mining
applications and feature scope, International Journal of Computer Science, Engineering and
Information Technology (IJCSEIT), Vol.2, No.3, June 2012.
[4] Lei Yu and Huan Liu. Efficient feature selection via analysis of relevance and redundancy, Journal of
Machine Learning Research 5 (2004) 1205–1224, Published 10/04.
[5] George Forman. An extensive empirical study of feature selection metrics for text classification,
Journal of Machine Learning Research 3 (2003) 1289-1305, Published 3/03.
[6] Guodong Guo and Stan Z. Li. Content-Based Audio Classification and Retrieval by Support Vector
Machines, IEEE Transactions Neural Networks, Vol. 14, No. 1, January 2003 209, Page Number 209.
[7] Lie Lu, Hong-Jiang Zhang, Stan Z. Li. Content-based audio classification and segmentation by using
support vector machines, Multimedia Systems 8: 482–492 (2003) Multimedia Systems.
[8] S. Pfeiffer, S. Fischer, and W.Effelsberg, “Automatic audio content analysis,” in Proc. 4th ACM Int.
Conf. Multimedia, 1996, pp. 21–30.
[9] J. Saunders, “Real-time discrimination of broadcast speech/music,” in Proc. ICASSP’96, vol. II,
Atlanta, GA, May 1996, pp. 993–996.
[10] E. Scheirer and M. Slaney, “Construction and evaluation of a robust multifeature music/speech
discriminator,” in Proc. ICASSP’ 97, Apr. 1997, vol. II, pp. 1331–1334.
[11] Eugene Tuv, Alexander Borisov, George Runger and Kari Torkkola. Feature Selection with
Ensembles, Artificial Variables, and Redundancy Elimination, Journal of Machine Learning Research
10 (2009) 1341-1366 Published 7/09.
[12] Raghavendra B. K. , Dr. Jay B. Simha. Evaluation of Feature Selection Methods for Predictive
Modeling Using Neural Networks in Credits Scoring, Int. J. Advanced Networking and Applications
Volume:02, Issue: 03, Pages: 714-718 (2010).
[13] Sebastián Maldonado, Richard Weber and Jayanta Basak. Simultaneous feature selection and
classification using kernel-penalized support vector machine, Information Sciences 181 (2011) 115–
128.

38 Computer Science & Information Technology (CS & IT)
[14] Le Song, Alex Smola, Arthur Gretton, Justin Bedo and Karsten Borgwardt. Feature Selection via
Dependence Maximization. Journal of Machine Learning Research 13 (2012) 1393-1434 Published
5/12.
[15] Mauricio Schiezaro and Helio Pedrini. Data feature selection based on Artificial Bee Colony
algorithm, EURASIP Journal on Image and Video Processing 2013, 1687-5281-2013-47.
[16] Wei Fan and Albert Bifet. Mining Big Data: Current Status, and Forecast to the Future. SIGKDD
Explorations Volume 14, Issue 2
[17] J. Gantz and D. Reinsel. IDC: The Digital Universe in 2020: Big Data, Bigger Digital Shadows, and
Biggest Growth in the Far East. December 2012.
[18] Olivier Lartillot, Petri Toiviainen. A MATLAB TOOLBOX for Musical Feature Extraction from
Audio, In proceeding of the 10th International Conference on Digital Audio Effects (DAFx-07),
Bordeaux, France, September 10-15, 2007.
[19] Lartillot, O., T. Eerola, P. Toiviainen and J. Fornari. Multi-feature modeling of pulse clarity: Design,
Validation and Optimisation. Proceeding of the 11th International Conference on Digital Audio
Effects (DAFx-08), Espoo, Finland, September 1-4, 2008.
[20] Cory McKay, Ichiro Fujinaga. Automatic genre classification using large high-level musical feature
sets, ISMIR, 2004.
AUTHORS
Jayita Mitra
Presently working as Assistant Professor in Dept. of Information Technology at Camellia
Institute of Technology, Kolkata. She has 6.5 Years of academic experience and currently
pursuing her research in Data Mining from Jadavpur University.
Diganta Saha
Presently working as Associate Professor in Dept. of Computer Science and Engineering
at Jadavpur University. His area of specialization are Machine Translation, Natural
Language processing, Mobile Computing and Pattern Classification.

Sundarapandian et al. (Eds) : CCSEA, EMSA, DKMP, CLOUD, SEA - 2014
pp. 39–49, 2014. © CS & IT-CSCP 2014 DOI : 10.5121/csit.2014.4304
STUDY ON PERFORMANCE
IMPROVEMENT OF OIL PAINT IMAGE
FILTER ALGORITHM USING PARALLEL
PATTERN LIBRARY
Siddhartha Mukherjee1
1Samsung R&D Institute, India - Bangalore
[email protected] / [email protected]
ABSTRACT
This paper gives a detailed study on the performance of oil paint image filter algorithm with
various parameters applied on an image of RGB model. Oil Paint image processing, being very
performance hungry, current research tries to find improvement using parallel pattern library.
With increasing kernel-size, the processing time of oil paint image filter algorithm increases
exponentially.
KEYWORDS
Image Processing, Image Filters, Linear Image Filters, Colour Image Processing, Paint
algorithm, Oil Paint algorithm.
1. INTRODUCTION
This document provides an analytical study on the performance of Oil Paint Image Filter
Algorithm. There are various popular linear image filters are available. One of them is Oil Paint
image effect. This algorithm, being heavy in terms of processing it is investigated in this study.
There related studies are detailed in the Section 7.
2. BACKGROUND
Modern days, hands are flooded with digital companions, like Digital Camera, Smart Phones and
so on. Most of the devices are having built-in camera. People now more keen on using the built-in
camera. The computation power of this class of devices is also increasing day by day. The usage
of this handheld devices as camera, overshoot the usage of traditional camera in huge number.
The usage of these cameras has become a common fashion of modern life. This has started a new
stream of applications. Applications include various categories e.g. image editing, image
enhancement, camera extension application and so on. A large group of these applications include
applying different kinds of image filters.
Image filters are of different kinds, with respect their nature of processing or mathematical model.
Some of the image filters are good in execution-time in comparison with others. The execution

40 Computer Science & Information Technology (CS & IT)
time is a very important data, for this category of application development. Oil Paint is one of the
very popular linear image filters, which is very heavy in terms of execution.
3. INVESTIGATION METHOD
A simple windows application is developed to analyse different types of image filters. The
purpose of this windows application is to accept different JPG image files as an input, and apply
different kinds of image filters on to it. In the process of applying image filters the application
will log the processing time. The overall operation of the application is explained here.
3.1. Operational Overview
The application is realised with two primary requirements: input jpg image files and configuration
of image filter parameters. To cater requirements, the application is designed with three major
components: a user interface, a jpeg image encoder-decoder and image filter algorithm.
The user interface is developed with Microsoft’s Win32 programing. The image encoder and
decoder component is designed with Windows Imaging Component, provided by Microsoft on
windows desktop.
The following flowchart diagram shows the operational overview of the test environment. During
this process of testing, the processing time is logged and analysed for the study.
3.2. Implementation Overview
Considering the above workflow diagram, main focus of the current study is done with the
application of image filter (marked as “Apply Image Filter” operation). Other operations are
considered to be well known and do not affect the study. The code snippet below will provide the
clear view of implementation. The user interface can be designed in various ways; even this

Computer Science & Information Technology (CS & IT) 41
experiment can be performed without a GUI also. That is why the main operational point of
interests can be realized with the following way.
Decoder
The interface for decoding is exposed as shown here.
One of the possible ways of implementing the decode interface is provided here
.
Decoder Apply Image
Filter Encoder
Decoded
Buffer Processed
Buffer Image
Files
Image
Files
/* ********************************************************************************* * Function Name : Decode * Description : The function decodes an image file and gets the decoded buffer. * * *********************************************************************************/ HRESULT Decode(LPCWSTR imageFilename, PUINT pWidth, PUINT pHeight, PBYTE* ppDecodedBuffer, PUINT pStride, PUINT pBufferSize, WICPixelFormatGUID* pWicPixelFormatGUID);
HRESULT Decode(LPCWSTR imageFilename, PUINT pWidth, PUINT pHeight, PBYTE* ppDecodedBuffer, PUINT pStride, PUINT pBufferSize, WICPixelFormatGUID* pWicPixelFormatGUID) HRESULT hr = S_OK; UINT frameCount = 0; IWICImagingFactory *pFactory = NULL; IWICBitmapDecoder *pBitmapJpgDecoder = NULL; IWICBitmapFrameDecode *pBitmapFrameDecode = NULL; do /* Create Imaging Factory */ BREAK_IF_FAILED(CoCreateInstance( CLSID_WICImagingFactory, NULL, CLSCTX_INPROC_SERVER,
IID_IWICImagingFactory, (LPVOID*)&pFactory)) /* Create Imaging Decoder for JPG File */ BREAK_IF_FAILED(pFactory->CreateDecoderFromFilename(imageFilename, NULL, GENERIC_READ, WICDecodeMetadataCacheOnDemand, &pBitmapJpgDecoder))
/* Get decoded frame & its related information from Imaging Decoder for JPG File */ BREAK_IF_FAILED(pBitmapJpgDecoder->GetFrameCount(&frameCount)) BREAK_IF_FAILED(pBitmapJpgDecoder->GetFrame(0, &pBitmapFrameDecode))
/* Get Width and Height of the Frame */ BREAK_IF_FAILED(pBitmapFrameDecode->GetSize(pWidth, pHeight)) /* Get Pixel format and accordingly allocate memory for decoded frame */ BREAK_IF_FAILED(pBitmapFrameDecode->GetPixelFormat(pWicPixelFormatGUID)) *ppDecodedBuffer = allocateBuffer(pWicPixelFormatGUID, *pWidth, *pHeight,
pBufferSize, pStride)) if(*ppDecodedBuffer == NULL) break; /* Get decoded frame */ BREAK_IF_FAILED(pBitmapFrameDecode->CopyPixels(NULL, *pStride,
*pBufferSize, *ppDecodedBuffer)) while(false); if(NULL != pBitmapFrameDecode) pBitmapFrameDecode->Release(); if(NULL != pBitmapJpgDecoder) pBitmapJpgDecoder->Release(); if(NULL != pFactory) pFactory->Release(); return hr;

42 Computer Science & Information Technology (CS & IT)
Encoder
The interface for encoding is exposed as shown here.
One of the possible ways of implementing the encode interface is provided here.
/* ********************************************************************************* * Function Name : Encode *
* Description : The function encodes an deocoded buffer into an image file. * * *********************************************************************************/ HRESULT Encode(LPCWSTR outFilename, UINT imageWidth, UINT imageHeight, PBYTE pDecodedBuffer, UINT cbStride, UINT cbBbufferSize, WICPixelFormatGUID* pWicPixelFormatGUID);
HRESULT Encode(LPCWSTR outFilename, UINT imageWidth, UINT imageHeight, PBYTE pDecodedBuffer, UINT cbStride, UINT
cbBbufferSize, WICPixelFormatGUID* pWicPixelFormatGUID) HRESULT hr = S_OK; UINT frameCount = 0; IWICImagingFactory *pFactory = NULL; IWICBitmapEncoder *pBitmapJpgEncoder = NULL; IWICBitmapFrameEncode *pBitmapFrameEncode = NULL; IWICStream *pJpgFileStream = NULL; do /* Create Imaging Factory */ BREAK_IF_FAILED(CoCreateInstance(CLSID_WICImagingFactory, NULL, CLSCTX_INPROC_SERVER, IID_IWICImagingFactory, (LPVOID*)&pFactory)) /* Create & Initialize Stream for an output JPG file */ BREAK_IF_FAILED(pFactory->CreateStream(&pJpgFileStream)) BREAK_IF_FAILED(pJpgFileStream->InitializeFromFilename(outFilename, GENERIC_WRITE)) /* Create & Initialize Imaging Encoder */ BREAK_IF_FAILED(pFactory->CreateEncoder(GUID_ContainerFormatJpeg, &GUID_VendorMicrosoft, &pBitmapJpgEncoder)) /* Initialize a JPG Encoder */ BREAK_IF_FAILED(pBitmapJpgEncoder->Initialize(pJpgFileStream, WICBitmapEncoderNoCache)) /* Create & initialize a JPG Encoded frame */ BREAK_IF_FAILED(pBitmapJpgEncoder->CreateNewFrame(&pBitmapFrameEncode, NULL)) BREAK_IF_FAILED(pBitmapFrameEncode->Initialize(NULL)) /* Update the pixel information */ BREAK_IF_FAILED(pBitmapFrameEncode->SetPixelFormat(pWicPixelFormatGUID)) BREAK_IF_FAILED(pBitmapFrameEncode->SetSize(imageWidth, imageHeight)) BREAK_IF_FAILED(pBitmapFrameEncode->WritePixels(imageHeight, cbStride,
cbBbufferSize, pDecodedBuffer)) BREAK_IF_FAILED(pBitmapFrameEncode->Commit()) BREAK_IF_FAILED(pBitmapJpgEncoder->Commit()) while(false); if(NULL != pJpgFileStream) pJpgFileStream->Release(); if(NULL != pBitmapFrameEncode) pBitmapFrameEncode->Release(); if(NULL != pBitmapJpgEncoder) pBitmapJpgEncoder->Release(); if(NULL != pFactory) pFactory->Release(); return hr;
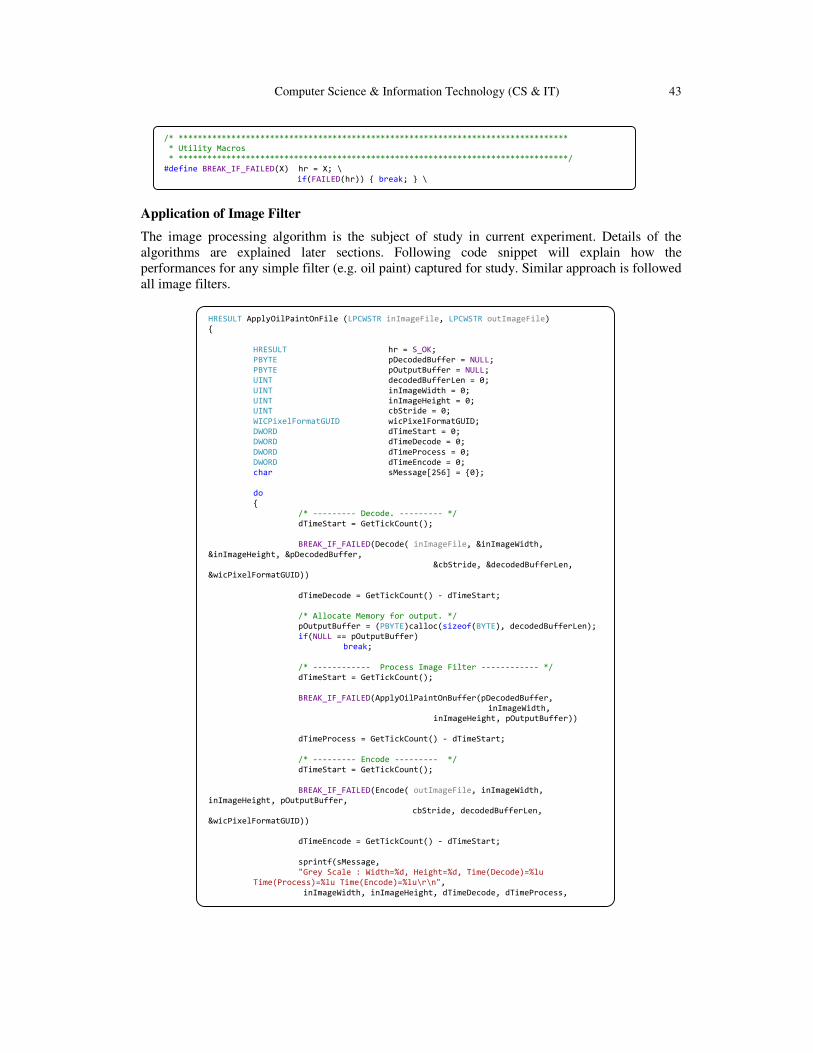
Computer Science & Information Technology (CS & IT) 43
Application of Image Filter
The image processing algorithm is the subject of study in current experiment. Details of the
algorithms are explained later sections. Following code snippet will explain how the
performances for any simple filter (e.g. oil paint) captured for study. Similar approach is followed
all image filters.
/* ********************************************************************************* * Utility Macros * *********************************************************************************/ #define BREAK_IF_FAILED(X) hr = X; \ if(FAILED(hr)) break; \
HRESULT ApplyOilPaintOnFile (LPCWSTR inImageFile, LPCWSTR outImageFile) HRESULT hr = S_OK; PBYTE pDecodedBuffer = NULL; PBYTE pOutputBuffer = NULL; UINT decodedBufferLen = 0; UINT inImageWidth = 0; UINT inImageHeight = 0; UINT cbStride = 0; WICPixelFormatGUID wicPixelFormatGUID; DWORD dTimeStart = 0; DWORD dTimeDecode = 0; DWORD dTimeProcess = 0; DWORD dTimeEncode = 0; char sMessage[256] = 0; do /* --------- Decode. --------- */ dTimeStart = GetTickCount(); BREAK_IF_FAILED(Decode( inImageFile, &inImageWidth, &inImageHeight, &pDecodedBuffer, &cbStride, &decodedBufferLen, &wicPixelFormatGUID)) dTimeDecode = GetTickCount() - dTimeStart; /* Allocate Memory for output. */ pOutputBuffer = (PBYTE)calloc(sizeof(BYTE), decodedBufferLen); if(NULL == pOutputBuffer) break; /* ------------ Process Image Filter ------------ */ dTimeStart = GetTickCount(); BREAK_IF_FAILED(ApplyOilPaintOnBuffer(pDecodedBuffer,
inImageWidth, inImageHeight, pOutputBuffer))
dTimeProcess = GetTickCount() - dTimeStart; /* --------- Encode --------- */ dTimeStart = GetTickCount(); BREAK_IF_FAILED(Encode( outImageFile, inImageWidth, inImageHeight, pOutputBuffer, cbStride, decodedBufferLen, &wicPixelFormatGUID)) dTimeEncode = GetTickCount() - dTimeStart; sprintf(sMessage,
"Grey Scale : Width=%d, Height=%d, Time(Decode)=%lu Time(Process)=%lu Time(Encode)=%lu\r\n",
inImageWidth, inImageHeight, dTimeDecode, dTimeProcess, dTimeEncode);

44 Computer Science & Information Technology (CS & IT)
For measuring the time taken for processing, well known standard windows API GetTickCount is
used. GetTickCount retrieves the number of milliseconds that have elapsed since the system was
started.
4. OIL PAINT IMAGE FILTER IN RGB COLOUR MODEL
During this study, the input images are considered to be in RGB model. In this model, an image
consists of two dimensional arrays of pixels. Each pixel of a 2D array contains data of red, green
and blue colour channel respectively.
The Image Filters are basically algorithm for changing the values of Red, Green and Blue
component of a pixel to a certain value.
There are various kinds of Image Filters, available. One of the categories of image filter is linear
image filters. For processing one pixel its neighbouring pixels is accessed, in linear image filter.
Depending upon the amount of access to neighbouring pixels, the performance of linear filters is
affected.
As a part of our analysis we have considered Oil Paint image filter, which is popular but process
hungry.
Histogram based algorithm for Oil Paint
For each pixel, it is done in this way: for pixel at position (x, y), find the most frequently
occurring intensity value in its neighbourhood. And set it as the new colour value at position (x,
y).
The interface for the oil paint algorithm is exposed as follows.
Width
Height
Image represented in the form of 2D
array of pixels of size (Width x Height)
r g b
Image
Filter
Algorithm
R G B
Image represented in the form of 2D
array of pixels of size (Width x Height)
after application of Image Filter
Width
Height
Pixel at (x,y)
If radius is of value ‘R’, then
(2R+1) x (2R +1)
neighbouring pixels are
considered.
Neighbouring pixels are shown
in Grey colour for the pixel at
(x,y) with Radius is 1 as an
example.
240
(x-1, y-1)
240
(x, y-1)
236
(x+1, y-1)
236
(x-1, y)
215
(x, y)
240
(x+1, y)
235
(x-1, y+1)
231
(x, y+1)
218
(x+1, y+1)
1) The right side provides the larger and clear picture of the neighbouring pixels or Radius 1, with respect to
pixel at (x, y). The intensities of the respective pixels are also provided (as an example).
2) The pixels at (x-1, y-1), (x, y-1), (x+1, y) have the maximum occurring intensity i.e. 240. 3) The each colour channel of the pixel at (x, y) is set with an average of each colour channel of 3 pixels
[(x-1, y-1), (x, y-1), (x+1, y)].

Computer Science & Information Technology (CS & IT) 45
Generally bigger images will be captured with higher resolution cameras. Here the radius also
needs to be of higher value to create better oil paint image effect. And this creates more
performance bottleneck.
One of the possible ways of implementing the interface is as follows.
/* ********************************************************************************* * Function Name : ApplyOilPaintOnBuffer * Description : Apply oil paint effect on decoded buffer. * * *********************************************************************************/ HRESULT ApplyOilPaintOnBuffer(PBYTE pInBuffer, UINT width, UINT height, const UINT intensity_level, const int radius, PBYTE pOutBuffer);
HRESULT ApplyOilPaintOnBuffer(PBYTE pInBuffer, UINT width, UINT height, const UINT intensity_level, const int radius, PBYTE pOutBuffer) int index = 0; int intensity_count[255] = 0; int sumR[255] = 0; int sumG[255] = 0; int sumB[255] = 0; int current_intensity = 0; int row,col, x,y; BYTE r,g,b; int curMax = 0; int maxIndex = 0; if(NULL == pInBuffer || NULL == pOutBuffer) return E_FAIL; for(col = radius; col < (height - radius); col++) for(row = radius; row < (width - radius); row++) memset(&intensity_count[0], 0, ARRAYSIZE(intensity_count)); memset(&sumR[0], 0, ARRAYSIZE(sumR)); memset(&sumG[0], 0, ARRAYSIZE(sumG)); memset(&sumB[0], 0, ARRAYSIZE(sumB)); /* Calculate the highest intensity Neighbouring Pixels. */ for(y = -radius; y <= radius; y++) for(x = -radius; x <= radius; x++) index = ((col + y) * width * 3) + ((row + x) * 3); r = pInBuffer[index + 0]; g = pInBuffer[index + 1]; b = pInBuffer[index + 2]; current_intensity = ((r + g + b) * intensity_level/3.0)/255; intensity_count[current_intensity]++; sumR[current_intensity] += r; sumG[current_intensity] += g; sumB[current_intensity] += b; index = (col * width * 3) + (row * 3); /* The highest intensity neighbouring pixels are averaged out to get the exact color. */ maxIndex = 0; curMax = intensity_count[maxIndex]; for( int i = 0; i < intensity_level; i++ )

46 Computer Science & Information Technology (CS & IT)
Experimental Results
The experimental is conducted with images of different size and application of oil paint with
different radius. The following data shows the time of execution with different parameters.
In due course of our investigation, we have observed that the performance of oil paint image filter
increases in greater degree with increasing width, height and radius (i.e. usage of neighbouring
pixel).
More importantly, we have observed most of the high resolution images are captured by more and
more and power camera (i.e. either in high end digital camera or high end handheld devices). For
these kinds of higher resolution photos, as the resolution of the image increases, the radius
parameter needs to be increased to generate Oil Paint effect of an acceptable quality.
5. OIL PAINT IMAGE FILTER BY MICROSOFT PARALLEL PATTERNS
LIBRARY
We have observed, in our previous section of investigation, which time increases with higher
degree with increasing width, height and radius. So we tried to improve the oil paint algorithm by
After application of
Oil Paint Image Filter

Computer Science & Information Technology (CS & IT) 47
using Microsoft Parallel Patterns Library. We have kept the same interface for Oil Paint
algorithm; only we differentiated in the implementation. Following code snippet will provide
clear picture of the implementation using Microsoft PPL.
Experimental Results
The experiment is conducted with same set of images, used for the experiment, mentioned in the
section above. We have also obtained same quality of output with and better performance.
HRESULT ApplyOilPaintOnBuffer(PBYTE pInBuffer, UINT width, UINT height, const UINT intensity_level, const int radius, PBYTE pOutBuffer) int tStart = radius; int tEnd =(height - radius); if(NULL == pInBuffer || NULL == pOutBuffer) return E_FAIL; parallel_for(tStart, tEnd, [&pInBuffer, &width, &height, &intensity_level, &radius, &pOutBuffer] (int col) int index = 0; int intensity_count[255] = 0; int sumR[255] = 0; int sumG[255] = 0; int sumB[255] = 0; int current_intensity = 0; int row,x,y; BYTE r,g,b; int curMax = 0; int maxIndex = 0; for(row = radius; row < (width - radius); row++) /* This portion of the code remains same, as mentioned above */ ); return S_OK;

48 Computer Science & Information Technology (CS & IT)
6. COMPARATIVE ANALYSIS OF BOTH APPROACHES
The improvement of the performance in terms of percentage is deduced as [100 * (T1 – T2)/ t1],
where T1 is time required for processing by 1st approach and T2 is the time required for
processing time by latest approach.
7. REFERENCES
From reference [3] the histogram based analysis has been studied. The reference [3] provides the
algorithm for the implementation of oil pain image filter algorithm. The algorithm (mentioned in
reference [3], section ‘Oil-paint Effect’) is implemented, as explained in the section 4 of this
paper. The achieved performance of the algorithm is examined and captured in the section 4 (sub-
section: Experimental Result) here. The result shows high growth of the processing time with
respect to kernel-size. Reference [4] is another reference, where algorithm similar reference [3] is
proposed for implementation. The reference [1] and [2] are used for way of analysis and follow
the broadened scope in this arena of image processing. Reference [5] also proposes algorithm
which are similar in nature with reference [3]. So we can clearly depict algorithms similar to
reference [3] and [5], will face similar performance problem.
8. CONCLUSIONS
As mentioned in section 4 & 7, I have obtained result, which depicts huge growth in processing
time with respect to the increase in kernel size of oil paint image filter. There are various
approaches have been proposed for the betterment of processing performance of the image filter
algorithms. The parallel pattern library is a Microsoft library designed for the use by native C++
developers, which provides features of multicore programming. The current paper conducts study
on improving oil paint image filter algorithm using the Microsoft technology.
By comparing results, as shown in section 6 I conclude that by using Microsoft Parallel Pattern
library 71.6% (average) performance improvement can be achieved for Oil Paint Algorithm. This
study is applicable for similar class of image filter algorithms as well.

Computer Science & Information Technology (CS & IT) 49
There are various similar image filter algorithm, where processing of a single pixel depends on
the values of its neighbouring pixels. In this respect, if the larger neighbouring pixels are
accessed, there are performance issues. The approach mentioned in this paper can be referred for
similar issues.
In future, more well-known or new techniques in conjunction with the current idea can be used
for betterment. Not only in image processing in other dimensions of signal processing as well
similar approach can be tried.
ACKNOWLEDGEMENTS
I would like to thank my organization to provide me the opportunity for conducting this research!
REFERENCES
[1] Dr.G.Padmavathi, Dr.P.Subashini, Mr.M.Muthu Kumar and Suresh Kumar Thakur (2009)
“Performance analysis of Non Linear Filtering Algorithms for underwater images”, (IJCSIS)
International Journal of Computer Science and Information Security. Vol.6, No. 2, 2009
[2] Aaron Hertzmann (1998) “Painterly rendering with curved brush strokes of multiple sizes”,
Proceedings of the 25th annual conference on Computer graphics and interactive techniques. Pages
453-460
[3] Feng Xiao (2000) “Oil-paint Effect”. Spring 2000/EE368 Course Project.
[4] Oil Paint Algorithm[http://supercomputingblog.com/graphics/oil-painting-algorithm/]
[5] P. S. Grover, Priti Sehgal (2004) “A Proposed Glass-Painting Filter”. University of Delhi
/icvgip/2004 / proceedings /cg1.1_109
[6] Parallel Patterns Library (PPL)[http://en.wikipedia.org/wiki/Parallel_Patterns_Library]
Author
Siddhartha Mukherjee is a B.Tech (Computer Science and Engineering) from RCC
Institute of Information Technology, Kolkata. Siddhartha is currently working as a
Technical Manager in Samsung R&D Institute, India- Bangalore. Siddhartha has almost 10
years of working experience in software development. He has previously worked with
Wipro Technologies. He has been contributing for various technical papers & innovations
at different forums in Wipro and Samsung. His main area of work is mobile application developments.

50 Computer Science & Information Technology (CS & IT)
INTENTIONAL BLANK

Sundarapandian et al. (Eds) : CCSEA, EMSA, DKMP, CLOUD, SEA - 2014
pp. 51–61, 2014. © CS & IT-CSCP 2014 DOI : 10.5121/csit.2014.4305
HIGH LEVEL VIEW OF CLOUD SECURITY: ISSUES
AND SOLUTIONS
Venkata Narasimha Inukollu1 , Sailaja Arsi
1 and Srinivasa Rao Ravuri
3
1
Department of Computer Engineering, Texas Tech University, USA narasimha.inukollu, [email protected]
3 Department of Banking and Financial Services, Cognizant Technology
Solutions, India
ABSTRACT
In this paper, we discuss security issues for cloud computing, Map Reduce and Hadoop
environment. We also discuss various possible solutions for the issues in cloud computing
security and Hadoop. Today, Cloud computing security is developing at a rapid pace which
includes computer security, network security and information security. Cloud computing plays a
very vital role in protecting data, applications and the related infrastructure with the help of
policies, technologies and controls.
KEYWORDS
Cloud Computing, Big Data, Hadoop, Map Reduce, HDFS (Hadoop Distributed File System)
1. INTRODUCTION
In order to analyze complex data and to identify patterns it is very important to securely store,
manage and share large amounts of complex data. Cloud comes with an explicit security
challenge, i.e. the data owner might not have any control of where the data is placed. The reason
behind this control issue is that if one wants to get the benefits of cloud computing, he/she must
also utilize the allocation of resources and also the scheduling given by the controls. Hence it is
required to protect the data in the midst of untrustworthy processes. Since cloud involves
extensive complexity, we believe that rather than providing a holistic solution to securing the
cloud, it would be ideal to make noteworthy enhancements in securing the cloud that will
ultimately provide us with a secure cloud.
Google has introduced MapReduce [1] framework for processing large amounts of data on
commodity hardware. Apache’s Hadoop distributed file system (HDFS) is evolving as a superior
software component for cloud computing combined along with integrated parts such as
MapReduce. Hadoop, which is an open-source implementation of Google MapReduce, including
a distributed file system, provides to the application programmer the abstraction of the map and
the reduce. With Hadoop it is easier for organizations to get a grip on the large volumes of data
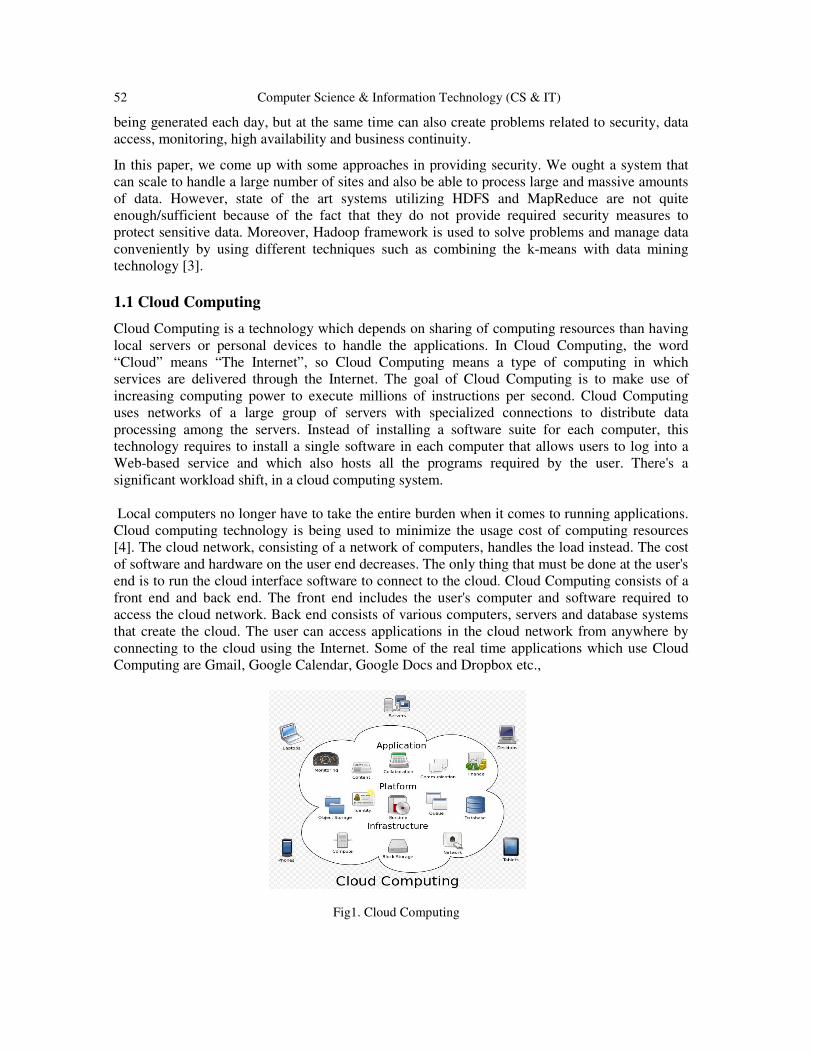
52 Computer Science & Information Technology (CS & IT)
being generated each day, but at the same time can also create problems related to security, data
access, monitoring, high availability and business continuity.
In this paper, we come up with some approaches in providing security. We ought a system that
can scale to handle a large number of sites and also be able to process large and massive amounts
of data. However, state of the art systems utilizing HDFS and MapReduce are not quite
enough/sufficient because of the fact that they do not provide required security measures to
protect sensitive data. Moreover, Hadoop framework is used to solve problems and manage data
conveniently by using different techniques such as combining the k-means with data mining
technology [3].
1.1 Cloud Computing
Cloud Computing is a technology which depends on sharing of computing resources than having
local servers or personal devices to handle the applications. In Cloud Computing, the word
“Cloud” means “The Internet”, so Cloud Computing means a type of computing in which
services are delivered through the Internet. The goal of Cloud Computing is to make use of
increasing computing power to execute millions of instructions per second. Cloud Computing
uses networks of a large group of servers with specialized connections to distribute data
processing among the servers. Instead of installing a software suite for each computer, this
technology requires to install a single software in each computer that allows users to log into a
Web-based service and which also hosts all the programs required by the user. There's a
significant workload shift, in a cloud computing system.
Local computers no longer have to take the entire burden when it comes to running applications.
Cloud computing technology is being used to minimize the usage cost of computing resources
[4]. The cloud network, consisting of a network of computers, handles the load instead. The cost
of software and hardware on the user end decreases. The only thing that must be done at the user's
end is to run the cloud interface software to connect to the cloud. Cloud Computing consists of a
front end and back end. The front end includes the user's computer and software required to
access the cloud network. Back end consists of various computers, servers and database systems
that create the cloud. The user can access applications in the cloud network from anywhere by
connecting to the cloud using the Internet. Some of the real time applications which use Cloud
Computing are Gmail, Google Calendar, Google Docs and Dropbox etc.,
Fig1. Cloud Computing

Computer Science & Information Technology (CS & IT)
1.2 Big Data
Big Data is the word used to describe massive volumes of structured and unstructured
are so large that it is very difficult to process this data using traditional databases and software
technologies. The term “Big Data [5]” is believed to be originated from the Web search
companies who had to query loosely structured very large d
that signify Big Data have the following properties:
a) Volume: Many factors contribute towards increasing Volume
streaming data and data collected from sensors etc.,
b) Variety: Today data comes in all types of formats
emails, video, audio, transactions etc.,
c) Velocity: This means how fast the data is being produced and how fast the data needs to be
processed to meet the demand.
The other two dimensions that need to consider with respect to Big Data are Variability and
Complexity [5].
d) Variability: Along with the Velocity, the data flows can be highly inconsistent with periodic
peaks.
e) Complexity: Complexity of the data al
multiple sources. The data must be linked, matched, cleansed and transformed into required
formats before actual processing.
Technologies today not only support the collection of large amounts of
utilizing such data effectively.
transactions made all over the world with respect to a Bank, Walmart customer transactions, and
Facebook users generating social interaction d
When making an attempt to understand the concept of Big Data, the words
Reduce” and “Hadoop” cannot be avoided.
Computer Science & Information Technology (CS & IT)
Big Data is the word used to describe massive volumes of structured and unstructured
are so large that it is very difficult to process this data using traditional databases and software
technologies. The term “Big Data [5]” is believed to be originated from the Web search
companies who had to query loosely structured very large distributed data. The three main terms
the following properties:
a) Volume: Many factors contribute towards increasing Volume - storing transaction
streaming data and data collected from sensors etc.,
day data comes in all types of formats – from traditional databases, text documents,
emails, video, audio, transactions etc.,
c) Velocity: This means how fast the data is being produced and how fast the data needs to be
The other two dimensions that need to consider with respect to Big Data are Variability and
d) Variability: Along with the Velocity, the data flows can be highly inconsistent with periodic
e) Complexity: Complexity of the data also needs to be considered when the data is coming from
multiple sources. The data must be linked, matched, cleansed and transformed into required
formats before actual processing.
Technologies today not only support the collection of large amounts of data but also help in
Some of the real time examples of Big Data are Credit card
transactions made all over the world with respect to a Bank, Walmart customer transactions, and
Facebook users generating social interaction data.
Fig2. Big Data
to understand the concept of Big Data, the words such as
Reduce” and “Hadoop” cannot be avoided.
53
Big Data is the word used to describe massive volumes of structured and unstructured data that
are so large that it is very difficult to process this data using traditional databases and software
technologies. The term “Big Data [5]” is believed to be originated from the Web search
istributed data. The three main terms
transaction data, live
from traditional databases, text documents,
c) Velocity: This means how fast the data is being produced and how fast the data needs to be
The other two dimensions that need to consider with respect to Big Data are Variability and
d) Variability: Along with the Velocity, the data flows can be highly inconsistent with periodic
so needs to be considered when the data is coming from
multiple sources. The data must be linked, matched, cleansed and transformed into required
data but also help in
Some of the real time examples of Big Data are Credit card
transactions made all over the world with respect to a Bank, Walmart customer transactions, and
such as “Map

54 Computer Science & Information Technology (CS & IT)
1.3 Hadoop
Hadoop, which is a free, Java-based programming framework supports the processing of large
sets of data in a distributed computing environment. It is a part of the Apache project sponsored
by the Apache Software Foundation. Hadoop cluster uses a Master/Slave structure [6]. Using
Hadoop, large data sets can be processed across a cluster of servers and applications can be run
on systems with thousands of nodes involving thousands of terabytes. Distributed file system in
Hadoop helps in rapid data transfer rates and allows the system to continue its normal operation
even in the case of some node failures. This approach lowers the risk of an entire system failure,
even in the case of a significant number of node failures. Hadoop enables a computing solution
that is scalable, cost effective, flexible and fault tolerant. Hadoop Framework is used by popular
companies like Google, Yahoo, Amazon and IBM etc., to support their applications involving
huge amounts of data. Hadoop has two main sub projects – Map Reduce and Hadoop Distributed
File System (HDFS).
1.4 Map Reduce
Hadoop Map Reduce is a framework [7] used to write applications that process large amounts of
data in parallel on clusters of commodity hardware resources in a reliable, fault-tolerant manner.
A Map Reduce job first divides the data into individual chunks which are processed by Map jobs
in parallel. The outputs of the maps sorted by the framework are then input to the reduce tasks.
Generally the input and the output of the job are both stored in a file-system. Scheduling,
Monitoring and re-executing failed tasks are taken care by the framework.
1.5 Hadoop Distributed File System (HDFS)
HDFS [8] is a file system that spans all the nodes in a Hadoop cluster for data storage. It links
together file systems on local nodes to make it into one large file system. HDFS improves
reliability by replicating data across multiple sources to overcome node failures.
2. Motivation and Related Work
2.1. Motivation
Along with the increasing popularity of the Could Computing environments, the security issues
introduced through adaptation of this technology are also increasing. Though Cloud Computing
offers many benefits, it is vulnerable to attacks. Attackers are consistently trying to find loopholes
to attack the cloud computing environment. The traditional security mechanisms which are used
are reconsidered because of these cloud computing deployments. Ability to visualize, control and
inspect the network links and ports is required to ensure security. Hence there is a need to invest
in understanding the challenges, loop holes and components prone to attacks with respect to cloud
computing, and come up with a platform and infrastructure which is less vulnerable to attacks.
2.2. Related Work
Hadoop (a cloud computing framework), a Java based distributed system, is a new framework in
the market. Since Hadoop is new and still being developed to add more features, there are many
security issues which need to be addressed. Researchers have identified some of the issues and
started working on this. Some of the notable outcomes, which is related to our domain and helped
us to explore, are presented below.

Computer Science & Information Technology (CS & IT) 55
The World Wide Web consortium has identified the importance of SPARQL which can be used
in diverse data sources. Later on, the idea of secured query was proposed in order to increase
privacy in privacy/utility tradeoff. Here, Jelena, of the USC Information Science Institute, has
explained that the queries can be processed according to the policy of the provider, rather than all
query processing. Bertino et al published a paper on access control for XML Documents [9]. In
the paper, cryptography and digital signature technique are explained, and techniques of access
control to XML data document is stressed for secured environment. Later on, he published
another paper on authentic third party XML document distribution [10] which imposed another
trusted layer of security to the paradigm. Moreover, Kevin Hamlen and et al proposed that data
can be stored in a database encrypted rather than plain text. The advantage of storing data
encrypted is that even though intruder can get into the database, he or she can’t get the actual
data. But, the disadvantage is that encryption requires a lot of overhead. Instead of processing the
plain text, most of the operation will take place in cryptographic form. Hence the approach of
processing in cryptographic form added extra to security layer.
IBM researchers also explained that the query processing should take place in a secured
environment. Then, the use of Kerberos has been highly effective. Kerberos is nothing but a
system of authentication that has been developed at MIT. Kerberos uses an encryption technology
along with a trusted third party, an arbitrator, to be able to perform a secure authentication on an
open network. To be more specific, Kerberos uses cryptographic tickets to avoid transmitting
plain text passwords over the wire. Kerberos is based upon Needham-Schroeder protocol. Airavat
[11] has shown us some significant advancement security in the Map Reduce environment. In the
paper, Roy and et al have used the access control mechanism along with differential privacy.
They have worked upon mathematical bound potential privacy violation which prevents
information leak beyond data provider’s policy.
The above works have influenced us, and we are analyzing various approaches to make the cloud
environment more secure for data transfer and computation.
3. ISSUES AND CHALLENGES
Cloud computing comes with numerous security issues because it encompasses many
technologies including networks, databases, operating systems, virtualization, resource
scheduling, transaction management, load balancing, concurrency control and memory
management. Hence, security issues of these systems and technologies are applicable to cloud
computing. For example, it is very important for the network which interconnects the systems in a
cloud to be secure. Also, virtualization paradigm in cloud computing results in several security
concerns. For example, mapping of the virtual machines to the physical machines has to be
performed very securely. Data security not only involves the encryption of the data, but also
ensures that appropriate policies are enforced for data sharing. In addition, resource allocation
and memory management algorithms also have to be secure. Finally, data mining techniques may
also be used in the malware detection in clouds.
The challenges of security in cloud computing environments are discussed below.
3.1 Distributed Nodes
Distributed nodes [12] are an architectural issue. The computation is done in any set of nodes.
Basically, data is processed in those nodes which have the necessary resources. Since it can
56 Computer Science & Information Technology (CS & IT)
happen anywhere across the clusters, it is very difficult to find the exact location of computation.
Because of this it is very difficult to ensure the security of the place where computation is done.
3.2 Distributed Data
In order to alleviate parallel computation, a large data set can be stored in many pieces across
many machines. Also, redundant copies of data are made to ensure data reliability. In case a
particular chunk is corrupted, the data can be retrieved from its copies. In the cloud environment,
it is extremely difficult to find exactly where pieces of a file are stored. Also, these pieces of data
are copied to another node/machines based on availability and maintenance operations. In
traditional centralized data security system, critical data is wrapped around various security tools.
This cannot be applied to cloud environments since all related data are not presented in one place
and it changes.
3.3 Internode Communication
Much Hadoop distributions use RPC over TCP/IP for user data/operational data transfer between
nodes. This happens over a network, distributed around globe consisting of wireless and wired
networks. Therefore, anyone can tap and modify the inter node communication[12] for breaking
into systems.
3.4 Data Protection
Many cloud environments like Hadoop store the data as it is without encryption to improve
efficiency. If a hacker can access a set of machines, there is no way to stop him to steal the
critical data present in those machines.
3.5 Administrative Rights for Nodes
A node has administrative rights [12] and can access any data. This uncontrolled access to any
data is very dangerous as a malicious node can steal or manipulate critical user data.
3.6 Authentication of Applications and Nodes
Nodes can join clusters to increase the parallel operations. In case of no authentication, third part
nodes can join clusters to steal user data or disrupt the operations of the cluster.
3.7 Logging
In the absence of logging in a cloud environment, no activity is recorded which modify or delete
user data. No information is stored like which nodes have joined cluster, which Map Reduce jobs
have run, what changes are made because of these jobs. In the absence of these logs, it is very
difficult to find if someone has breached the cluster if any, malicious altering of data is done
which needs to be reverted. Also, in the absence of logs, internal users can do malicious data
manipulations without getting caught.
3.8 Traditional Security Tools
Traditional security tools are designed for traditional systems where scalability is not huge as
cloud environment. Because of this, traditional security tools which are developed over years
Computer Science & Information Technology (CS & IT) 57
cannot be directly applied to this distributed form of cloud computing and these tools do not scale
as well as the cloud scales.
3.9 Use of Different Technologies
Cloud consists of various technologies which has many interacting complex components.
Components include database, computing power, network, and many other stuff. Because of the
wide use of technologies, a small security weakness in one component can bring down the whole
system. Because of this diversity, maintaining security in the cloud is very challenging.
4. THE PROPOSED APPROACHES
We present various security measures which would improve the security of cloud computing
environment. Since the cloud environment is a mixture of many different technologies, we
propose various solutions which collectively will make the environment secure. The proposed
solutions encourage the use of multiple technologies/ tools to mitigate the security problem
specified in previous sections. Security recommendations are designed such that they do not
decrease the efficiency and scaling of cloud systems.
Following security measures should be taken to ensure the security in a cloud environment.
4.1 File Encryption
Since the data is present in the machines in a cluster, a hacker can steal all the critical
information. Therefore, all the data stored should be encrypted. Different encryption keys should
be used on different machines and the key information should be stored centrally behind strong
firewalls. This way, even if a hacker is able to get the data, he cannot extract meaningful
information from it and misuse it. User data will be stored securely in an encrypted manner.
4.2 Network Encryption
All the network communication should be encrypted as per industry standards. The RPC
procedure calls which take place should happen over SSL so that even if a hacker can tap into
network communication packets, he cannot extract useful information or manipulate packets.
4.3 Logging
All the map reduce jobs which modify the data should be logged. Also, the information of users,
which are responsible for those jobs should be logged. These logs should be audited regularly to
find if any, malicious operations are performed or any malicious user is manipulating the data in
the nodes.
4.4 Software Format and Node Maintenance
Nodes which run the software should be formatted regularly to eliminate any virus present. All
the application softwares and Hadoop software should be updated to make the system more
secure.

58 Computer Science & Information Technology (CS & IT)
4.5 Nodes Authentication
Whenever a node joins a cluster, it should be authenticated. In case of a malicious node, it should
not be allowed to join the cluster. Authentication techniques like Kerberos can be used to validate
the authorized nodes from malicious ones.
4.6 Rigorous System Testing of Map Reduce Jobs
After a developer writes a map reduce job, it should be thoroughly tested in a distributed
environment instead of a single machine to ensure the robustness and stability of the job.
4.7 Honeypot Nodes
Honey pot nodes should be present in the cluster, which appear like a regular node but is a trap.
These honeypots trap the hackers and necessary actions would be taken to eliminate hackers.
4.8 Layered Framework for Assuring Cloud
A layered framework for assuring cloud computing [13] as shown in Figure (1) consists of the
secure virtual machine layer, secure cloud storage layer, secure cloud data layer, and the secure
virtual network monitor layer. Cross cutting services are rendered by the policy layer, the cloud
monitoring layer, the reliability layer and the risk analysis layer.
Fig3: Layered framework for assuring cloud [13]
4.9 Third Party Secure Data Publication to Cloud
Cloud computing helps in storing of data at a remote site in order to maximize resource
utilization. Therefore, it is very important for this data to be protected and access should be given
only to authorized individuals. Hence this fundamentally amounts to secure third party
publication of data that is required for data outsourcing, as well as for external publications. In the
cloud environment, the machine serves the role of a third party publisher, which stores the
sensitive data in the cloud. This data needs to be protected, and the above discussed techniques
have to be applied to ensure the maintenance of authenticity and completeness.

Computer Science & Information Technology (CS & IT) 59
Fig4: Third party secure data publication applied to cloud [13].
4.10 Access Control
Integration of mandatory access control and differential privacy in distributed environment will
be a good security measure. Data providers will control the security policy of their sensitive data.
They will also control the mathematical bound on privacy violation that could take place. In the
above approach, users can perform data computation without any leakage of data. To prevent
information leak, SELinux [14] will be used. SELinux is nothing but Security-Enhanced Linux,
which is a feature that provides the mechanism for supporting access control security policy
through the use of Linux Security Modules (LSM) in the Linux Kernel. Enforcement of
differential privacy will be done using modification to Java Virtual Machine and the Map Reduce
framework. It will have inbuilt applications which store the user identity pool for the whole cloud
service. So the cloud service will not have to maintain each user's identity for each application. In
addition to the above methodologies, cloud service will support third party authentication. The
third party will be trusted by both the cloud service and accessing user. Third party authentication
will add an additional security layer to the cloud service.
Real time access control will be a good security measure in the cloud environment. In addition to
access control to the cloud environment, operational control within a database in the cloud can be
used to prevent configuration drift and unauthorized application changes. Multiple factors such as
IP address, time of the day, and authentication method can be used in a flexible way to employ
above measures. For example, access can be restricted to specific middle tier, creating a trusted
path to the data. Keeping a security administrator separate from the database administrator will be
a good idea. The label security method will be implemented to protect sensitive data by assigning
data label or classifying data.
Data can be classified as public, confidential and sensitive. If the user label matches with the label
of the data, then access is provided to the user. Examination of numerous data breaches has
shown that auditing could have helped in early detection of problems and avoids them. Auditing
of events and tracking of logs taking place in the cloud environment will enable possible attack.
Fine grain auditing just like Oracle 9i enables conditional auditing on the specific application
column.

60 Computer Science & Information Technology (CS & IT)
5. CONCLUSION
Cloud environment is widely used in industry; therefore security is an important aspect for
businesses running on these cloud environments. Using proposed approaches, cloud environments
can be secured for complex business operations.
REFERENCES
[1] Ren, Yulong, and Wen Tang. "A SERVICE INTEGRITY ASSURANCE FRAMEWORK FOR
CLOUD COMPUTING BASED ON MAPREDUCE."Proceedings of IEEE CCIS2012. Hangzhou:
2012, pp 240 – 244, Oct. 30 2012-Nov. 1 2012
[2] N, Gonzalez, Miers C, Redigolo F, Carvalho T, Simplicio M, de Sousa G.T, and Pourzandi M. "A
Quantitative Analysis of Current Security Concerns and Solutions for Cloud Computing.". Athens:
2011., pp 231 – 238, Nov. 29 2011- Dec. 1 2011
[3] Hao, Chen, and Ying Qiao. "Research of Cloud Computing based on the Hadoop platform.".
Chengdu, China: 2011, pp. 181 – 184, 21-23 Oct 2011.
[4] Y, Amanatullah, Ipung H.P., Juliandri A, and Lim C. "Toward cloud computing reference
architecture: Cloud service management perspective.". Jakarta: 2013, pp. 1-4, 13-14 Jun. 2013.
[5] A, Katal, Wazid M, and Goudar R.H. "Big data: Issues, challenges, tools and Good practices.".
Noida: 2013, pp. 404 – 409, 8-10 Aug. 2013.
[6] Lu, Huang, Ting-tin Hu, and Hai-shan Chen. "Research on Hadoop Cloud Computing Model and its
Applications.". Hangzhou, China: 2012, pp. 59 – 63, 21-24 Oct. 2012.
[7] Wie, Jiang , Ravi V.T, and Agrawal G. "A Map-Reduce System with an Alternate API for Multi-core
Environments.". Melbourne, VIC: 2010, pp. 84-93, 17-20 May. 2010.
[8] K, Chitharanjan, and Kala Karun A. "A review on hadoop — HDFS infrastructure extensions.". JeJu
Island: 2013, pp. 132-137, 11-12 Apr. 2013.
[9] Bertino, Elisa, Silvana Castano, Elena Ferrari, and Marco Mesiti. "Specifying and enforcing access
control policies for XML document sources." pp 139-151.
[10] E, Bertino, Carminati B, Ferrari E, Gupta A , and Thuraisingham B. "Selective and Authentic Third-
Party Distribution of XML Documents."2004, pp. 1263 - 1278.
[11] Kilzer, Ann, Emmett Witchel, Indrajit Roy, Vitaly Shmatikov, and Srinath T.V. Setty. "Airavat:
Security and Privacy for MapReduce."
[12] "Securing Big Data: Security Recommendations for Hadoop and NoSQL Environments." Securosis
blog, version 1.0 (2012)
[13] P.R , Anisha, Kishor Kumar Reddy C, Srinivasulu Reddy K, and Surender Reddy S. "Third Party
Data Protection Applied To Cloud and Xacml Implementation in the Hadoop Environment With
Sparql."2012. 39-46, Jul – Aug. 2012.
[14] "Security-Enhanced Linux." Security-Enhanced Linux. N.p. Web. 13 Dec 2013.

Computer Science & Information Technology (CS & IT) 61
Authors
Venkata Narasimha Inukollu
PhD Student
Department of Computer Science & Engineering
Texas Tech University, USA.
B.E. (Information technology & Science), 2004, VRSEC, Vijayawada, INDIA.
M.E. (Software Engineering), 2007, BITS-Pilani, Rajasthan, INDIA
Areas of Interest: Software Engineering, Mobile software engineering, secure software engineering, secure
specifications. Sailaja Arsi
MS Student
Department of Computer Science & Engineering
Texas Tech University, USA.
Srinivasa Rao Ravuri Project Lead
Department of Banking and Financial Services, Cognizant Technology Solutions, India
B. Tech. (Instrumentation engineering), 2004, VRSEC, Vijayawada, INDIA.
M. Tech. (Instrumentation engineering), 2006, Anna University, Chennai, INDIA.

62 Computer Science & Information Technology (CS & IT)
INTENTIONAL BLANK

Sundarapandian et al. (Eds) : CCSEA, EMSA, DKMP, CLOUD, SEA - 2014
pp. 63–73, 2014. © CS & IT-CSCP 2014 DOI : 10.5121/csit.2014.4306
MULTIPLE DAG APPLICATIONS
SCHEDULING ON A CLUSTER OF
PROCESSORS
Uma Boregowda1 and Venugopal Chakravarthy
2
1Department of Computer Science and Engineering, Malnad College of
Engineering, Hassan, India [email protected]
2Department of Electronics and Engineering, Sri Jayachamarajendra College of
Engineering, Mysore, India [email protected]
ABSTRACT
Many computational solutions can be expressed as Directed Acyclic Graph (DAG), in which
nodes represent tasks to be executed and edges represent precedence constraints among tasks.
A Cluster of processors is a shared resource among several users and hence the need for a
scheduler which deals with multi-user jobs presented as DAGs. The scheduler must find the
number of processors to be allotted for each DAG and schedule tasks on allotted processors. In
this work, a new method to find optimal and maximum number of processors that can be allotted
for a DAG is proposed. Regression analysis is used to find the best possible way to share
available processors, among suitable number of submitted DAGs. An instance of a scheduler
for each DAG, schedules tasks on the allotted processors. Towards this end, a new framework
to receive online submission of DAGs, allot processors to each DAG and schedule tasks, is
proposed and experimented using a simulator. This space-sharing of processors among multiple
DAGs shows better performance than the other methods found in literature. Because of space-
sharing, an online scheduler can be used for each DAG within the allotted processors. The use
of online scheduler overcomes the drawbacks of static scheduling which relies on inaccurate
estimated computation and communication costs. Thus the proposed framework is a promising
solution to perform online scheduling of tasks using static information of DAG, a kind of hybrid
scheduling.
KEYWORDS
Task scheduling, DAG, workflow, PTG
1. INTRODUCTION
Many business, industrial and scientific areas, such as high-energy physics, bioinformatics,
astronomy, epigenomics, stock market and others involve applications consisting of numerous
components(tasks) that process data sets and perform scientific computations. These tasks
communicate and interact with each other. The tasks are often precedence-related. The problem
of scheduling jobs with precedence constraints is an important problem in scheduling theory and
has been shown to be NP-hard [1]. Data files generated by one task are needed by other tasks.
The requirement of large amount of computations and data storage of these applications can be
provided by a cluster. Because of huge technological changes in the area of parallel and

64 Computer Science & Information Technology (CS & IT)
distributed computing, powerful machines are now available at low prices. This is visible in large
spreading of cluster with hundreds of homogeneous/heterogeneous processors connected by high
speed interconnection network [2]. This democratization of cluster calls for new practical
administration tools.
The task scheduling problem is to allocate resources (processors) to the tasks and to establish an
order for the tasks to be executed by resources. There are two different types of task scheduling:
static and dynamic. Static strategies define a schedule at compile time based on estimated time
required to execute tasks and to communicate data. Static schedule can be generated only when
the application behaviour is fully deterministic and this has the advantage of being more efficient
and a small overhead during runtime. The full global knowledge of application in the form of
DAG will help to generate a better schedule. Dynamic strategies, on the other hand are applied
when tasks are generated during runtime. Tasks are assumed to be non-preemptive.
Workflows have recently emerged as a paradigm for representing complex scientific
computations [26]. Few widely used example workflows are Montage (Fig. 2), cybershake,
LIGO, SIPHT. Workflows represented by one of many workflow programming languages can be
translated into DAG, in general. Thus workflow scheduling is essentially a problem of scheduling
DAG. Although much work has been done in scheduling single workflow [3], multiple workflow
scheduling is not receiving deserved attention. Few initial studies are found in the literature [4, 5].
Because of huge computing power of a cluster and the inability of a single DAG to utilize all
processors on cluster, multiple DAG applications need to be executed concurrently. Thus a
scheduler to deal with multi-user jobs with the objectives of maximizing resource utilization and
minimizing overall DAG completion time is essential. The contributions of this paper are 1) a
new method to find minimum, optimal and maximum number of processors that can be allotted
for a DAG and this information is used to find one best way to share available processors among
multiple DAGs 2) a framework to receive submission of DAGs, find the allotment for each
submitted DAG and schedule tasks on allotted processors, with the objectives of maximizing
resource utilization and minimizing overall completion time.
1.1. Application Model
The data flow model is gaining popularity as a programming paradigm for parallel processors.
When the characteristics of an application is fully deterministic, including task's execution time,
size of data communication between tasks, and task dependencies, the application can be
represented by directed acyclic graph (DAG) as shown in Fig.1. Each node in DAG represents a
task to be performed and the edges indicate inter-task dependencies. Node weight stands for the
computation cost of the corresponding task and the edge cost represents the volume of data to be
communicated between the corresponding nodes. The node and edge weights are usually
obtained by estimation or profiling. Communication-to-Computation (CCR) is the ratio of
average communication cost to the average computation cost of a DAG. This characterizes the
nature of DAG. The objective of scheduling is to map tasks onto processors and order their
execution so that task dependencies are satisfied and minimum overall completion time is
achieved. Makespan is the total time required to complete a DAG.
1.2. Platform
A cluster with ‘P’ homogeneous processors, each of which is a schedulable resource is
considered. Processors are interconnected by a high speed and low latency network. A processor
can communicate with several other processors simultaneously with multi-port model.

Computer Science & Information Technology (CS & IT) 65
Figure 1. A Typical DAG Figure 2. Montage – a Workflow
2. RELATED WORK
Extensive work has been done on scheduling a single DAG [6, 7, 8]. Zhao et al.[4] have proposed
few methods to schedule multiple DAGs. One approach is to combine several DAGs into one by
making the entry nodes of all DAGs, immediate successors of new entry node and then use
standard methods to schedule the combined DAG. Another way is to consider tasks from each
DAG in round robin manner for scheduling. They have proposed other policies to optimize both
makespan and fairness. The key idea is to evaluate, after scheduling a task, the slowdown value of
each DAG against other DAGs and make a decision on which DAG must be considered next for
scheduling.
A list scheduling method to schedule multi-user jobs is developed by Barbosa et al. [9] with an
aim to maximize the resource usage by allowing a floating mapping of processors to a given job,
instead of the common mapping approach that assigns a fixed set of processors to a user job for a
period of time. A master DAG where each node is a user job and each edge representing a priority
of one job over another is constructed using all submitted DAGs. A list scheduling algorithm [6]
is used to schedule all tasks of Master DAG. The master DAG is created based on job priorities
and deadlines
Bittencourt et al. [10] have used Path Clustering Heuristic (PCH) to cluster tasks and the entire
cluster is assigned to a single machine. They have proposed four heuristics which differ in the
order tasks of multiple DAGs are considered for scheduling. The methods are sequential, Gap
search method, Interleave algorithm and Group DAGs method. A meta-scheduler for multiple
DAGs [11] merges multiple DAGs into one to improve the overall parallelism and optimize idle
time of resources. The efforts are limited to the static case and they do not deal with dynamic
workloads.
Duan et al. [12] have proposed a scheduling algorithm based on the adoption of game theory and
idea of sequential cooperative game. They provide two novel algorithms to schedule multiple
DAGs which work properly for applications that can be formulated as a typical solvable game.
Zhifeng et al. [13] addresses the problem of dynamic scheduling multiple DAGs from different

66 Computer Science & Information Technology (CS & IT)
users. They expose a similar approach from Zhao et al. [4] without merging DAGs. Their
algorithm is similar to G-heft algorithm.
An application which can exploit both task and data parallelism can be structured as Parallel Data
Graph (PTG) in which task can be either sequential or data parallel. Data parallelism means
parallel execution of the same code segment but on different sections of data, distributed over
several processors in a network. A DAG is a special case of PTG where task can only be
sequential task. Thus PTG scheduling is quite similar to DAG scheduling. Not much work is
carried out in Multiple PTG scheduling. Tapke et al. [5] have proposed an approach where each
PTG is given a maximum constraint on number of processors it can use and tasks are scheduled
using a known PTG scheduling algorithm. The size of each processor subset is determined
statically according to various criteria pertaining to the characteristics of PTG like maximum
width, total absolute work to be done and proportional work to be carried out.
Sueter et al. [14] have focused on developing strategies that provide a fair distribution of
resources among Parallel Task Graphs (PTG), with the objectives of achieving fairness and
makespan minimization. Constraints are defined according to four general resource sharing
policies: unbounded Share(S), Equal Share (ES), Proportional Share (PS), and Weighted
Proportional Share (WPS). S policy uses all available resources. ES policy uses equal resources
for each PTG. PS and WPS use resources proportional to the work of each PTG, where the work
is considered as critical path cost by width of PTG.
A study of algorithms to schedule multiple PTGs on a single homogeneous cluster is carried out
by Casanova et al. [15]. Therein it is shown that best algorithms in terms of performance and
fairness all use the same principle of allocating a subset of processors to each PTG and that this
subset remains fixed throughout the execution of the whole batch of PTGs. The basic idea in job
schedulers [19] is to queue jobs and to schedule them one after the other using some simple rules
like FCFS (First Come First Served) with priorities. Jackson et al. [20] extended this model with
additional features like fairness and backfilling.
Online scheduling of multiple DAGs is addressed in [16]. Authors have proposed two strategies
based on aggregating DAGs into a single DAG. A modified FCFS and Service-On-Time (SOT)
scheduling are applied. FCFS appends arriving DAGs to an exit node of the single DAG, while
SOT appends arriving DAGs to a task whose predecessors have not completed execution. Once
the single DAG has been built, scheduling is carried out by HEFT.
An Online Workflow Management (OWM) strategy [18] for scheduling multiple mix-parallel
workflows is proposed. DAG tasks are labelled, sorted, and stored into independent buffers.
Labelling is based on the upward rank strategy. The sorting arranges tasks in descendent order of
the task rank. Task scheduling referred to as a rank hybrid phase determines the task execution
order. Tasks are sorted in descending order when all tasks in the queue belong to the same
workflow. Otherwise, they are sorted in ascending order. Allocation assigns idle processors to
tasks from the waiting queue.
Raphael et al. [23] have addressed online scheduling of several applications modelled as work-
flows. They have extended a well-known list scheduling heuristic (HEFT) and adapted it to the
multi-workflow context. Six different heuristics based on HEFT key ideas are proposed. These
heuristics have been designed to improve the slowdown of different applications sent from
multiple users.
Much work has not been done on scheduling multiple DAG applications. A common approach is
to schedule a single DAG on fixed number of processors [6] but methods to find the number of
processors to be used for a DAG, are not found in literature. Tapke et al. [5] have proposed

Computer Science & Information Technology (CS & IT) 67
methods to find maximum resource constraint for each PTG, while scheduling multiple PTGs.
But they have not restricted scheduling of a PTG to the fixed set of processors. A method
proposed by Barbosa et al. allows floating number of processors to a given job, instead of fixed
number of processors. Many existing workflow scheduling methods do not use fixed set of
processors for each DAG. Instead a task based on some heuristic is picked among tasks of all
DAGs and is scheduled on a processor where it can start earliest based on some heuristic. The
work proposed in this paper is similar to Barbosa [9] method, in the sense that a fixed set of
processor is allocated for each DAG which later can be varied during runtime with the objective
of maximizing resource usage. Their work does not address several issues like - how initial
processor allotment for each DAG is made, a method to decide number of DAGs to be scheduled
concurrently among several submitted DAGs, to deal with online submission of DAGs. This work
addresses all the above mentioned issues.
3. PROCESSOR ALLOTMENT FOR A DAG
A schedule for a DAG can be obtained with varied number of processors. By increasing the
number of processors allotted for a DAG, its makespan decreases. The gain in terms of reduction
in makespan, reduces as more number of processors are allotted to a DAG. This is due to
communication overhead and limited parallelism present in DAG. The optimal and maximum
number of processors for a DAG will help in finding processor allotment while scheduling
multiple DAGs concurrently on a cluster.
3.1. Maximum Number of Processor for a DAG
The maximum number of processors a DAG can utilize depends on its nature and degree of
parallelism present in it. The number of allotted processors, beyond which DAG’s makespan
does not decrease with any more additional processors, is the maximum number of processors
that can be utilized by a DAG. A brute force method can be used to find this, by making several
calls to scheduling method and recording the makespan for each case. But an efficient binary
search based method [24] is used in this work and its time complexity is O(log n) against O(n) of
the brute force method.
3.2. Optimal Number of Processor for a DAG
Optimal number of processors for a DAG is that number up to which every added processor is
utilized well and beyond it, they are underutilized. With increase in number of allotted
processors, DAG’s makespan decreases and average processor utilization decreases due to
communication overhead and limited parallelism. Average processor utilization can best be
measured using computing area, which is the product of makespan and the number of processors
used. In this work, computing area is used to find the optimal number of processors for a DAG.
As processor allotment to a DAG is increased, makespan decreases and computing area increases.
Initially decrease in makespan is more than increase in computing area, justifying the worthiness
of increase in processor allotment. After the processor allotment reaches a certain value, the
increase in computing area is more than the decrease in makespan for every added processor,
indicating that any further increase in processors allotment is not of significant use.
By successively increasing number of processors allotted for a DAG, makespan and computing
area are recorded. The number of processors for which decrease in makespan becomes less than
the increase in computing area, fixes the optimal number of processors for a DAG.
.
68 Computer Science & Information Technology (CS & IT)
4. MULTIPLE DAGS SHARING CLUSTER
It is advantageous to schedule multiple DAGs simultaneously on a cluster instead of dedicating
the entire cluster to a single DAG, due to communication overhead. Furthermore, it is beneficial
to schedule more number of DAGs each with relatively less number of processors than
scheduling less number of DAGs each with large number of processors, because of
communication overhead. The returns, in terms of decrease in makespan, for each additional
processor differs for each DAG depending on its nature and number of processors already allotted
to it. Hence additional processors must be allotted to those DAGs which will be benefitted most
by means of reduction in makespan. To find the most benefitting DAGs, reduction in makespan
for the next added processor must be known for each DAG. Reduction in makespan for every
added processor can be best captured as an equation using regression analysis and are provided to
scheduler along with DAG. During regression analysis of large number of DAGs, it is observed
that for any DAG, makespan reduction follows either exponential or power curve. Thus for each
DAG, makespan reduction for each added processor is recorded and curve fitting is done. The
type of equation and its constants are stored along with each DAG, which then is used by the
scheduler while finding processor allotment for each DAG, while scheduling multiple DAGs. The
scheduler is invoked when a DAG arrives or a DAG completes execution. The minimum number
of processors to be allotted for each DAG is assumed to be four, by conducting the experiments
large number of times. The algorithm for the proposed scheduler is given below.
Algorithm multi_dag_scheduler()
// information submitted along each DAG – opt_proc, max_proc, eqn_type, eqn_const
//avail_proc – currently available number of free processors
// let min_core = 4
Input : submitted DAGs
Output : processor allotment and calling an instance of scheduler for each DAG
Step 1: if (arrival) then // DAG has arrived
Step 2: if (avail_proc < min_core ) then
Step 3: append to waiting queue
Step 4: else
Step 5 : allot (min_proc or max_proc or opt_proc) whichever best fits avail_proc
Step 6 : create an instance of scheduler for a DAG on allotted processors
Step 7 : endif
Step 8: else //DAG has completed
Step 9: if ( waiting queue is not empty) then
Step 10 : do_allot()
Step 11 : endif
Step 12 : end_algorithm
Algorithm do_allot()
Step 1: remove those many number of DAGs from queue beginning, whose sum of their
min_proc is less than avail_proc
Step 2 : if (sum of opt_proc of all removed DAGs is less than available processors) then
Step 3 : allot opt_proc to each removed DAG
Step 4 : else
Step 5 : for each removed DAG allot their min_proc number of processors
Step 6 : endif

Computer Science & Information Technology (CS & IT) 69
Step 7 : if (free processors are left) then
Step 8 : distribute those free processors among DAGs, in such a way that each processor is
added to that DAG for which it yields maximum reduction in makespan, using
equations types and their constants
Step 9 : endif
Step 10 : end_algorithm
5. EXPERIMENTAL SETUP AND RESULTS
5.1. Experiment Setup
A discrete-event based simulator is developed to simulate the arrival, scheduling, execution and
completion of DAGs. Simulation allows performing statistically significant number of
experiments for a wide range of application configurations. Poisson distribution is used to
simulate the arrival time of DAGs. Several kinds of benchmark DAGs from several sources are
used to experiment the proposed scheduler for different types of DAGs. Series-parallel DAGs
from Task Graphs For Free [22], random DAGs from Standard Task Graph Set [21], DAGs of
linear algebra applications like FFT, LU decomposition, Gauss-elimination, Laplace transform
and workflows like LIGO, cybershake, Montage, SIPHT[25]. DAGs with CCR values of 0.1,
0.4, 1 and 5 are used in experiments.
5.2. Results and Analysis
5.2.1. Optimal and Maximum Number of Processors for a DAG
An efficient binary search based method [24] with time complexity of O(log(n)) is used to find
the maximum number of processors a DAG can utilize. The decrease in makespan and increase in
computing area (decrease in average processor utilization) for every added processor is used to
fix the optimal number of processors for a DAG. The plot of decrease in makespan and increase
in computing area for different number of processors, for a DAG is given in Fig.3. The crossover
point gives the optimal number of processors for that DAG. The method can be used for any kind
of DAG.
Figure 3. To find Optimal Number of Processors for a DAG

70 Computer Science & Information Technology (CS & IT)
5.2.1. Multiple DAGs Scheduling
Recent works on multiple DAG scheduling [4, 5, 9, 10, 11, 12, 14] have not considered allotment
of fixed set of processors to a DAG. Instead, tasks from all DAGs are scheduled on any processor
on which they can start earliest, using some heuristic. Hence initially, it is proved experimentally
that space partitioning of processors among multiple DAGs, delivers improvement in
performance compared to combined DAGs scheduling. To experiment this, a set of DAGs of all
kinds, were scheduled on a cluster with 100 numbers of processors. The metric used is the sum of
computing area of all scheduled DAGs. To study the effect on both computation intensive and
communication intensive applications, DAGs with both low and high CCR are considered. Two
sets of DAGs each with 8 and 16 number of DAGs, under each category are considered. Thus the
four categories of DAGs are labelled as ccrl_8, ccrl_16, ccrh_8 and ccrh_16. Since the behaviour
depends on the nature of DAG, 50 sets of DAGs are considered for each category. Care is taken
to consider all different types of DAGs in the sets of DAGs. The results obtained from 50 sets are
averaged and the same is shown in Fig. 4. The performance of the proposed method is better than
combined DAGs scheduling for all four categories of DAGs. For the category ccrh_8, proposed
method shows maximum improvement of 12%, since DAGs are communication intensive and
thus scheduling tasks on fixed set of processors reduces time to complete the DAG. Performance
improvement is only 9% for the category ccrh_18, as there is less scope for further improvement
due to large number of DAGs being scheduled together.
Figure 4. Combined DAGs scheduling vs Proposed Space-sharing Schedule
The benefits of space partitioning processors which cannot be measured for DAGs with dummy
tasks are 1) as tasks of a DAG are scheduled on the same set of processors, they will be benefitted
from cache-warm and secondary memory warm. 2) an online scheduler can be used for each
DAG, after allotting a set of processors to it. 3) processor allotment for a DAG can be varied
depending on availability of processor, with the objectives of maximizing resource utilization.
A highlight of this work is to find one best way to share available processors among multiple
DAGs, using regression analysis. The proposed work is compared against policies proposed by
Tapke et al. [14] - unbounded Share(S), Equal Share (ES), Proportional Share (PS), and Weighted
Proportional Share (WPS). The strategy S which is a selfish allocations and tasks of different
DAGs are not differentiated is used as a baseline performer for other strategies as it gives an

Computer Science & Information Technology (CS & IT) 71
indication of performance of heuristics originally designed for single DAG. Values obtained are
normalized with the value of S strategy, to help in comparison. Performance metric used is
average makespan and resource utilization which is measured as the sum of computing area of all
DAGs scheduled together. Five categories of DAGs each with 4, 8, 12, 16 and 20 number of
DAGs are considered. Random, series-parallel, linear algebra DAGs and various workflows like
montage, SIPHT, epigenemics, LIGO are considered. 100 sets of DAGs are considered for each
category and the results obtained are averaged. The result is shown in Fig. 5 and Fig. 6. The
proposed method is better than all policies found in literature.
For less number of DAGs, performance of all methods is almost the same, as there will not be
much conflict for resources. With more number of DAGs, resource conflicts increase and the
proposed method shows considerable good performance over previous methods.
Figure 5. Normalized Average Makespan of Set of DAGs
Figure 6. Normalized Sum of Computing Area of Set of DAGs

72 Computer Science & Information Technology (CS & IT)
6. CONCLUSIONS
Multiple DAGs scheduling on a cluster is not receiving the deserved attention. Few methods
found in literature performing combined DAGs scheduling. But in this work, it is proposed to
allot a fixed number of processors to each DAG and an instance of local DAG scheduler to
schedule DAG’s tasks only on the allotted fixed set of processors. A method to find the maximum
and optimal number of processors that can be allotted to a DAG is given, which will be used to
find the processor allotment for each DAG while scheduling multiple DAGs. A new framework
to schedule multiple DAGs with the objectives of maximizing resource utilization and
minimizing DAGs completion time is proposed. Regression analysis is used to find the number of
processors to be allotted to each DAG while scheduling multiple DAGs. This method is proved to
outperform other methods found in literature by around 10-15%.
The other big advantage of the proposed approach is that instead of static schedule, an online
scheduler for each DAG can be used to schedule tasks, as they are generated, onto the allotted
processor. An Online scheduler overcomes drawbacks of static schedule and is more
advantageous. Also static DAG information can be used during online scheduling to further
improve performance. Because of space sharing of processors, the number of processors allotted
to each DAG can be varied during runtime, depending on the availability of free processors. This
will improve resource utilization, hence performance of the scheduler. In future work, the idea of
online scheduler and varied processor allotment for each DAG will be experimented.
REFERENCES
[1] Pinedo, M.L.: Scheduling: Theory, Algorithms, and Systems, 3rd edition. Springer (2008)
[2] D.E. Culler, J. P. Singh, and A. Gupta. Parallel Computer Architecture: A Hardware/Software
Approach. Morgan Kaufmann Publishers, inc., SanFrancisco, CA, 1999..
[3] Yu, J., Buyya, R.: A Taxonomy of Scientific Workflow Systems for Grid computing. SIGMOD
Records 34(3),44–49 (2005)
[4] Zhao, H., Sakellariou, R.: Scheduling Multiple DAGs onto Heterogeneous systems. In: Parallel and
Distributed Processing Symposium, 2006. (IPDPS 2006). 20th International, pp. 14–pp. IEEE (2006)
[5] N’takp´e, T., Suter, F., Casanova, H.: A Comparison of Scheduling Approaches for Mixed-Parallel
Applications on Heterogeneous Platforms. In: Parallel and Distributed Computing, 2007. ISPDC’07.
Sixth International Symposium on, pp. 35–35. IEEE (2007)
[6] Y.-K. Kwok and I. Ahmad. Static Scheduling Algorithms for Allocating Directed Task graphs to
Multiprocessors. ACM Computing Surveys, 31(4):406–471, 1999
[7] E. Ilavarasan and P. Thambidurai ,.Low Complexity Performance Effective Task Scheduling
Algorithm for Heterogeneous Computing Environments , Journal of Computer Sciences 3 (2): 94-103,
2007
[8] T. Hagras, J. Janeček . Static vs. Dynamic List-Scheduling Performance Comparison, Acta
Polytechnica Vol. 43 No. 6/2003
[9] J. Barbosa and A. P. Monteiro, A List Scheduling Algorithm for Scheduling Multi-user Jobs on
Clusters, High Performance Computing for Computational science- VECPA8 2008, Lecture Notes in
Computer Science volume 5336, 2008, pp123-136
[10] Bittencourt L.F., Madeira: Towards the Scheduling of Multiple Workflows on Computational Grids.
J. Grid Computing 8, 419–441 (2010)
[11] U. H. Nig and W. Schiffmann. A Meta-algorithm for Scheduling Multiple DAGs in Homogeneous
System Environments. In Proceedings of the 18th International Conference on Parallel and
Distributed Computing and Systems (PDCS’06), 2006
[12] R. Duan, R. Prodan, and T. Fahringer. Performance and Cost optimization for Multiple large-scale
Grid Workflow Applications. In Proceedings of the 2007 ACM/IEEE conference on Supercomputing,
pages 1–12, New York, NY, USA, 2007.
[13] Zhifeng Yu and Weisong Shi. A Planner-guided Scheduling Strategy for Multiple work-flow
Applications. Parallel Processing Workshops, International Conference on, 0:1–8,2008.

Computer Science & Information Technology (CS & IT) 73
[14] N’takpé, T., Suter, F.: Concurrent scheduling of parallel task graphs on multi-clusters using
constrained resource allocations. In: International Parallel and Distributed Processing
Symposium/International Parallel Processing Symposium, pp. 1–8 (2009)
[15]Casanova, H., Desprez, F., Suter, F.: On cluster Resource Allocation for Multiple Parallel Task
Graphs. Journal of Parallel and Distributed Computing 70(12), 1193–1203 (2010)
[16] Zhu, L., Sun, Z., Guo, W., Jin, Y., Sun, W., Hu, W.: Dynamic Multi DAG Scheduling Algorithm for
Optical Grid Environment. New Architecture Management Applications. V 6784(1), 1122 (2007)
[17] H Topcuoglu, S. Hariri and M. Y. Yu, Performance Effective and Low-complexity Task Scheduling
for Heterogene Computing, IEEE TPDS, 13(3):260-274, 2002
[18] Hsu, C.-C., Huang, K.-C., Wang, F.-J.: Online scheduling of workflow applications. In Grid
environments. Future Gen. Comput. Syst. 27, 860–870 (2011)
[19] R. L. Henderson, Job Scheduling under the Portable Batch System, Job Scheduling Strategies for
Parallel Processing, volume 949 of LNCS, pages 279–294, 1995.
[20] D. Jackson, Q. Snell, and M. J. Clement. Core algorithms of Job Schedule, Job Scheduling Strategies
for Parallel Processing, volume 2221 of LNCS, pages 87–102, 2001.
[21] Standard Task Graph Set http://www.kasahara.elec.waseda.ac.jp/schedule/.
[22] Task Graphs for Free http://ziyang.eecs.umich.edu/~dickrp/tgff
[23] Raphael Bolze, Frederic Desprez and Benjamin Insard, Evaluation of Online Multi-workflow
Heuristics based on List Scheduling Methods, Gwendia ANR-06-MDCA-009
[24] Uma B , C R Venugopal, A Novel Binary Search based method to find minimal number of cores
required to obtain minimal makespan, given makespan and given utilization of cores for a DAG
application, 4th International Conference on Computer and Automation Engineering, (ICCAE 2012)
January 14–15, 2012, Mumbai, India.
[25] https://confluence.pegasus.isi.edu/display/pegasus/WorkflowGenerator
[26] Taylor, I.J., Deelman, E., Gannon, D.B., Shields, Workflows for e-Science - Scientific Workflows for
Grids. Springer, New York (2007)
AUTHORS
C R Venugopal received his Ph. D from IIT, Bombay. Presently serving as a Professor
in Sri Jayachamarajendra College of Engineering, Mysore, India. His main research
interests are Cloud computing, High Performance computing, VLSI Technology and
File System development. Has authored more than 50 international conference and
journal papers.
Uma B completed M. Tech. in Computer Science and Engineering from IIT, Delhi.
Currently working as a Associate Professor in Malnad College of engineering, Hassan,
India. Her research interests are Parallel Programming, High Performance Computing
and Task scheduling.

74 Computer Science & Information Technology (CS & IT)
INTENTIONAL BLANK
Sundarapandian et al. (Eds) : CCSEA, EMSA, DKMP, CLOUD, SEA - 2014
pp. 75–84, 2014. © CS & IT-CSCP 2014 DOI : 10.5121/csit.2014.4307
TASK & RESOURCE SELF-ADAPTIVE
EMBEDDED REAL-TIME OPERATING
SYSTEM MICROKERNEL FOR WIRELESS
SENSOR NODES
Xing Kexing1, Zuo Decheng
2, Zhou Haiying
3 and HOU Kun-Mean
4
1,2,3School of Computer Science & Technology,
Harbin Institute of Technology, Harbin, China xingkexin,hyzhou, [email protected]
4Laboratory LIMOS CNRS 6158,
University of Blaise Pascal, Clermont-Ferrand, France [email protected]
ABSTRACT
Wireless Sensor Networks (WSNs) are used in many application fields, such as military,
healthcare, environment surveillance, etc. The WSN OS based on event-driven model doesn’t
support real-time and multi-task application types and the OSs based on thread-driven model
consume much energy because of frequent context switch. Due to the high-dense and large-
scale deployment of sensor nodes, it is very difficult to collect sensor nodes to update their
software. Furthermore, the sensor nodes are vulnerable to security attacks because of the
characteristics of broadcast communication and unattended application. This paper presents a
task and resource self-adaptive embedded real-time microkernel, which proposes hybrid
programming model and offers a two-level scheduling strategy to support real-time multi-task
correspondingly. A communication scheme, which takes the “tuple” space and “IN/OUT”
primitives from “LINDA”, is proposed to support some collaborative and distributed tasks. In
addition, this kernel implements a run-time over-the-air updating mechanism and provides a
security policy to avoid the attacks and ensure the reliable operation of nodes. The performance
evaluation is proposed and the experiential results show this kernel is task-oriented and
resource-aware and can be used for the applications of event-driven and real-time multi-task.
KEYWORDS
WSN, event-driven, thread-driven, scheduling strategy, over-the-air, security
1. INTRODUCTION
Wireless sensor networks (WSN) have gained a great development in recent years. Many WSN
applications are emerging rapidly and being applied in different scenarios. Unlike traditional
embedded devices, the sensor nodes have many resource constraints, such as limited energy, short
communication range, low bandwidth, and limited processing memory. In addition, sensor nodes
are generally deployed large-scaly and far from human access. Thus, the characteristics of WSN
applications bring some challenges for designing an OS on sensor nodes, described as follows:
1. To reduce power consumption and memory requirements for resource-constrained nodes.
2. To support Multi-task in view of diversity of WSN applications.
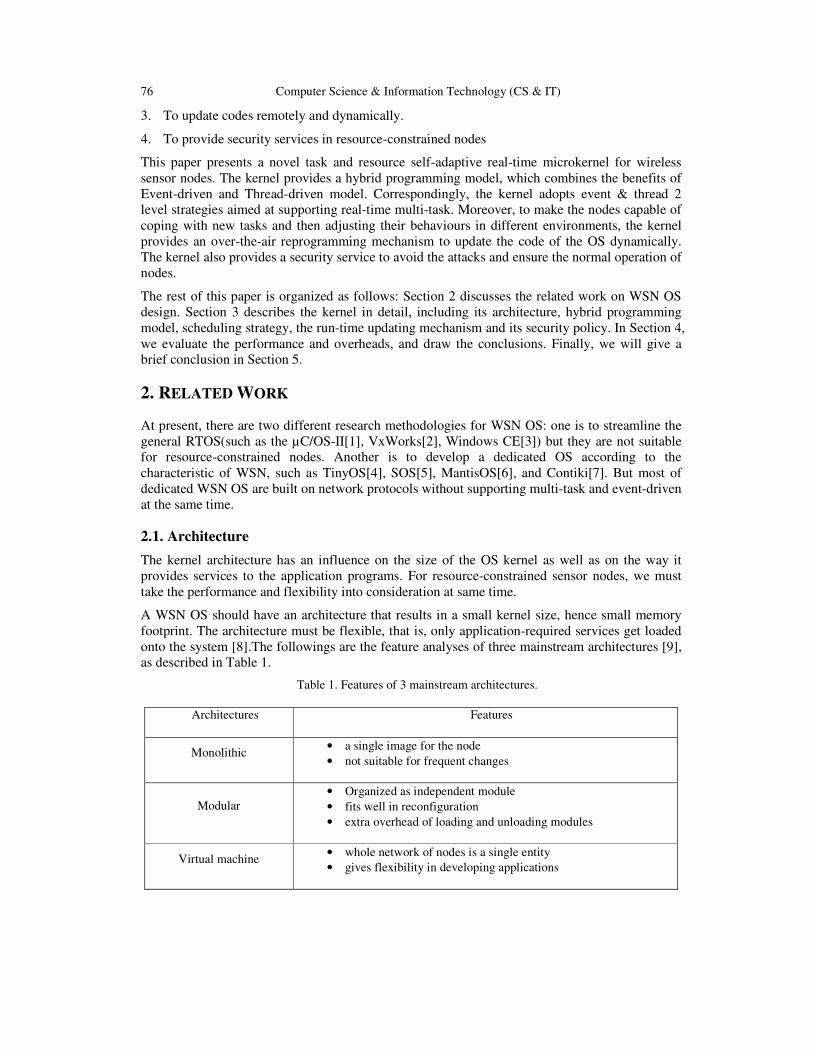
76 Computer Science & Information Technology (CS & IT)
3. To update codes remotely and dynamically.
4. To provide security services in resource-constrained nodes
This paper presents a novel task and resource self-adaptive real-time microkernel for wireless
sensor nodes. The kernel provides a hybrid programming model, which combines the benefits of
Event-driven and Thread-driven model. Correspondingly, the kernel adopts event & thread 2
level strategies aimed at supporting real-time multi-task. Moreover, to make the nodes capable of
coping with new tasks and then adjusting their behaviours in different environments, the kernel
provides an over-the-air reprogramming mechanism to update the code of the OS dynamically.
The kernel also provides a security service to avoid the attacks and ensure the normal operation of
nodes.
The rest of this paper is organized as follows: Section 2 discusses the related work on WSN OS
design. Section 3 describes the kernel in detail, including its architecture, hybrid programming
model, scheduling strategy, the run-time updating mechanism and its security policy. In Section 4,
we evaluate the performance and overheads, and draw the conclusions. Finally, we will give a
brief conclusion in Section 5.
2. RELATED WORK
At present, there are two different research methodologies for WSN OS: one is to streamline the
general RTOS(such as the µC/OS-II[1], VxWorks[2], Windows CE[3]) but they are not suitable
for resource-constrained nodes. Another is to develop a dedicated OS according to the
characteristic of WSN, such as TinyOS[4], SOS[5], MantisOS[6], and Contiki[7]. But most of
dedicated WSN OS are built on network protocols without supporting multi-task and event-driven
at the same time.
2.1. Architecture
The kernel architecture has an influence on the size of the OS kernel as well as on the way it
provides services to the application programs. For resource-constrained sensor nodes, we must
take the performance and flexibility into consideration at same time.
A WSN OS should have an architecture that results in a small kernel size, hence small memory
footprint. The architecture must be flexible, that is, only application-required services get loaded
onto the system [8].The followings are the feature analyses of three mainstream architectures [9],
as described in Table 1.
Table 1. Features of 3 mainstream architectures.
Architectures Features
Monolithic • a single image for the node
• not suitable for frequent changes
Modular
• Organized as independent module
• fits well in reconfiguration
• extra overhead of loading and unloading modules
Virtual machine • whole network of nodes is a single entity
• gives flexibility in developing applications

Computer Science & Information Technology (CS & IT) 77
2.2. Programming Model
An appropriate programming model not only facilitates software development but also promotes
good programming practices [10]. The issue between event-driven mode and thread-driven model
has been discussed in the WSN field for years. Table 2 shows the advantages and disadvantages
of event-driven and thread-driven model with its corresponding OSs [11].
Table 2. Event-driven vs.Thread-driven
Model advantages disadvantages OS
Event-
driven
• Concurrency with low
resources
• Inexpensive scheduling
• Complements the way
networking protocols work
• Highly portable
• Event-loop is in control
• Can’t be preempted and do
not support multi-task
• Bounded buffer producer
consumer problem
Tiny
OS,
SOS,
Contik
Thread-
driven
• Eliminates bounded buffer
problem
• Automatic scheduling
• Real-time performance
• Simulates parallel execution
• Complex shared memory
• Expensive context switches
• Complex stack analyze
Contiki
Mantis
OS
2.3. Run-time Remote-updating
Due to the dense and large-scale deployment of the sensor nodes, we should provide a mechanism
to update nodes over-the-air: collecting nodes to apply updates is often tedious or even dangerous
[12]. Remote code-update schemes for sensor nodes meet two key challenges: (1) resource
consumption and (2) integration into the system architecture. Existing approaches can be
classified into three main categories.
Full-Image Replacement: These techniques such as XNP [14] or Deluge [15] operate by
disseminating a new binary image of an application and the OS in the network. However,
frequent full image replacements result in huge energy consumption and short-life of sensor node.
Virtual Machines (VM): VMs can reduce the energy-cost of disseminating new functionality in
the network as VM code is commonly more compact than native code [16]. However, as
mentioned in architecture, it is hard to be realized on a resource-constrained sensor node.
Dynamic Module Loading: It is also called the incremental update. Unlike the full image
replacement, the kernel will not be modified and just add e new or remove modules, such as
Contiki, SOS and TinyOS. This mechanism can reduce the updating code size and energy-
consumption.

78 Computer Science & Information Technology (CS & IT)
2.4. Security Guarantee
WSNs suffer from many constraints, including low computation capability, small memory,
limited energy resources, susceptibility to physical capture, and the use of insecure wireless
communication channels. These constraints make security in WSNs a challenge.
At present, the researches on security are classified into five categories: cryptography, key-
management, secure routing, secure data aggregation, and intrusion detection. Among them,
cryptography and key-management are regarded as the core issues in WSN security.
3. TASK & RESOURCE SELF-ADAPTIVE OPERATING SYSTEM DESIGN
3.1. Microkernel Design
3.1.1. Architecture
As the kernel is task and resource self-adaptive, we must take the performance and the flexibility
into consideration at the same time. So the kernel takes the modular structure based on its
requirement as illustrated.
Figure 1. Architecture of task-oriented and resource-aware operating system
Figure 1 shows the kernel structure of task and resource self-adaptive WSN OS. The hardware
driver is isolated from the kernel. Applications can also access kernel function by API and system
call. Moreover, Applications are loaded as modules for processing the specific task. By this way,
the node can adapt to the environment automatically.
3.1.2. Hybrid programming model
As mentioned in section 2, the event can’t be preempted and doesn’t support real-time multi-task.
And thread-driven model consumes much energy on context switching .The kernel integrates
advantages of the event-driven and thread-driven model and proposes a hybrid programming
model. The kernel is defined as a set of events, and an event is then defined as a set of threads, as
shown in Equation 1 and 2
K=Ei:i=1,2,···,n; E1→E2···→En (1)
Ei=Ti,j: j=1,2, ···,n;Ti,1//Ti,2 //···//Ti,n (2)
The K is an instance of the kernel, E represents an event and T is a thread. The symbol ‘→’
indicates the precedence operation and ‘//’ indicates the concurrent operation.
The feature of the hybrid programming model is that the node can easily switch operation mode
between two typical programming models according to the kind of task. If we set the event
number equal 1, the kernel runs in the manner of multi-thread model, shown in Figure 2. While if
event contains a single thread, the kernel runs in the manner of event-driven model.

Computer Science & Information Technology (CS & IT) 79
The kernel is task self-adaptive automatically to work in different modes, thus the scopes of
applications will be greatly extended.
Figure 2. Switch to the thread-driven mode &Switch to Event-driven mode
3.1.3. Communication Scheme
From the view of operating system, the communication refers to two parts: internal
communication in single node and the communication between nodes. In addition, most of WSN
OS is designed for a single node without supporting communication in distributed network.
Therefore, the kernel proposes a scheme to unify the inter-process communication and
communication between nodes. This scheme is based on “tuple space”, a thought from a parallel
programming language “Linda” [17], through “In / Out” system primitives to achieve the
communication of inter-event, inter-thread, event/thread-peripherals and inter-CPU, as shown in
Figure 3. Each “tuple” is identified by one numeric identifier, which can be assigned to the local
or distributed buffer. And user can customize it automatically.
Figure 3. Tuple-based unified communication scheme
3.1.4. Scheduling strategy.
Based on hybrid programming model and tuple space, the kernel offers a two-level scheduling
strategy: ‘event-driven’ (scheduling for events) and ‘priority-based preemptive’ (scheduling for
threads).
Event management
Each event is associated with a unique tuple identified by a numeric identifier. A tuple has its
private buffer space which is used for storing messages or signals received from hardware or
software interrupts. Each event has also a priority level which is adapted automatically to the
message number of the event tuple according to the event priority. The priority of the event can
be pre-defined by programmer, as shown in (3)
Event_next = select_event( tuple_msg_num, priority) (3)
The strategy is sensitive to the memory consumption and proved a solution for the problem that
event cant’ be preempted. Thus, the kernel can make a rapid response to emergent tasks.

80 Computer Science & Information Technology (CS & IT)
Thread scheduler
In comparison with events, threads have one more state named ‘Suspend’. If the operating
condition is not met, this thread is blocked and its state changes to ‘Suspend’. Whereas, if the
operating condition is satisfied, the suspended thread is activated to resume running and its state
changes to ‘Ready’. Each thread is allocated with a unique priority level. Thread can be
preempted by other threads in a same event. The kernel adopts a ‘priority-based preemptive’
scheduling scheme and the scheduler will decide next-run thread through look up the value of
thread_priority and thread_timeslice, as shown in Equation (4)
thread_next=select_thread(priotity,time_slice) (4)
Through switching the threads, the system can process multiple tasks concurrently. For some
periodic tasks such as data collections, sampling and interval routing, the kernel can be
customized to thread-driven mode and process them at the same time. However, if the system is
used to detect some events, the kernel can be switched to the event-driven mode to make a rapid
response.
3.2. Run-time over-the-air updating mechanism
As the kernel is task-oriented, it is necessary for nodes to provide a run-time over-the-air updating
mechanism, which is described from three levels according to granularity of updating code size.
Global variable modification
In the kernel, there exist many global variables pre-defined by developers, which can determine
the operating routines. Through modifying the global variable in the ram, the node can be
switched to another operation mode. So the kernel will maintain a variable table which keeps the
information of the global variables, including the variable name and the physical address. After
rebooting the nodes, the new mode is activated. Meanwhile, a set of remote-commands is
designed to inform the node to update the global variables. The method relatively consumes little
power because only several bytes are transmitted and modified.
Dynamically loading Module
In the modular architecture, the kernel can load new module or unload the existing module at run
time without rebooting the node. Thus, just the necessary modules need to be transmitted, that is
an efficient way to reduce the update code size and optimize the power usage. The procedure can
be divided into the following steps [18]:
1. Meta-Data Generation: The meta-data consists of information about the whole program,
component specific information, symbol information, and the relocation table.
2. Code Distribution: during this step, the new modules together with their meta-data are
transmitted from the base station or the sink node.
3. Data Storage on the Node: Once modules with meta-data are received at the radio interface of
the node, they are stored in the external FLASH memory.
4. Register module: the kernel merges information of the new module’s meta-data with the old
symbol table in order to access to the new module and invoke the new functions.
5. Relocation Table Substitution: the kernel will substitute the old relocation table with the new
one.
6. Update References: through the new relocation table, the kernel can update the references of
the global variable in the data segment or the function address in the code segment.
Full image replacement
This level is designed for updating the whole kernel image. Namely, when the new version of the
kernel differs from the old one greatly, the node should erase the whole image and program the

Computer Science & Information Technology (CS & IT) 81
new version into the flash. For resource-constrained nodes, it is unlikely to modify the kernel
frequently. So full image replacement is relatively rarely used.
3.3. Security policy
Due to the nature of wireless connection and unattended mode, the sensor node is prone to
security attack. The kernel provides a security policy for sensor nodes, in order to guarantee the
normal operation of the nodes and support reliable and efficient code distribution.
3.3.1. Cryptography
The traditional encryption algorithm is divided in two categories: symmetric cryptography (such
as RC4, RC5, SHA-1 and MD5) and asymmetric cryptography (such as RSA and ECC).
Therefore, the kernel adopts a tow-level cryptography mechanism, as shown in Figure 4. In
symmetric cryptography, hashing algorithms (MD5 and SHA-11) incurred almost an order of a
magnitude higher overhead than encryption algorithms (RC4, RC5). Thus, RC5 is adopted for
communication between resource-constrained nodes. Meanwhile, the RSA algorithm, a typical
asymmetric cryptography is applied for communication between nodes and sink node or base
station which has adequate resource.
Figure 4. The two-level cryptography mechanism
3.3.2. Key Management.
In Sensor networks end-to-end encryption is impractical because of large number of
communicating nodes and each node is incapable of storing large number of encryption keys. We
assume that the number of sensor nodes in WSN is N. Storing the keys of other N-1 nodes will
occupy large memory of the limited memory nodes.
In order to reduce the memory the keys occupied, the kernel takes the hop-by-hop encryption
mechanism, in which each sensor node stores encryption keys shared with its immediate
neighbours. Thus the keys stored in nodes can be divided into 2 parts: the keys Kn, which is
shared with its neighbours and the key Ks, which is shared with the base station or sink node.
This mechanism reduces the memory the keys occupied and the power consumption of
transmitting keys.

82 Computer Science & Information Technology (CS & IT)
4. EVALUATION
4.1. Sensor platform
The kernel has been tested on the AT91SAM7S evaluation board which include AT91SAM7S256
processor core (based on arm7),256Kbytes Flash, 64Kbytes SRAM, and peripherals such as
UART, SPI, and I2C etc. The RF module is XBEE-PRO [21] (based on Zigbee) which
communicates with the processor core through UART (RS-232 protocol).
4.2. Performance analysis
4.2.1. Memory usage
Table 3 shows the storage usage of the kernel. It occupies no more than 5KB and is suitable for
resource-constrained sensor node. The code size of whole image which includes kernel, hard
drivers and applications is less than 30KB. Thus, the kernel is flexible and portable to
heterogeneous sensor nodes.
Table 3. Code size and data size of the kernel and whole system
Code size(bytes) Data size(bytes)
Kernel 3572 1272
Kernel+Driver+Applications 16988 11929
4.2.2. Power analysis
To reduce energy consumption, the main energy-aware module of the sensor node
(microprocessor, wireless RF module) support low power mode, as shown in Table 4.
Table 4. Power consumption evaluation
Chips Power consumption
Normal mode Low power mode
AT91SAM7S256(48MHz) <50mA <60µA
Xbee-pro
Transmit Mode <250mA
Receive Mode <50mA
Sleep Mode <50µA
When the system is in idle state (no data transmission or no running components), the kernel can
customize the node configuration to make it run at low power mode to reduce the consumption
and prolong the lifetime of the node. Thus, it demonstrated that the kernel is task and resource
self-adaptive for sensor node.
4.2.3. Overhead of scheduling strategy
The kernel adopts event/thread 2 level scheduling strategies to support real-time multi-task. This
paper evaluates the overhead of scheduling strategy from 3 aspects: Interrupt response time,
Event switch time and Thread switch time.

Computer Science & Information Technology (CS & IT) 83
Table 5. Overhead of scheduling strategy Overhead
(instruction cycle) Time (µS)(48Mhz)
min avg max min avg max
Event switch time 164 168 516 3.4 3.5 10.7
Thread switch time 176 93 798 3.6 1.9 16.6
Interrupt response time 157 194 395 3.2 4 8.2
Table 5 shows the overhead of the scheduling strategy through testing the average time
mentioned above.
4.2.4. Overhead of run-time updating mechanism
As mentioned in chapter 3, the paper proposes a run-time remote-updating scheme from 3 levels
according to the granularity of the updating code size. Obviously, the overhead and power
consumption is determined by the code size disseminated to a great extent. The paper evaluates
the overhead from two aspects, dynamic loading of modules and full image replacement.
Table 6. Comparison of energy-consumption of dynamic loading and full image replacement
step Dynamic loading (mJ) Full image replacement(mJ)
Code size 160bytes 28917bytes
Receive data 17mJ 330mJ
Store data 1.1mJ 22mJ
Reloc&ref updating 14.mJ 0mJ
As the meta-data generation is executed in sink node or base station, the paper evaluate the
energy-consumption of the rest of steps, which are executed in sensor node. The table 6 shows the
Comparison of energy-consumption of dynamic loading and full image replacement.
5. CONCLUSION
This paper presents a novel task and resource self-adaptive real-time microkernel for wireless
sensor nodes. Based on the modular architecture, the kernel integrates the benefits of Event-
driven and Thread-driven model to make the kernel capable of processing real-time tasks and
multi-task. Moreover, in order to adapt to the complex environment, the sensor nodes are enabled
to be customized and configured dynamically through the run-time over-the-air updating
mechanism. A two level Cryptography mechanism and key management is also proposed for
resource-constrained node to guarantee the reliable and efficient communication and code
distribution.
Through analysis of the evaluation results, the kernel has good performance in communication
throughout, supporting real-time task, and over-the-air updating mechanism. Compared with
other dedicated WSN OSs, the kernel consumes more energy and memory. The verification of the
updating code integrity should also be taken into account in over-the-air updating mechanism. In
addition, there is still much room for optimizing the cryptography algorithm and managing the
keys more efficiently.
Finally, the kernel extends the range of WSN application and provides the reliability and
robustness for the complex application.

84 Computer Science & Information Technology (CS & IT)
REFERENCES
[1] J.J. Labrosse.Micro/OS-II, the Real-time Kernel, Second edition. Technical Document. 2002: 2-3.
[2] Dedicated Systems Magazine. VxWorks/x86 5.3.1 evaluation, RTOS evaluations. URL:
http://www.dedicated-systems.com. 2000.
[3] Microsoft Corporation. Which to choose: Evaluating Microsoft windows CE.NET and windows XP
embedded. Technical Report. 2001: 3-6.
[4] Levis P, Madden S, Polastre J, et al. TinyOS: An Operating System for Sensor Networks. Ambient
Intelligence(Part II), 2005, 35: 115-148.
[5] C.-C. Han, R. Kumar, R. Shea, E. Kohler and M. Srivastava. A Dynamic Operating System for Sensor
Nodes. In Proceedings of the 3rd International Conference on Mobile Systems, Applications, and
Services. New York, USA. 2005: 163-176.
[6] Abrach H, Bhatti S, Carlson J, et al. MANTIS OS: An Embedded Multithreaded Operating System
for Wireless Micro Sensor Platforms. Mobile Networks & Applications (MONET), 2005,10(4): 50-59
[7] Dunkels, Adam, Bjorn Gronvall, and Thiemo Voigt. "Contiki-a lightweight and flexible operating
system for tiny networked sensors." Local Computer Networks, 2004. 29th Annual IEEE International
Conference on. IEEE, 2004.
[8] Farooq, Muhammad Omer, and Thomas Kunz. "Operating systems for wireless sensor networks: A
survey." Sensors 11.6 (2011): 5900-5930.
[9] Anil Kumar Sharma,Surendra Kumar Patel,Gupteshwar Gupta. Design issues and classification of
WSNs Operating Systems. International Journal of Smart Sensors and Ad Hoc Networks (IJSSAN),
ISSN No. 2248-9738 (Print), Vol-2, Iss-3,4, 2012.
[10] Chen, Yu-Ting, Ting-Chou Chien, and Pai H. Chou. "Enix: a lightweight dynamic operating system
for tightly constrained wireless sensor platforms." Proceedings of the 8th ACM Conference on
Embedded Networked Sensor Systems. ACM, 2010.
[11] Moubarak, Mohamed, and Mohamed K. Watfa. "Embedded operating systems in wireless sensor
networks." Guide to Wireless Sensor Networks. Springer London, 2009. 323-346.
[12] Pompili, Dario, TommasoMelodia, and Ian F. Akyildiz. "Deployment analysis in underwater acoustic
wireless sensor networks." Proceedings of the 1st ACM international workshop on Underwater
networks. ACM, 2006.
[13] Munawar, Waqaas, et al. "Dynamic Tinyos: Modular and transparent incremental code-updates for
sensor networks." Communications (ICC), 2010 IEEE International Conference on. IEEE, 2010.
[14] J. Jeong, S. Kim, and A. Broad, “Network reprogramming,” Aug 12,2003. [Online]. Available:
http://www.tinyos.net/tinyos-1.x/doc/Xnp.pdf
[15] J. W. Hui and D. Culler, “The dynamic behavior of a data dissemination protocol for network
programming at scale,” in SenSys ’04, 2004.
[16] R. M¨ uller, G. Alonso, and D. Kossmann, “A virtual machine for sensor networks”,SIGOPSOper.
Syst. Rev., vol. 41, no. 3, pp. 145–158, 2007
[17] Steiner, Rodrigo, et al. "An operating system runtime reprogramming infrastructure for WSN."
Computers and Communications (ISCC), 2012 IEEE Symposium on. IEEE, 2012.
[18] Poschmann, Axel, Dirk Westhoff, and Andre Weimerskirch. "Dynamic code update for the efficient
usage of security components in wsns."Communication in Distributed Systems (KiVS), 2007 ITG-GI
Conference. VDE, 2007.
[19] Atmel Ltd. AT91SAM7S-EK Evaluation Board User Guide.Technical Document. 2006: 12-19.
[20] MaxSream, Inc. XBee™/XBee-PRO™ OEM RF Modules Product Manual. Technical Document.
2006.
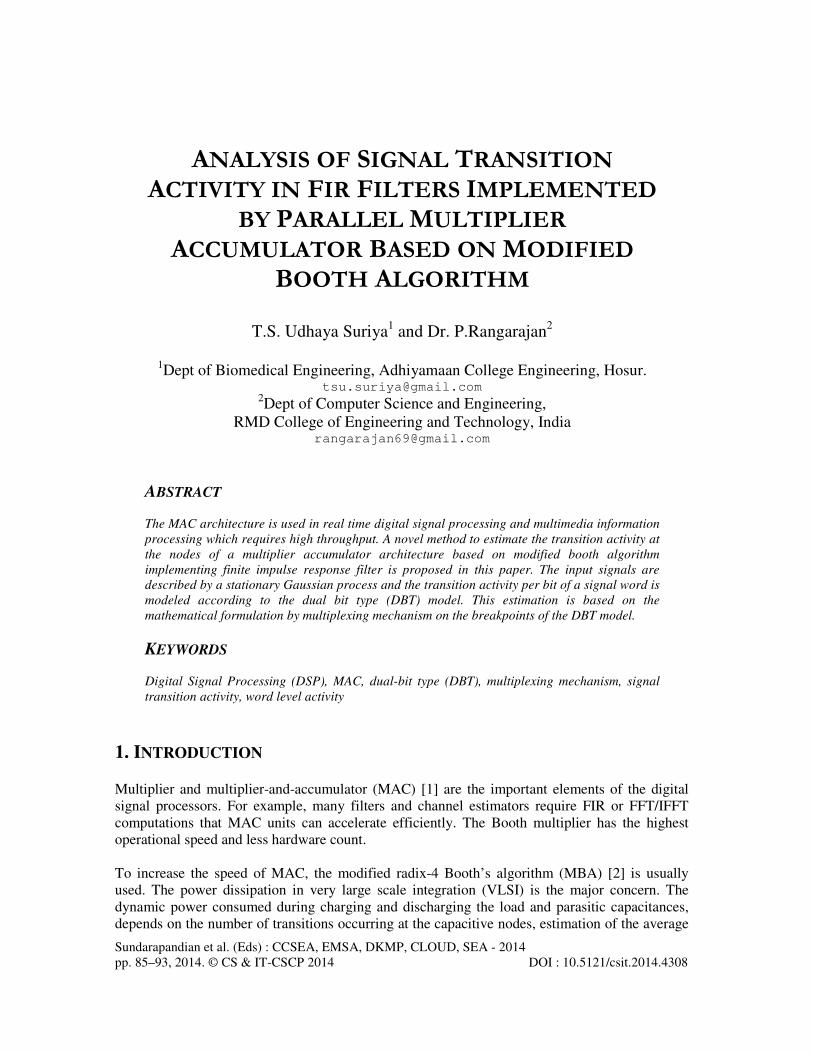
Sundarapandian et al. (Eds) : CCSEA, EMSA, DKMP, CLOUD, SEA - 2014
pp. 85–93, 2014. © CS & IT-CSCP 2014 DOI : 10.5121/csit.2014.4308
ANALYSIS OF SIGNAL TRANSITION
ACTIVITY IN FIR FILTERS IMPLEMENTED
BY PARALLEL MULTIPLIER
ACCUMULATOR BASED ON MODIFIED
BOOTH ALGORITHM
T.S. Udhaya Suriya1 and Dr. P.Rangarajan
2
1Dept of Biomedical Engineering, Adhiyamaan College Engineering, Hosur.
[email protected] 2Dept of Computer Science and Engineering,
RMD College of Engineering and Technology, India [email protected]
ABSTRACT
The MAC architecture is used in real time digital signal processing and multimedia information
processing which requires high throughput. A novel method to estimate the transition activity at
the nodes of a multiplier accumulator architecture based on modified booth algorithm
implementing finite impulse response filter is proposed in this paper. The input signals are
described by a stationary Gaussian process and the transition activity per bit of a signal word is
modeled according to the dual bit type (DBT) model. This estimation is based on the
mathematical formulation by multiplexing mechanism on the breakpoints of the DBT model.
KEYWORDS
Digital Signal Processing (DSP), MAC, dual-bit type (DBT), multiplexing mechanism, signal
transition activity, word level activity
1. INTRODUCTION
Multiplier and multiplier-and-accumulator (MAC) [1] are the important elements of the digital
signal processors. For example, many filters and channel estimators require FIR or FFT/IFFT
computations that MAC units can accelerate efficiently. The Booth multiplier has the highest
operational speed and less hardware count.
To increase the speed of MAC, the modified radix-4 Booth’s algorithm (MBA) [2] is usually
used. The power dissipation in very large scale integration (VLSI) is the major concern. The
dynamic power consumed during charging and discharging the load and parasitic capacitances,
depends on the number of transitions occurring at the capacitive nodes, estimation of the average

86 Computer Science & Information Technology (CS & IT)
number of bit level signal transitions is a most requirement of the power estimation techniques.
Estimation of the data path power consumption at the architectural level based on the dual –bit-
type (DBT) model has been explained in [3]. In DBT model, the LSB’s of a word behaves as
random sequences and the MSB’s exhibits nonrandom behavior. The bit level activity is
explained in [4]. The DBT model and high level signal statistics for the estimation of the bit level
transition activity on filters has been proposed in [5]. This paper deals with the accurate
calculation of transition activity at the nodes of a MAC which is used in FIR filter, is discussed.
The DBT model is followed to calculate required word-level signal statistics at the nodes of the
MAC, with known statistics.
2. MULTIPLIER ARCHITECHTURE
Fig.1. Basic arithmetic operation of multiplication and accumulation
The Multipliers has two parts. The first part is to generate the partial products, and the second one
is to collect and add them. The multiplier accumulator composed of three blocks: the booth
encoder, partial product summer and accumulator, and final adder. The partial product can be
generated by using any one of the multiplication algorithm which uses bit serial, serial-parallel,
or full parallel techniques. The booth algorithm or the modified booth algorithm is used for the
generation of partial products. The basic arithmetic operation of multiplication and accumulation
is shown in fig.1. The signed multiplication based on 2’s complement is possible. If N-bit data

Computer Science & Information Technology (CS & 87
are multiplied the number of partial product also equal to N. the Modified Booth encoding is used
to reduce the number of partial products [7].
Fig.2. Multiplication process by Modified Booth Encoding.
3. WORD LEVEL STATISTICS AND TRANSITION ACTIVITY
The input sequence of a DSP system bex(n) and can be modeled by stationary Gaussian process
with mean value µ variance σ2
, and correlation factor ρ. Let b<i>(n), be the ith bit of the binary
word representing x(n). The probability of b<i>(n) be one or zero and is denoted by
respectively, the conditional probability of b<i>(n) be in state lis given by b<i>(n-1), in state k is
denoted by , where k, l = 0,1. The transition probability is the probability of b<i>(n) = 1
and b<i>(n) = k. Therefore Thus, the transition activity ti of b<i>(n) is
It is observed that for and therefore
The transition activity is a function of bit level correlation factor ρ<i> [5].

88 Computer Science & Information Technology (CS & IT)
4. BIT LEVEL STATISTICS
The bit level correlation factor is modeled by DBT model [5],[3]. A signal word is divided into
three regions of continuous bits as the LSB, linear and MSB regions. The breakpoints BP0 and
BP1 which defines the linear regions given by
The MSB’s are highly correlated signals which have low transition activity while anticorrelated
ones possess high activity. The transition activity can be expressed as
Where tmsb is the activity of the MSB. For zero mean Gaussian signals, the word level correlation
factor for tmsb is given by
5. SIGNAL STATISTICS IN FIR FILTER
The signal statistics at the output of the l th tap of an FIR filter is the function of the input
statistics and the filter coefficients are expressed as

Computer Science & Information Technology (CS & 89
The structure of FIR filter is shown in fig.3.
Fig.3.FIR filter structure
6. MAPPING THE FIR FILTER STRUCTURE ON A MAC BASED ON
MODIFIED BOOTH ALGORITHM
The architecture of FIR filter implemented by MAC using modified Booth algorithm is shown in
Fig.4. Registers are inserted at the input and output of the MAC unit to increase the data
throughput rate. The sampling period of the input signal at the nodes of the filter structure is a
sequence in the time domain at the corresponding nodes of the MAC architecture. During the nth
input signal sampling period, the sequence [ x(n), x(n-1), x(n-2)….x(n-k+1)] appears at the input
node #1 of the MAC. The control signal is given at node #2, is a increasing integer in the interval
[0, k-1], returning back to zero at every new sample. A mathematical approach to find the
statistics of its input sequence is mixing method [8]. The output distribution is a linear
combination of the inputs. When all the inputs show identical normal distribution the output
distribution remains Gaussian. When all the input sequences have equal mean values and
different variances the output distribution is symmetric around the mean value, but not normal.
When the input sequences have different mean values, the output distribution is nonsymmetric.

90 Computer Science & Information Technology (CS & IT)
Fig.4.Signal activity at the nodes of MAC unit with Modified Booth Algorithm
7. SIGNAL ACTIVITY AT THE NODES OF MAC
The input signals at the nodes of the MAC unit are the output from the multiplexers. The
multiplexing mechanism is used for the signal statistics. The input signal x(n) is described by a
stationary Gaussian process with signal statistics µ, σ2 and ρ. The statistics of the input signal at
node#1 are given by

Computer Science & Information Technology (CS & 91
Where
Since the input sequence is assumed to be stationary
Since ρ < 1, for higher order filter the correlation coefficient at node#1 approximates the
correlation of the input signal.
The statistics of the sequence of the coefficients at node#2 is
The statistics of the signal sequence at the output of the multiplier at node#3 is

92 Computer Science & Information Technology (CS & IT)
The sequence at the output nodes #2k - #(3k-1) of the filter are given by
Where and are given by (6). To verify real life signals like music and speech signals
the proposed models can be used.
8. CONCLUSION
In this paper the method of estimating the Signal Transition Activity in FIR Filters implemented
by parallel Multiplier Accumulator based on Modified Booth Algorithm has been proposed. The
DBT model is used to analyze the signal transition activity by means of the signal statistics. The
mathematical formulation of the multiplexing mechanism is developed for the signal statistics.
The mapping of FIR filter structure on a MAC based on modified booth algorithm increases the
data throughput rate. The proposed multiplexing mechanism is used for the signal transition
activity at the nodes.
Computer Science & Information Technology (CS & 93
REFERENCES
[1] G. Lakshmi Narayanan and B. Venkataramani, “Optimization Techniques for FPGA-Based Wave
Pipelined DSP Blocks”, IEEE Trans. Very Large Scale Integr. (VLSI) Syst., 13. No 7. pp 783-792,
July 2005.
[2] H. Lee, “A Power-Aware Scalable Pipelined Booth Multiplier”, In Proc. IEEE Int. SOC Conf., 2004,
pp. 123-126.
[3] P.E.Landman and J.M.Rabaey, “Architectural power analysis: The dual –bit-type Method”, IEEE
Trans. VLSI Syst., vol.3. pp 173-187, July 1995.
[4] D. Marculescu,R.Marculescu,and M.Pedram, “Information theoretic measures for power analysis”,
IEEE Trans. Computer-Aided Design.,vol. 15. pp 599-610, June 1996.
[5] S. Ramprasad, N.R.Shanbhag, and I.N. Hajj, “analytical estimation of signal transition from word-
level staistics”, IEEE Trans., Computer Aided Design,vol. 16, pp 718-733, July 1997.
[6] G. Lakshmi Narayanan and B. Venkataramani, “Optimization Techniques for FPGA-Based Wave
Pipelined DSP Blocks”, IEEE Trans. Very Large Scale Integr. (VLSI) Syst., 13. No 7. pp 783-792,
July 2005.
[7] Young-Ho Seo and Dong-Wook Kim, “a New VLSI Architecture of parallel Multiplier-Accumulator
Based on Radix-2 Modified Booth Algorithm”, IEEE Trans. Very Large Scale Integr. (VLSI) Syst.,
vol.18. No 2. pp 201-208, February 2010.
[8] A.Papoulis, “Probablity, Random variables, and Stochastic Processes”, 3rd ed. New York:McGraw-
Hill,1991.

94 Computer Science & Information Technology (CS & IT)
INTENTIONAL BLANK
Sundarapandian et al. (Eds) : CCSEA, EMSA, DKMP, CLOUD, SEA - 2014
pp. 95–101, 2014. © CS & IT-CSCP 2014 DOI : 10.5121/csit.2014.4309
BIG DATA: PAVING THE ROAD TO
IMPROVED CUSTOMER SUPPORT
EFFICIENCY
Ajay Parashar
Solution Architect, HiTech Industry Solution Unit, Tata Consultancy Services
ABSTRACT
The organizational adage ‘customer is king’ is not new. With a significant number of
organizational resources devoted to understanding the ‘king’s’ needs and responding to them,
this phrase, in today’s competitive business arena, is an understatement. With the increasing
customer touch points and avenues for customers to provide formal/informal feedback, the
modern day customer support ecosystem is a complex environment. There is a need to fuse the
different components of support ecosystem to create a coherent system and Big Data platform is
just the right catalyst that a flat-world organization today needs to re-energize its customer
service effort and venture out to capture newer horizons. This white paper looks at the different
components that make up the current customer support service environment and the challenges
they pose to a uniform integration strategy. Finally it highlights how Big Data can be leveraged
to achieve this strategy.
KEYWORDS
Big Data, Text Analytics ,Speech Analytic, Customer Support.
1. INTRODUCTION
Steam engines triggered the beginning of the Industrial Age, and Henry Ford’s Assembly Line
kick-started a mechanical revolution that is still as dynamic as it was 100 years ago. In
comparison, the IT revolution that can be pegged to start coinciding with Y2K boom is still in its
infancy. Though we can communicate across the world in real-time, share photographs on our
social networks instantly and receive comments on them even faster, an organization needs to
cover several miles before it can develop a truly 360-degree understanding of the customer.
Merely having a presence on social networks does not warrant a 360 degree customer
understanding. These social networks need to be integrated with enterprise systems where the
data received will besynthesized, processed and converted to meaningful insights that can help
product design and development, or sales and marketing.
Organizations worldwide understand and acknowledge the fact that to be successful and remain
competitive, it is important to have a healthy customer support ecosystem in place. While the

96 Computer Science & Information Technology (CS & IT)
customer may develop a preference for a company on account of the superior product quality
initially, it is equally important to maintain an efficient customer support ecosystem to sustain the
customer relationship in the long run and create a positive brand image. This support ecosystem is
not merely limited to CRM systems, but should include every touch-point a customer can use to
interact with the organization. Although organizations may have multiple IT systems managing
customer information, it is rare to find them working in synergy. Even the capacity to indirectly
influence sentiments is part of the broader customer service support ecosystem. An effective
customer service ecosystem must clearly identify these disparate systems and get them to interact
with each other in real-time. For example, if a call center executive has access to a sales
representative’s information sheet on a successful sale while addressing a customer enquiry, they
may be able to tailor the response according to the problems reported to the Level 1/Level 2/Level
3 support desk for that particular model.
For HiTech industry characterized by a high rate of innovation, and hence, a high rate of
obsolescence, it is imperative to have a very robust and fine-tuned support ecosystem in order to
retain customers. A good example of this is the way the personal computer operating system
space has evolved. It is not that Windows had a free run always; several equally competent
operating systems came up from time to time like Linux. However, what kept customers linked
with Windows as OS of choice, had a lot to do with the support ecosystem Microsoft was able to
create behind it. They not only listened to the customer complaints and rectified them, but also
from time to time kept evolving the OS to best address the increasing demand from perspective of
a personal computer operating system, something that others could not do as effectively.
The situation that Microsoft faced and reacted to was not an isolated case, but a typical scenario
that exists for all the participants of HiTech Industry segment. If we look across length and
breadth of HiTech segment (be it a semiconductor manufacturers like Intel, Micron or Amat, or
personal printer manufacturers like HP, Lexmark or Xerox) it is equally important for all to have
a very robust support ecosystem to not only launch a successful product, but do it over and over
without losing sight of customer expectation and reaction. Integrating the different components of
the customer ecosystem such as marketing, sales, Level 1/Level 2 support desks, product research
and development divisions is challenging due to their distinct purposes and the variety of data
they generate. Big Data has the ability to handle and process variety of data, be it structured data
from enterprise applications, unstructured text data from social media or semi-structured data
from devices, under one platform. By enabling easy data integration, Big Data is slowly emerging
as a key technology ingredient to overhaul customer support services.
2. ALL ROADS LEAD TO CUSTOMER SUPPORT INTEGRATION
For any organization, the product or services they offer go through a cycle of ideation, design,
prototype, development, support, upgrade, and finally obsolescence. Similarly, from an
organization’s perspective, customer relationships go through a lifecycle involving identification,
prospect development, prospect conversion, marketing approach, servicing, support, up-selling,
cross-selling, retention and so on covered as part of Customer Life Cycle Management (CLM)
process.
While this white paper references CLM to draw a high-level architecture of the customer service
ecosystem, the focus here is largely on data and how data coming from different layers of CLM

Computer Science & Information Technology (CS & IT) 97
can be integrated to improve the efficiency of the entire customer support process. Figure 1
presents the different stages of CLM that are of interest from the customer support perspective.
Figure 1: Customer Support stages
For a HiTech organization looking at selling enterprise software, the pre-sales stage will focus on
identifying target organizations that may be interested in the enterprise solution to tailor
marketing campaigns and promotional activities.
These different stages act in a way to support customers either by enabling them to make a
decision or providing support post the decision process. There are several technology platforms
that support the various customer support processes: tools to generate Web mail campaigns,
enterprise level CRM suite, Interactive Voice Response (IVR) systems, tools to track customer-
reported issues, or systems to capture daily salesperson logs. Organizations, therefore, use a
complicated set of systems - technologies and platforms, to provide seamless service to
customers. However, integration between these systems is usually missing.
In the modern day ecosystem, social media has emerged as an important influence in the
customers’ decision making process. Before making a purchase, customers go through numerous
reviews available on social channels, connect with friends and peers to seek opinions and carry
out a comparative analysis between different products/services on offer. Therefore, an
organization’s success at converting a customer depends not only on the quality of the
product/service it offers or the marketing campaign launched, but also on how the organization
and its products are perceived by the wider community. This is where it is important for the
organization to integrate its customer support ecosystem to develop a better understanding of
customers and also provide them with unique post-sales support experiences.
The key to achievethis seamless integration lies in capturing, integrating, and analyzing the data
generated at different customer touch-points, and making it available to the last line of customer
support service. For example, in the current customer support landscape, it is almost impossible
for a support engineer to establish a link between a customer support request, the advertisement
campaign that triggered the buying process, and any product features highlighted by a sales
representative that helped close the deal.
Pre-Sales In-SalePost-
Sales
• Marketing
campaign
• Advertisement
campaign
• Brand Promotion
• Web-Mail
campaign
• Product
promotion
• Sales Promotion
• Loyalty bonus
• Surveys
• Post Sales
surveys
• Service desk
• Support Centers
• CRM
• Promotional
offers
98 Computer Science & Information Technology (CS & IT)
3. ROADBLOCKS TO DATA INTEGRATION
Integration of systems that constitute the customer support ecosystem is encumbered by a
multitude of factors that weigh against any effort made towards this integration. The primary
impediments towards this integration are:
• Variety of data
• Variety of applications
• Information silos
Data: The biggest challenge that prevents organizations from integrating the different layers of
customer engagement is the variety of data. Each layer of customer engagement has its own
characteristics and generates data that is specific to that layer. For example, a front desk deals
mainly with voice data while the Level 2/Level 3 support deals mostly with textual data with
some attributes attached to it. Although data generated from pre-sales activities is structured, it
does require further processing to be of use to the sales and post-sales layer.
Applications: The second challenge is the technology used to capture data across different layers.
Typically, different applications are used for different layers of customer engagement and these
applications work in isolation. In an organization, the marketing team makes use of digital
marketing campaigns such asemail, social media channels or postal mails; the sales team uses
enterprise planning systems for posting and tacking their orders; the customer support desk uses
its own set of applications to interact with customers, monitor their service requests and raise
tickets for issues that require more deeper analysis by the development team. Each of
thesesystems supports a key organizational function or process. However, unified view of data
residing in these isolated systems is lacking. Getting all these application systems to share data to
create a truly integrated view is a difficult proposition from the conventional data management
layer perspective.
Information silos: Today, organizations operate in multiple geographies and use different
systems and tools depending on regional requirements. It is rare to find a single implementation
of a CRM system across North America, Europe, Asia, and Africa. Regional factors, not
restricted to language alone, play a crucial part in defining and creating an IT system that supports
operations in a specific geography. One can debate endlessly on the futility of cross-geography
information integration, but experience shows that cross-leveraging factors that support growth in
one region may work equally well in other areas too.
Organizations realize the need to bring these information silos under one head and enable healthy
collaboration, knowledge management, and uniform customer experience.
4. DEFINING THE ROADMAP TO INTEGRATION
In order to align itself with the changing market dynamics brought in by the increasing
penetration of social channels in decision making process, it is important for organizations to
create an environment that integrates the different customer touch points into a continuous flow of
information that captures and transmits insights about a customer uniformly across the entire
customer support ecosystem.
Computer Science & Information Technology (CS & IT) 99
Driving efficiency improvement through integration withthe application or the system level may
not be cost-effective today, considering the varied mix of technologies used under customer
support, as well as the geographic spread. Further, integrating applications that are custom built or
from different vendors might not be a viable option. A data-centric approach then proves to be an
effective mechanism for integration. The challenges posed by the variety of data components are
effectively mitigated through proper utilization of newer technology elements that constitute the
Big Data ecosystem. The right mix and proper orchestration of these newer technology elements
provide a far more cost-effective mechanism to integrate the different layers of customer support
services under a unified fabric.
A few technology paradigms that come under the spotlight include:
a) Textual data processing: Organizations, over a period of time, have collected huge
amounts of pure text data such as entries in the ‘Remarks’ column of a feedback form, or
the comments left by support executives in CRM systems. Earlier, due to technology
constraints, it was difficult to process this data and convert it into actionable insights.
However, today there are tools that work on the principles of Natural Language
Processing (NLP) and efficiently churn out insights from this data. Presently, NLP is
emerging as a front runner among the Big Data ecosystem technologies. Textual data can
now be mined to understand the customer sentiment associated with a particular product
family, the key features discussed by customers, and the changes over a period of time.
Organizations can further integrate this information with data of their marketing
campaigns carried out from time to time to understand how the campaign affected
customer sentiment as well as the features highlighted through the campaign; an effective
way to capture the return on investment (ROI) on the marketing campaign. There are
several such instances where the capability to mine information from textual data has
transformed relatively obscure data into an information goldmine.
b) Voice processing: The voice-based service/call center is a mainstay in the customer
support strategy of any organization. It not only acts as the first point of contact between
a customer and the organization, but also goes a long way in shaping an organization’s
brand perception. While organizations have invested heavily in setting up customer
support desks or call centers, very little has been done to process the data captured from
calls. Most organizations only rely on the efficiency of the support person to decipher the
data and convert it into information.
Converting voice data into text whichcan be stored and analyzed further is a challenge
that the technology world is experiencing today. There are several factors contributing to
the challenges faced while deriving the right information from voice data. The tone of the
caller, the accent, and the language used are among the most common ones. Voice
processing or speech recognition is an area that is evolving rapidly. IBM’s Watson
participation and winning of the Jeopardy Quiz represents a step in the right direction to
achieve complete speech capture, conversion, and usage. There are many more solutions
like those from Dragon Naturally Speaking, TalkTyper, VoxSigma and others that are
targeting the area of speech to text conversion and analysis.
c) Web Analytics: While aspects like voice to text conversion, text analytics and others
have been the subject of research and used for some time now, Web analytics has gained
traction only over the past few years. Albeit it is relatively new, the science of analyzing

100 Computer Science & Information Technology (CS & IT)
users’ Web behavior has evolved tremendously. From using keywords on Web pages to
render a more meaningful Web search which resultsincapturing every user activity on a
Website, Web analytics has come a long way and found favor across organizations.
d) Structured enterprise data and unstructured data integration: Processing
unstructured data (text or voice) on its own is not very significant unless the processed
outcome is given as inputto the structured enterprise data to derive meaningful inferences.
For example, an insightful picture of the sales performance will emerge only when the
processed social media data is linked backed to the sales figures, and further enriched
with information emerging from call center data.
Trying to integrate varied data sources on conventional relational database management platforms
may not work due to their inherent inability to process data that does not fit into a structured,
relational schema. Processing of text, voice, or data originating from devices (such as log files)
requires an approach that is completely different from the number crunching approach that the
relational databases are suited for. Platforms leveraging Big Data are emerging as platforms of
choice for these kinds of operations. The recent global Big Data trend study survey conducted by
TCS identifies customer support services as among the top three areas where companies
worldwide are focusing their Big Data investments.
5. CONCLUSION
A well-tuned and integrated customer support and service infrastructure brings in additional
benefits that add value to the organization. For instance, it brings greater transparency, better
insights, and delivery of tailored services, leading to a prolonged and profitable engagement for
both sides.
A comprehensive, integrated approach to customer support service can leverage Big Data to not
only drive more efficient customer support, but also other areas within an organization such as
product design. It is time to make the big move to Big Data!
REFERENCES
[1] Customer Life cycle management – What is it, How important it is
http://www.salesboom.com/whitepapers/what_is_clm_whitepaper_summary.html
[2] Basics of Management – Customer Life Cycle Management
http://basicsofmanagement.com/customer_life_cycle.php
[3] Transforming the lifetime of relationships between people and companies
https://www-03.ibm.com/innovation/us/watson/
[4] Text Mining - http://en.wikipedia.org/wiki/Text_analytics

Computer Science & Information Technology (CS & IT) 101
AUTHOR
With a Master’s degree in Business Administration and a Bachelor’s degree in Industrial
and Production Engineering, Ajay Parashar is a Solution Architect, and the Big Data lead
for the TCS HiTech Industry Solution Unit.
Ajay has over 14 years of experience in database administration, project and program
management, and delivery management. He has been extensively involved in business
development projects around Big Data.

102 Computer Science & Information Technology (CS & IT)
INTENTIONAL BLANK
Sundarapandian et al. (Eds) : CCSEA, EMSA, DKMP, CLOUD, SEA - 2014
pp. 103–110, 2014. © CS & IT-CSCP 2014 DOI : 10.5121/csit.2014.4310
CLOUD-BASED MULTI-TENANCY MODEL
FOR SELF-SERVICE PORTAL
Jitendra Maan1 and Niranjan Mantha
2
Tata Consultancy Services Limited, India [email protected]
ABSTRACT
A multi-tenant portal implementation extends the capabilities of an enterprise by enabling sev-
eral customers to run independently on the same portal infrastructure hosted by a service pro-
vider. However, building multi-tenant solutions requires addressing several technical chal-
lenges, but service providers/solution developers can build and deploy scalable, customizable,
manageable, and cost-effective multi-tenant solutions. Addressing multi-tenancy is a key con-
sideration in implementing Cloud enabled enterprise portal solutions which are becoming an
international phenomenon, driven by both local demand as well as global reach by medium or
large enterprises that are in need of reducing cost of infrastructure/ hosting.
The paper enlighten the focus on the core of multi-tenant portal infrastructure along with key
design elements that need to be considered in providing Cloud- enabled multi-tenant portal so-
lutions. The paper would not focus on any specific vendor or their product suites but it acts as a
synopsis for developer and architect community to strategize their thinking towards right portal
architecture by gaining insights on multi-tenant portal features, key benefits and portal land-
scape.
KEYWORDS
Multi-tenancy, Portal Infrastructure, Cloud-based Model, Enterprise Portal, Self-service Portal
1. INTRODUCTION
Cost savings and increase in revenue are always the key business challenge to face in today’s
competitive market place. However, increase in revenue is directly impacted by various factors
like –continuously adding new customers, retain customer by offering new innovative services.
Each enterprise, Medium or large, needed an enterprise-proven on-Demand business portal solu-
tion fulfilling the demand of their employees, customers and partners.
The very basic goal of multi-tenant portal infrastructure is to improve productivity, enhance
communication, collaboration and performance by shortening the decision cycles at different le-
vels and also to bring people, resources and processes together to create an exponential economic
value to the customer. Today, Software service providers are continuously challenged in archi-
tecting standards based portal solutions that can manage lots of customers on a single code base
but in a more coordinated way than the standard multi-site installation.
The most critical features when evaluating or considering multi-tenant enterprise portals include a
cost-effective deployment, a secure solution, an enterprise proven system (scalability) and the
ability to integrate with all major technology platforms. However, multi-tenancy is ultimately

104 Computer Science & Information Technology (CS & IT)
about cost efficiency because its goal is to reduce the number of instances, and to align ever
one’s schemas, it becomes cheaper a
tenancy are just different trade-off points on the cost curve.
Customer specific branding and corporate identify are clearly the winning
portal infrastructure. Multi-tenant portal even
(both Global and Tenant) to divide a portal into logical partitions, each wit
points and dedicated content and navigation for exclusive use of each customer. A shared portal
infrastructure (multi-tenant portal) unifies portal administration in a single interface and simpl
fies management of customer intranets, websites and self
2. OVERVIEW OF MULTI
Multi-tenant Portal is a single physical portal divided into several
portal environment allows parallel entry points into the portal, and each entry point is referenced
by a unique URL that is assigned to the end User.
In a multi-tenant portal environment,
portal tenant comprises a set of secure portal objects and set of services that are highly cust
mized for the respective customer, business users, administrators a
dition, the content presented to business users through a tenant is customized and branded by d
signers to suit the corporate identity of the customer. Within a single portal infrastructure, ente
prise can provide content which is unique to different user groups and apply access controls and
permissions to customized content on a per user, group, or role basis. There are basically two
types of administrator roles in a multi
• Tenant administrator and
• Global administrator
Tenant administrator is a specialized tenant user who manages tenant specific users or content in
the design time environment of a multitenant portal. Global administrator is one who has access
to cross tenant users or content an
core of the multi-tenant portal infrastructure is show
Fig.
Computer Science & Information Technology (CS & IT)
about cost efficiency because its goal is to reduce the number of instances, and to align ever
one’s schemas, it becomes cheaper and easier to manage. Basically, different levels of multi
off points on the cost curve.
Customer specific branding and corporate identify are clearly the winning streak for
tenant portal even bring more flexibility by allowing administrators
(both Global and Tenant) to divide a portal into logical partitions, each with its own parallel
content and navigation for exclusive use of each customer. A shared portal
tenant portal) unifies portal administration in a single interface and simpl
fies management of customer intranets, websites and self-service customer portals.
ULTI-TENANT SELF SERVICE PORTAL
physical portal divided into several logical Portals. A multitenant
portal environment allows parallel entry points into the portal, and each entry point is referenced
by a unique URL that is assigned to the end User.
tenant portal environment, each customer instance is known as Portal
portal tenant comprises a set of secure portal objects and set of services that are highly cust
mized for the respective customer, business users, administrators and the service provider. In a
dition, the content presented to business users through a tenant is customized and branded by d
signers to suit the corporate identity of the customer. Within a single portal infrastructure, ente
h is unique to different user groups and apply access controls and
permissions to customized content on a per user, group, or role basis. There are basically two
types of administrator roles in a multi-tenant portal infrastructure –
Tenant administrator is a specialized tenant user who manages tenant specific users or content in
the design time environment of a multitenant portal. Global administrator is one who has access
to cross tenant users or content and this role is normally defined by super user of the portal. The
tenant portal infrastructure is shown in the diagram below:-
Fig.1. Multi-tenant Portal Infrastructure
about cost efficiency because its goal is to reduce the number of instances, and to align every-
levels of multi-
streak for multitenant
bring more flexibility by allowing administrators
h its own parallel entry
content and navigation for exclusive use of each customer. A shared portal
tenant portal) unifies portal administration in a single interface and simpli-
. A multitenant
portal environment allows parallel entry points into the portal, and each entry point is referenced
Tenant. Each
portal tenant comprises a set of secure portal objects and set of services that are highly custo-
nd the service provider. In ad-
dition, the content presented to business users through a tenant is customized and branded by de-
signers to suit the corporate identity of the customer. Within a single portal infrastructure, enter-
h is unique to different user groups and apply access controls and
permissions to customized content on a per user, group, or role basis. There are basically two
Tenant administrator is a specialized tenant user who manages tenant specific users or content in
the design time environment of a multitenant portal. Global administrator is one who has access
d this role is normally defined by super user of the portal. The

Computer Science & Information Technology (CS & IT) 105
3. KEY DESIGN CONSIDERATIONS IN MULTI-TENANT PORTAL
Multi-tenancy efficient architecture is an important requirement for Web-delivered solutions as
well as enterprise proven on-Demand business portals accessed by customers, employees and
trade partners.
In case of multi-tenancy, single instance of the portal serves multiple tenants (i.e. Client organiza-
tions) but in case of multi-instance architecture, separate portal instances e.g. Virtual portals are
setup for different client organizations. With a multi-tenant architecture, a portal application is
designed to virtually partition its data and configuration so that each client organization works
with a customized virtual portal instance. The multi-tenancy support is the key decision in design-
ing enterprise portal solutions.
The below points describe the key design elements that need to be considered for Cloud enabled
multi-tenant Portal.
• Addressing variations in tenant requirements -
User Interface/Look and feel
Workflows
Service orchestration and implementation
Entities and Database extensions
Authentication and Authorization
• Customization i.e. One time setup requirement for different customers
• Degree of Configurability
• Collect, Collate & Configure meta-data at each level
• Data security and Isolation
• Fine grained role based access
• Unique user experience through personalized look and feel
• Tenant provisioning through provisioning Virtual portal instance
• Keeping Customer/vendor data separated and secured
• SOA based architecture & Web services based messaging/event model for middle-tier
• Data center economics
A typical portal implementation offers a lot of features (out of box or available on customization)
which can be leveraged by service providers to provide a customized look and feel in offering
branding services to their customers. Another advantage of taking portal solution path is the rich
out-of-box feature support based on open standards and portlets, the power engine for Portal
framework are modeled against portlet specification standards like JSR 168 or JSR 286. Each
portlet can be made configurable for each service vendor or customer based on their needs.
3.1 Virtual Portal Implementation – Clone and Configure Approach
Most of the open source/traditional portal vendors provide a clone-and-configure approach to the
implementation & deployment of the portal for multi-tenant applications i.e. the ability to clone a
base portal and configure it as per end-user/vendor/partner needs. Several Open Source portal
vendors support the concept of a virtual portal which is basically a logical copy of an existing
base portal utilizing the same hardware and software resources.
3.1.1 Degree of Configurability and Customization
To enable a high level of reuse, the degree of configurability in the portlet design is achieved by
supporting customer and/or vendor-specific settings through name and-value pair configurations

106 Computer Science & Information Technology (CS & IT)
such as Customer IDs or customer's service endpoints, to offer each customer specific look-and-
feel thereby offering a highly scalable, configurable and multi-tenant efficient solutions.
Following are the recommendations for portal environment based multi-tenant applications:
• Each portlet must be configurable for each customer, since a service provider shares portlets
across individual vendors.
• To enable a high level of reuse, the degree of configurability in portlets must support subscrib-
er or vendor specific settings, such as vendor's service endpoints, to provide vendor or sub-
scriber-specific look-and-feel, with specific settings to indicate which form fields or action but-
tons should be rendered to end-users/administrators based on role based access.
In addition to configuration at the customer level, the individual vendors/channel partners must be
able to perform the configuration without the support from the customer or service providers.
3.1.2 Security Isolation
Each virtual portal supports isolation of user populations for each tenant through a multi-tenant
LDAP tree structure in a single instance of a directory Server. Through dynamic profiles, an ap-
plication developer can define variables in a common ‘profile set’ that can be configured by each
tenant’s administrator at runtime thereby, enabling the unique branding for different tenants.
Tenant specific customizations are created by applying those configured profiles to their portlets
at runtime to change the appearance, content and behavior of the portlet.A sample scenario as
outlined below:
• Create a multi-tenant user directory structure in LDAP by:
Create a realm for each vendor or customer i.e. a separate tree hierarchy starting at dn
[dc=vendor1, dc=com]
And, for each security realm, a security context entry must be created, configured and
mapped to user population of each service provider or end customer organization.
• Collaboration and Knowledge Management
• Extended Collaboration
• Social Business Extensions
3.1.3 Unique User Experience
Rich and unique user experience, at very high level, consists of:
• Look and feel for users or groups (belonging to either customer or end user organization) and
• Structure and scope of user role
Most portal vendors provide out-of-box features which can be utilized and customized in a unique
manner to create a distinct look and feel that will go consistent with the customer branding needs.
Also it provides flexibility to the vendors to customize the look and feel based on their specific
business requirements to serve their end-customer effectively and efficiently.
4. MULTI-TENANT PORTAL IMPLEMENTATION
A multi-tenant portal extends the capabilities of self-service portal by enabling a single service
provider to offer granular services based on SAP technology and applications to multiple custom-
ers from a single portal infrastructure.
The service provider partitions a single portal installation into several logical units. Each partition
is a portal with its own dedicated content and navigation for the exclusive use of a customer. The

Computer Science & Information Technology (CS & IT) 107
term tenant is used to describe each logical partition. The service provider sets up parallel entry
points into the portal—one entry point per tenant. Each entry point is referenced by a unique URL
gateway, also referred to as a portal alias. The users of a tenant can access only the information of
their tenant.
The following figure shows a layered multi-tenant portal architecture with three tenants:
Fig.1. Layered Multi-tenant Portal Architecture
The overall strategy for enterprise portal implementation should consider the following funda-
mental requirements for multi-tenant efficient applications:
• Describes the multi-tenant portal environment
• Explains how to configure a single portal landscape to support multiple tenants
• Outlines how to secure the multi-tenant portal environment to make sure that content belonging
to one enterprise is not delivered to members of other enterprises.
• Discusses administration tasks, such as initial preparation, configuration, and daily mainten-
ance
• Details how to manage the customized portal content of individual enterprises within a single
portal landscape
• Details how to manage the users in a multi-tenant portal environment
• Details how to customize the look and feel of each portal tenant to incorporate the customers'
corporate identity
5. KEY FEATURES SUPPORTED IN MULTI-TENANT PORTAL
The following features support the multi-tenant portal environment:
• Customer-specific branding and corporate identity
• Per user/group/role permission infrastructure for controlling access to portal content
• Delegated administration for setting up different customized content
• Mass customization and configuration operations
• User management filtering mechanism for controlling access to users, groups, and roles per
tenant
• Multi-language user interface support
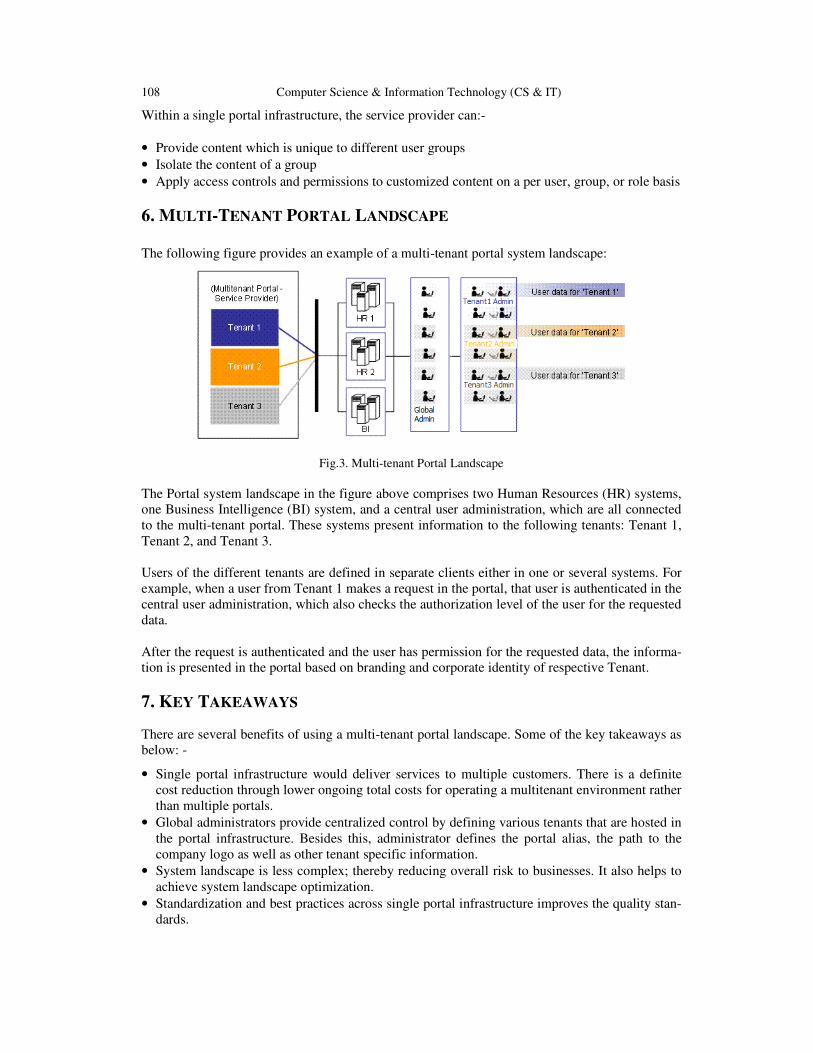
108 Computer Science & Information Technology (CS & IT)
Within a single portal infrastructure, the service provider can:-
• Provide content which is unique to different user groups
• Isolate the content of a group
• Apply access controls and permissions to customized content on a per user, group, or role basis
6. MULTI-TENANT PORTAL LANDSCAPE
The following figure provides an example of a multi-tenant portal system landscape:
Fig.3. Multi-tenant Portal Landscape
The Portal system landscape in the figure above comprises two Human Resources (HR) systems,
one Business Intelligence (BI) system, and a central user administration, which are all connected
to the multi-tenant portal. These systems present information to the following tenants: Tenant 1,
Tenant 2, and Tenant 3.
Users of the different tenants are defined in separate clients either in one or several systems. For
example, when a user from Tenant 1 makes a request in the portal, that user is authenticated in the
central user administration, which also checks the authorization level of the user for the requested
data.
After the request is authenticated and the user has permission for the requested data, the informa-
tion is presented in the portal based on branding and corporate identity of respective Tenant.
7. KEY TAKEAWAYS
There are several benefits of using a multi-tenant portal landscape. Some of the key takeaways as
below: -
• Single portal infrastructure would deliver services to multiple customers. There is a definite
cost reduction through lower ongoing total costs for operating a multitenant environment rather
than multiple portals.
• Global administrators provide centralized control by defining various tenants that are hosted in
the portal infrastructure. Besides this, administrator defines the portal alias, the path to the
company logo as well as other tenant specific information.
• System landscape is less complex; thereby reducing overall risk to businesses. It also helps to
achieve system landscape optimization.
• Standardization and best practices across single portal infrastructure improves the quality stan-
dards.

Computer Science & Information Technology (CS & IT) 109
• The cost for the service and the cost per user is drastically reduced by standardization and
reuse of services by different portal tenants.
• Each tenant specific configuration becomes easy through metadata associated with each tenant.
It does not require making changes in codebase each time a new portal tenant is instantiated.
However, besides above benefits, multi-tenant portal solutions can also be used to structure the
portal for different business units, as well as subsidiaries within the same organization. Several
service providers leverages its rich experience in providing Portal solution offerings across its
global customer base to help companies achieve their objective of a state-of-the-art self-service
multi-tenant portal.
8. CONCLUSION
The multi-tenancy is the most significant paradigm shifts in portal application design extensively
dependent on metadata at each level to configure the way the application appear/behave for the
users. However, the multitenant enterprise portal is a vital component to businesses in reducing
the cost and also empowers customer to identify the solutions to their problems quickly.
From my experience, I strongly recommend multi-tenant architecture when creating enterprise
portal solutions as it allows vendors to provide self-service capabilities to customers and pros-
pects for key marketing, sales and support activities and branding services for their part-
ners/channels.
In summary, the multi-tenant architecture is an important design decision when working with
potential business solutions that have similar core functionality but fundamentally differ in vari-
ous aspects such as UI, Layout and workflows. The basic concepts explained here are the founda-
tions for the Multi-Tenant Architecture. Depending on your organization needs, there may be
extra steps to utilize the design in an effective manner.
REFERENCES
[1] Stefan Fenz, “Increasing knowledge capturing efficiency by enterprise portals" VINE,Vol. 42 Iss: 2,
pp.237 - 250
[2] Paul Hawking, Andrew Stein, “B2E Portal Maturity: An Employee Self-Service Case Study.”School
of Information Systems, Faculty of Business, Victoria University, (2004)
[3] Link, D. (2001), "How HR Can Shape Corporate Portals", HRMagazine, 46(9), 131-137.
[4] Xuxu, Z., Qingzhong, L., &Lanju, K. (2010). A data storage architecture supporting multi-level cus-
to-mization for saas. In Web information systems and applications conference (wisa), 2010, 7th (pp.
106109).
[5] Shilakes, C. &Tylman, J. (1998), "Enterprise Information Portals", Merril Lynch report, Located at
http://emarkets.grm.hia.no/gem/topic7/eip_ind.pdf Accessed March 2003.
[6] Wiscombe, J. (2001), "Using Technology To Cut Costs", Workforce, September 2001, Located at
http://www.workforce.com/archive/feature/22/29/82/index.php Accessed August 2002.
[7] Killen and Associates (2000), "Communicating with Employees Via Digital Delivery Systems", Re-
port 2000.
[8] Yu, D., Wang, J., Hu, B., Liu, J., Zhang, X., He, K., & Zhang, L. (2011). A practical architecture of
cloudification of legacy applications. In Services (services), 2011 ieee world congress on (pp. 1724).
[9] Hamerman, P. (2002), "Extending Employee Relationships with Web Applications," Presentation to
SAPPHIRE Lisbon Conference, July 2002.
[10] Brosche, C. (2002), "Designing the Corporate Portal", Masters Thesis, Department of Computer
Science, University of Gothenburg, Sweden, May.
[11] Barron M. Cited at Internet Retailer, (2002), "Retail web-based self-serve isn't just for customers,it's
for employees", Located at http://www.internetretailer. com/dailynews.asp?id=6688 Accessed Sep-
tember 2002.

110 Computer Science & Information Technology (CS & IT)
[12] Zhang, Y., Wang, Z.,Gao,B.,Guo, C., Sun, W., & Li, X. (2010). An elective heuristic for on-line te-
nant placement problem in SAAS. In Web services (icws),2010ieeeconference on (pp. 425- 432).
AUTHORS
Jitendra Maan, a versatile IT Professional with a total of more than 17 years of expe-
rience spread across various domains in IT Industry and he is currently working with
Tata Consultancy Services Limited in a leading role to drive Social Computing and
Java and Open Source Solutions and Offerings to address customer needs in HiTech
ISU. Jitendra practices technology consulting, enterprise architecture and evangelizes
social computing initiatives within TCS and has successfully delivered technology
solutions for globally distributed clientele. Jitendra is certified in Project Management
(CIPM) by Project Management Associates (PMA)India and has successfully achieved
the standards of TOGAF 8 Certification program. Jitendra has a proven track record of sharing technology
thought leadership in various international conferences and also presented his research work in various
international events/forums. Jitendra is also a member to professional bodies like PMA (Project Manage-
ment Associates), IEEE (Institute of Electrical and Electronics Engineers, Computer Society of India (CSI)
Delhi Chapter, Open Group AEA Delhi Chapter.
NiranjanMantha, having 15 years of IT experience across different geographies. He is currently managing
the Java and Open Source opportunities and initiatives in HiTech ISU. Niranjan is a TOGAF 9 Certified
Practitioner an Certified SCRUM Master, having vast knowledgeable in the area of Amazon Cloud Servic-
es.

Sundarapandian et al. (Eds) : CCSEA, EMSA, DKMP, CLOUD, SEA - 2014
pp. 111–119, 2014. © CS & IT-CSCP 2014 DOI : 10.5121/csit.2014.4311
DESIGN ARCHITECTURE-BASED ON WEB
SERVER AND APPLICATION CLUSTER IN
CLOUD ENVIRONMENT
Gita Shah
1, Annappa
2 and K. C. Shet
3
1,2,3 Department of Computer Science & Engineering,
National Institute of Technology, Karnataka, Surathkal, India [email protected], [email protected], [email protected]
ABSTRACT
Cloud has been a computational and storage solution for many data centric organizations. The
problem today those organizations are facing from the cloud is in data searching in an efficient
manner. A framework is required to distribute the work of searching and fetching from
thousands of computers. The data in HDFS is scattered and needs lots of time to retrieve. The
major idea is to design a web server in the map phase using the jetty web server which will give
a fast and efficient way of searching data in MapReduce paradigm. For real time processing on
Hadoop, a searchable mechanism is implemented in HDFS by creating a multilevel index in
web server with multi-level index keys. The web server uses to handle traffic throughput. By web
clustering technology we can improve the application performance. To keep the work down, the
load balancer should automatically be able to distribute load to the newly added nodes in the
server.
KEYWORDS
Compute Cloud, Hadoop, MapReduce, load balancing, Web server.
1. INTRODUCTION
Cloud is emerging as a cost effective solution in the computing world. The data capacity of the
cloud has gone up to a zettabyte from gigabyte. Cloud Computing are the virtual pool of
computing resources that provides an online pool of resources for computing, where the
computing is performed by efficient sharing of resources, which we call as load balancing/
resource sharing. Cloud relies on its resources for handling the application in the local and
personal devices.
MapReduce [2] is the heartbeat of Hadoop framework. It is a programming paradigm that allows
for huge scalability across hundreds or thousands of servers in a cluster. It is a programming
model that is associated with the implementation of processing and generating large data sets. The
term MapReduce basically refers to two separate and distinct tasks that Hadoop programs
perform [6]. MapReduce also plays an important factor in Cloud computing environment,
because it decreases the complexity of the distributed programming and is easy to be developing
on large clusters of common machine [12]. The data flow architecture of MapReduce shows the
techniques to analyze and produce the search index [12] as shown in figure1.

112 Computer Science & Information Technology (CS & IT)
The main purpose of this work is to develop a technique for a fast and efficient way of searching
data in the MapReduce paradigm of the Hadoop Distributed File System. Hadoop is a framework
which is specifically designed to process and handle vast amounts of data [10]. It is based on the
principle of moving computation to the place of data which is cheaper than moving large data
blocks to the place of computation.
The Hadoop [1] MapReduce framework is a master - slave architecture, which has a single master
server called a job tracker and several slave servers called task trackers, one per node in the
cluster. The job tracker is the point of interaction between users and the framework. The user
submits map and reduce jobs to the job tracker, which puts them in a queue of pending jobs and
executes them on a first-come-first-served basis.
Figure 1. MapReduce data flow
In this paper the schematic view of the design architecture is given, with effective scenario to
investigate the performance of Hadoop in high speed retrieval of data in the cloud environment by
replacing the map phase of the MapReduce paradigm with a web server. For real time processing
on Hadoop, a searchable mechanism is implemented in HDFS by creating multilevel index in web
server with multi-level index keys in NameNode.
The rest of the paper is structured as follows. Module 2 & 3 highlights the related works and
Hadoop Distributed File System implementation. Module 4 describes the web application in a
cloud and architecture design. Module 5 describes the implementation details followed by the
results & analysis. Finally work done is concluding, with future work in module 6.
2. RELATED WORK
Hadoop [10] is an open source Java-based programming framework which is a part of the Apache
project which was sponsored by the Apache Software Foundation. MapReduce is a part of
Hadoop framework. It is a programming concept and Hadoop is a framework to run MapReduce
program. In February 2003 first MapReduce library was introduced @Google. In 2004
MapReduce was simplified for data processing on large cluster [4]. Google introduced
MapReduce in 2004 to support large distributed computing, on large clusters of computers to
implement huge amounts of data set [3]. MapReduce is a framework that processed parallel
problems of huge data set using a large number of computers or nodes that is collectively referred
to as a cluster or a grid [7]. A distributed file system (DFS) facilitates rapid data transfer rates
among nodes and allows the system to continue operating uninterrupted in case of a node failure.
It was originally developed to support distribution for the Nutch search engine project. In January
2008 Hadoop made apache as a top level project center.
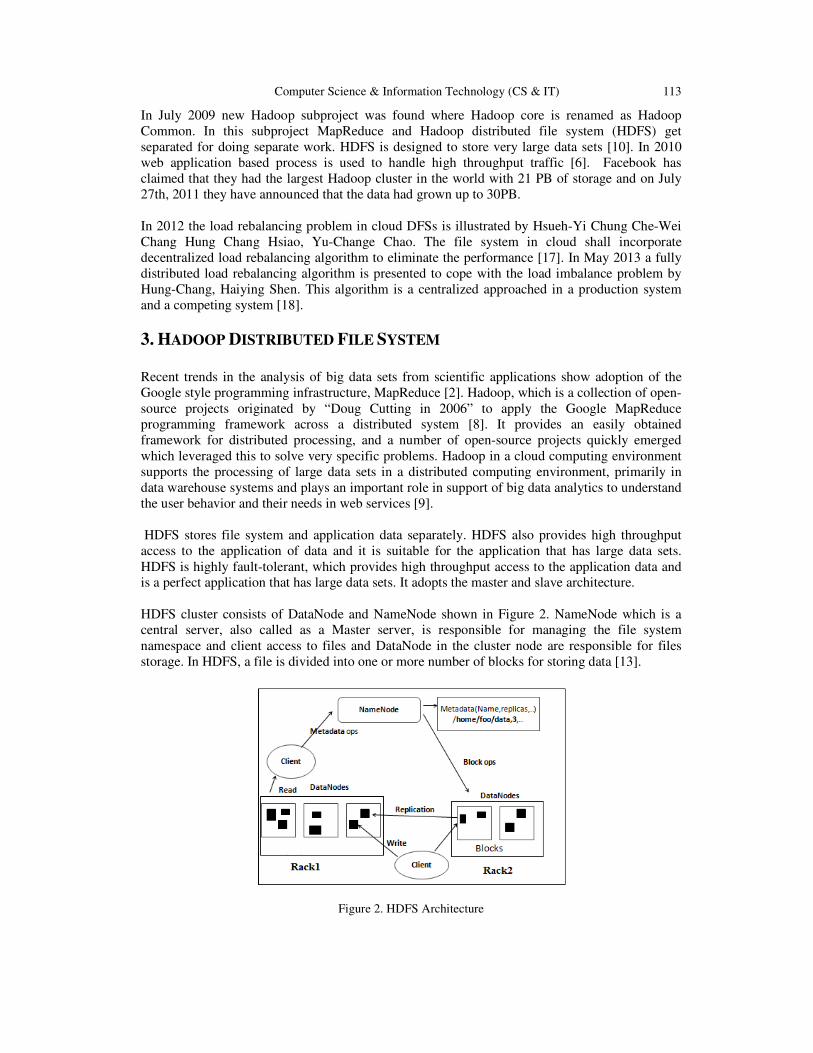
Computer Science & Information Technology (CS & IT) 113
In July 2009 new Hadoop subproject was found where Hadoop core is renamed as Hadoop
Common. In this subproject MapReduce and Hadoop distributed file system (HDFS) get
separated for doing separate work. HDFS is designed to store very large data sets [10]. In 2010
web application based process is used to handle high throughput traffic [6]. Facebook has
claimed that they had the largest Hadoop cluster in the world with 21 PB of storage and on July
27th, 2011 they have announced that the data had grown up to 30PB.
In 2012 the load rebalancing problem in cloud DFSs is illustrated by Hsueh-Yi Chung Che-Wei
Chang Hung Chang Hsiao, Yu-Change Chao. The file system in cloud shall incorporate
decentralized load rebalancing algorithm to eliminate the performance [17]. In May 2013 a fully
distributed load rebalancing algorithm is presented to cope with the load imbalance problem by
Hung-Chang, Haiying Shen. This algorithm is a centralized approached in a production system
and a competing system [18].
3. HADOOP DISTRIBUTED FILE SYSTEM
Recent trends in the analysis of big data sets from scientific applications show adoption of the
Google style programming infrastructure, MapReduce [2]. Hadoop, which is a collection of open-
source projects originated by “Doug Cutting in 2006” to apply the Google MapReduce
programming framework across a distributed system [8]. It provides an easily obtained
framework for distributed processing, and a number of open-source projects quickly emerged
which leveraged this to solve very specific problems. Hadoop in a cloud computing environment
supports the processing of large data sets in a distributed computing environment, primarily in
data warehouse systems and plays an important role in support of big data analytics to understand
the user behavior and their needs in web services [9].
HDFS stores file system and application data separately. HDFS also provides high throughput
access to the application of data and it is suitable for the application that has large data sets.
HDFS is highly fault-tolerant, which provides high throughput access to the application data and
is a perfect application that has large data sets. It adopts the master and slave architecture.
HDFS cluster consists of DataNode and NameNode shown in Figure 2. NameNode which is a
central server, also called as a Master server, is responsible for managing the file system
namespace and client access to files and DataNode in the cluster node are responsible for files
storage. In HDFS, a file is divided into one or more number of blocks for storing data [13].
Figure 2. HDFS Architecture
114 Computer Science & Information Technology (CS & IT)
4. WEB APPLICATION IN A CLOUD AND ARCHITECTURE DESIGN
In the following module, the schematic design of the architecture for a scaling structure and the
dynamic scaling for a web application in cloud is designed. The structure is based on using a
front-end load balancer to dynamically route user requests to backend, Master web servers that
host the web application. The number of web servers should automatically scale according to the
threshold on the number of current active sessions in each web server instance to maintain service
quality requirements.
High speed data retrieval from cloud storage has been an active area of research. The Apache
Hadoop project design, architecture which is based on the web server and application cluster in
cloud environment was started with this as one aim in mind. We review here the basic details of
the design architecture, apache load balancer and the details of the Master web server with the
multi-level indexing. In the following module, the schematic design of the architecture for a
scaling scenario and the dynamic scaling web application for the web in a Cloud is clustered.
4.1. Architecture Design
The data in Hadoop Distributed File System is scattered, searching and data retrieval is one of the
most challenging tasks, so to overcome these tasks a searchable mechanism in HDFS has been
implemented. A web server has been designed in the Map phase of MapReduce. The jetty web
server is considered as a web interface. Web applications are generated in the HDFS and a web
server is started in the form of Hadoop job by submitting our keys to URL Hadoop url/file/key.
The Apache load balancer is used in between the client and server to balance the work load of the
localhost because if one level is not sufficient, then the system will automatically expand to the
second level of indexing.
For real time processing on Hadoop, a searchable mechanism is implemented in HDFS by
creating a multilevel index in web server with multi-level index keys. To keep the work down, the
load balancer should automatically be able to distribute load to the newly added nodes in the
server. The load balancer is used to balance the workload across servers to improve its
availability, performance and scalability. To be able to exploit the elasticity of a cloud
infrastructure, the applications usually need to be able to scale horizontally, i.e. it must be
possible to add and remove nodes offering the same capabilities as the existing ones. In such
scenarios, a load balancer is usually used.
NameNode is divided into Master and Slave server. Master server contains multi - level index and
slave have data and key index. In the server at the time of the data request, the key is being passed
on multi level indexes. Indexing all the process is done by Master server and all retrieval process
are done by slave serve. The overall view of the design architecture has been shown in the figure
3.

Computer Science & Information Technology (CS & IT) 115
Figure 3. Schematic view of design architecture
4.2. Load Balancer
It is used to balance the workload across servers to improve its availability, performance and
scalability. Its purpose is to improve the performance of the distributed system through an
appropriate distribution of the application [17]. In a distributed system, it is possible for some
computers to be heavily loaded while others are lightly loaded. In this situation system can lead to
poor system. The goal of load balancing is to improve the performance by balancing the loads
among computers.
The Apache load balancer will give better performance of the workload. These can be configured
to know a certain number of workers and their host names, but no workers can be added
automatically during runtime [14]. It is implemented in between clients and servers to balance the
work load of the web server. These servers run on each NameNode and DataNode of which web
application package is deployed on the HDFS [13].
4.3. Load Balancing With The Master Web Server A common approach is used in combination of the Apache module mod proxy [15] and mod proxy
balancer [16]. After adding these modules to the Apache Web Server 2, a virtual host configuration
has to be created that configures the load balancer and its balance members. By using the directive
ProxySet, the load balancing method can be set to balance either by the number requests, by
counting the bytes of the traffic, or by pending requests. By using the Balancer Member directive,
a worker with the given URL can be introduced to the load balancer, including how much load it
should receive.
The Master server runs on each NameNode and DataNode (Figure 4), web server application
package is deployed on the HDFS. The web server in NameNode is divided into Master/slave
architecture, according to HDFS storage features, it will store all the keys in the indexing form.
All client requests are first sent to the NameNode through URL Hadoop url/file/key, and Master
server in NameNode will decide which the Master server either master/slave on DataNode to
respond to the request according to the location information of web files stored in the multi-level
indexing on NameNode, and then redirected URL to the node and request the same Uri, finally, a
connection can be established between the current Master web server and the browser, and
sending files and data between them. To be able to exploit the elasticity of a cloud infrastructure,
the applications usually need to be able to scale horizontally, i.e. it must be possible to add and

116 Computer Science & Information Technology (CS & IT)
remove nodes offering the same capabilities as the existing ones. In such scenarios, a load balancer
is usually used.
It is possible to add the new workers directly to the Master server configuration and starting the
load balancer, a large number of virtual folders can be defined in the virtual host configuration.
Then, whenever a worker registers at the load balancer, the htaccess rewriter writes a forward rule
to the. htaccess file located in htdocs/virtual a request sent to, the URL path route/1 is redirected to
the first URL specified in the htaccess file, a request sent to, the URL path route/2 to the second,
and so on. Since then htaccess file is evaluated for each request, changing it at runtime allows
additions as well as removal of workers. With these measures, it is possible to allow workers to
register at the load balancer automatically upon their startup and shutdown, thus bypass the need to
manually add or remove workers. Even the rules allow for the changes take effect during runtime.
Further modifications of the load factor are possible by collecting monitoring data [11].
A starting load factor can be determined by a performance test. Load balancer knows the potential
workload of all workers; it can calculate a load factor for each worker proportional to each
worker’s potential or monitored workload [5].
Figure 4. Master web servers based on cluster architecture
The features of load balancer are
• If a server dies connection will be directed to the nearest server.
• Once the server comes back online it rejoins the cluster.
• It can be controlled to take into account machine difference.
• It supports complex topologies and failover configuration
• It distributes the client request across the server, redirect to the localhost.
5. RESULT & ANALYSIS
In this module, for the implementation, we configured Hadoop with 6 DataNodes and one
NameNode, 6 Task trackers and one job tracker. With each of the nodes we install the jetty server
and connect it with Hadoop using eclipse. Jetty server is running on each of DataNode of Master
server. Each jetty server works on specific key. Master server contains a list of keys which
correspond to jetty server information. When a read request come from the clients via Master
server then it does look up to find the jetty server for corresponding keys and then forward it to the
corresponding server. For our experiments we use all systems with Core i7 2.93 GHz CPU, 8 GB
DDR3 RAM, 1 TB hard drive. All systems are connected over a 1 Gbps switch.

Computer Science & Information Technology (CS & IT) 117
Web applications are generated in the HDFS and a web server is started in the form of Hadoop job
by submitting our keys to the URL of Hadoop i.e. Hadoop url/file/key. The key and value are
submitted to the local host of a Hadoop URL in the file system of Master web server and read
operations can be performed in the same URL. The read operation performed in Hadoop is done
by Master web server through Uniform Resource Locator. To keep the work down, the load
balancer should automatically be able to distribute load to the newly added nodes in the server.
When one Master Server (jetty server) is running and read operation is carried out from HDFS, it
has been seen that the average time (seconds) keeps on increasing when data input is increased in
HDFS. The average time taken for retrieving data in HDFS is shown in the figure 6 and is 4.2
seconds for 100MB data size, 6.8seconds for 1000MB, 17.3seconds for 10000MB and 24.7second
for 100000MB data size.
Figure 5. Time taken for single Master server (jetty server) in the retrieval of data from HDFS.
Increased of Master Server (jetty server) will give better performance for retrieving data through
the Hadoop url / file/key. It has been seen that the average time (retrieving data) keeps on
decreasing when data input is constant or increasing in HDFS. The Master web server (Jetty
server) takes seconds to read a particular or text data from 100000 MB size of data which has been
stored in the HDFS where the data are kept constant (100000MB). We have increased the number
of servers from 1 to 6 servers for better performance in retrieving of text data from HDFS. The
average time taken for retrieval of text data in HDFS by Master server is shown in Figure 7 and is
22.7 seconds, 17.8seconds, and 14.7seconds, 8.3seconds, 7.6seconds and 4.8seconds form
100000MB data size where data are kept constant and web servers are increasing.

118 Computer Science & Information Technology (CS & IT)
Figure 6. Master Server in retrieval of data from HDFS
6. CONCLUSION & FUTURE WORK
In this paper, we have given the schematic view of the designed architecture with effective
structure to investigate the performance of Hadoop in high speed retrieval of data in a cloud
environment. Apache Web Server a dynamic cloud-ready load balancer was presented as well. It
was shown that the Master web server is a static load balancer when using one of the common load
balancing modules. To avoid having to manually add workers to the load balancer configuration,
we have also added a benchmarking and registration component to the workers.
The results shows that using this architecture in the Hadoop and making map phase as a web
server, faster read operation for MapReduce programs can be achieved through URL. For large
databases of data warehouse applications in cloud, searching process takes a very long time as the
data is scattered. High sped retrieval of data can be particularly useful for real-time applications
based on Hadoop where quick fetching and storage of data is necessary.
In future, experiments can be carried out on large datasets and some real-time applications to
measure the usefulness of the proposed approach. This web server can conceptually be extended to
provide dynamic load balancing capabilities. Apache Web Server cans also be used as a load
balancer in combination with Apache Tomcat workers.
REFERENCES
[1] A. Thusoo, J. S. Sarma, N. Jain, Z. Shao, P. Chakka, S. Anthony, H. Liu, P. Wyckoff, and R. Murthy,
“Hive - a warehousing solution over a Map-Reduce framework,” Proceeding very large data bases
(PVLDB), 2009, vol. 2, pages 1626–1629.
[2] Bhandarkar, M. “MapReduce programming with apache Hadoop”, parallel & distributed processing
international symposium on digital object identifier, IEEE, April 20 2010, pages 1-5.
[3] G. SubhaSadasivam, V.Karthikeyan, P. Raja, “Design and implementation of a novel peer-to- peer
information retrieval framework”, March 2008, pages: 1-9
[4] J. Dean and S. Ghemawat, “MapReduce: Simplified data processing on large clusters,” in Operating
system design and implementation (OSDI), a computer science conference, 2004, pages: 137–150.
[5] Jin Ming Shih;Chih Shan;Ruay Shiung Chang, “Simplifying MapReduce data processing”, Utility and
cloud computing(UCC), 4th IEEE International conferences on digital object
identifier,2011,pages:366-370.

Computer Science & Information Technology (CS & IT) 119
[6] Krishnan S.counio, J.C. “Pepper: An Elastic web server farm for cloud based on Hadoop” Cloud
computing technology and science, IEEE second international conferences on digital object identifier,
2010, pages 741-747.
[7] Tom White (June 2009), “Hadoop: The Definitive Guide”, First Edition, Yahoo press, June 2009.
[8] Apache Hadoop project (2012). [Online] Available: http://hadoop.apache.org/
[9] Shvachko,K.; Hairong Kuang; Radia, S.; Chansler, R. “The Hadoop Distributed File System”, Mass
storage system and technologies (MSST), IEEE 26th Symposium on digital object identifier, 2010,
pages:1-10.
[10] Yongqiang He, Rubao Lee, Yin Huai, Zheng Shao, Jain,N., Xiaodong Zhang, ZhiweiXu, “RCFile: A
fast and space efficient data placement structure in MapReduce based warehouse systems”, in Data
engineering(ICDE), IEEE 27th international conference on digital object identifier,2011,pages:1199-
1208.
[11] Xingguo Cheng,Nanfeng Xiao,Faliang Huang “Research on HDFS- based Web Server Cluster”, 2011
International conference on Digital object identifier,pages:1-4.
[12] Steffen Heinzl,Christoph Metz, “Toward a Cloud-ready Dynamic Load Balancer Apache Web
Sserver”, 2013 Workshops on Enabling Technologies: Infrastructure for Collaborative Enterprise,
pages:242-245
[13] NIST Definition of Cloud computing v15, csrc.nist.gov/groups/SNS/cloud-computing/cloud-def-
v15.doc.
[14] Daniel Grosu, M.S, “Load Balancer in Distributed Systems: A Game Theoretic Approach”, The
University of Texes at San Antonio, May 2003.
[15] The apache software foundation, “mod proxy,” hht://httpd.apache.org/docs/2.2/mod/mod proxy.html.
[16] “Mod proxy balancer,” http://httpd.apache.org/docs/2.2/mod/mod proxy balancer.html.
[17] Hsueh-Yi Chang,Hung-Chang Hsiao Yu-Change Chao, “the load rebalancing problem in distributed
file system”, IEEE international conference on cluster computing, 2012,pages:117-125
[18] Hung-Chang Hsiao,Hsueh-Yi Chung,Haiying Shen,Yu-Cchang Chao, “Load rebalancing for
distributed file systems in clouds”, IEEE transaction on parallel and distributed system,vol-24,no
5,may 2013,pages:951-961.

120 Computer Science & Information Technology (CS & IT)
INTENTIONAL BLANK
Sundarapandian et al. (Eds) : CCSEA, EMSA, DKMP, CLOUD, SEA - 2014
pp. 121–129, 2014. © CS & IT-CSCP 2014 DOI : 10.5121/csit.2014.4312
RICH INTERNET APPLICATIONS,
PLATFORMS AND TOOLS - A PARADIGM
SHIFT IN WEB USER EXPERIENCE
Jitendra Maan1 and Niranjan Mantha
2
Tata Consultancy Services Limited, India [email protected]
ABSTRACT
There has been a paradigm shift in the way how organizations are moving towards enterprise-
level adoption of Rich Internet Applications and Platforms with the evolution of internet. Earlier
the webpages were more of static content and involved lot of traversing through pages to com-
plete a transaction, now the web applications are very much dynamic, interactive and help the
user complete the same transaction in a few clicks. In the near term, such adoption will favor
The deployment of Rich Internet Applications and technologies added more twist to these
changing terrains by providing desktop like features, sandbox security and many more capabili-
ties there by creating an integrated rich user experience where most of the business users want
to access their RIA applications on Mobile and tablet devices.
This paper also presents key trends to understand the evolution of different RIA technologies
and also harness the power of RIA in creating an interactive and converging user experience
across domains and industries.
KEYWORDS
Rich Internet Applications, RIA Security, RIA Frameworks, Content delivery Network, Flex,
Ajax
1. INTRODUCTION
The focus of internet competition is rapidly progressing beyond mere delivery of products and
services to address the quality of the end user experience. It altogether brings a paradigm shift in
the way the business applications are developed, delivered and consumed. The continuous change
in user expectations has been brought about due to the new frontiers explored by the technology.
Gone are the days of static HTML pages with poor or no interaction. However, in the past, tech-
nology was playing a crucial role in deciding how and where to access information, but today, the
business is playing a crucial role in deciding the channels of information management and want
to gain the operational and cost advantages of deploying rich interactive applications over the
Internet, but worries surround with the limitations that Web browsers impose on user interfaces.
RichInternetapplications(RIAs)maybecomethenewnormforapplicationsusedbydecision-
makersandtask-orientedworkers. The Key Characteristics of RIA-based Solutions as below –
• Accessibility
• Advanced communications
• Complexity

122 Computer Science & Information Technology (CS & IT)
• Consistency
• Installation and Maintenance
• Offline
• Security
• Performance
• Richness
However, meeting the demand for information through innovative and rich interactive applica-
tions will continue to gain more prominence in the enterprises.
2. CHALLENGES FOR ADOPTING RIA
Most organizations need to factor-in various challenges in adopting RIA technologies –
• Accessibility and integration – Most of the RIA applications are developed using Ajax/JSON
and JavaScript technologies. Prevailing issues with Ajax implementation and JavaScript mod-
els are not new. Apart from the look and feel of RIA applications, most of the organizations are
concerned about the integration and communication protocols.
• RIA Security - Security is a key concern for RIA deployments across enterprises. Several
client-side frameworks open up new avenues of compromising critical information. The lack of
security aspects in RIA application is the major concern for its adoption across enterprises.
• Lack of standards – There is a lack of standards in RIA technologies. There is a lot of confu-
sion on using AJAX or Flex or a combination of both while each of them have their own ad-
vantages and issues, say for example, some of the Ajax tools have cross-browser and cross-
platform problems. There is a need to identify and consolidate best practices and provide refer-
ence implementation for tools interoperability and decide on right programming models.
• Lack of Rich, Interactive Use Experience – Organizations are looking a rich user expe-
rience that engages business users more effectively and personalize their web experience based
on their preferences and needs so that they can make better informed decisions in real-time
which is only possible through an intuitive and easy-to-navigate RIA.
3. POTENTIAL OF A NEW RIA PARADIGM
A rich Internet application (RIA) is the converging point between both desktop-based and brows-
er-based applications. RIA's are generally lightweight applications which provide the features of a
desktop based application and is executed and displayed via a browser.RIA based applications
have evolved over the time to deal with the challenges and limitations of development and deli-
very of both web and desktop applications.
Some of the RIA benefitsfor enterprises are given below –
• The same application can accessed within desktop, browser and mobile platforms
• Rich user experience meeting the consumer demands along with the ones of business users
• Multiple types of content can be served using a single user interface than having to build and
maintain multiple applications
• Enables an engaging, interactive user experience without page reloads or refreshes
• Real-time data and cross platform support
• Increased customer and partner productivity and reduce operational cost

Computer Science & Information Technology (CS & IT) 123
There are several recurring problems that need to be addressed by considering right design prin-
ciples in RIA applications. With the same context, enterprises need to look at a few fundamental
questions –
• What are the business benefits of adopting RIA and what are the challenges?
• Will RIA implementation lead to increased end user productivity?
• How to design a RIA application with fast response time?
• How secured is the RIA Application architecture?
• When to use RIA frameworks? Which technology to choose?
• How RIA fits into SOA-based Enterprise Architecture Stack?
• What is the Role of RIA in Cloud delivery model?
• Is RIA solution based on open standards?
• When to use Ajax?
• Is RIA Mash-up required?
While significant attention has recently been placed on emerging RIA technologies such as Asyn-
chronous JavaScript and XML (Ajax) style solutions to Cloud-based mash-up deployments, but
their success, mainly depends on the user-centered design which offers desktop-like experience
by combining real-time user interaction with rich user interfaces. Moreover, enterprises need to
align their technology practices and to instill the right composition of technology, platforms and
disciplines in order to consistently execute ahead of others.
4. RICH INTERNET APPLICATIONS (RIA) EMERGING TRENDS
Rich Internet Application platforms are moving from an early adoption phase to enterprise level
adoption and are emerging as next generation vehicles more suited to decision makers and busi-
ness end users who need seamless, high quality visual user experience. This leads to the key RIA
trends that we see across the industry. To name a few:
4.1. Improve Customer Experience Through RIA
No matter how customers interact with an enterprise, whether it through an online store, net bank-
ing portal, or a mobile application designed to indicate the latest products or services available
where each interaction builds on the top of the last one. There are a few important factorsto con-
sider while delivering an intuitive customer experience –
4.1.1. Consistent Experience Across Channels
In the recent past, there have been remarkable changes in the mobility space with technology ad-
vancements and new innovations meeting the need of accessing information through intuitive and
rich applications on smartphones and tablets. Ubiquity of information on all form factors of mo-
bile and tablet devices changes the user perception on how they ought to get what they need in
whatever form and wherever they need it.
A common theme that has emerged across customers, RIA exist as part of an overall Web expe-
rience where a collection of Web technologies such as Ajax, Flex, JavaFx are looked as the subset
of RIA each flourishing in its own right, coming together in powerful new ways but they com-
plement each other when used in the context of Service oriented architecture (SOA).
Without a concrete focus on Mobility strategy or long-term roadmap, enterprises today misses out
an opportunity to acquire new customer and leverage many different channels across their line of
business and it is even more important to ensure that user has a consistent and rich experience

124 Computer Science & Information Technology (CS & IT)
across all such channels. To this effect, enterprises generate powerful positive word of mouth and
convert their customer base from satisfied customers to loyal advocates.
4.1.2. Empowering Customers
It is in the best interest of organizations to invest in technologies to enable and empower their
customers by provide in their applications, across channels, the right number of options and au-
tomation capabilities to allow end users to customize their experience, and let them manage their
information. Not only does this empower business users to customize the information presented
to them, it also greatly increases the adoption of the applications as well as the likelihood of them
sticking with it and recommending it to others.
4.1.3. Intuitive, User Friendly Interfaces For Enterprise Processes
Enterprise Processes are most critical for day to day operations of global businesses and systems.
It is imperative to enhance all customer touch points with enterprise processes, by building user
interfaces that are intuitive and interactive and guide them to provide all essential data, required
by the enterprise as well as regulatory and compliance processes.This data can then be plugged
into enterprise processes and used to generate all manner of documentation, legal or otherwise, in
whatever layout or format desired.
There is a need of having an RIA developed capability to provide a consolidated view of informa-
tion from all relevant systems and processes at one place at the same time. More and more com-
panies are moving towards such a consolidated dashboard, that they can build around key activi-
ties and strategic analysis, leveraging not only information within the company firewall but also
relevant information outside it. Such a consolidation of information is going to be key in future,
for companies to squeeze out productivity out of their employees and save on time, as well as
being nimble when it comes to looking at the bigger picture across systems.
4.2 RIA Security
One of the most important assets on which an enterprise stands is data and the security of the data
is of vital importance for the enterprise. Technology selection depends significantly on its com-
pliance to core security model. The criticality of the data governs the choice of technology where
security needs to be one of the prime features. The sand box modelintroduced by Java applets in
the early 2000 can be considered as a benchmark in this area where in the client cannot access
any local resources except that the ones from where it originated. Sandbox security is an impor-
tant trend to provide a security-rich user experience from RIA-based architectures. This idea is
being implemented by several RIA technologies like Adobe Flex providing a secure environment
for the data to be used by the intended application only.
4.3 RIA on the Cloud
Most of the enterprises are moving their platforms and services to the cloud where RIA applica-
tions are deployed on the cloud and clients access their services on pay-per use model without
much marrying about deployment and scalability. In social media space, enterprises are leverag-
ing RIA mash-ups to provide their users a unified view of various information hubs.
4.4 RIA Applications - Server-side Components
The USP of RIA based applications is the way they abstract the server side capabilities from the
user by providing a desktop based application kind of look and feel. The earlier technologies

Computer Science & Information Technology (CS & IT)
failed to create this wave as they relied heavily on HTTP and web services based communication
with the components located in the server and these often would get clogged du
data transfer. The current technologies have gone a step ahead and started using a new protocol
Binary protocol. Action Script Messaging Format (AMF) used by GWT, JavaFx, Adobe Flex etc.,
is an example of this protocol.
A recent trend observed is that several RIA frameworks comes bundled with support for integr
tion with server-side technologies which essentially ease the work of system integrators to ensure
that all integrate and communicate with each other seamlessly.
5. WEB USER EXPERIENCE
The behavior of the web users has changed over the times with the ad
portunities and how soon they grab those to stay current in the market. The earlier web technol
gies use to pose challenges to the users like:
• Traversing through multiple pages to accomplish as set of tasks which takes a lot of time and
being less intuitive to new users.
• The data visualization was more monotonous and less interactive in providing visually appea
ing and interactive data display,
plays a vital role in their data to day activities.
• The users were unable to customize the look and feel as needed and perceived by them for their
usage needs. The web pages were less in
quainted with the application to cater to their activities.
The behavior based programing has brought in a paradigm shift in the thought process of both the
users and developers as it allows in creating views
like menus, but-tons, trees, etc. for the developers and the a
interactive and also considerably decreasing the learning curve and thus changing the overall e
perience of the users.
Computer Science & Information Technology (CS & IT)
failed to create this wave as they relied heavily on HTTP and web services based communication
with the components located in the server and these often would get clogged due to the increased
data transfer. The current technologies have gone a step ahead and started using a new protocol
Binary protocol. Action Script Messaging Format (AMF) used by GWT, JavaFx, Adobe Flex etc.,
observed is that several RIA frameworks comes bundled with support for integr
side technologies which essentially ease the work of system integrators to ensure
that all integrate and communicate with each other seamlessly.
PERIENCE ADOPTION
The behavior of the web users has changed over the times with the ad-vent of new business
portunities and how soon they grab those to stay current in the market. The earlier web technol
gies use to pose challenges to the users like:
Traversing through multiple pages to accomplish as set of tasks which takes a lot of time and
being less intuitive to new users.
The data visualization was more monotonous and less interactive in providing visually appea
ing and interactive data display, which is very much needed by the current day user as data
plays a vital role in their data to day activities.
The users were unable to customize the look and feel as needed and perceived by them for their
. The web pages were less interactive and had a bigger learning curve to get a
quainted with the application to cater to their activities.
The behavior based programing has brought in a paradigm shift in the thought process of both the
users and developers as it allows in creating views that simulate desktop application components
tons, trees, etc. for the developers and the applications are more intui
interactive and also considerably decreasing the learning curve and thus changing the overall e
Fig. 1.User-centered Design
125
failed to create this wave as they relied heavily on HTTP and web services based communication
e to the increased
data transfer. The current technologies have gone a step ahead and started using a new protocol –
Binary protocol. Action Script Messaging Format (AMF) used by GWT, JavaFx, Adobe Flex etc.,
observed is that several RIA frameworks comes bundled with support for integra-
side technologies which essentially ease the work of system integrators to ensure
vent of new business op-
portunities and how soon they grab those to stay current in the market. The earlier web technolo-
Traversing through multiple pages to accomplish as set of tasks which takes a lot of time and
The data visualization was more monotonous and less interactive in providing visually appeal-
which is very much needed by the current day user as data
The users were unable to customize the look and feel as needed and perceived by them for their
and had a bigger learning curve to get ac-
The behavior based programing has brought in a paradigm shift in the thought process of both the
that simulate desktop application components
pplications are more intuitive and
interactive and also considerably decreasing the learning curve and thus changing the overall ex-

126 Computer Science & Information Technology (CS & IT)
The RIA’s unlike traditional web applications use the client environment to provide a desktop
like look and feel by using plug-in like fea
This helps in providing a desktop like look and feel and in some cases offline usage capabilities.
The offline usage capabilities might be needed in some scenarios where in the users might be
working from a remote location or a place of less connectivity, they can still continue to work and
the application gets synced with the server
from the loss of productivity, time and data.
5.1. RIA – Impact on Web User Experience
The evolving RIA technologies are creating a lot of impact in the way the applications and deve
oped and experienced by the users. The tradi
the browser is used as a mere rendering laye
etc. are performed at the server side
user and while doing this it might make a lot of trips back and forth to the server to compile a
chunk of displayable content. This increases the response time to the user and creating a negative
impact on the user experience.
On the contrary the RIA’s have created
but for some of the validating and processing activities, thus reducing the load on the server and
decreasing the response time. Only the required and requested data is brought back from the ser
er. Using some of the latest design methodologies and technol
predicted and the data needed for that action can be pre
proved the user experience manifolds. There is a downside for this design approach, if the user
does not perform the expected action, even then the application n
action and this might impact the user experience. Although the latest RIA technologies up to
some extent help the designers in this aspect, utmost care needs to be taken other
ruin the user experience.
5.2. Key RIA Technologies and Platforms
There has been a significant focus on various RIA platforms such as Adobe Flex/Flash, Microsoft
Silverlight and IBM Lotus Expeditor in a belief that these enterprise
ture rich RIA tools and platforms that go beyond basic Ajax capabilities. Moreover, their market
adoption is seen to be increasing as the technology matures and the market broadens over time.
Computer Science & Information Technology (CS & IT)
The RIA’s unlike traditional web applications use the client environment to provide a desktop
in like features and thus offloading some load from the servers.
This helps in providing a desktop like look and feel and in some cases offline usage capabilities.
The offline usage capabilities might be needed in some scenarios where in the users might be
om a remote location or a place of less connectivity, they can still continue to work and
the application gets synced with the server once the connectivity is available, thus preventing
from the loss of productivity, time and data.
b User Experience
The evolving RIA technologies are creating a lot of impact in the way the applications and deve
rienced by the users. The traditional web applications rely a lot on the servers as
the browser is used as a mere rendering layer/engine to the user. All the validations, com
etc. are performed at the server side and the browser just renders this aggregated response to the
user and while doing this it might make a lot of trips back and forth to the server to compile a
k of displayable content. This increases the response time to the user and creating a negative
On the contrary the RIA’s have created an impact by involving the client tier of not just display
and processing activities, thus reducing the load on the server and
sponse time. Only the required and requested data is brought back from the ser
esign methodologies and technologies the user’s next action ca
predicted and the data needed for that action can be pre-fetched from the server. This has i
proved the user experience manifolds. There is a downside for this design approach, if the user
does not perform the expected action, even then the application needs to cater to the current user
action and this might impact the user experience. Although the latest RIA technologies up to
some extent help the designers in this aspect, utmost care needs to be taken other-wise it might
Key RIA Technologies and Platforms
There has been a significant focus on various RIA platforms such as Adobe Flex/Flash, Microsoft
Silverlight and IBM Lotus Expeditor in a belief that these enterprise-oriented vendors offer fe
forms that go beyond basic Ajax capabilities. Moreover, their market
adoption is seen to be increasing as the technology matures and the market broadens over time.
Fig.2. RIA – Key Technologies
The RIA’s unlike traditional web applications use the client environment to provide a desktop
tures and thus offloading some load from the servers.
This helps in providing a desktop like look and feel and in some cases offline usage capabilities.
The offline usage capabilities might be needed in some scenarios where in the users might be
om a remote location or a place of less connectivity, they can still continue to work and
ble, thus preventing
The evolving RIA technologies are creating a lot of impact in the way the applications and devel-
tional web applications rely a lot on the servers as
tions, computations
ders this aggregated response to the
user and while doing this it might make a lot of trips back and forth to the server to compile a
k of displayable content. This increases the response time to the user and creating a negative
ent tier of not just display
and processing activities, thus reducing the load on the server and
sponse time. Only the required and requested data is brought back from the serv-
ogies the user’s next action can
fetched from the server. This has im-
proved the user experience manifolds. There is a downside for this design approach, if the user
eeds to cater to the current user
action and this might impact the user experience. Although the latest RIA technologies up to
wise it might
There has been a significant focus on various RIA platforms such as Adobe Flex/Flash, Microsoft
oriented vendors offer fea-
forms that go beyond basic Ajax capabilities. Moreover, their market
adoption is seen to be increasing as the technology matures and the market broadens over time.

Computer Science & Information Technology (CS & IT) 127
The emerging trends are portraying a picture that enterprise RIA ad-dresses the enhancements in
existing web applications, next-generation enterprise portals, event-driven applications, BI and
mash-up oriented solutions. From software development perspective, RIA follows a standard
model with rich controls that include powerful data and multimedia capability allowing end users
to present a rich set of information in more attractive interface. From design perspective, RIA de-
livers highly customizable output with a CSS (Cascading Style Sheet) based model.
As far as, an expressive, secure and cross platform user experience is concerned, there is a neces-
sity to bridge the gap between user experience design and programming logic. Rich Web technol-
ogy like JavaFx addresses such gap by featuring a high-performance declarative scripting lan-
guage with a suite of tools and authoring solutions that helps building and delivering the next
generation of rich Internet applications for desktop, mobile, TV, and other consumer platforms.
Apart from the Java language itself, there are several well-known JVM languages available in the
market such as – JavaFx Script, JRuby (an implementation of Ruby), Jython (an implementation
of Python), Rhino (an implementation of JavaScript), but Groovy, an agile and dynamic language
for JVM, is getting popular and started taking shape in customer technology landscape to improve
productivity by accelerated deployment cycles. Dynamically typed languages are much more
expressive and easier to code with than statically typed languages. With this perspective one the
areas to be explored is the flexibility of Groovy over Grails as Grails currently supports all popu-
lar frameworks like Prototype, Dojo, script.aculo.us and Yahoo User Interface (YUI).
6. KEY TAKEAWAYS
Due to the availability of feature rich technologies in the RIA space enterprises are investing in
building and deploying rich and dynamic content based applications to improve their user expe-
rience. However as every coin have two sides there are some challenges that the enterprises are
facing along with the features. RIA can have a significant and transformative impact on business-
es and a few learnings on the same line as given below –
• RIA project strategy to be developedin-line with organization business goals that improve
the brand value by bringing company’s web presence in the market
• Organization to consider adding RIA components to existing sites and micro-sites to reduce
cost in long run
• Next stage of Internet – RIA to support mobility initiatives and integrate with cloud based
delivery model and services (PaaS/SaaS)
• A new generation of RIA tools to use standards-based technologies and industry specific pro-
gramming models and patterns to create solutions that deliver secure, scalable and high per-
formance solutions
• Leverage a lightweight fully featured UI framework for RIA development that closely
matches the look and feel of a native desktop application GUI.
• Dynamic Content delivery-As long as the application has static content and data that does not
change frequently; they can be cached to deliver faster experience to the users. Content Deli-
very Network (CDN’s) like Amazon Cloud Front, Akamai can be leveraged for this. These
CDN’s have a wide network of Edge location across the globe and can cache the static content
in those servers and can deliver it to the users swiftly. As the dynamic data increases it be-
comes difficult to cache and thus takes a long response time and affects the user experience. In
this situation new technologies like Akamai’s Dynamic Site Accelerator (DSA) can be leve-

128 Computer Science & Information Technology (CS & IT)
raged. The DSA ensures that all site elements including the static ones and dynamic are deli-
vered with an improved response time.
• Usability-Although the RIA based applications are meant to improve the user experience with
interactive and simple look and feel, if the design is too complicated then it may confuse the
users and in turn hits their experience. It is always suggested to keep the design simple and
more intuitive so that the user has a pleasant experience while using the application.
• RIA application to be designed addressing key enterprise issues like security, integration,
authentication and authorization.
7. CONCLUDING NOTES
The rich internet application space is replete with software products, and witnesses launches
every day. It is obvious that with the emergence of RIA technologies, customer immediate focus
has shifted towards those tools, technologies or platforms that deliver rich user experience that is
visibly different than what’s delivered by traditional server-centric platforms.
With its proven market convergence RIA based applications flaunt their ability to combine the
strengths and advantages of browser and desktop applications. The web applications focus on
accessibility, contextual interaction, ease of use and quick deployment to deliver a more relevant,
aggregated and social experience to the user.
The potential of RIA is not fully realized by enterprises yet. As the RIA adoption is catching up,
the bar regarding the basic requirements like security, availability, reliability and similar fea-
tures is getting raised. The RIA technologies are coping up with the raised bar and evolving to
bridge the gap with the requirements.
REFERENCES
[1] Garrett, Jesse James, Saminal Ajax paper, Located at
http://www.adaptivepath.com/publications/essays/archives/000385.php
[2] Technical Report, Macromedia USA] Allaire, J., “Macromedia Flash MX—A next-generation rich
Client,” Macromedia white paper, San Francisco, CA, USA, 2002.
[3] Leonardo Machado, Orlando Filho, JoãoRibeiro. 2009. UWE-R: “An Extension to a Web Engineer-
ing Methodology for Rich Internet Applications.” WSEAS Trans. Info. Sci. and App. 6, 4 (Apr.
2009), 601-610.
[4] J. Yu, B. Benatallah, F. Casati, and R. Saint-Paul. XUP Client – a Thin Client for Rich Internet Appli-
cations.
[5] Francisco Valverde, Oscar Pastor. “Applying Interaction Patterns: Towards a Model-Driven Ap-
proach for Rich Internet Applications Development”, Proc. 7th Int. Workshop. on Web-Oriented
Software technologies (IWWOST 2008)
[6] M. Domenig. “Rich Internet Applications – Selecting the best product.” Located at
http://www.javalobby.org/articles/ajax-ria-overview
[7] T. Noda, and S. Helwig.“Rich Internet Applications”, UW E-Business-Consortium, 2005.
[8] Leslie Michael Orchard, AraPehlivanian and Jonathan Snook. Professional JavaScript Frameworks:
Prototype, jQuery, YUI, ExtJS, Dojo and MooTools. Wiley & Sons, 2009
[9] MatiasUrbieta, Gustavo Rossi, JeronimoGinzburg, Daniel Schwabe. Designing the Interface of Rich
Internet Applications. Proc. 5th Latin American Web Congress (LAWeb’07), pp.144-153, IEEE,
2007

Computer Science & Information Technology (CS & IT) 129
AUTHORS
Jitendra Maan, a versatile IT Professional with a total of more than 17 years of experi-
ence spread across various domains in IT Industry and he is currently working with Tata
Consultancy Services Limited in a leading role to drive Social Computing and Java and
Open Source Solutions and Offerings to address customer needs in HiTech ISU. Jitendra
practices technology consulting, enterprise architecture and evangelizes social comput-
ing initiatives within TCS and has successfully delivered technology solutions for glob-
ally distributed clientele. Jitendra is certified in Project Management (CIPM) by Project
Management Associates (PMA)India and has successfully achieved the standards of TOGAF 8 Certifica-
tion program. Jitendra has a proven track record of sharing technology thought leadership in various inter-
national conferences and also presented his research work in various international events/forums. Jitendra
is also a member to professional bodies like PMA (Project Management Associates), IEEE (Institute of
Electrical and Electronics Engineers, Computer Society of India (CSI) Delhi Chapter, Open Group AEA
Delhi Chapter.
Niranjan Mantha, having 15 years of IT experience across different geographies. He is currently manag-
ing the Java and Open Source opportunities and initiatives in HiTech ISU. Niranjan is a TOGAF 9 Certi-
fied Practitioner an Certified SCRUM Master, having vast knowledgeable in the area of Amazon Cloud
Services.

AUTHOR INDEX
Ajay Parashar 95
Annappa 111
Diganta Saha 29
Gita Shah 111
HOU Kun-Mean 75
Jayita Mitra 29
Jitendra Maan 103, 121
Kshirsagar D. B 01
Mohit Jha 13
Mrudula Karande 01
Niranjan Mantha 103, 121
Rangarajan P 85
Sailaja Arsi 51
Sharma G K 13
Shet K.C 111
Siddhartha Mukherjee 39
Srinivasa Rao Ravuri 51
Sunny Deol 13
Udhaya Suriya T.S 85
Uma Boregowda 63
Vaibhav Jha 13
Venkata Narasimha Inukollu 51
Venugopal Chakravarthy 63
Xing Kexing 75
Zhou Haiying 75
Zuo Decheng 75


