
Computer Organization and Structure
Bing-Yu Chen National Taiwan University
1
Storage and Other I/O Topics I/O Performance Measures Types and Characteristics of
I/O Devices Buses Interfacing I/O Devices to the
Memory, Processor, and OS Designing an I/O System
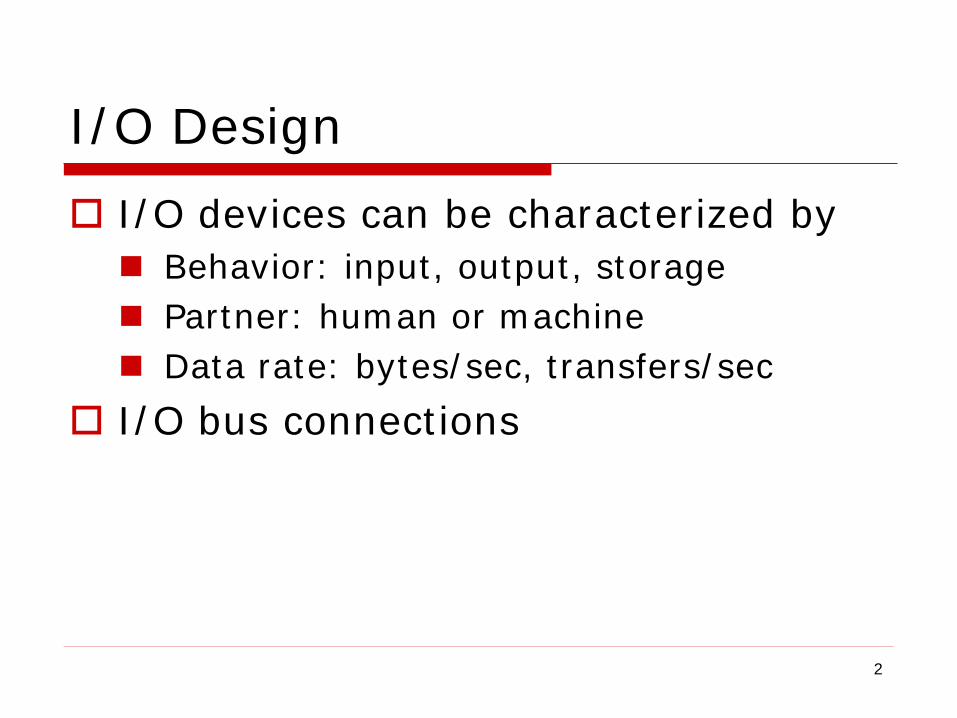
I/O Design I/O devices can be characterized by Behavior: input, output, storage Partner: human or machine Data rate: bytes/sec, transfers/sec
I/O bus connections
2
3
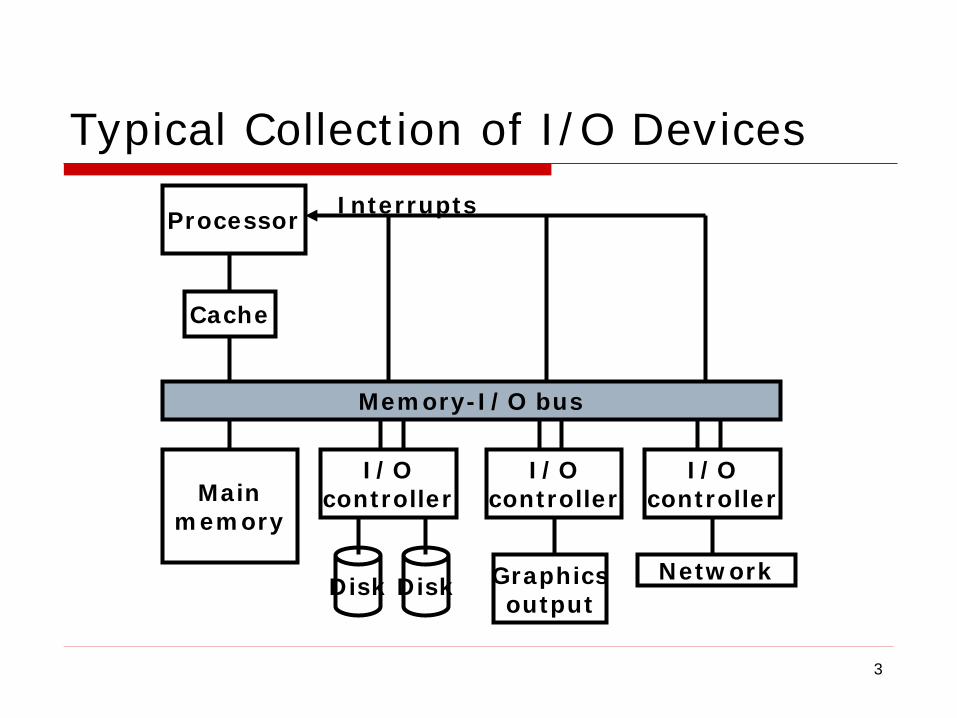
Typical Collection of I/O Devices
Processor
Cache
Main memory
I/O controller
I/O controller
I/O controller
Memory-I/O bus
Graphics output
Disk Disk Network
Interrupts

6
Types and Characteristics of I/O Devices
device behavior partner data rate (MB/sec.)
Keyboard input human 0.0001
Mouse input human 0.0038
Voice Input input human 0.2640
Sound Input input machine 3.0000
Scanner input human 3.2000
Voice Output output human 0.2640
Sound Output output human 8.0000
Laser Printer output human 3.2000
Graphics Display output human 800.0000-8000.0000
Cable Modem input or output machine 0.1280-6.0000
Network / LAN input or output machine 100.0000-10000.0000
Network / wireless LAN input or output machine 11.0000-54.0000
Optical Disk storage machine 80.0000-220.0000
Magnetic Tape storage machine 5.0000-120.0000
Flash Memory storage machine 32.0000-200.0000
Magnetic Disk storage machine 800.0000-3000.0000
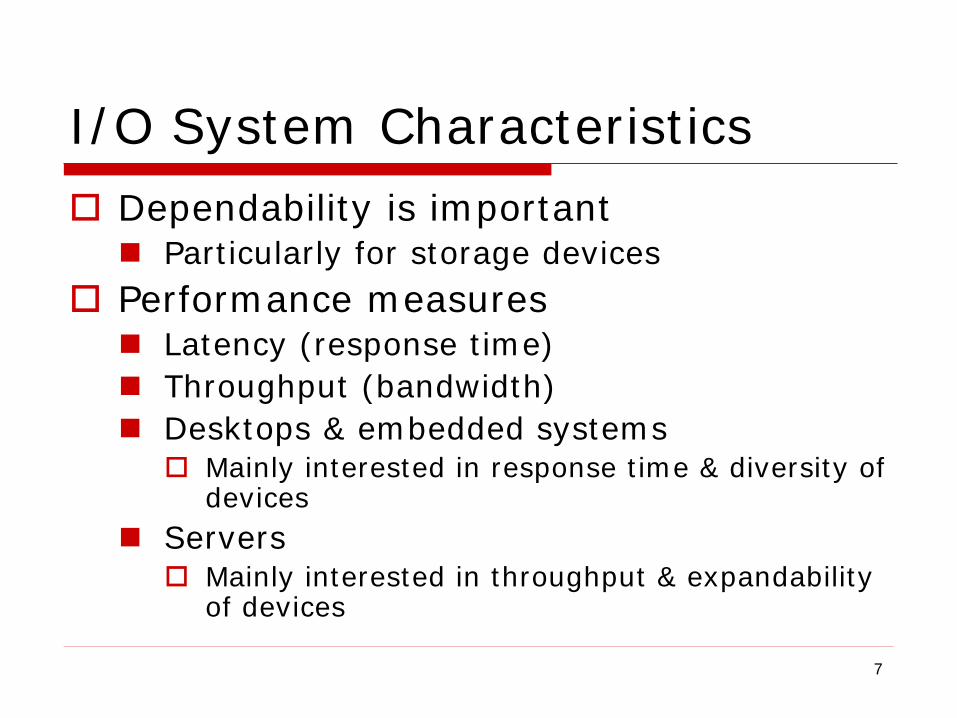
I/O System Characteristics Dependability is important Particularly for storage devices
Performance measures Latency (response time) Throughput (bandwidth) Desktops & embedded systems Mainly interested in response time & diversity of
devices Servers Mainly interested in throughput & expandability
of devices
7
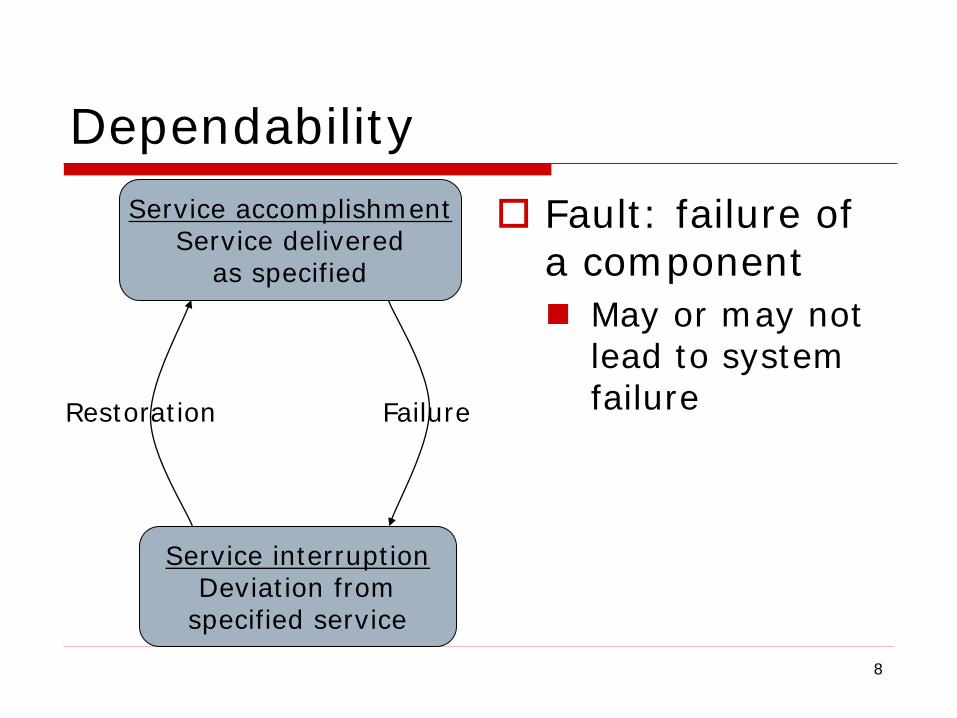
Dependability Fault: failure of
a component May or may not
lead to system failure
Service accomplishment Service delivered
as specified
Service interruption Deviation from
specified service
Failure Restoration
8
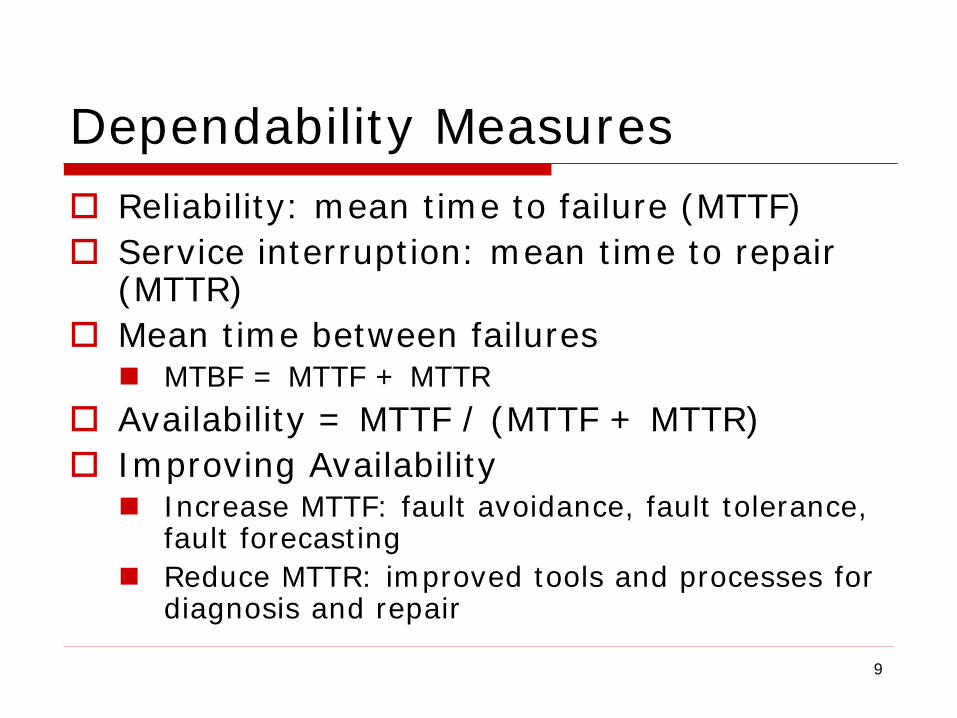
Dependability Measures Reliability: mean time to failure (MTTF) Service interruption: mean time to repair
(MTTR) Mean time between failures MTBF = MTTF + MTTR
Availability = MTTF / (MTTF + MTTR) Improving Availability Increase MTTF: fault avoidance, fault tolerance,
fault forecasting Reduce MTTR: improved tools and processes for
diagnosis and repair
9

Disk Storage Nonvolatile, rotating magnetic storage
10
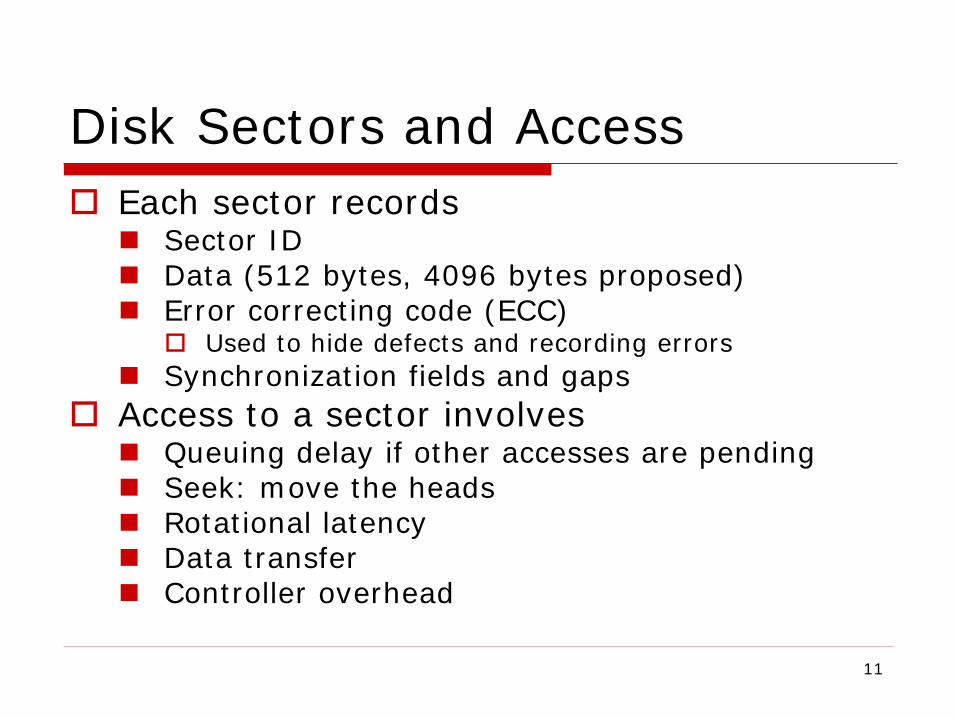
Disk Sectors and Access Each sector records Sector ID Data (512 bytes, 4096 bytes proposed) Error correcting code (ECC)
Used to hide defects and recording errors Synchronization fields and gaps
Access to a sector involves Queuing delay if other accesses are pending Seek: move the heads Rotational latency Data transfer Controller overhead
11

Disk Access Example Given 512B sector, 15,000rpm, 4ms average seek
time, 100MB/s transfer rate, 0.2ms controller overhead, idle disk
Average read time 4ms seek time
+ ½ / (15,000/60) = 2ms rotational latency + 512 / 100MB/s = 0.005ms transfer time + 0.2ms controller delay = 6.2ms
If actual average seek time is 1ms Average read time = 3.2ms
12

Disk Performance Issues Manufacturers quote average seek time Based on all possible seeks Locality and OS scheduling lead to smaller actual
average seek times Smart disk controller allocate physical
sectors on disk Present logical sector interface to host SCSI, ATA, SATA
Disk drives include caches Prefetch sectors in anticipation of access Avoid seek and rotational delay
14

Flash Storage Non-volatile semiconductor storage 100× – 1000× faster than disk Smaller, lower power, more robust But more $/GB (between disk and DRAM)
15

Flash Types NOR flash: bit cell like a NOR gate Random read/write access Used for instruction memory in embedded
systems NAND flash: bit cell like a NAND gate Denser (bits/area), but block-at-a-time access Cheaper per GB Used for USB keys, media storage, …
Flash bits wears out after 1000’s of accesses Not suitable for direct RAM or disk replacement Wear levelling: remap data to less used blocks
16

Interconnecting Components Need interconnections between CPU, memory, I/O controllers
Bus: shared communication channel Parallel set of wires for data and
synchronization of data transfer Can become a bottleneck
Performance limited by physical factors Wire length, number of connections
More recent alternative: high-speed serial connections with switches Like networks
17

Bus Types Processor-Memory buses Short, high speed Design is matched to memory
organization I/O buses Longer, allowing multiple connections Specified by standards for
interoperability Connect to processor-memory bus
through a bridge 18
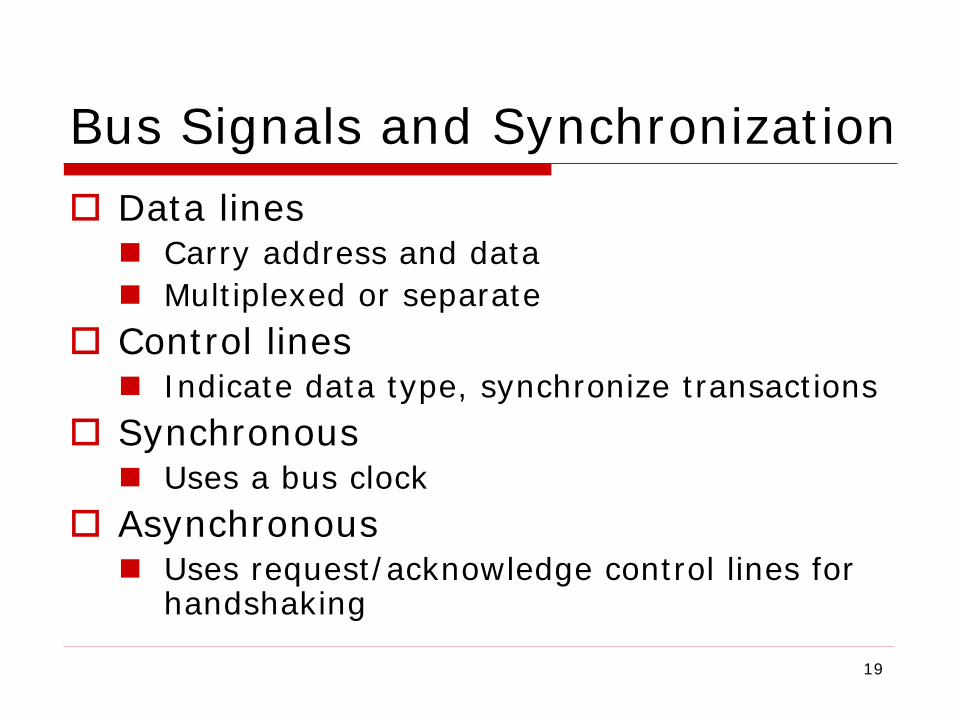
Bus Signals and Synchronization Data lines Carry address and data Multiplexed or separate
Control lines Indicate data type, synchronize transactions
Synchronous Uses a bus clock
Asynchronous Uses request/acknowledge control lines for
handshaking
19
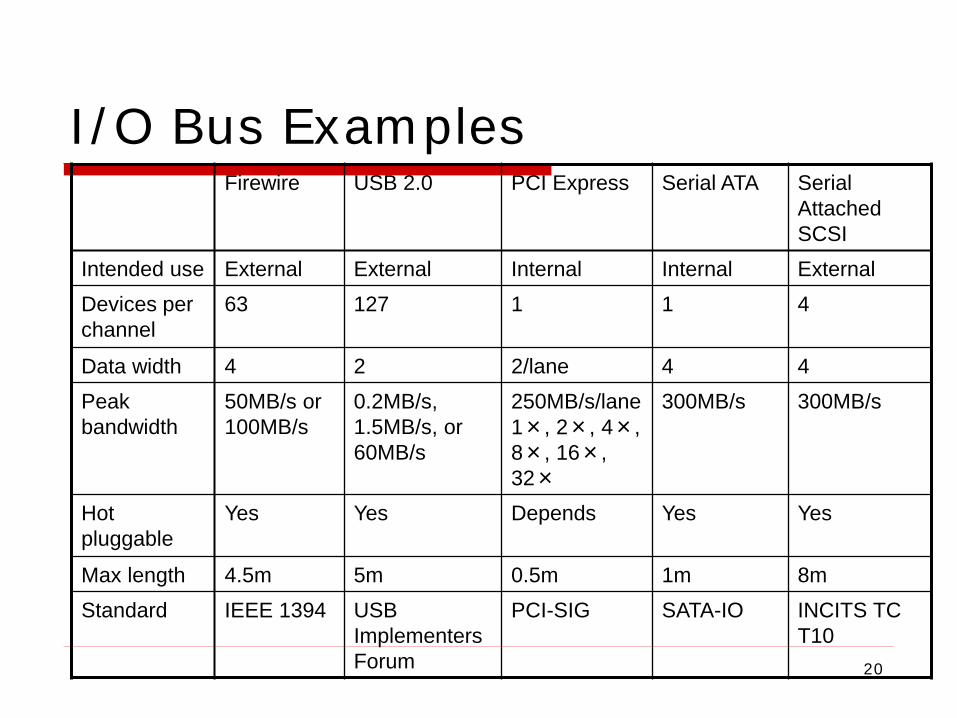
I/O Bus Examples Firewire USB 2.0 PCI Express Serial ATA Serial
Attached SCSI
Intended use External External Internal Internal External Devices per channel
63 127 1 1 4
Data width 4 2 2/lane 4 4 Peak bandwidth
50MB/s or 100MB/s
0.2MB/s, 1.5MB/s, or 60MB/s
250MB/s/lane 1×, 2×, 4×, 8×, 16×, 32×
300MB/s 300MB/s
Hot pluggable
Yes Yes Depends Yes Yes
Max length 4.5m 5m 0.5m 1m 8m Standard IEEE 1394 USB
Implementers Forum
PCI-SIG SATA-IO INCITS TC T10
20
I/O Management I/O is mediated by the OS Multiple programs share I/O resources Need protection and scheduling
I/O causes asynchronous interrupts Same mechanism as exceptions
I/O programming is fiddly OS provides abstractions to programs
21

I/O Commands I/O devices are managed by I/O controller
hardware Transfers data to/from device Synchronizes operations with software
Command registers Cause device to do something
Status registers Indicate what the device is doing and occurrence
of errors Data registers Write: transfer data to a device Read: transfer data from a device
22
I/O Register Mapping Memory mapped I/O Registers are addressed in same space as
memory Address decoder distinguishes between them OS uses address translation mechanism to
make them only accessible to kernel I/O instructions Separate instructions to access I/O registers Can only be executed in kernel mode Example: x86
23

Polling Periodically check I/O status register If device ready, do operation If error, take action
Common in small or low-performance real-time embedded systems Predictable timing Low hardware cost
In other systems, wastes CPU time
24
Interrupts When a device is ready or error occurs Controller interrupts CPU
Interrupt is like an exception But not synchronized to instruction execution Can invoke handler between instructions Cause information often identifies the interrupting
device Priority interrupts Devices needing more urgent attention get higher
priority Can interrupt handler for a lower priority interrupt
25
I/O Data Transfer Polling and interrupt-driven I/O CPU transfers data between memory and
I/O data registers Time consuming for high-speed devices
Direct memory access (DMA) OS provides starting address in memory I/O controller transfers to/from memory
autonomously Controller interrupts on completion or
error 26
DMA/Cache Interaction If DMA writes to a memory block that is
cached Cached copy becomes stale
If write-back cache has dirty block, and DMA reads memory block Reads stale data
Need to ensure cache coherence Flush blocks from cache if they will be used for
DMA Or use non-cacheable memory locations for I/O
27

DMA/VM Interaction OS uses virtual addresses for memory DMA blocks may not be contiguous in physical
memory Should DMA use virtual addresses? Would require controller to do translation
If DMA uses physical addresses May need to break transfers into page-sized
chunks Or chain multiple transfers Or allocate contiguous physical pages for DMA
28
Measuring I/O Performance I/O performance depends on Hardware: CPU, memory, controllers, buses Software: operating system, database
management system, application Workload: request rates and patterns
I/O system design can trade-off between response time and throughput Measurements of throughput often done
with constrained response-time
29

I/O vs. CPU Performance Amdahl’s Law Don’t neglect I/O performance as parallelism
increases compute performance Example Benchmark takes 90s CPU time, 10s I/O time Double the number of CPUs/2 years I/O unchanged
Year CPU time I/O time Elapsed time % I/O time now 90s 10s 100s 10% +2 45s 10s 55s 18% +4 23s 10s 33s 31% +6 11s 10s 21s 47%
30
RAID Redundant Array of Inexpensive
(Independent) Disks Use multiple smaller disks (c.f. one large disk) Parallelism improves performance Plus extra disk(s) for redundant data storage
Provides fault tolerant storage system Especially if failed disks can be “hot swapped”
RAID 0 No redundancy (“AID”?) Just stripe data over multiple disks
But it does improve performance
31

RAID 1 & 2 RAID 1: Mirroring N + N disks, replicate data Write data to both data disk and mirror disk On disk failure, read from mirror
RAID 2: Error correcting code (ECC) N + E disks (e.g., 10 + 4) Split data at bit level across N disks Generate E-bit ECC Too complex, not used in practice
32
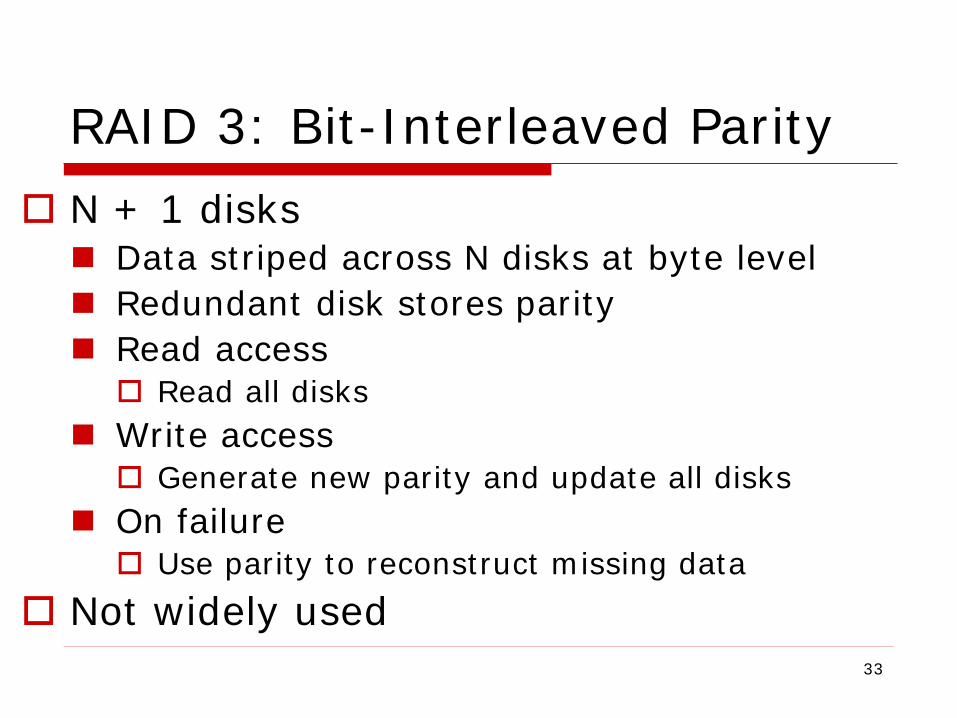
RAID 3: Bit-Interleaved Parity N + 1 disks Data striped across N disks at byte level Redundant disk stores parity Read access Read all disks
Write access Generate new parity and update all disks
On failure Use parity to reconstruct missing data
Not widely used 33
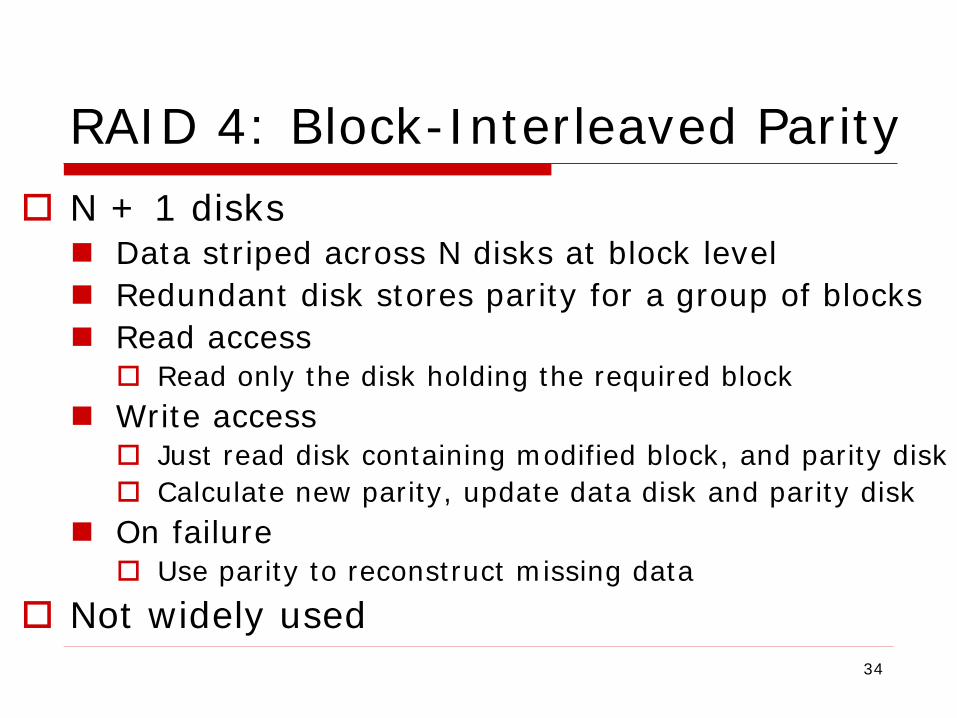
RAID 4: Block-Interleaved Parity N + 1 disks Data striped across N disks at block level Redundant disk stores parity for a group of blocks Read access Read only the disk holding the required block
Write access Just read disk containing modified block, and parity disk Calculate new parity, update data disk and parity disk
On failure Use parity to reconstruct missing data
Not widely used 34
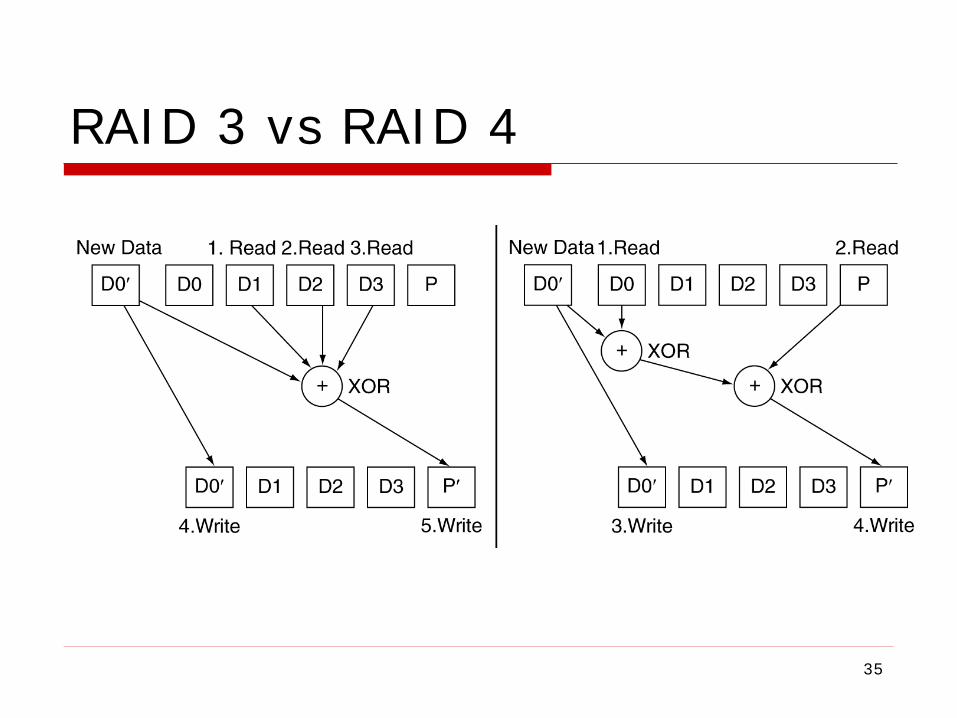
RAID 3 vs RAID 4
35

RAID 5: Distributed Parity N + 1 disks Like RAID 4, but parity blocks distributed across
disks Avoids parity disk being a bottleneck
Widely used
36
RAID 6: P + Q Redundancy N + 2 disks Like RAID 5, but two lots of parity Greater fault tolerance through more
redundancy Multiple RAID More advanced systems give similar fault
tolerance with better performance
37
I/O System Design Satisfying latency requirements For time-critical operations If system is unloaded Add up latency of components
Maximizing throughput Find “weakest link” (lowest-bandwidth
component) Configure to operate at its maximum bandwidth Balance remaining components in the system
If system is loaded, simple analysis is insufficient Need to use queuing models or simulation
38

Server Computers Applications are increasingly run on
servers Web search, office apps, virtual worlds,
… Requires large data center servers Multiple processors, networks
connections, massive storage Space and power constraints
Server equipment built for 19” racks Multiples of 1.75” (1U) high
39

Rack-Mounted Servers
Sun Fire x4150 1U server
40


