
Compatibility studies of hydrocortisone with excipients usingthermogravimetric analysis supported by multivariate statisticalanalysis
Barbara Rojek1 • Marek Wesolowski1
Received: 31 October 2015 / Accepted: 1 April 2016 / Published online: 13 April 2016
� The Author(s) 2016. This article is published with open access at Springerlink.com
Abstract Application of thermogravimetry (TG) alone to
study compatibility/incompatibility of active pharmaceuti-
cal ingredients (APIs) with excipients yields to misleading
results due to overlapping of the thermal stages in the course
of decomposition of both ingredients and their pharma-
ceutical mixtures. Hence, the purpose of this study was to
assess the usefulness of multivariate statistical analysis as a
supporting tool for interpretation of the TG traces during
assessing compatibility of hydrocortisone as an API with
selected excipients (mannitol, starch, lactose, methylcellu-
lose, b-cyclodextrin, meglumine, chitosan, magnesium
stearate and polyvinylpyrrolidone). The results show that
two multivariate techniques, principal component analysis
(PCA) and cluster analysis (CA), can be successfully used
for interpretation of TG traces, while the TG is used alone as
a screening technique to assess compatibility. The results
obtained by using TG analysis, supported by PCA and CA,
were approved by those of differential scanning calorime-
try, infrared spectroscopy and X-ray powder diffraction.
Incompatibilities were only found in mixtures of hydro-
cortisone with magnesium stearate and b-cyclodextrin.
Keywords Hydrocortisone � Compatibility/
incompatibility � Thermogravimetry � Multivariate
statistical analysis � Principal component analysis �Cluster analysis
Introduction
Preformulation stage of solid dosage formulations includes
detection of possible interactions of an active pharmaceu-
tical ingredient (API) with excipients [1–4]. Chemical
interactions result in reduction of API quantity in the for-
mulation that can lower its absorption and therapeutic
effect. Physical interactions can alter physicochemical
properties of the active ingredient, such as solubility, dis-
solution rate and finally bioavailability [5, 6]. There is no
universally accepted protocol in the literature or issued by
regulatory agencies for evaluating API–excipient compat-
ibility or interactions [7, 8]. Methods for robust charac-
terisation of API–excipient interactions are limited, time-
consuming and labour intensive due to the number of
variables that will need to be incorporated into the study,
e.g. isothermal stress testing (IST) or HPLC. Hence, for
compatibility tests the commonly recommended are tech-
niques of thermal analysis.
Thermogravimetry (TG) is one of the thermal methods
that has been used to detect compatibilities of API and
excipients [9]. This technique is commonly applied to the
study of thermal decomposition providing information on
thermal stability of pharmaceutical substances. However,
TG does not provide information on reactions that do not
involve mass change, such as polymorphic transformations
and double-decomposition reactions [10]. Moreover, it is
also useless for identification of a substance or a mixture of
substances unless temperature range of the reaction has
already been established and there are no interfering
reactions. In the case of identified substances, the TG by its
nature is a quantitative technique and can frequently be
used to quantify a substance in a mixture. Regardless of
that, to gain a complementary information about thermal
events, which have been associated with mass loss (e.g.
& Marek Wesolowski
1 Department of Analytical Chemistry, Medical University of
Gdansk, Gen. J. Hallera 107, 80-416 Gdansk, Poland
123
J Therm Anal Calorim (2017) 127:543–553
DOI 10.1007/s10973-016-5441-7

degradation) and those which have not (e.g. melting or
crystallisation), the TG traces are routinely registered
simultaneously with differential thermal analysis (DTA) or
differential scanning calorimetry (DSC) scans [11–13].
In the case of incompatibility study, TG allows a direct
comparison of thermal profiles of API and excipients with
those of their mixtures [9]. Unfortunately, these compar-
isons do not provide unequivocal data about compatibili-
ties, because crucial information that can be extracted from
the shape of TG traces is the change of mass (loss or gain)
during thermal decomposition and the temperature range
within which this process occurs. Hence, full information
about the character of thermal processes cannot be derived
from the TG traces and a plain detection of incompatibil-
ities of API with excipients can be misleading. Therefore,
whenever possible, other thermal techniques such as DSC
or DTA and non-thermal ones such as infrared spec-
troscopy (IR) and X-ray powder diffraction (XRPD) should
be used in conjunction with TG.
Taking all above into consideration, the purpose of this
study was to verify the usefulness of advanced multivariate
statistical analysis for interpretation of TG traces when the
TG is used alone as a screening technique for assessing
compatibility of hydrocortisone with some excipients. Pre-
liminary studies revealed that application of TG traces alone
to detect incompatibilities in the mixtures of hydrocortisone
with excipients yields misleading results due to overlapping
of the thermal stages in the course of decomposition of both
the ingredients and their mixtures. Hence, it is difficult to
observe changes in thermal profiles of binary mixtures as
compared to those of particular components this precluding
a straightforward identification of compatibility in the
pharmaceutical mixtures. Therefore, the techniques of
unsupervised multivariate statistical analysis such as prin-
cipal component analysis (PCA) and cluster analysis (CA)
were used as supporting tools for interpretation of the TG
traces during assessing incompatibility of hydrocortisone as
representative of APIs with excipients such as mannitol,
starch, lactose, methylcellulose, b-cyclodextrin, meglu-
mine, chitosan, magnesium stearate and polyvinylpyrroli-
done (PVP-30). The basis for multivariate calculations were
data sets including the temperatures of subsequent mass
losses obtained from TG traces of API, excipients and their
mixtures. These temperatures are called variables, and the
samples that have similar thermal characteristics will be
located near each other in multidimensional space forming
consistent group. Hence, these multivariate techniques
enable to understand the relationships between variables and
make it possible to discriminate or classify each sample.
This way, the compatibility/incompatibility between ingre-
dients is detected. Furthermore, to confirm the results
obtained by TG combined with PCA and CA, complemen-
tary techniques such as DSC, FTIR and XRPD were used.
It is worth mentioning that some attempts have recently
been made to use advanced statistical analysis for the
detection of pharmaceutical incompatibilities. For instance,
Pearson’s correlation coefficients (r) between the theoreti-
cal and experimental API–excipient FTIR spectra were
calculated [14–16]. The deviation from unity was inter-
preted as an indication of problems. To sum up, Pearson’s
correlation provided a more precise mathematical analysis
of the FTIR spectra of the samples analysed during the
compatibility study and could be considered as an auxiliary
tool for interpretation of chemical interactions. Moreover,
to improve the interpretation of the results extracted from
the FTIR spectra of samples before and after heating in a
DSC apparatus, PCA was also used [17]. After constructing
an optimal PCA model, the residues left by each sample
were evaluated. Samples located above the threshold line
show significant changes in their spectra after heating,
indicating latent incompatibilities. Because this strategy is
more reliable than a visual comparison, in this paper a
direct interpretation of the PCA scores scatter plot is pre-
sented as a simple, reliable and rapid tool for compatibility
detection based on the TG traces.
Experimental
Hydrocortisone and excipients
Hydrocortisone was supplied by Pharma Cosmetic (Kra-
kow, Poland). Starch and mannitol were obtained from
POCh (Gliwice, Poland). Methylcellulose was purchased
from the Shin-Etsu Chemical Co. (Tokyo, Japan), while
lactose was supplied by BUFA BV (Uitgeest, The
Netherlands). Chitosan, meglumine, b-Cyclodextrin and
polyvinylpyrrolidone (PVP-30) were provided by Fluka
(Siegen, Germany), whereas magnesium stearate was pur-
chased from Faci (Carasco Genoa, Italy). All materials
used in this study were of pharmacopoeial purity and were
used as obtained.
Thermal methods
TG and DTG traces of the API, excipients and their mix-
tures were recorded using of a model OD-103 derivato-
graph (MOM, Budapest, Hungary) over the range between
25 and 700 �C. 200-mg samples placed in four flat-bot-
tomed platinum pans were heated in air at a rate of
5 �C min-1. Alumina was used as a reference material.
DSC scans were performed using a heat-flux Mettler
Toledo instrument (Model DSC 822e, Schwerzenbach,
Switzerland) with samples of approximately 5 mg weighed
into flat-bottomed aluminium pans. Scans were obtained at
a rate of 10 �C min-1 in the range from 20 to 350 �C,
544 B. Rojek, M. Wesolowski
123

using nitrogen as a purging gas at a flow rate of
70 mL min-1. A STARe software was used for the DSC
scans analysis.
Infrared spectroscopy
IR spectra were recorded using a Carl Zeiss Jena instru-
ment (Specord, Model M-80, Jena, Germany) using
potassium bromide pellets, at room temperature in the
range of 4000–200 cm-1. The ambient atmosphere was a
background. Spectra Manager software was used for
interpretation of the IR spectra.
X-ray powder diffraction
XRPD patterns were obtained using a D2 Phaser equipment
(Bruker, Karlsruhe, Germany). A CuKa tube (k =
0.154060 nm), current of 10 mA and voltage of 30 kV
were used. The samples were analysed under an exposure
time of 0.10 s using a step size of 0.02� over the diffraction
angle range 7–55� (2h). The diffraction patterns were
plotted using Diffrac.suite software.
Multivariate analysis
Statistica 10 software (StatSoft Inc., Tulsa, OK, USA) was
used for PCA and CA calculations. Matrix of the data with
dimensions of 7 9 8, where 7 is the number of rows (ob-
jects) and 8 is the number of columns (variables), was the
starting point for calculations. In the matrix, the thermal
parameters obtained from the TG and DTG traces for the
analysed samples were used as the columns. The rows were
API and excipients alone and their physical mixtures.
Results and discussion
TG traces of hydrocortisone, selected excipients (chitosan
and magnesium stearate) and binary physical mixtures of
both ingredients at different molar or mass ratios are pre-
sented in Figs. 1 and 2. A detailed examination of the
shapes of TG traces and temperature ranges over which the
stages of thermal decomposition occurred showed that the
TG technique did not provide unequivocal data in the case
of compatibility study between hydrocortisone and selected
excipients. These findings are consistent with those of
Mendonca et al. [9], who studied compatibility/incompat-
ibility in the mixtures of hydroquinone and retinoic acid
with nine excipients. They confirmed that if no interactions
occur, the TG trace of the mixture presents behaviour of
both ingredients individually. On the other hand, different
TG profiles of the mixture from those observed for indi-
vidual ingredients arouse suspicion that this indicates
interactions. To eliminate subjectivity in evaluation of
acquired TG traces, two techniques of unsupervised mul-
tivariate statistical analysis (PCA and CA) were used to
support interpretation of TG profiles.
PCA and CA as supporting techniques
The aim of PCA is data matrix reduction when some cor-
relations between the variables exist. In this way, new
Mas
s/%
DT
G/%
°C
–1
Temperature/°C0 200 400 600
20%
DTG
TG
a
b
c
d
e
f
g
a
b
c
d
e
f
g
A
B
Fig. 1 TG and DTG traces of: (a) hydrocortisone, (g) chitosan at
drug/excipient ratios: (b) 9:1, (c) 7:3, (d) 1:1, (e) 3:7, (f) 1:9
Compatibility studies of hydrocortisone with excipients using thermogravimetric analysis… 545
123

variables called principal components (PCs) are created
which are linear combinations of the original variables
[18]. The principal components are orthogonal (uncorre-
lated, independent) to each other and describe the variation
in data matrix, among which the first principal component
(PC1) accounts for most of the variation in the data set, the
second (PC2) accounts for the next largest variation and so
on. The variation in the data for nine matrices constructed
for API and excipients used in this study are compiled in
Table 1. As it can be seen, the results of PCA calculations
are best visualised in a two-dimensional scores scatter plot,
PC1 and PC2, in which both ingredients and their mixtures
create distinctly separated clusters. CA, another unsuper-
vised technique of multivariate statistical analysis, was
performed as a continuation of PCA to assess whether
using different classification algorithm, a more sensitive
classification of both ingredients and their mixtures can be
expected. This technique evaluates the clustering tendency
of samples through iterative process which associates the
samples (agglomerative method) taking into account the
Euclidean distance between pairs of samples and the
Ward’s linkage criterion according to which samples or
clusters are merged. The graphical visualisation of the
samples’ classification is presented as a tree diagram.
Results of PCA and CA calculations are presented
graphically in Figs. 3 and 4 and summarised in Table 2. To
detect the compatibility of hydrocortisone with the excip-
ients, a scattering of clusters in a plot of PC1 and PC2 was
taken into consideration. Should not any interaction had
occurred between the ingredients the PCA plot in Fig. 3a
might have shown two distinctly separated clusters to be
formed, the first located at the lowest values of PC1
including chitosan and a mixture with its high content,
whereas the other located at the highest values of PC1
including hydrocortisone and the remaining mixtures,
mostly with a high content of API. Distribution of all
samples (API and the excipient alone and their mixtures)
along the PC1 axis begins from the first ingredient alone
found at the lowest value of PC1, through the mixtures with
gradually diminishing quantities of the first ingredient and
increasing content of the other, until the latter located close
to the highest values of PC1 indicates that hydrocortisone
and chitosan are compatible, i.e. between these ingredients
no interaction occurs.
Similar scattering of the clusters was also observed in
the case of mixtures of hydrocortisone with meglumine,
PVP-30, lactose, starch, methylcellulose and mannitol.
Three clusters were formed in each case. The first cluster is
created by excipient alone (meglumine and PVP-30) or
excipient and mixture(s) with the highest content of
excipient (mixture in the 1:9 ratio or the 1:9 and 3:7
mixtures. Another cluster consisted mostly of mixtures of
both ingredients in the ratios of 3:7, 1:1 and 7:3. The last
cluster includes hydrocortisone alone or hydrocortisone
and mixtures with the highest content of API in the 9:1
ratio. Such a distribution of the sample scattering in the
PC1 and PC2 plots shows that the ingredients are com-
patible and can be blended for pharmaceutical applications.
PCA scores scatter plot differs from the above scheme in
the case of incompatibilities between ingredients. The
Mas
s/%
DT
G/%
°C
–1
Tempearature/°C
0 200 400 600
20 %
DTG
TG
a
b
c
d
e
f
g
a
b
c
d
e
f
g
A
B
Fig. 2 TG and DTG traces of: (a) hydrocortisone, (g) magnesium
stearate and their mixtures at drug/excipient ratios: (b) 9:1, (c) 7:3,
(d) 1:1, (e) 3:7, (f) 1:9
546 B. Rojek, M. Wesolowski
123

Table 1 Variation in the data and eigenvalues for nine matrices constructed for binary physical mixtures of hydrocortisone with excipients
Matrices Excipients Principal components
PC1 PC2 PC3
Variance/% Eigenvalue Variance/%
(cumulative variance /%)
Eigenvalue Variance/%
(cumulative variance /%)
Eigenvalue
1. Mannitol 55.2 4.4 29.8 (85.0) 2.4 10.7 (95.8) 0.9
2. Lactose 82.3 6.6 11.2 (93.5) 0.9 4.4 (97.9) 0.3
3. Starch 77.2 6.2 14.2 (91.4) 1.1 5.8 (97.3) 0.5
4. Methylcellulose 78.7 6.3 15.2 (93.9) 1.2 4.2 (98.2) 0.3
5. b-cyclodextrin 77.2 6.2 14.4 (91.7) 1.2 5.2 (96.9) 0.4
6. Meglumine 56.7 4.5 36.7 (93.5) 2.9 5.3 (98.8) 0.4
7. Chitosan 76.8 6.1 16.7 (93.5) 1.3 4.3 (97.8) 0.3
8. PVP-30 54.7 4.4 29.1 (83.8) 2.3 8.1 (91.9) 0.6
9. Magnesium stearate 71.2 5.7 13.9 (85.2) 1.1 8.9 (94.0) 0.7
PC1 (76.8 %)
PC
2 (1
6.7
%)
2.5
1.5
0.5
–0.5
–1.6 –1.2 –0.8 –0.4 0.0 0.4 0.8 1.2
Ch1:9
Hy
3:71:1
7:3
9:1
120
100
80
60
40
20
0Ch 1:9 3:7 1:1 7:3 9:1 Hy
A
B
Fig. 3 a PCA score biplot for the first two principal components and
b CA tree diagram for hydrocortisone (Hy), chitosan (Ch) and their
mixtures at drug/excipient ratios: 9:1, 7:3, 1:1, 3:7, 1:9
PC
2 (1
3.9
%)
PC1 (71.2 %)
1.5
0.5
–0.5
–1.5
–1.6 –1.2 –0.8 –0.4 0.0 0.4 0.8 1.2
St
1:9
1:1 7:39:1
3:7
Hy
120
100
80
60
40
20
0St 1:9 1:1 7:3 3:7 9:1 Hy
A
B
Fig. 4 a PCA score biplot for the first two principal components and
b CA tree diagram for hydrocortisone (Hy), magnesium stearate (St)
and their mixtures at drug/excipient ratios: 9:1, 7:3, 1:1, 3:7, 1:9
Compatibility studies of hydrocortisone with excipients using thermogravimetric analysis… 547
123

samples are not distributed along the PC1 axis according to
their chemical composition, i.e. the content of the first
ingredient decreases with increasing quantities of the other,
but create separate clusters composed of mixtures with a
quite different content of both ingredients. This is shown in
Fig. 4a where hydrocortisone is incompatible with mag-
nesium stearate. In this case, the first cluster includes
magnesium stearate and its 1:9 mixture with hydrocorti-
sone. The other cluster consists of the 1:1 mixture of both
ingredients, while the third one is created by hydrocorti-
sone and mixtures with the API/excipient ratios of 9:1, 7:3
and 3:7. Incompatibility of hydrocortisone with b-cy-
clodextrin was also detected with the aid of PCA. This
enabled to create three separated clusters—one corre-
sponding to the 9:1 of hydrocortisone and b-cyclodextrin
mixture, the second one formed by b-cyclodextrin and its
two 1:9 and 3:7 mixtures with hydrocortisone. The third
cluster comprises two mixtures of both ingredients in the
7:3 and 1:1 ratios of API to excipient.
Results of calculations obtained by using of CA shows
that if ingredients are compatible, two large clusters are
created between 33 and 66 % of the maximum distance.
This is reflected by the CA tree diagram in Fig. 3b. The
first cluster groups chitosan and its mixture with a high
chitosan content, while another cluster consists of hydro-
cortisone and mixtures with its high content, with the API-
to-excipient ratios 9:1, 7:3, 1:1 and 3:7. This is compatible
with the results of PCA (Fig. 3a). Similar organisation of
the clusters is also observed in the CA tree diagrams of
binary mixtures of hydrocortisone with mannitol and lac-
tose; excipient and the 1:9 API/excipient mixture create the
first cluster, while the remaining mixtures and hydrocorti-
sone form the second cluster. CA calculations for mixtures
of API with meglumine and PVP-30 show that first cluster
contains additionally a hydrocortisone/excipient 3:7 mix-
ture. In the case of mixtures of hydrocortisone with
methylcellulose and starch, the first group consists of
hydrocortisone and the API/excipient 9:1 mixture, the
second group—excipient and the remaining mixtures. Such
an organisation of clusters indicates a close similarity of
the TG profiles of the mixtures to those of the main
ingredient (API or excipient), thus excluding chemical or
physical interactions.
A comparison of the CA tree diagrams of mixtures of
compatible ingredients with those of hydrocortisone with
magnesium stearate and b-cyclodextrin shows different
organisation of the cluster. Similarly as in the PCA for
mixtures of incompatible ingredients, the clusters do not
consist of all samples with similar chemical composition,
but those with quite different composition. As shown in
Fig. 4b, between 33 and 66 % of the maximum distance
there are three clusters of mixtures of hydrocortisone with
magnesium stearate. A mixture with the 3:7 of API/ex-
cipient ratio was found in the second cluster even though
its chemical composition is similar to that of the 1:9
mixture and magnesium stearate which create the first
cluster. A similar grouping shows the CA tree diagram of
mixtures of hydrocortisone with b-cyclodextrin. The first
cluster includes b-cyclodextrin and three mixtures with
quite different composition in the API/b-cyclodextrin
ratios of 1:9, 3:7 and 9:1. The second cluster is formed by
the remaining mixtures, while the third cluster consists of
hydrocortisone alone. This shows that hydrocortisone is
incompatible also with b-cyclodextrin.
Those results indicate that PCA and CA are helpful as
tools for interpretation of the TG traces. A correlation
between chemical composition of samples and their ther-
mal profiles is highlighted by clustering, thus removing
subjectivity of the observations. It can thus be concluded
that b-cyclodextrin and magnesium stearate are incom-
patible with hydrocortisone. Hydrocortisone has been
found to form an inclusion complex with b-cyclodextrin
[19–22]. Incompatibility of hydrocortisone with magne-
sium stearate is probably due to interaction of the –OH
group of hydrocortisone with the bridging carboxylic group
of magnesium stearate via hydrogen bonding involving
water, similarly as in the case of captopril and magnesium
stearate. The literature data show that there are numerous
reports on incompatibility of stearates with active phar-
maceutical ingredients [6].
DSC, IR and XRDP for verification of results
To verify the results obtained using TG supported by
multivariate techniques, DSC scans, IR spectra and XRPD
diffraction patterns were recorded for API, excipients and
all of the mixtures of both components. In contrast to TG
traces, the DSC scans were only acquired in the range from
20 to 350 �C because in that range an appearance or dis-
appearance of one or more peaks in DSC profile of drug
Table 2 Results obtained by using multivariate statistical techniques
as supporting tools for interpretation of the TG curves of mixtures
with hydrocortisone
Matrices Excipients PCA CA
1. Mannitol ? ?
2. Lactose ? ?
3. Starch ? ?
4. Methylcellulose ? ?
5. b-cyclodextrin - -
6. Meglumine ? ?
7. Chitosan ? ?
8. PVP-30 ? ?
9. Magnesium stearate - -
?, Compatibility; -, incompatibility
548 B. Rojek, M. Wesolowski
123

mixture with excipient, and a broadening and a shift
towards lower temperature of the endothermic DSC peak
of API owing to the melting, can be considered as an
interaction indication. DSC scans (Figs. 5a, 6a, 7a) show
endothermic peaks due to the melting of hydrocortisone at
about 226.0 �C (melting with decomposition). Chitosan
(Fig. 5g) shows broader endothermic peaks at 100.6 �C(dehydration) and 275.9 �C (glass transition) followed by
exothermic peak at 305.1 �C (decomposition). DSC scans
of the mixtures of hydrocortisone with chitosan show a
DSC peak of hydrocortisone slightly shifted to a lower
temperature (about 222 �C). This shows that there are no
Hea
t flo
w/m
W^Exo
Temperature/°C40 80 120 160 200 240 280 320
a
b
c
d
e
f
g
Fig. 5 DSC scans of:
(a) hydrocortisone, (g) chitosan
and their mixtures at drug/
excipient ratios: (b) 9:1, (c) 7:3,
(d) 1:1, (e) 3:7, (f) 1:9
Hea
t flo
w/m
W
^Exo
Tempearture/°C40 80 120 160 200 240 280
a
b
c
d
e
f
g
Fig. 6 DSC scans of: (a) hydrocortisone, (g) magnesium stearate and their mixtures at drug/excipient ratios: (b) 9:1, (c) 7:3, (d) 1:1, (e) 3:7,
(f) 1:9
Compatibility studies of hydrocortisone with excipients using thermogravimetric analysis… 549
123

alterations in the thermal profile of hydrocortisone. Mag-
nesium stearate (Fig. 6g) shows an endothermic peak due
to the melting at 102.99 �C. In the DSC scans of the
mixtures of hydrocortisone with magnesium stearate, a
characteristic peak of hydrocortisone (melting at 226.0 �C)
is missing. This result suggests that hydrocortisone and
magnesium stearate are incompatible.
Particular attention should be paid to the DSC scans of
hydrocortisone mixtures with lactose (Fig. 7). Disappear-
ance of the DSC peak (Fig. 7b) due to the melting of API
suggests incompatibility of both ingredients. On the other
hand, no variations confirming chemical interactions were
found in the IR spectra and XRPD diffraction patterns of
these mixtures. A detailed inspection of the thermal events
due to the melting of hydrocortisone (216 �C [23], 214 �C[24] or 221.5 �C [25]) and of anhydrous a-lactose (222.8 �C[26], 223 �C [27–29]) suggests that both endothermic peaks
are superimposed excluding incompatibility.
The IR spectra of hydrocortisone, excipients and their
mixtures are shown in Figs. 8 and 9. Inspection of these
spectra shows that characteristic bands of ingredients alone are
consistent with those reported in the literature [30–34]. There
are characteristic bands of hydrocortisone due to stretching
vibrations of the O–H groups, C–H bonds, C=O groups and C–
OH bonds over the ranges 3650–3100, 3100–2800,
1850–1540 and 1260–1000 cm-1, respectively. The spectrum
of chitosan (Fig. 8g) displays bands for stretching vibrations
of O–H and N–H, C–H and C–OH bonds over the ranges
3600–3000, 3000–2850 and 1260–1050 cm-1, respectively.
The bending vibrations of N–H bonds of this excipient
emerged over the range 1650–1580 cm-1, while deformation
vibrations of C–OH and C–CH bonds were found over the
range of 950–700 cm-1. All of these characteristic bands of
API and the excipient were found in the IR spectra of binary
Hea
t flo
w/m
W
Temperature/°C
^Exo
40 80 120 160 200 240 280
a
b
c
d
e
f
g
Fig. 7 DSC scans of:
(a) hydrocortisone, (g) lactose
and their mixtures at drug/
excipient ratios: (b) 9:1, (c) 7:3,
(d) 1:1, (e) 3:7, (f) 1:9
Tra
nsm
ittan
ce/%
Wavenumber/cm–1
3700 2700 1700 700
a
b
c
d
e
f
g
Fig. 8 IR spectra of: (a) hydrocortisone, (g) chitosan and their
mixtures at drug/excipient ratios: (b) 9:1, (c) 7:3, (d) 1:1, (e) 3:7,
(f) 1:9
550 B. Rojek, M. Wesolowski
123
mixtures of both ingredients with intensities proportional to
the quantity of ingredients in the mixtures. This indicates the
absence of any chemical interactions between hydrocortisone
and chitosan.
The IR spectrum of magnesium stearate (Fig. 9g) shows
stretching vibrations of O-Mg, C–H and C=O bonds over
the ranges 3650–3100, 3000–2840 and 1650–1550 and
1400 cm-1, respectively as well as bending vibrations of
C–H bonds at 1450–1375 cm-1. The IR spectra of hydro-
cortisone mixtures with magnesium stearate display vari-
ations in the intensity of some characteristic bands of API
over the range 1850–1700 cm-1 (stretching bands of C=O)
and 1300–1000 cm-1 (stretching bands of C–OH), which
are non-related to the API quantity in the mixtures. These
changes imply that both ingredients are incompatible.
The results obtained using TG, supported by multivari-
ate statistical analysis, were subsequently approved by
Tra
nsm
ittan
ce/%
Wavenumber/cm–1
3700 2700 1700 700
a
c
d
e
f
g
Fig. 9 IR spectra of: (a) hydrocortisone, (g) magnesium stearate and
their mixtures at drug/excipient ratios: (b) 9:1, (c) 7:3, (d) 1:1, (e) 3:7,
(f) 1:9
Inte
nsity
/a.u
.2θ/°
7 17 27 37 47 57
a
b
c
d
e
f
g
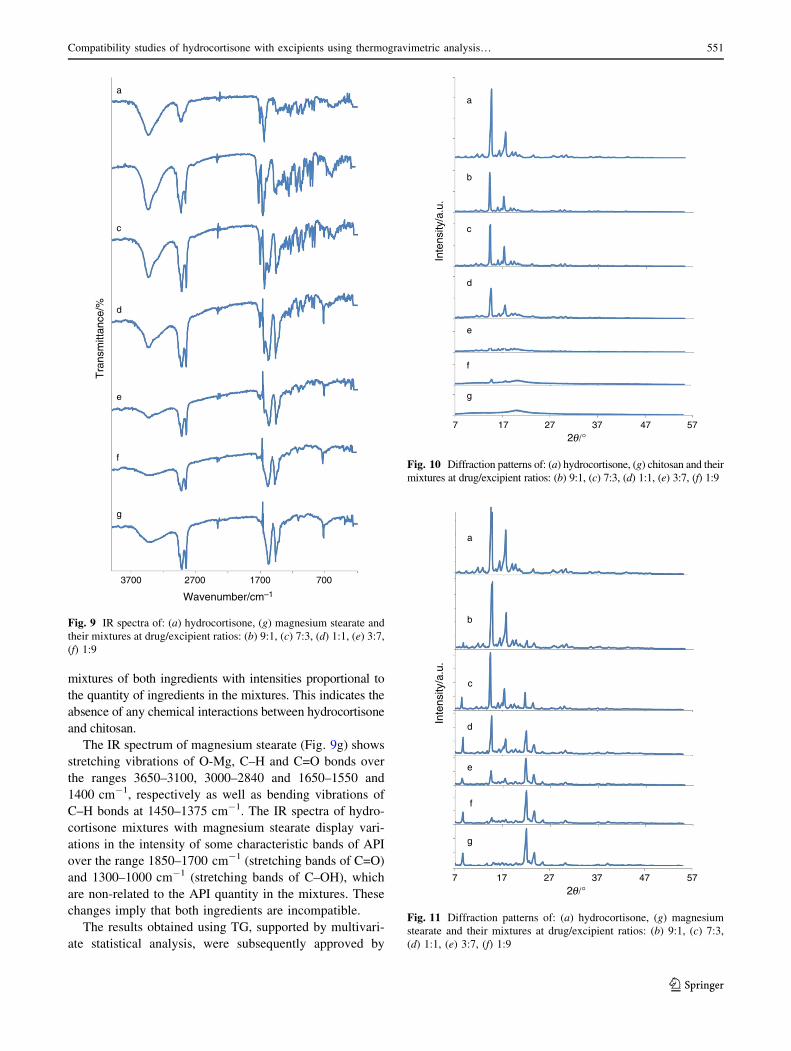
Fig. 10 Diffraction patterns of: (a) hydrocortisone, (g) chitosan and their
mixtures at drug/excipient ratios: (b) 9:1, (c) 7:3, (d) 1:1, (e) 3:7, (f) 1:9
Inte
nsity
/a.u
.
2θ/°7 17 27 37 47 57
a
b
c
d
e
f
g
Fig. 11 Diffraction patterns of: (a) hydrocortisone, (g) magnesium
stearate and their mixtures at drug/excipient ratios: (b) 9:1, (c) 7:3,
(d) 1:1, (e) 3:7, (f) 1:9
Compatibility studies of hydrocortisone with excipients using thermogravimetric analysis… 551
123

XRPD. The diffraction patterns of hydrocortisone mixtures
with chitosan and magnesium stearate (Figs. 10, 11) show
all characteristic peaks similar to those of particular
ingredients.
Conclusions
The results of this study show that the techniques of
advanced multivariate statistical analysis, such as PCA and
CA, can successfully be used for interpretation of TG tra-
ces, while the TG can be used alone as a screening tech-
nique to assess compatibility/incompatibility of the
ingredients of pharmaceutical mixtures consisting of
selected excipients, such as mannitol, starch, lactose,
methylcellulose, b-cyclodextrin, meglumine, chitosan,
magnesium stearate and PVP-30. A correlation between
chemical composition of binary mixtures and their TG
profiles is highlighted by clustering, thus removing sub-
jectivity of the observations. Graphical interpretation of the
PCA calculations shows that scattering of analysed samples
in two-dimensional plane defined by PC1 and PC2 displays
if there is compatibility/incompatibility between drug and
excipient. The creation of two separate areas where one
groups API and its mixtures with high API’s content, and
the other, excipient and its mixtures with high excipient’s
content, indicates compatibility between ingredients.
Otherwise, incompatibility can be expected. A comparison
of the CA tree diagrams with those of the PCA score
biplots shows that the results obtained using both multi-
variate approaches are consistent. In conclusion, both PCA
and CA make much of contribution to interpretation of the
TG profiles of hydrocortisone binary mixtures with selec-
ted excipients. These findings can be very useful for pre-
formulation study to develop the stable, effective and safe
solid dosage formulations by establishing API compati-
bility with the other ingredients. The results obtained by
using TG, supported by PCA and CA, were also approved
by the DSC, IR and XRPD analyses of the same hydro-
cortisone binary physical mixtures with those excipients.
Incompatibilities were only found in the case of API
mixtures with magnesium stearate and b-cyclodextrin.
Acknowledgements The investigations were financially supported
by a statutory research, Grant No. ST-15, from the Ministry of Sci-
ence and Higher Education, Poland.
Open Access This article is distributed under the terms of the
Creative Commons Attribution 4.0 International License (http://crea
tivecommons.org/licenses/by/4.0/), which permits unrestricted use,
distribution, and reproduction in any medium, provided you give
appropriate credit to the original author(s) and the source, provide a
link to the Creative Commons license, and indicate if changes were
made.
References
1. Fulias A, Ledeti I, Vlase G, Popoiu C, Heghes A, Bilanin M,
Vlase T, Gheorgheosu D, Craina M, Ardelean S, Ferechide D,
Marginean O, Mos L. Thermal behaviour of procaine and ben-
zocaine. Part II: compatibility study with some pharmaceutical
excipients used in solid dosage forms. Chem Central. 2013;7:
1–10.
2. Stulzer HK, Rodrigues PO, Cardoso TM, Matos JSR, Silva MAS.
Compatibility studies between captopril and pharmaceutical
excipients used in tablets formulations. J Therm Anal Calorim.
2008;91:323–8.
3. Sousa e Silva JP, Sousa Lobo JM. Compatibility studies between
nebicapone, a novel COMT inhibitor, and excipients using
stepwise isothermal high sensitivity DSC method. J Therm Anal
Calorim. 2010;102:317–21.
4. Nunes RS, Semaan FS, Riga AT, Cavalheiro ETG. Thermal
behavior of verapamil hydrochloride and its association with
excipients. J Therm Anal Calorim. 2009;97:349–53.
5. Aigner Z, Heinrich R, Sipos E, Farkas G, Ciurba A, Berkesi O,
Szabo-Revesz P. Compatibility studies of aceclofenac with retard
tablet excipients by means of thermal and FT-IR spectroscopic
methods. J Therm Anal Calorim. 2011;104:265–71.
6. Bharate SS, Bharate SB, Bajaj AN. Interactions and incompati-
bilities of pharmaceutical excipients with active pharmaceutical
ingredients: a comprehensive review. J Excip Food Chem.
2010;1:3–26.
7. Adeyeye MCh, Brittain HG, editors. Preformulation in solid
dosage form development. New York: Informa, Healthcare; 2008.
8. Verma RK, Garg S. Selection of excipients for extended release
formulations of glipizide through drug-excipient compatibility
testing. J Pharm Biomed Anal. 2005;38:633–44.
9. Mendonca CMS, de Barros Lima IP, Aragao CFS, Gomes APB. Ther-
mal compatibility between hydroquinone and retinoic acid in pharma-
ceutical formulations. J Therm Anal Calorim. 2014;115:2277–85.
10. Kaufmann EN. Characterization of materials. Hoboken: Wiley;
2003.
11. Haines PJ. Thermal methods of analysis. Principles, applications
and problems. Dordrecht: Springer; 1995.
12. Haines PJ. Principles of thermal analysis and calorimetry. Cam-
bridge: The Royal Society of Chemistry; 2002.
13. Craig DQM, Reading M. Thermal analysis of pharmaceuticals.
Boca Raton: Taylor & Francis Group; 2007.
14. de BarrosLima IP, Lima NGPB, Barros DMC, Oliveira TS,
Mendonca CMS, Barbosa EG, Raffin FN, de Lima e Moura TFA,
Gomes APB, Ferrari M, Aragao CFS. Compatibility study
between hydroquinone and the excipients used in semi-solid
pharmaceutical forms by thermal and non-thermal techniques.
J Therm Anal Calorim. 2015;120:719–32.
15. de Barros Lima IP, Lima NGPB, Barros DMC, Oliveira TS,
Barbosa EG, Gomes APB, Ferrari M, do Nascimento TG, Aragao
CFS. Compatibility study of tretinoin with several pharmaceuti-
cal excipients by thermal and non-thermal techniques. J Therm
Anal Calorim. 2015;120:733–47.
16. Lavor EP, Navarro MVM, Freire FD, Aragao CFS, Raffin FN,
Barbosa EG, Moura TFAL. Application of thermal analysis to the
study of antituberculosis drugs-excipient compatibility. J Therm
Anal Calorim. 2014;115:2303–9.
17. Daniel JSP, Veronez IP, Rodrigues LL, Trevisan MG, Garcia JS.
Risperidone-solid-state characterization and pharmaceutical
compatibility using thermal and non-thermal techniques. Ther-
mochim Acta. 2013;568:148–55.
18. Otto M. Chemometrics: statistics and computer application in
analytical chemistry. 2nd ed. Weinheim: Wiley-VCH; 2007.
552 B. Rojek, M. Wesolowski
123

19. Swarbrick J. Encyclopedia of pharmaceutical technology. 3rd ed.
New York: Informa Healthcare; 2007. p. 671–96.
20. Al-Sou’od KA. Investigation of the hydrocortisone-b-cyclodex-
trin complex by phase solubility method: some theoretical and
practical considerations. J Sol Chem. 2008;37:119–33.
21. Forgo P, Gondos G. A study of b-cyclodextrin inclusion complex
with progesterone and hydrocortisone using rotating frame
overhauser spectroscopy. Monat Chem. 2002;133:101–6.
22. Miranda JC, Martins TEA, Veiga F, Ferraz HG. Cyclodextrins
and ternary complexes: technology to improve solubility of
poorly soluble drugs. Braz J Pharm Sci. 2011;47:665–81.
23. Polish Pharmacopoeia VI. Warszawa: Polskie Towarzystwo
Farmaceutyczne; 2002.
24. Lund W. The pharmaceutical codex. 12th ed. London: The
pharmaceutical Press; 2004.
25. Brittain H. Profiles of drug substances, excipients and related
methodology. Vol. 12. Analytical profiles of drug substances, vol.
12. New York: The American Pharmaceutical Association,
Academic Press; 1983.
26. Kibbe H. Handbook of pharmaceutical excipients. 3rd ed. Lon-
don: American Pharmaceutical Association, Pharmaceutical
Press; 2000.
27. Rowe RC, Sheskey PJ, Quinn ME. Handbook of pharmaceutical
excipients. 6th ed. London: American Pharmaceutical Associa-
tion, Pharmaceutical Press; 2009.
28. Holsinger VH. Lactose. In: Wong NP, Jenness R, Keeney M,
Marth EH, editors. Fundamentals of dairy chemistry. New York:
Van Nostrard Reinhold; 1988. p. 279–342.
29. Figura LO, Epple M. Anhydrous a-lactose: a study with DSC and
TXRD. J Therm Anal. 1995;44:45–53.
30. Yazdi MT, Arabi H, Faramarzi MA, Ghasemi Y, Amini M,
Shokravi S, Mohseni FA. Biotransformation of hydrocortisone by
a natural isolate of Nostoc muscorum. Phytochemistry.
2004;65:2205–9.
31. Jia Z, Shen D, Xu W. Synthesis and antibacterial activities of
quaternary ammonium salt of chitosan. Carbohydr Res.
2001;333:1–6.
32. Ko YG, Sung BH, Choi US. Electrorheological properties of
aminated chitosans. Colloids Surf A. 2007;305:120–5.
33. Stulzer HK, Tagliari MP, Cruz AP, Silva MAS, Laranjeira MCM.
Compatibility studies between piroxicam and pharmaceutical
excipients used in solid dosage forms. Pharm Chem J.
2008;42:215–9.
34. Silverstein RM, Webster FX, Kiemle DJ. Spectrometric identi-
fication of organic compounds. 7th ed. Hoboken: Wiley; 2005.
Compatibility studies of hydrocortisone with excipients using thermogravimetric analysis… 553
123


