36 Mehul Soni, Anand Laddha, Harshitkumar Chudiwal, O. K. Mahadwad
International Journal of Engineering Technology Science and Research
IJETSR
www.ijetsr.com
ISSN 2394 – 3386
Volume 2 Issue 5
May 2015
Comparison of a Fluidized Bed Dryer with Conventional
Dryers Used in Food Processing Industries
Mehul Soni1, Anand Laddha
2, Harshitkumar Chudiwal
3, O. K. Mahadwad
4
Department of Chemical Engineering
MGM’s Jawaharlal Nehru Engineering College, Aurangabad-431003
ABSTRACT
In the rapidly developing food sector, food processing industries in India are picking up pace. This
has led to development of technologies, processes and equipments which not only reduce time but
also increase the output. There is particular interest in drying operation as it takes up long periods of
time and on the other hand, is of extreme importance. Hence, the proposed work is an attempt
towards encouraging use of fluidized bed dryer over dryers used conventionally in food processing
industries.
Drying of wheat, millet and oats is carried out in a lab-scale fluidized bed dryer designed to study its
performance. The comparison is done with fixed bed dryer and tray dryer which have commonly
been employed. The fluidized bed dryer is operated at room temperature in bubbling fluidization
regime. The results obtained show that the drying time and the rate of drying reduced by 8 to 10
times when fluidized bed dryer was used as compared to tray dryer.
Keywords: Fluidized Bed Dryer, Food Processing, Drying Time, Rate of Drying
1. INTRODUCTION
Fluidized beds have characteristic properties that are extremely advantageousand have therefore
found extensive application in traditional industries, as well as in metallurgical processes and in the
manufacturing, chemical and pharmaceutical industries. For the very same characteristic properties
that have made fluidized beds a practical and attractive option in these cases can be used in designing
novel processes, although always with new issues to be addressed [1][2]. Fluidized beds are one of
the preferred modes of contact between gas-solid, gas-liquid and gas-liquid-solid operations in
industries with the application ranging from simple adsorbers, wastewater systems to complex
reactors. These fluidized bed technologies have found increasing application in the drying operations
of agricultural material although they are widely used in industries for drying of fertilizers,
chemicals, pharmaceuticals and minerals. The increasing application of fluidized bed drying for
agricultural materials is due to the evolving designs of fluidized bed for fluidization of coarse
material, which is rather difficult to fluidize. Fluidized beds, as compared to other modes of drying,
offer advantages such as high heat capacity of the bed, improved rates of heat and mass transfer
between the phases, and ease in handling and transport of fluidized solids [3].
1.1 Objectives:
1. To reduce moisture content in food items.
2. To increase and multiply the amount of food items being processed in a given span of time.
3. Attain uniform drying throughout.
37 Mehul Soni, Anand Laddha, Harshitkumar Chudiwal, O. K. Mahadwad
International Journal of Engineering Technology Science and Research
IJETSR
www.ijetsr.com
ISSN 2394 – 3386
Volume 2 Issue 5
May 2015
4. Design a lab scale fluidized bed dryer and compare its performance with the conventional dryers
used in the food industries.
2. LITERATURE SURVEY
The fluidization technology is commonly used in drying agro-food materials & other materials. It is
also used in freezing systems. Fluid bed drying has been recognized as a gentle, uniform drying
method capable of drying down to very low moisture content with a high degree of efficiency
[4].This process is characterized by high moisture and heat transfer rates and excellent thermal
control capacity compared to conventional drying process [5]. It is also a very convenient method for
drying heatsensitive food materials as it prevents them from overheating due to mixing [6]. A
complex transport phenomenon takes place during drying process including unsteady state heat and
mass transfer which occur simultaneously [7][8].Heat necessary for evaporation is supplied to the
particles and moisture vapour is removed from the material into the drying medium. Heat is
transported by convection from the surrounding to the particle surfaces and then by conduction from
there into the inside of particles. Moisture is transported in the opposite direction as a liquid or
vapour on the surface evaporates and passes on to the surroundings by convection [9].The heat and
moisture transfer rates are related to drying air temperature and Reynolds number as a function of
velocity of circulating air. The developments of the regime of fluidization and subsequent design
modifications have made fluidized bed drying a desirable choice among other driers. However the
efficiency of the conventional drying system is usually low. It is therefore desirable to improve the
efficiency of the drying process. Drying process has usually three typical drying rate periods [10]
namely pre-warming period, constant rate and falling rate period. The diffusion controls the drying
process especially in the falling rate period [11]. Tanfara et al. [12] studied the effect of particle size
distribution on local voidage in a bench-scale conical fluidized bed dryer containing dried placebo
pharmaceutical granule.
3. METHODOLOGY
3.1 Phase I - Designing
The parameters for the dryer that were finalized were as follows:
a. Food Items Chosen for Drying: Wheat, Millet and Oats
b. Shell Diameter Chosen: 100mm i.d., 5mm thickness
c. Shell Height: 2 ft.
d. 100mesh screen used.
The equations used are [13]:
1. Pressure Drop across the Bed:
∆𝒑𝒃 = 𝟏 − 𝜺𝒎𝒇 𝝆𝒔 − 𝝆𝒈 . 𝒈. 𝑳𝒎𝒇 … (3.1)
2. Minimum Fluidization Velocity:
38 Mehul Soni, Anand Laddha, Harshitkumar Chudiwal, O. K. Mahadwad
International Journal of Engineering Technology Science and Research
IJETSR
www.ijetsr.com
ISSN 2394 – 3386
Volume 2 Issue 5
May 2015
3. 𝒖𝒎𝒇𝟐 =
𝒅𝒑 𝝆𝒔−𝝆𝒈 .𝒈
𝟏.𝟕𝟓𝝆𝒈. 𝜺𝒎𝒇
𝟐 . ∅𝒔 … (3.2)
Check for: (𝑅𝑒𝑝 ,𝑚𝑓 > 1000) 𝑤𝑒𝑟𝑒, 𝑅𝑒𝑝 ,𝑚𝑓 =𝑑𝑝 .𝑢𝑚𝑓 .𝜌𝑔
𝜇
4. Terminal Fluidization Velocity (Haider & Levenspeil’s Equations):
𝒖𝒕 = 𝒖𝒕∗
𝝁. 𝝆𝒔−𝝆𝒈 .𝒈
𝝆𝒈𝟐
𝟏𝟑
… (3.3)
Where,
𝒖𝒕∗ =
𝟏𝟖
𝒅𝒑∗
𝟐 +𝟐.𝟑𝟑𝟓−𝟏.𝟕𝟒𝟒∅𝒔
𝒅𝒑∗
𝟎.𝟓
−𝟏
… (3.4)
𝒅𝒑∗ = 𝒅𝒑
𝝆𝒈. 𝝆𝒔−𝝆𝒈 .𝒈
𝝁𝟐
𝟏𝟑
… (3.5)
The above given equations were used along with the data of physical properties of wheat provided in
Table 3.1 below. The results obtained using the above data and equations are as follows in Table
3.2.
Table 3.1 Physical Properties of Wheat
Parameter Wheat
∅𝐬(Spherecity) 0.85
𝐝𝐩(𝐄𝐪𝐮𝐢𝐯𝐚𝐥𝐞𝐧𝐭 𝐃𝐢𝐚𝐦𝐞𝐭𝐞𝐫)(m) 4.06*10-3
𝛍(𝐀𝐢𝐫 𝐕𝐢𝐬𝐜𝐨𝐬𝐢𝐭𝐲) (Kg/m.s) 1.8*10-5
𝛒𝐛(𝐁𝐮𝐥𝐤 𝐃𝐞𝐧𝐬𝐢𝐭𝐲) (Kg/m3) 800
𝛒𝐠(𝐀𝐢𝐫 𝐃𝐞𝐧𝐬𝐢𝐭𝐲) (Kg/m3) 12
𝛆𝐦(Void fraction) 0.40
𝐋𝐦𝐟 (Bed Height) (m) 0.05
Table 3.2Values Obtained on Calculation
Calculated Values Wheat
∆𝒑𝒃 231.908 Pa
𝒖𝒎𝒇 0.450 m/s
Area 7.85 ∗ 10−3 𝑚2
Flowrate 12,715 LPH
𝑹𝒆𝒑,𝒎𝒇 1218 (∴ 𝑅𝑒𝑝 ,𝑚𝑓 >1000)
𝒅𝒑∗ 267.589
𝒖𝒕∗ 19.09
𝒖𝒕 1.887 m/s
The material used and the cost of respective items have been mentioned the Table 3.3. The
mentioned costs are to be considered only for the Phase I.
39 Mehul Soni, Anand Laddha, Harshitkumar Chudiwal, O. K. Mahadwad
International Journal of Engineering Technology Science and Research
IJETSR
www.ijetsr.com
ISSN 2394 – 3386
Volume 2 Issue 5
May 2015
Table 3.3Materials Used and its Respective Cost
Sr.No. Material Cost (₹)
1 Acrylic Cylinders ( 100 mm i.d. , thickness 5 mm) 1500
2 Acrylic Flange 500
3 G.I. Flange 250
4 Reducer 400
5 Gasket 40
6 Stand 500
7 Miscellaneous 100
Total= 3290
3.2 Phase II – Experimentation and Comparative Study
To obtain the rate of drying curves, the procedure has been mentioned below.
1. Select the sample.
2. Take 100g of dry sample and add water such that only 20g is retained.
3. Take this 120g of sample and place it in the dryer.
4. Let the sample dry. The drying time interval is chosen as 90 seconds.
5. The sample is removed and the reduced weight is measured and noted.
6. Continue this procedure until no further reduction takes place in sample weight.
7. The obtained data should be tabulated in the following form shown in Table 3.4.
Table 3.4Sample Table
Time Wt. of
Sample
ΔƟ Δx Δx/ΔƟ Free
Water
Rate of
Drying
Free Water
Dry Stock
0 120 - - - 20 - 0.2
Where,
ΔƟ = Time interval between two successive readings
Δx = Moisture content lost in ΔƟ
8. Now, plot a graph of Drying Time vs. Wt. of Sample.
9. Once this graph is plotted, plot another graph of Drying Time vs. Δx/ΔƟ. The slope of this graph
will give dx/dƟ (not shown in above table).
10. Once dx/dƟ is obtained, the following equations are to be used to calculate the rate of drying and
subsequently, the rate of drying curve.
Drying Rate = [ 𝒅𝒙 /(𝒅Ɵ) ∗(60/1000)] / (Area of Tray) … (3.6)
Free Water = Weight of Sample – Weight of dry Sample … (3.7)
Free Water Dry Stock = 𝑭𝒓𝒆𝒆 𝑾𝒂𝒕𝒆𝒓
𝑾𝒆𝒊𝒈𝒉𝒕 𝒐𝒇 𝒂𝒏𝒚 𝒔𝒂𝒎𝒑𝒍𝒆 … (3.8)
11. After obtaining the rate of drying values, plot another graph of Rate of Drying vs. Free Water
Dry Stock.Use the above obtained graphs to study the difference in performances of various
dryers.
40 Mehul Soni, Anand Laddha, Harshitkumar Chudiwal, O. K. Mahadwad
International Journal of Engineering Technology Science and Research
IJETSR
www.ijetsr.com
ISSN 2394 – 3386
Volume 2 Issue 5
May 2015
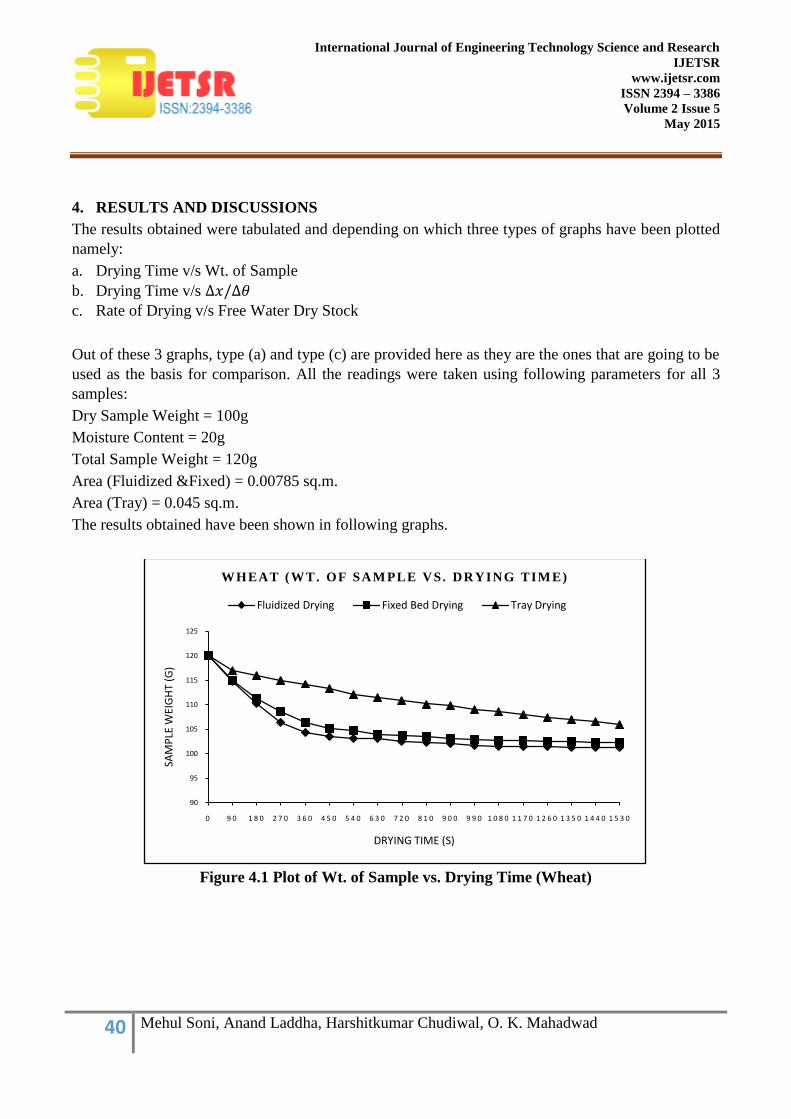
4. RESULTS AND DISCUSSIONS
The results obtained were tabulated and depending on which three types of graphs have been plotted
namely:
a. Drying Time v/s Wt. of Sample
b. Drying Time v/s ∆𝑥/∆𝜃
c. Rate of Drying v/s Free Water Dry Stock
Out of these 3 graphs, type (a) and type (c) are provided here as they are the ones that are going to be
used as the basis for comparison. All the readings were taken using following parameters for all 3
samples:
Dry Sample Weight = 100g
Moisture Content = 20g
Total Sample Weight = 120g
Area (Fluidized &Fixed) = 0.00785 sq.m.
Area (Tray) = 0.045 sq.m.
The results obtained have been shown in following graphs.
Figure 4.1 Plot of Wt. of Sample vs. Drying Time (Wheat)
90
95
100
105
110
115
120
125
0 9 0 1 8 0 2 7 0 3 6 0 4 5 0 5 4 0 6 3 0 7 2 0 8 1 0 9 0 0 9 9 0 1 0 8 0 1 1 7 0 1 2 6 0 1 3 5 0 1 4 4 0 1 5 3 0
SAM
PLE
WEI
GH
T (G
)
DRYING TIME (S)
WHEAT (WT. OF SAM PLE VS. DRYING TIM E)
Fluidized Drying Fixed Bed Drying Tray Drying
41 Mehul Soni, Anand Laddha, Harshitkumar Chudiwal, O. K. Mahadwad
International Journal of Engineering Technology Science and Research
IJETSR
www.ijetsr.com
ISSN 2394 – 3386
Volume 2 Issue 5
May 2015
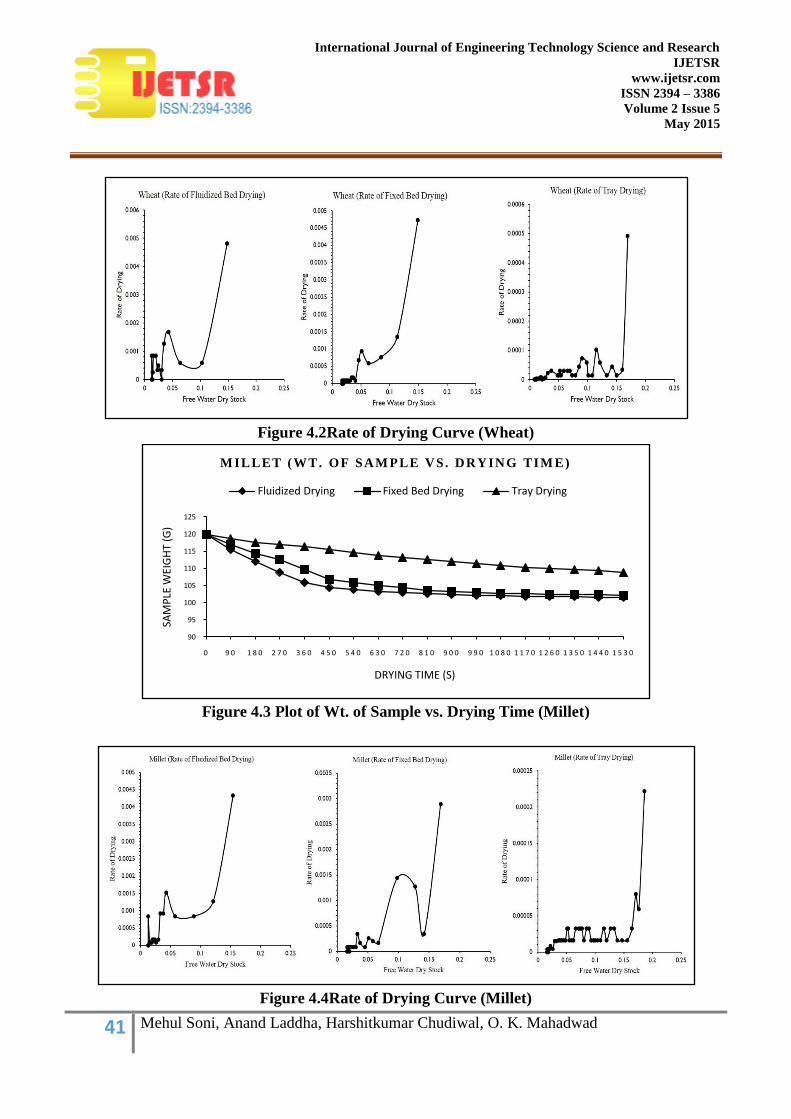
Figure 4.2Rate of Drying Curve (Wheat)
Figure 4.3 Plot of Wt. of Sample vs. Drying Time (Millet)
Figure 4.4Rate of Drying Curve (Millet)
90
95
100
105
110
115
120
125
0 9 0 1 8 0 2 7 0 3 6 0 4 5 0 5 4 0 6 3 0 7 2 0 8 1 0 9 0 0 9 9 0 1 0 8 0 1 1 7 0 1 2 6 0 1 3 5 0 1 4 4 0 1 5 3 0
SAM
PLE
WEI
GH
T (G
)
DRYING TIME (S)
M ILLET (WT. OF SAM PLE VS. DRYING TIM E)
Fluidized Drying Fixed Bed Drying Tray Drying
42 Mehul Soni, Anand Laddha, Harshitkumar Chudiwal, O. K. Mahadwad
International Journal of Engineering Technology Science and Research
IJETSR
www.ijetsr.com
ISSN 2394 – 3386
Volume 2 Issue 5
May 2015
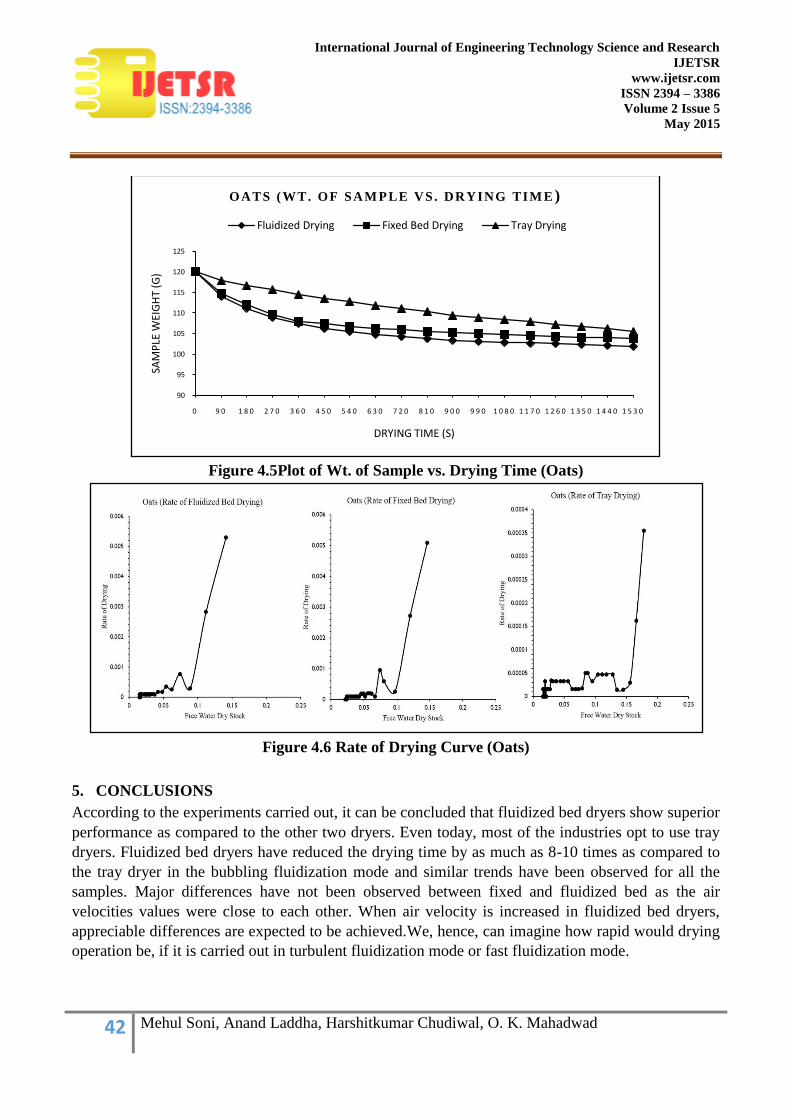
Figure 4.5Plot of Wt. of Sample vs. Drying Time (Oats)
Figure 4.6 Rate of Drying Curve (Oats)
5. CONCLUSIONS
According to the experiments carried out, it can be concluded that fluidized bed dryers show superior
performance as compared to the other two dryers. Even today, most of the industries opt to use tray
dryers. Fluidized bed dryers have reduced the drying time by as much as 8-10 times as compared to
the tray dryer in the bubbling fluidization mode and similar trends have been observed for all the
samples. Major differences have not been observed between fixed and fluidized bed as the air
velocities values were close to each other. When air velocity is increased in fluidized bed dryers,
appreciable differences are expected to be achieved.We, hence, can imagine how rapid would drying
operation be, if it is carried out in turbulent fluidization mode or fast fluidization mode.
90
95
100
105
110
115
120
125
0 9 0 1 8 0 2 7 0 3 6 0 4 5 0 5 4 0 6 3 0 7 2 0 8 1 0 9 0 0 9 9 0 1 0 8 0 1 1 7 0 1 2 6 0 1 3 5 0 1 4 4 0 1 5 3 0
SAM
PLE
WEI
GH
T (G
)
DRYING TIME (S)
OATS (WT. OF SAM PLE VS. DRYING TIM E )
Fluidized Drying Fixed Bed Drying Tray Drying
43 Mehul Soni, Anand Laddha, Harshitkumar Chudiwal, O. K. Mahadwad
International Journal of Engineering Technology Science and Research
IJETSR
www.ijetsr.com
ISSN 2394 – 3386
Volume 2 Issue 5
May 2015
REFERENCES
[1] Grace J. R., “A Perspective on Development of Novel Fluidized Bed Processes for a more
Sustainable Global Future”, Proceeding of 13th International Conference on Fluidization, (2010).
[2] Westerink E. J., Westerterp K. R., “Safe Design & Operation of Fluidized Bed Reactors: Choice
Between Reactor Models”, Chemical Engineering Science, Vol. 45, No. 1, pp. 333-354, (1990).
[3] Srinivasakannan C., Balasubramanian, N., Shoaibi, A. A.,“Continuous Fluidized Bed Drying
With and Without Internal: Kinetics”,Chem. Biochem. Eng. Q., 26(2), pp. 97–104 (2012).
[4] Borgolte, G. and Simon, E.J., “Fluid bed processes in the manufactureof snack products”, CEB
review for chocolate, confectionary and Bakery, 6(2), pp. 7-8, 10, (1981).
[5] Vanecek, C., Markvart, M.and Drbohlar, R., Fluidized bed drying, Lenard Hill London, UK
(1996).
[6] Gibert, H., Baxerres, J. L., and Kim, H., “Blanching time in fluidized beds. In food processing
Engineering”, Applied science publishers, London (1980).
[7] Geldart, D. and Kelsey, J.R., “The influence of the gas distributor on the bed expansion, bubble
size and the bubble frequency in the fluidized beds”, In Fluidization: Chem.E. Symposium Series, (J.
M. Pierie eds) pp. 114- 125. Institution of Chemical Engineers, London,
(1968).
[8] Husain, S., Akihiko H. and Naoto H., “Heat and mass Transfer Analysis of Fluidized bed Grain
Drying”, Memoriesof the faculty of engineering, Okayama University, Vol.41, pp.52-62, (2007).
[9] Mowla, D. and Montazeri, H., “Drying of particles in batch Fluidized Beds”, J. Aerosol Sci., 31
(Suppl. 1), pp. 793-794, (2000).
[10] Vojtech, V. C. Sc, Markvart, M. and Drbohlav, R., Fluidized bed drying, Leonard Hill, London
(1996).
[11] Wang, H.G., Dyakowski, T., Senior, P. R. S and Yang, W. Q., “Modeling of batch fluidized bed
drying of pharmaceutical granules”, Chemical Engineering Science, 62, pp. 1524-1535, (2007).
[12] Tanfara, H., Pugsley, T. and Winters, C., “Effect of Particle Size Distribution on Local Voidage
in a Bench Scale Conical Fluidized Bed Dryer”, Drying Technology Journal, 20 (6), pp. 1237-1289,
(2003).
[13]Kunii D., Levenspiel O., Fluidization Engineering 2nd edition. Butterworth-Heinemann Corporation, (1991).


