
COMPARATIVE COSTS OF IA SYSTEMS
by
Estelle Jamesprepared for delivery at World Bank Institute Pension Reform Seminar,
Budapest, 2001

Comparative costs of IA systems
• Prefunding desirable--financial sustainability and long term saving
• Danger of political manipulation and low returns to publicly managed funds
• But decentralized individual accounts (IA’s) may have high administrative costs
• What is the most cost-effective way to organize IA systems?
– Key choice: retail or institutional market?

We compare:1) IA’s in retail market
• Direct relation between individual & fund
• Open entry, free choice, unrestricted fee
• Retail funds incur high marketing costs
• Administrative costs are 15-30% of new contributions, equivalent to .75-1.5% of assets per year for lifetime worker
• Examples: Latin America, Poland, Hungary, Kazakhstan, UK, US mutual funds

2) IA’s in institutional market• Intermediary aggregates IA contributions; main
competition is for market access: – competitive bidding over fees narrows eligible
pension funds to small number – winners compete for workers’ money but are likely to
get large money blocs
• Best if R&C and investment are separated • Costs are half as much as in retail market <
10% of new contributions, < .5% of assets, even less with passive investing
• Bolivia, industry funds in Australia, US TSP, US pension funds, Sweden
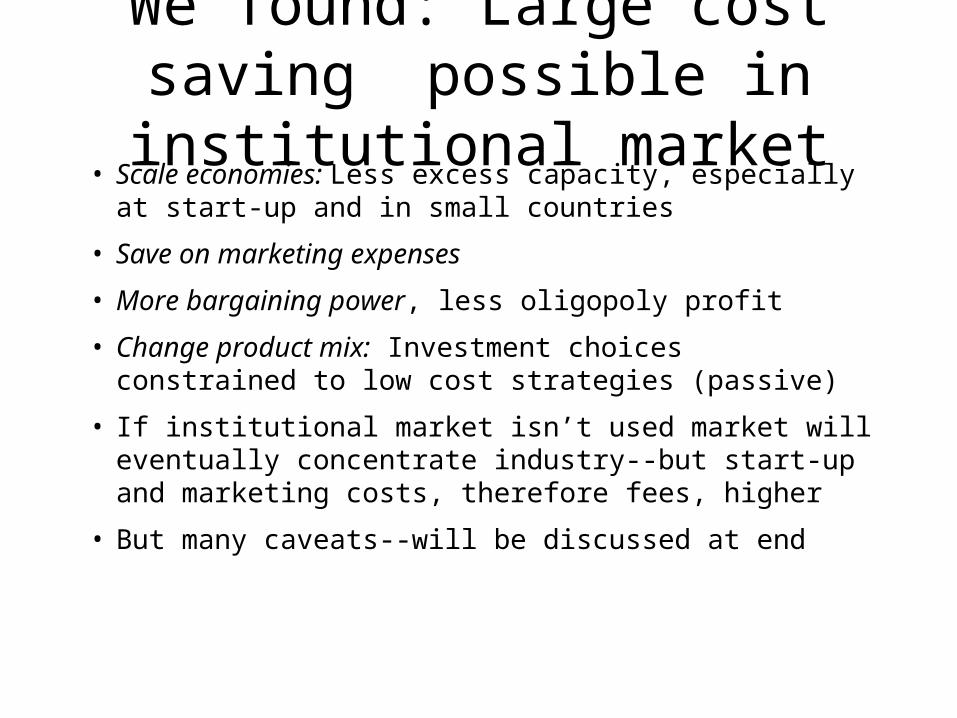
We found: Large cost saving possible in institutional market
• Scale economies: Less excess capacity, especially at start-up and in small countries
• Save on marketing expenses
• More bargaining power, less oligopoly profit
• Change product mix: Investment choices constrained to low cost strategies (passive)
• If institutional market isn’t used market will eventually concentrate industry--but start-up and marketing costs, therefore fees, higher
• But many caveats--will be discussed at end

Evidence from retail markets 1) Chile
• Admin costs in Chile overstated but are higher than we would like
• 15.6% of new contributions & final pension
• Equivalent to .76% of assets per year over lifetime of full career worker
• Snapshot: Annual costs 9% of assets initially, now 1.1% ($59 per acct); fees 1.3%
• Marketing costs about half of total
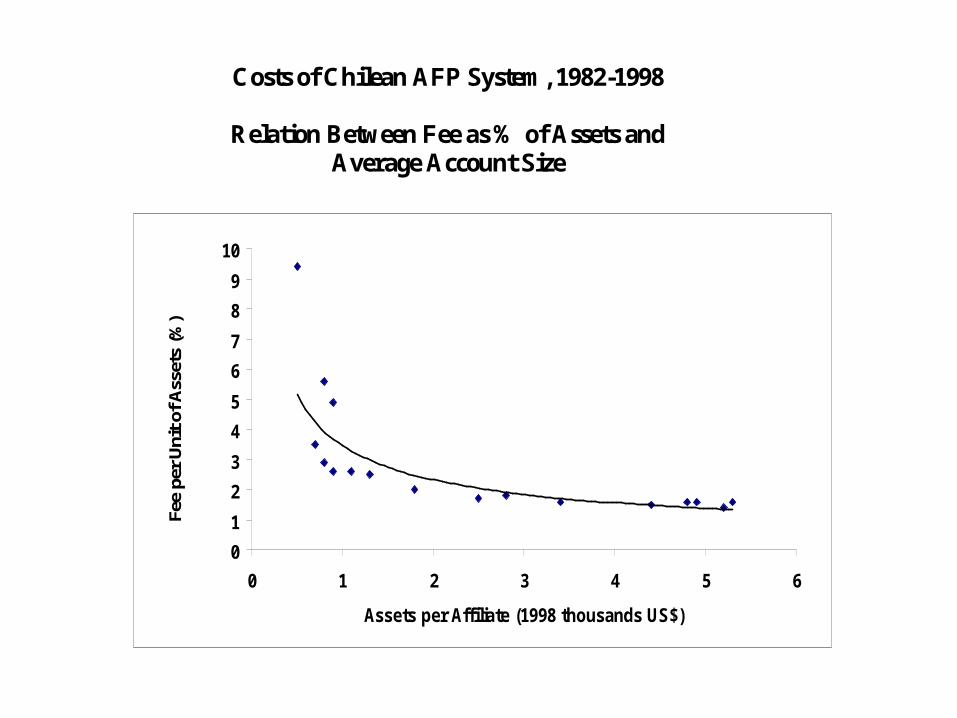
Costs of Chilean AFP System, 1982-1998
Relation Between Fee as % of Assets andAverage Account Size
0
1
2
3
4
5
6
7
8
9
10
0 1 2 3 4 5 6
Assets per Affiliate (1998 thousands US$)
Fee
per
Uni
t of A
sset
s (%
)

Economies of scale• My analysis shows scale economies continue
until 3 million affiliates, $15 billion per AFP--half total industry in Chile
• Concentration is being achieved through market (previously 20, now 7-8 AFP’s)
• Will probably fall to 5 AFP’s--scale economies but marketing costs continue
• Institutional approach would get us there faster, and with lower equilibrium costs, but raises other problems

2) Latin America
• Cost and fee is 15-25% of contributions
• Per unit of assets 4-9% ($21-98 per acct)
• Scale: Costs lower for larger AFP’s
• Expenses smaller in Bolivia (institutional approach) and Chile (size, experience, concentration)
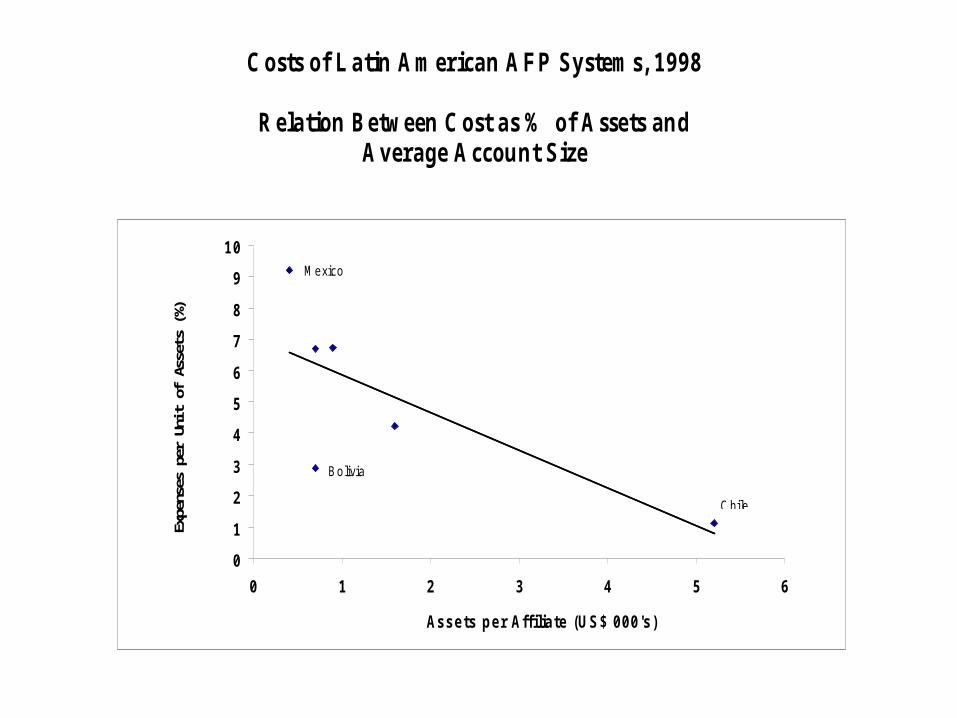
C osts o f L atin A m erican A F P S ystem s, 1998
R ela tion B etw een C ost as % of A sse ts an dA verage A ccou n t S ize
0
1
2
3
4
5
6
7
8
9
10
0 1 2 3 4 5 6
Assets per Aff ilia te (U S $ 000 's )
Expe
nses
per
Uni
t of A
sset
s (%
)
C hile
B o livia
M e xico

3) U.S. Mutual funds
• Many years of operation, very large, service
• Costs & fees more dispersed but similar to Chile: average = 1.4% of assets
• Costs are lower for: larger funds, no-loads (no commissions), passive investments
• Marketing expenses about 50% of total cost
• Higher costs don’t lead to higher returns
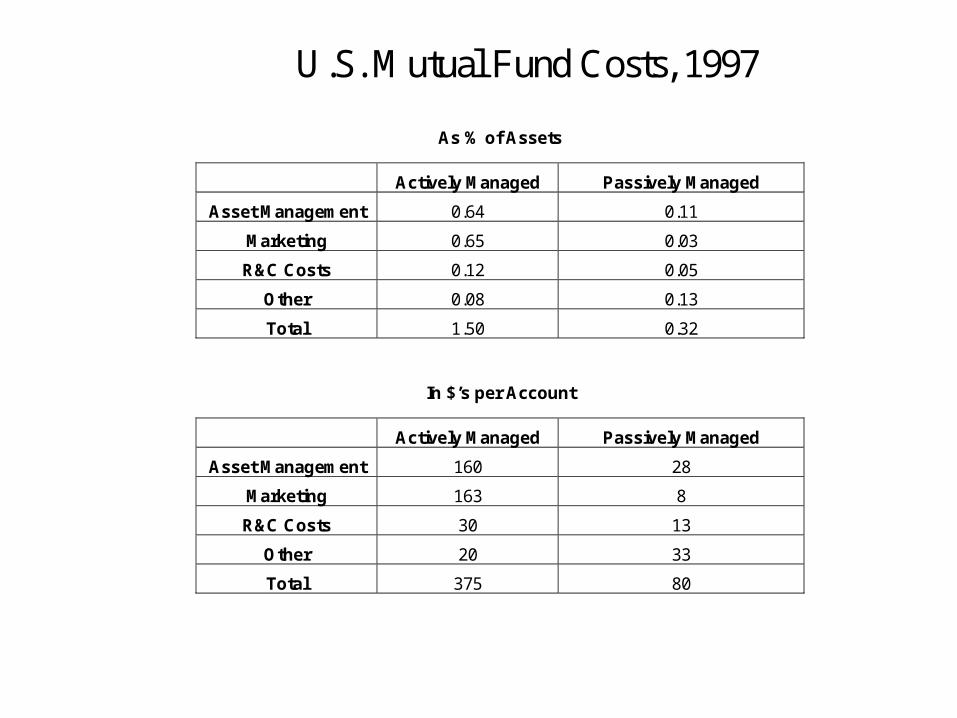
U.S. Mutual Fund Costs, 1997
As % of Assets
Actively Managed Passively Managed
Asset Management 0.64 0.11
Marketing 0.65 0.03
R&C Costs 0.12 0.05
Other 0.08 0.13
Total 1.50 0.32
In $’s per Account
Actively Managed Passively Managed
Asset Management 160 28
Marketing 163 8
R&C Costs 30 13
Other 20 33
Total 375 80

Institutional market--1) U.S.• Large investors pay .04-.08% of assets for
passive mgt, .35-.65% for active mgt. + .1-.15% for other expenses. Half retail costs, lower for large institutions.
• Reasons for lower fees:– Large money blocs--scale economies– Low marketing costs– Low R&C costs– Heavy use of passive investment– Better information, bargaining power
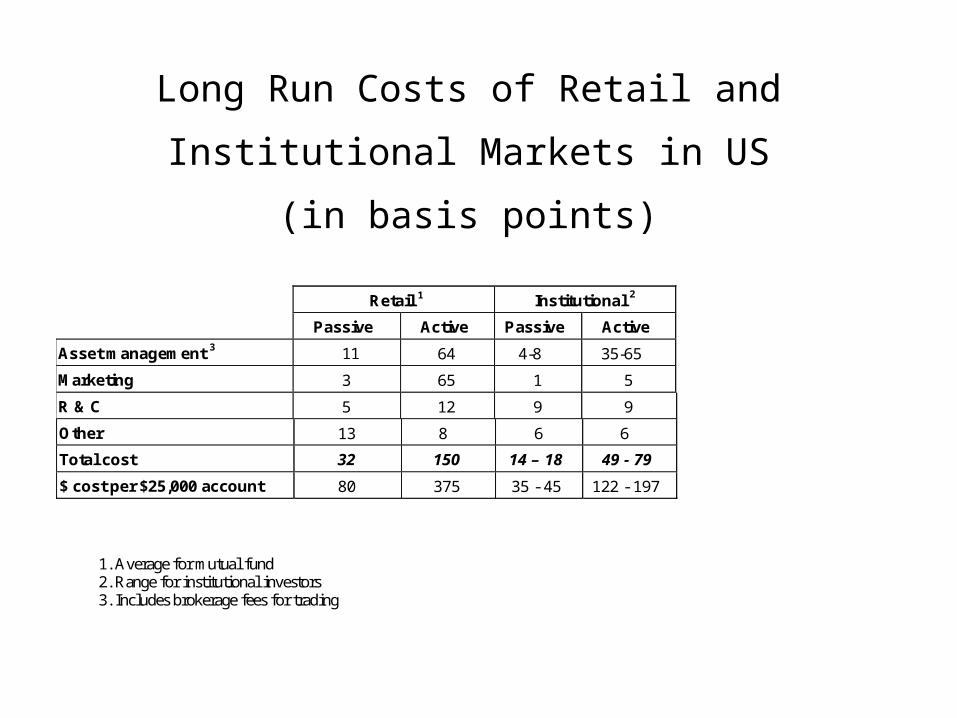
Long Run Costs of Retail and
Institutional Markets in US
(in basis points)
Retail 1 Institutional 2
Passive Active Passive Active
Asset management 3 11 64 4-8 35-65
Marketing 3 65 1 5
R & C 5 12 9 9
Other 13 8 6 6
Total cost 32 150 14 – 18 49 - 79
$ cost per $25,000 account 80 375 35 - 45 122 - 197
1. Average for mutual fund2. Range for institutional investors3. Includes brokerage fees for trading

2) Bolivia
• International bidding process, 2 winners, no switching (greater entry & switching later)
• Fee structure: 5% contributions+.43% assets
• Equivalent to: .56% for full career worker
• Snapshot today: 3% of assets, $16 per account
• Much cheaper than Chile at start-up
Bolivia: caveats
• Is saving due to competitive bidding & no marketing or to lumping IA’s with large privatization assets & cross-subsidization?
• Potential problems: service, performance incentives, regulation, unexpected contingencies, rebidding problems

3) U.S. thrift savings plan
• Voluntary IA plan for federal government employees with matching contributions
• Competitive bidding with 3 portfolios, all passive management, 1 company
• Costs: .11% of assets or $30 per account
• Is saving due to competitive bidding, limited choice (index funds) or hidden costs?
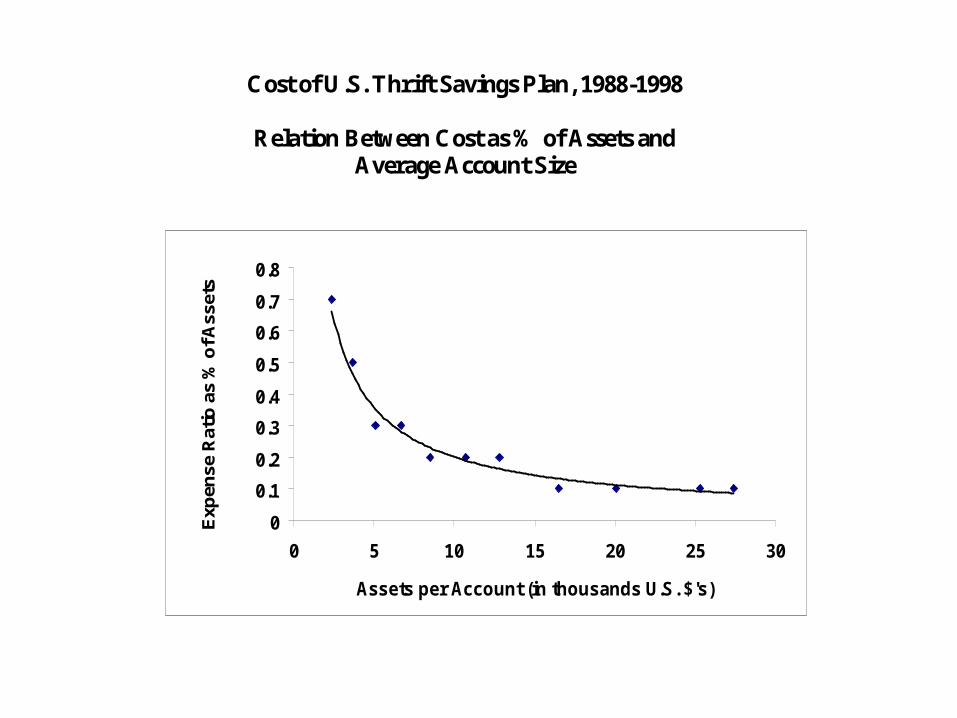
Cost of U.S. Thrift Savings Plan, 1988-1998
Relation Between Cost as % of Assets andAverage Account Size
0
0.1
0.2
0.3
0.4
0.5
0.6
0.7
0.8
0 5 10 15 20 25 30
Assets per Account (in thousands U.S. $'s)
Exp
ense
Rat
io a
s %
of A
sset
s

4) Sweden
• Centralized R&C: 2.5% IA contributions go to public agency, then reallocated (blind) to mutual funds selected by workers
• Mutual funds must accept agency’s fees--sliding scale, depending on funds attracted
• Estimated expected fee=.8% (.5% in lg run)
– lower than Chilean AFP’s, US or Swedish mutual funds because less marketing
– higher than TSP because greater choice

What does the evidence tell us?• Economies of scale: Cost per account falls as #
affiliates grow, cost per asset unit falls as assets grow; industry consolidates. This happens in retail and institutional markets
• Institutional costs lower than retail--competitive bidding limits number of funds, gains from scale economies early, low marketing costs, constrain choice to low cost products, bargaining power
• Costs <.5% of assets annually; would reduce pensions<10%, half as much as retail market, even less with passive investing
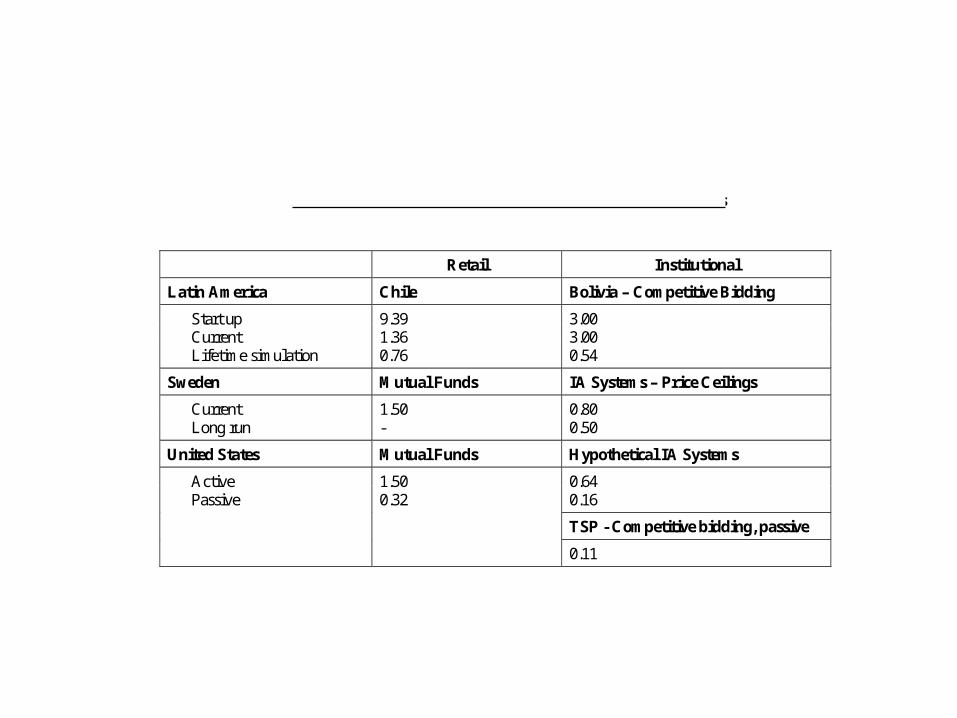
Average Annual Fees as % of Assets for Alternative IA Systems
Retail Institutional
Latin America Chile Bolivia – Competitive Bidding
Start up 9.39 3.00Current 1.36 3.00Lifetime simulation 0.76 0.54
Sweden Mutual Funds IA Systems – Price Ceilings
Current 1.50 0.80Long run - 0.50
United States Mutual Funds Hypothetical IA Systems
Active 1.50 0.64Passive 0.32 0.16
TSP - Competitive bidding, passive
0.11
Trade-offs and caveats• May choose wrong number of funds
• Performance incentives hard to specify
• Slow to innovate, adapt to new conditions
• Difficult to handle unforeseen contingencies
• Possible corruption, collusion, regulatory capture
• Credible rebidding strategy needed with fixed costs staying in system; or first entrants have long run monopolistic advantage
• But low cost IA system is feasible; especially useful at start-up and for small countries or contribution base
What is the relevance to ECA/FSU?
• As you choose your new systems, don’t automatically choose the retail model just because many other countries have done so
• Reforming countries, especially small countries, should consider pros and cons of the institutional approach, to attract foreign expertise and cut administrative costs


