
Ord Minnett Research 7 March 2014 Page 1
Ord Minnett Research
Company Review
Strike Energy Limited (STX) A different take on Cooper unconventional gas
Valuation and Recommendation
We initiate coverage of Strike Energy with a Buy recommendation and a risk
adjusted DCF target price of $0.25/share, providing a return of 85/%. Strike Energy
is an oil & gas company with conventional and unconventional interests in Australia
and the USA. The primary value driver is appraisal and development of large scale
coal seam gas (CSG) resources from Australia’s Cooper Basin. The potential for
Southern Cooper CSG to supply near term domestic customers is underscored by
agreements with Orica (ORI.AX, Hold), Orora (ORA.AX, Accumulate) and Austral
Bricks, totalling ~190 PJ over 20 years, with Orica advancing $52m to accelerate
resource definition and production. Near term price catalysts include Eagle Ford
divestment and Cooper CSG pilot well testing.
Key investment points
Well located acreage. Strike has over four million net acres in the Cooper
Basin with an estimated 14.3 tcf of recoverable gas and 54 mmbbl of liquids,
over 10,400 net acres in the Eagle Ford shale and 1,875 net acres in the
Permian Basin, all areas which are receiving significant industry attention.
Initial Cooper Basin results look promising.
Southern Cooper CSG: Strike has high equity interest in and operatorship
of its key Cooper Basin tenement, PEL 96. Southern Cooper CSG is located
at depths of 1,500-2,000 m, deeper than typical Queensland CSG projects
(300-800 m), but shallower than Cooper shale at 2,000-4,000 m. As a result
Strike believes Cooper CSG can be appraised for one quarter of the cost of
shale and deliver higher rates of return on field development.
Domgas focus: Initial development of Strike’s Cooper CSG is aimed at
domgas supply but the resource could feed export projects at a later date.
Strike’s foundation agreement with Orica provides $52m of funding to supply
150 PJ over 20 years from 2017, while agreements with Orora and Austral
Bricks total 42.5 PJ over 10 years, equivalent to 12 PJ/yr for the three firms.
Eagle Ford and Permian Basin shale divestment. Strike’s involvement in
US shale plays has proceeded more slowly than planned, with well problems
delaying derisking and divestment. We expect that divestment of the Eagle
Ford project in 2014 and Permian Basin in 2015 will redeploy capital to the
Southern Cooper in time for initial field development.
Risks: Strike has small conventional reserves, with declining production. It
will require further industry or equity funding to develop its Cooper program.
Key Financials
Year-end June (A$) FY13A FY14E FY15E FY16E FY17E
USD/AUD (average) 1.03 0.90 0.88 0.83 0.80
Brent (US$/bbl) 109 109 102 97 97
Production (mmboe) 0.1 0.1 0.1 0.1 0.1
Revenue ($m) 5 5 6 5 2
EBITDA ($m) 3 -2 -2 -2 -4
Cash costs ($/boe) 56 64 65 75 118
Normalized NPAT ($m) -10 -4 -5 -8 -7
Reported NPAT ($m) -14 -4 2 -10 -7
ROE (%) -22 -7 -6 -5 -5
Cash ($m) 1 9 8 65 53
Debt ($m) 3 5 3 3 23
Capex ($m) 17 7 26 23 29
PER -8.1 -30.0 -28.7 -17.6 -18.2
EV/EBITDA 53.5 -57.7 -70.0 -31.1 -26.5
Source: Iress, Company, Ord Minnett estimates
Last price $0.135
Target price $0.25
Recommendation Buy
Risk Assessment Higher
Oil and Gas
John Young
Senior Oil & Gas Analyst
+61 3 9608 4184
Strike Energy Limited
ASX Code STX
52 week range $0.07 - $0.14
Market Cap (A$m) 95
Shares Outstanding (m) 707
Av Daily Turnover (#) 831,398
ASX All Ordinaries 5,469.8
Net Debt/(Cash) FY13A (A$m) 2
Relative price performance
Source: Iress
Consensus earnings
Cons. OML
Target price $/sh 0.20 0.27
FY14 earnings $m n/a -4
FY15 earnings $m n/a -5
Source: Bloomberg
40
50
60
70
80
90
100
110
120
130
Feb-13 May-13 Aug-13 Nov-13 Feb-14
STX
ASX Small Resources
7 March 2014

Ord Minnett Research 7 March 2014 Page 2
Company Review
Strike Energy Limited
Contents
Executive summary ..................................................................................................................... 3
Valuation and target price ........................................................................................................................................ 3
Simulation and sensitivity analysis ........................................................................................................................... 5
SWOT analysis ......................................................................................................................................................... 6
Risks ......................................................................................................................................................................... 6
Company description ................................................................................................................... 7
Southern Cooper Basin Gas Project ........................................................................................................................ 8
Cooper Basin conventional .................................................................................................................................... 10
USA unconventional: Eagle Ford Shale ................................................................................................................. 10
USA unconventional: Permian Basin ..................................................................................................................... 10
USA conventional ................................................................................................................................................... 11
Carnarvon Basin ..................................................................................................................................................... 11
Kingston Lignite Project .......................................................................................................................................... 11
Key activities ........................................................................................................................................................... 14
Reserves and resources ........................................................................................................................................ 15
Cooper Basin CSG versus shale gas ........................................................................................ 16
Unconventional play exposure ............................................................................................................................... 16
Technical comparison ............................................................................................................................................ 17
Southern Cooper project development concept ..................................................................................................... 19
Valuation model ......................................................................................................................... 20
Methodology ........................................................................................................................................................... 20
Project assumptions ............................................................................................................................................... 22
Funding requirements ............................................................................................................................................ 23
Valuation model ...................................................................................................................................................... 24
Corporate overview .................................................................................................................... 28
Board ...................................................................................................................................................................... 28
Management ........................................................................................................................................................... 29
Capital structure ..................................................................................................................................................... 30
Appendices ................................................................................................................................ 31
Appendix 1: Tenement summary ........................................................................................................................... 31
Appendix 2: Commodity price assumptions ........................................................................................................... 32
Appendix 3: South Australian coal seam gas potential .......................................................................................... 33
Appendix 4: Eagle Ford shale valuation ................................................................................................................. 35

Ord Minnett Research 7 March 2014 Page 3
Company Review
Strike Energy Limited
Executive summary
Valuation and target price
Investment thesis: Strike offers exposure to appraisal and development of large
scale coal seam gas (CSG) resources from Australia’s Cooper Basin. These
resources, which can be appraised more cheaply than comparable shale programs,
are well located with respect to eastern Australia’s gas market and can be
developed in a time frame suitable for large domestic customers. This potential is
underscored by Orica’s $52m advance to accelerate resource definition and
production and agreements with Orora and Austral Bricks, with demand from the
three firms totalling 12 PJ/yr (equivalent to ~30 mmscfd or ~2 mmboe/yr). Santos,
Beach, Drillsearch, Senex and Origin Energy are also evaluating Cooper Basin
deep coal. Strike has a high equity interest (67%) in and operatorship of its key
Cooper Basin tenement, PEL 96, enabling it to drive the pace and scale of activity.
Valuation and target price: We estimate a base case valuation of $0.21/share as
of 31st December 2013 (at 12% discount rate). Our target price of $0.25 is based
on a 12-month roll-forward of our DCF valuation, with risk factor on Strike’s main
project increasing from 40% to 50% following expected pilot testing progress. This
initiation report should be read in conjunction with our Cooper Basin sector report of
11th September 2013.
Base case: Our base case assumes development of current 2P reserves, together
with a risked value for unconventional prospective resources. Our valuation
assumes a long run Brent oil price of $US90/bbl real, USD/AUD exchange rate of
0.80 and 12% nominal discount rate.
Price catalysts: Near term catalysts include divestment of Strike’s Eagle Ford
shale interest and testing results from the Southern Cooper CSG pilot wells.
Funding: Our modelling indicates Strike will need additional equity funding during
late 2014 to continue to progress appraisal of its Southern Cooper CSG project.
Asset monetization / exit strategy: We expect Strike will divest its US assets and
non-core Australian assets to focus on the potential of its three primary Cooper
Basin tenements (PELs 94, 95 and 96). We expect Strike will retain its current
66.7% interest in the key PEL 96 permit to maintain control of the joint venture and
drive the pace and scale of the Southern Cooper appraisal program. Whilst Strike
may be able to retain its current shareholding in the initial phase of project
development, partial divestment will be required for later, larger scale production.
Table 1: Base case valuation and target price
Source: Ord Minnett analysis. Diluted shares includes assumed future capital raisings.
NPV @ 12.0% WACC $A(m) $A/share %
Production 6 0.01 2.6
Development 22 0.02 10.2
Appraisal 54 0.05 25.3
Exploration 106 0.11 49.2
Corporate costs -37 -0.04 -17.2
Hedging & Investments 0 0.00 0.0
Enterprise Value 150 0.15 70.0
Cash 4 0.00 1.7
Additional Equity 28 0.03 13.0
Debt -7 -0.01 -3.2
Minorities / Other 40 0.04 18.5
Total Equity Valuation - Fully Diluted 215 0.21 100.0
Target price (as of Dec 2014) 251 0.25 116.8
DCF Valuation date: 31-Dec-13. Number of shares (diluted): 1003m
Our valuation includes $35m of additional capital (NPV of $28m), with $15m raised in late 2014 at $0.118/share (based on a 10% discount to the Theoretical ex-rights price, assuming the current share price) and $20m raised in late 2015, also at $0.118/share.

Ord Minnett Research 7 March 2014 Page 4
Company Review
Strike Energy Limited
Table 2: Valuation summary
NPV @ 12.0% WACC Net Unit Risk Risked Risked Unrisked Risked
volume value factor value value value value
Valuation as of 31 Dec 2013 mmboe $US/boe % $A(m) $A/sh $A/sh $A/sh
Projects (DCF model valuation) 147.1 75 0.08 0.14
Louise gas field 0.5 9.20 100 6 0.01 0.01
Eagle Ford Shale 0.0 - 50 20 0.02 0.02
Clearfork conv. 0.0 - 90 2 0.00 0.00
Clearfork shale 0.1 12.60 50 2 0.00 0.00
Southern Cooper CSG Ph1 146.5 0.65 40 46 0.05 0.11
Exploration / Appraisal 3,442.8 112 0.11 1.11
Kingston Lignite 2,144.0 - 10 6 0.01 0.06
Carnarvon permits - - - - - -
S'thn Cooper CSG Ph 2 (PEL96) 310.1 0.65 10 25 0.03 0.25
S'thn Cooper CSG Ph 2 (PEL94/95) 586.5 0.65 10 47 0.05 0.47
Cooper shale gas 402.2 0.65 10 33 0.03 0.33
Cooper (PEL 71/515/575) - - - - - -
Cooper (PPL 210) - - - - - -
Geothermal (GEL 526/527) - - - - - -
Other (corporate, cash, debt, etc) 27 0.03 0.03
Corporate costs 100.0 -37 -0.04 -0.04
Hedging & Investments 100.0 - - -
Franking credits (@ 0 %) 0.0 0 0.00 0.01
Cash 100.0 4 0.00 0.00
Additional Equity 100.0 28 0.03 0.03
Debt 100.0 -7 -0.01 -0.01
Minorities / Other 100.0 40 0.04 0.04
Equity Valuation (diluted) as of Dec 2013 215 0.21 1.30
Equity Valuation @ spot prices @ $US102/bbl real WTI & 0.908 fx 231 0.23
Target price as of Dec 2014 251 0.25
Mkt Cap @ current share price (and undiluted share count) 95 0.135
Total shareholder return (%) 85.2
Number of shares (undiluted) 000,000 706.5
Number of shares (diluted) 000,000 1,003.2
Source: Ord Minnett analysis
Oil price and forex sensitivity: $A/sh Real WTI oil price, $US/bbl Valuation analysis:
$US/$A forex 50 75 100 125 150 175
fx=1.20 0.06 0.17 0.23 0.26 0.29 0.32 Prod'n
fx=1.10 0.06 0.17 0.23 0.26 0.28 0.31 Devel't
fx=1.00 0.06 0.17 0.23 0.25 0.28 0.31 Appr'l
fx=0.90 0.05 0.17 0.23 0.25 0.28 0.30 Expl'n
fx=0.80 0.05 0.17 0.23 0.25 0.27 0.30 Other
fx=0.70 0.04 0.18 0.23 0.25 0.27 0.29
Source: Ord Minnett analysis
Source: Ord Minnett analysis

Ord Minnett Research 7 March 2014 Page 5
Company Review
Strike Energy Limited
Simulation and sensitivity analysis
Monte Carlo simulation calculates the distribution of possible share price outcomes
given the uncertainty in the underlying assumptions. Our simulation analysis
estimates a mean share price of $0.20/share, effectively equal to our base case
valuation of $0.21/share. The distribution is bimodal, reflecting the upside from
shale and Phase 2 of the Southern Cooper CSG resources, which are treated as
discrete variables (i.e. all or nothing). There is an 80% probability the share price
will be above ~$0.06/share and a 20% probability of exceeding ~$0.38/share.
The Tornado chart shows the sensitivity of the valuation to changes in individual
variables, ranking the variables from highest to lowest impact. Our analysis
indicates that the value attributed to Strike’s Cooper shale gas and Southern
Cooper CSG resources have the greatest impact. The oil price impacts value, both
directly through the US unconventional projects and indirectly through the
Australian gas price (reflecting LNG netback pricing).
Figure 1: Monte Carlo simulation
Source: Ord Minnett analysis.
Figure 2: Tornado chart
Source: Ord Minnett analysis.
The bars correspond to the low case (red bar) and high case (blue bar) for each variable.
Due to oil industry convention probabilities are reported as being above a given level. Hence the low case corresponds to a 90% probability of the value being above the low case level and the high case corresponds to a 10% probability of being above the high case level.
The values shown at the end of each bar are the values of the input variables at the low and high cases.
The Monte Carlo simulation method selects values for each of the input assumptions from their probability distributions, calculates the resulting share price, and repeats the process many (in this case 1,000) times.

Ord Minnett Research 7 March 2014 Page 6
Company Review
Strike Energy Limited
SWOT analysis
Strengths
Material acreage positions in good locations (Cooper Basin, South Australia
and Eagle Ford, Texas)
Diversified asset portfolio (regulatory jurisdictions, play types, commodities)
High equity interest in and operatorship of Cooper projects
Near term news flow (Eagle Ford divestment, Cooper drilling)
Low cost appraisal for Southern Cooper CSG (vs. shale)
Weaknesses
Existing production is modest and is declining
Requires funding to progress Cooper CSG program
Lack of control over pace of US projects
Eagle Ford drilling problems potentially impacts divestment value
Opportunities
Divest non-core projects (Carnarvon Basin, Kingston Lignite)
Appraise / divest US unconventional acreage (Eagle Ford, Permian Basin)
Appraise / farm-out Cooper unconventional assets (CSG, shale)
Gas sales option agreements to supply early funding / lock in demand
Supply Australian domgas (and export) markets
Threats
Community opposition to shale exploration and development (particularly
hydraulic fracturing) (although this is unlikely to be a major issue for the
Cooper Basin).
Competition for limited domgas and export markets by other players
Risks
Risks include, but are not limited to, the following factors.
Asset quality (Cooper CSG and shale, Eagle Ford shale)
Cooper gas commercialization
Development costs
Commodity prices
Community opposition / regulatory burden
Investor sentiment towards junior oil & gas companies

Ord Minnett Research 7 March 2014 Page 7
Company Review
Strike Energy Limited
Company description
Strike’s portfolio consists of six projects:
Southern Cooper Basin unconventional gas (South Australia)
Eagle Ford Shale (Texas)
Permian Basin Lower Clearfork Shale (Texas)
USA conventional (Texas and Louisiana)
Carnarvon Basin (offshore Western Australia)
Kingston Lignite (South Australia)
In our view the primary value driver is the Southern Cooper Basin Gas Project.
Existing production, sourced predominantly from the USA conventional assets, is
modest at ~230 boepd.
Table 3: Existing production
Project Production (boepd) % oil
Eaglewood 185 11 Clearfork 34 88 Eagle Ford 18 78 Total 237 27
Source: Ord Minnett estimates from Strike Energy December 2013 quarterly report
Tenement information is summarized in Appendix 1 and key features of each
project are described in the following pages.
Figure 3: Strike Energy project areas
Source: Strike Energy Limited, investor presentation, 27
th February 2014, p 3.

Ord Minnett Research 7 March 2014 Page 8
Company Review
Strike Energy Limited
Southern Cooper Basin Gas Project
Large acreage: Strike has 1.55 million gross acres (~927,000 net acres) in the
southern part of the Cooper Basin. The seven permits have conventional and
unconventional potential from shales, coals and sands and have pipeline access to
south eastern Australia and a potentially fast appraisal and development timeline.
The permit areas are on the southern flanks of the basin, which are less thermally
mature than the centre of the basin, suggesting the permits may contain liquids in
addition to gas and are likely to have lower CO2 levels.
Southern Cooper Gas Project: Strike’s project is targeting coal formations at
depths of 1,500-2,000 m. Coals are the primary oil and gas source rocks in the
Cooper Basin and Strike believes its acreage has the thickest and shallowest
Permian age coals in the basin. The relatively shallow formations should result in
lower drilling costs than the deeper shale and basin centred gas plays being
targeted by other companies in the Patchawarra and Nappamerri troughs further to
the north.
Phase 1 project should deliver ~1800 PJ: Strike is primarily focused on the
“Phase 1 Area” within the PEL 96 permit, which is less than 10 km from the
Moomba to Adelaide Pipeline and contains an estimated 1800 PJ gross
recoverable resource. Strike estimates this is sufficient to supply 25% of NSW’s
energy demand. The proposed pad drilling development concept involves five
“deviated” wells per pad targeting ~50-70 m of net coal thickness across three
zones. Strike previously estimated this would deliver an ex-field cost of $3.00/GJ
excluding royalties, significantly lower than most estimates for shale gas projects.
Orica funding agreement: In July 2013 Strike signed a binding term sheet with
Orica (ASX:ORI, Hold) for a gas supply agreement in which Orica would provide up
to $52.5m in staged payments as partial prepayments for up to 150 PJ of gas over
20 years. In simple terms this is equivalent to $0.35/GJ. Strike retains 66.67% of
the PEL 96 permit and effective control of the PEL 96 joint venture. The gas
subject to the agreement is less than 5% of overall resource within the permit. The
Orica payment will fund pilot test work to establish and contingent resource and
some of the initial development expenditure.
Orora and Austral Bricks gas sales agreements: In January and February 2014
Strike announced gas supply option agreements to supply 30 PJ of gas to Orora
and 12.5 PJ of gas to Austral Bricks respectively. The agreements have the same
key terms, involving a fixed price over a 10 year term from 2017 and the payment of
an option fee to Strike as a gas pre-payment, conditional only on the PEL 96 joint
venture proceeding with a pilot production test project. Orora and Austral can
exercise the supply options when a decision is made by the PEL 96 joint venture to
proceed with project development.
Appraisal program: Initially the PEL 96 joint venture expected to drill three
exploration wells to determine the thickness, continuity and gas content of the coals
in the project area. However, initial results were better than expected, with thicker
coals, and two wells, Le Chiffre 1 and Klebb-1, were sufficient. Completion and
testing of both wells is expected to be undertaken in the June quarter of 2014.

Ord Minnett Research 7 March 2014 Page 9
Company Review
Strike Energy Limited
Figure 4: Cooper Basin permit unconventional focus area
Source: Strike Energy Limited, investor presentation, 27
th February 2014, p 9.
Figure 5: Cooper Basin gas resource
Source: Strike Energy Limited, investor presentation, 27
th February 2014, p 10.
Ord Minnett Research 7 March 2014 Page 10
Company Review
Strike Energy Limited
Cooper Basin conventional
Three of Strike’s seven Cooper Basin permits, PEL 71, 515 and 575, are
prospective for conventional oil & gas. We expect Strike will seek a farm-in partner
to assist in the funding the work program on these permits.
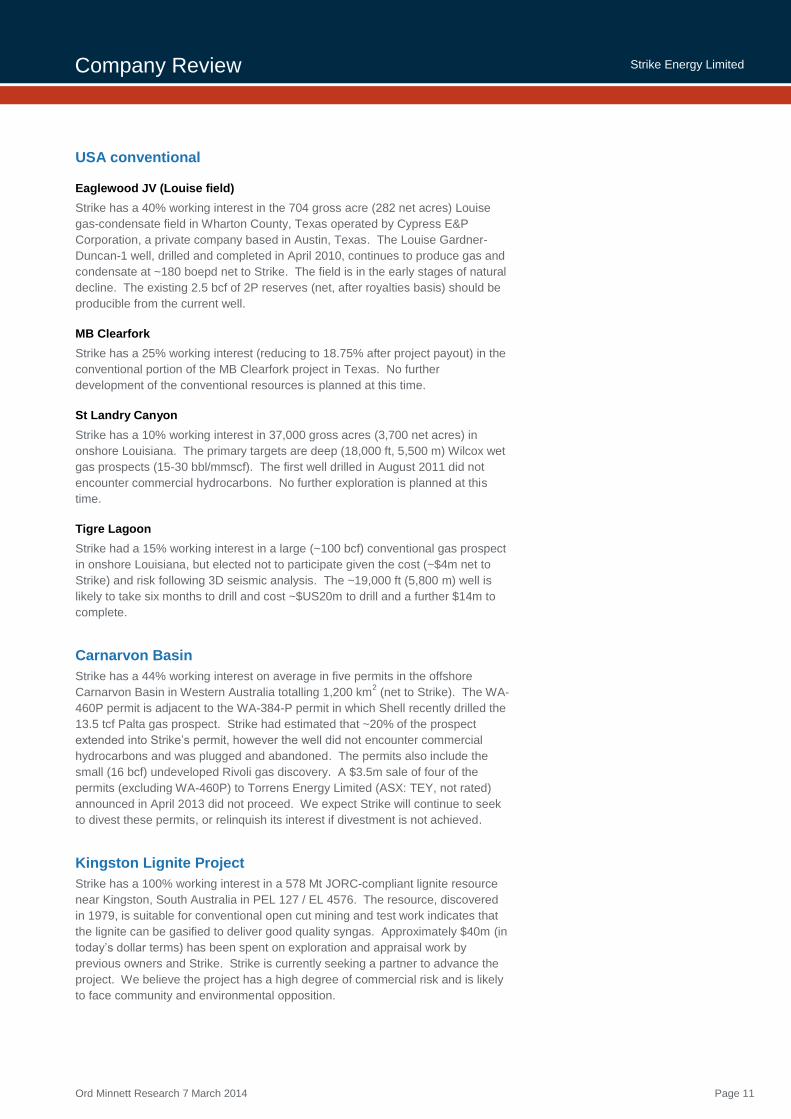
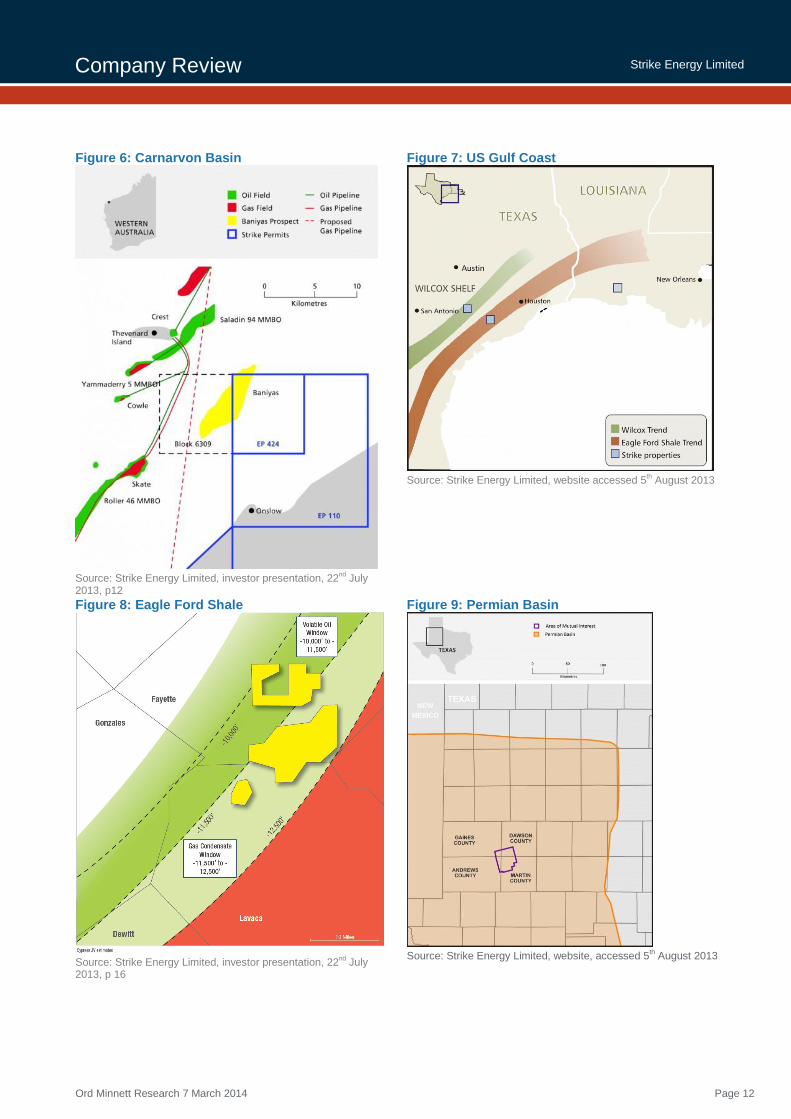
USA unconventional: Eagle Ford Shale
Strike has a 27.5% interest in 41,550 gross acres (10,995 net acres) in the Cypress
Eagle Ford Shale project in Lavaca and Fayette Counties, Texas. The acreage is
on-trend with fields which have demonstrated the north-eastern extension of the
Eagle Ford shale trend in counties to the south west. Approximately 75% of the
acreage is in the gas-condensate window and 25% in the oil window, with the gas-
condensate window typically demonstrating better economics due to high liquids
recovery and strong flow rates.
However, the joint venture has experienced problems with its two Eagle Ford wells.
Given this situation and Strike’s Cooper Basin opportunities we expect Strike will
divest its interest in the Eagle Ford formations during 2014. The joint venture has
engaged corporate advisers to conduct a sale. However, Strike will retain an
interest in the deeper Edwards formation and has farmed out part of its interest in
the Murphy Gas Unit #1 well to be drilled commencing in March. Strike will be free
carried for a 6.875% working interest until casing point.
Commercial production rates are being achieved from Penn Virginia (NYSE: PVA,
not rated) and Magnum Hunter Resources (NYSE: MHR, not rated) in Lavaca
County and from Sanchez Energy (NYSE: SN, not rated) in Fayette County.
Production rates and estimated ultimate recoveries appear to be correlated with
trend window (gas-condensate, oil, etc.), completion horizon and lateral length.
Strike reports recent corporate activity has placed a value of ~$20,000/acre on
nearby producing acreage (Penn Virginia purchased 19,037 contiguous net acres in
Gonzales and Lavaca Counties from Magnum Hunter for $400m in April 2013).
Transactions for early stage acreage have typically been conducted at $US2-
4,000/acre, suggesting Strike may receive ~$20m for its interest.
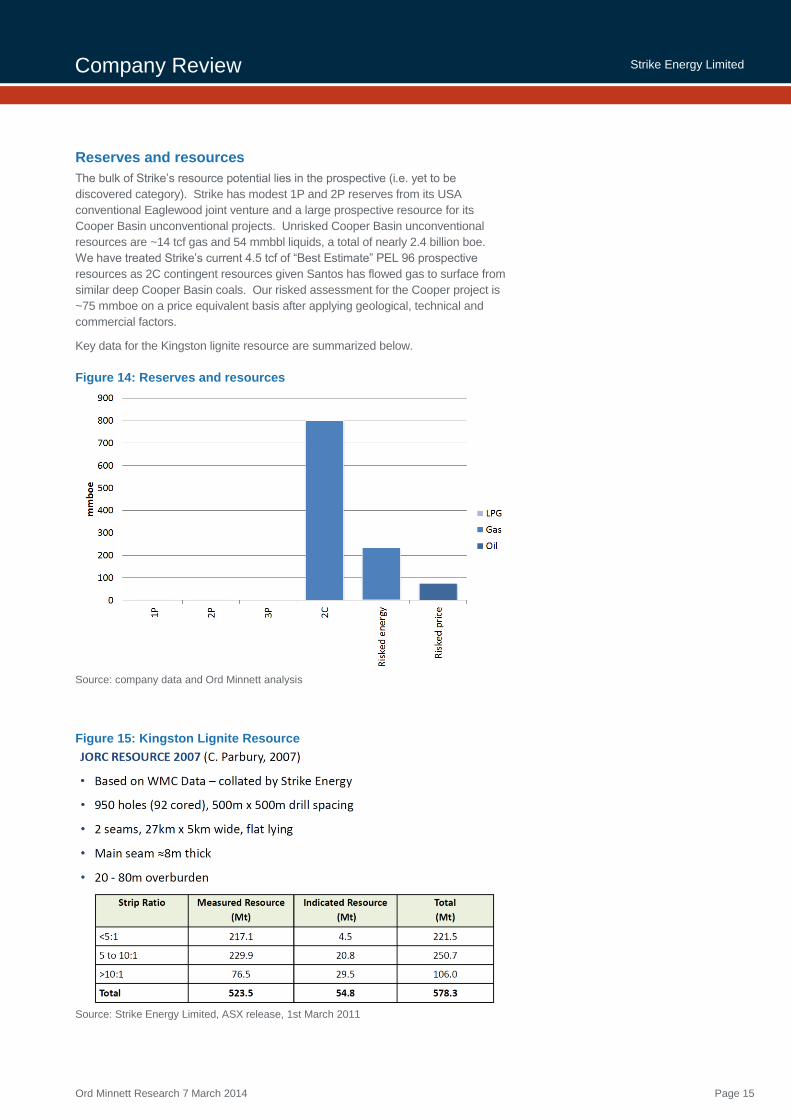
USA unconventional: Permian Basin
Strike has a 25% interest in the Permian Basin Joint Venture covering a 170,000
acre area of mutual interest (AMI) within the Midland Sub-Basin with Torch Energy,
a privately held Houston-based company. The Joint Venture’s first acquisition, the
MB Clearfork Project, covers 7,500 gross acres (1,875 acres net to Strike) with
existing conventional oil production and reserves and upside from the Lower
Clearfork Shale, estimated to contain original-oil-in-place (OOIP) of 180 kbbl/acre.
The project currently produces ~25-30 boepd net to Strike.
Encouraging results were obtained from the MBCU #16 well drilled in 2012 and the
MBCU #17 well drilled in 2nd
half 2013. The MBCU #17 well was completed in the
Middle Clearfork carbonate zone. A third vertical well is planned to test the Lower
Clearfork Shale section, with drilling expected to commence by the end of March.
Ord Minnett Research 7 March 2014 Page 11
Company Review
Strike Energy Limited
USA conventional
Eaglewood JV (Louise field)
Strike has a 40% working interest in the 704 gross acre (282 net acres) Louise
gas-condensate field in Wharton County, Texas operated by Cypress E&P
Corporation, a private company based in Austin, Texas. The Louise Gardner-
Duncan-1 well, drilled and completed in April 2010, continues to produce gas and
condensate at ~180 boepd net to Strike. The field is in the early stages of natural
decline. The existing 2.5 bcf of 2P reserves (net, after royalties basis) should be
producible from the current well.
MB Clearfork
Strike has a 25% working interest (reducing to 18.75% after project payout) in the
conventional portion of the MB Clearfork project in Texas. No further
development of the conventional resources is planned at this time.
St Landry Canyon
Strike has a 10% working interest in 37,000 gross acres (3,700 net acres) in
onshore Louisiana. The primary targets are deep (18,000 ft, 5,500 m) Wilcox wet
gas prospects (15-30 bbl/mmscf). The first well drilled in August 2011 did not
encounter commercial hydrocarbons. No further exploration is planned at this
time.
Tigre Lagoon
Strike had a 15% working interest in a large (~100 bcf) conventional gas prospect
in onshore Louisiana, but elected not to participate given the cost (~$4m net to
Strike) and risk following 3D seismic analysis. The ~19,000 ft (5,800 m) well is
likely to take six months to drill and cost ~$US20m to drill and a further $14m to
complete.
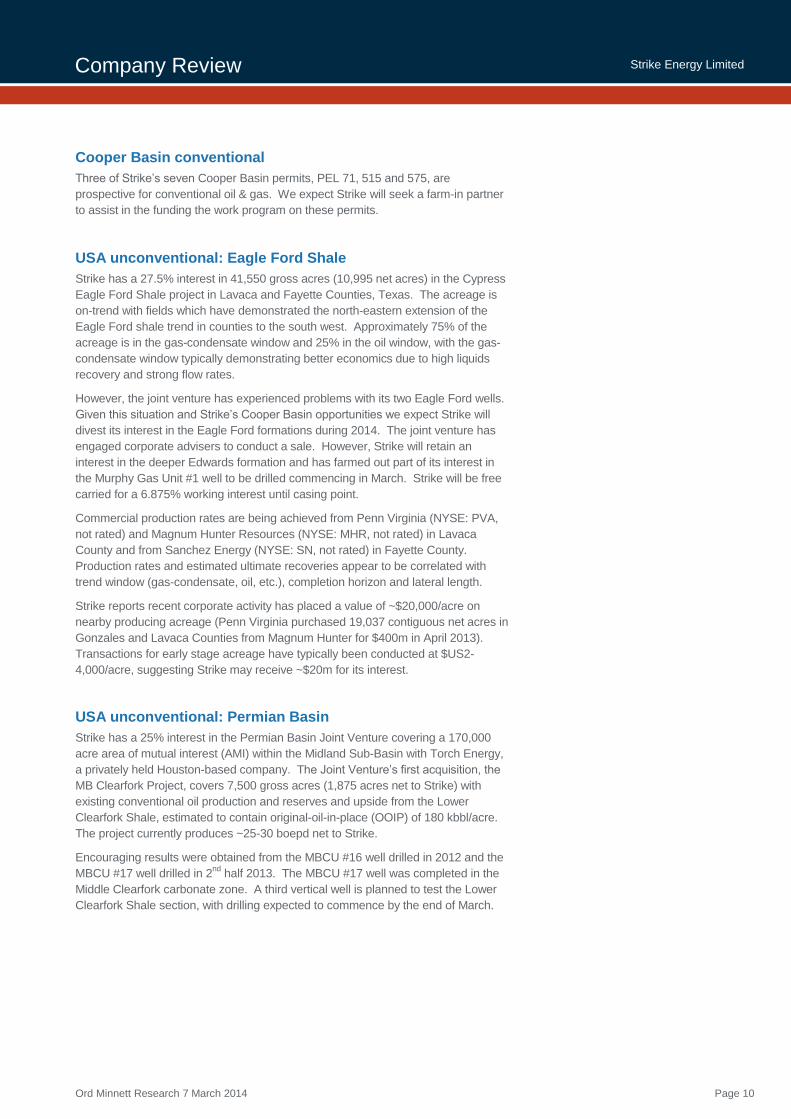
Carnarvon Basin
Strike has a 44% working interest on average in five permits in the offshore
Carnarvon Basin in Western Australia totalling 1,200 km2 (net to Strike). The WA-
460P permit is adjacent to the WA-384-P permit in which Shell recently drilled the
13.5 tcf Palta gas prospect. Strike had estimated that ~20% of the prospect
extended into Strike’s permit, however the well did not encounter commercial
hydrocarbons and was plugged and abandoned. The permits also include the
small (16 bcf) undeveloped Rivoli gas discovery. A $3.5m sale of four of the
permits (excluding WA-460P) to Torrens Energy Limited (ASX: TEY, not rated)
announced in April 2013 did not proceed. We expect Strike will continue to seek
to divest these permits, or relinquish its interest if divestment is not achieved.
Kingston Lignite Project
Strike has a 100% working interest in a 578 Mt JORC-compliant lignite resource
near Kingston, South Australia in PEL 127 / EL 4576. The resource, discovered
in 1979, is suitable for conventional open cut mining and test work indicates that
the lignite can be gasified to deliver good quality syngas. Approximately $40m (in
today’s dollar terms) has been spent on exploration and appraisal work by
previous owners and Strike. Strike is currently seeking a partner to advance the
project. We believe the project has a high degree of commercial risk and is likely
to face community and environmental opposition.
Ord Minnett Research 7 March 2014 Page 12
Company Review
Strike Energy Limited
Figure 6: Carnarvon Basin
Source: Strike Energy Limited, investor presentation, 22
nd July
2013, p12
Figure 7: US Gulf Coast
Source: Strike Energy Limited, website accessed 5
th August 2013
Figure 8: Eagle Ford Shale
Source: Strike Energy Limited, investor presentation, 22
nd July
2013, p 16
Figure 9: Permian Basin
Source: Strike Energy Limited, website, accessed 5
th August 2013

Ord Minnett Research 7 March 2014 Page 13
Company Review
Strike Energy Limited
Figure 10: Kingston Lignite
Source: Roadmap for Unconventional Gas Projects in South Australian, 12
th December 2012, Chapter 4, pp. 127-128
Figure 11: Kingston Lignite properties

Ord Minnett Research 7 March 2014 Page 14
Company Review
Strike Energy Limited
Key activities
Key activities for the next 18 months involve:
Initial production testing of the two Southern Cooper Basin wells,
Establishing 2P reserves (>200 PJ gross threshold for Stage 1 field
development FID) in the Southern Cooper Basin project, and
Divesting the Eagle Ford shale project.
Figure 12: Near term work program
Source: Strike Energy Limited, investor presentation, 27
th February 2014, p 17.
Figure 13: Southern Cooper development timeline
Source: Strike Energy Limited, investor presentation, 27
th February 2014, p 18.
Ord Minnett Research 7 March 2014 Page 15
Company Review
Strike Energy Limited
Reserves and resources
The bulk of Strike’s resource potential lies in the prospective (i.e. yet to be
discovered category). Strike has modest 1P and 2P reserves from its USA
conventional Eaglewood joint venture and a large prospective resource for its
Cooper Basin unconventional projects. Unrisked Cooper Basin unconventional
resources are ~14 tcf gas and 54 mmbbl liquids, a total of nearly 2.4 billion boe.
We have treated Strike’s current 4.5 tcf of “Best Estimate” PEL 96 prospective
resources as 2C contingent resources given Santos has flowed gas to surface from
similar deep Cooper Basin coals. Our risked assessment for the Cooper project is
~75 mmboe on a price equivalent basis after applying geological, technical and
commercial factors.
Key data for the Kingston lignite resource are summarized below.
Figure 14: Reserves and resources
Source: company data and Ord Minnett analysis
Figure 15: Kingston Lignite Resource
Source: Strike Energy Limited, ASX release, 1st March 2011
Ord Minnett Research 7 March 2014 Page 16
Company Review
Strike Energy Limited
Cooper Basin CSG versus shale gas
Unconventional play exposure
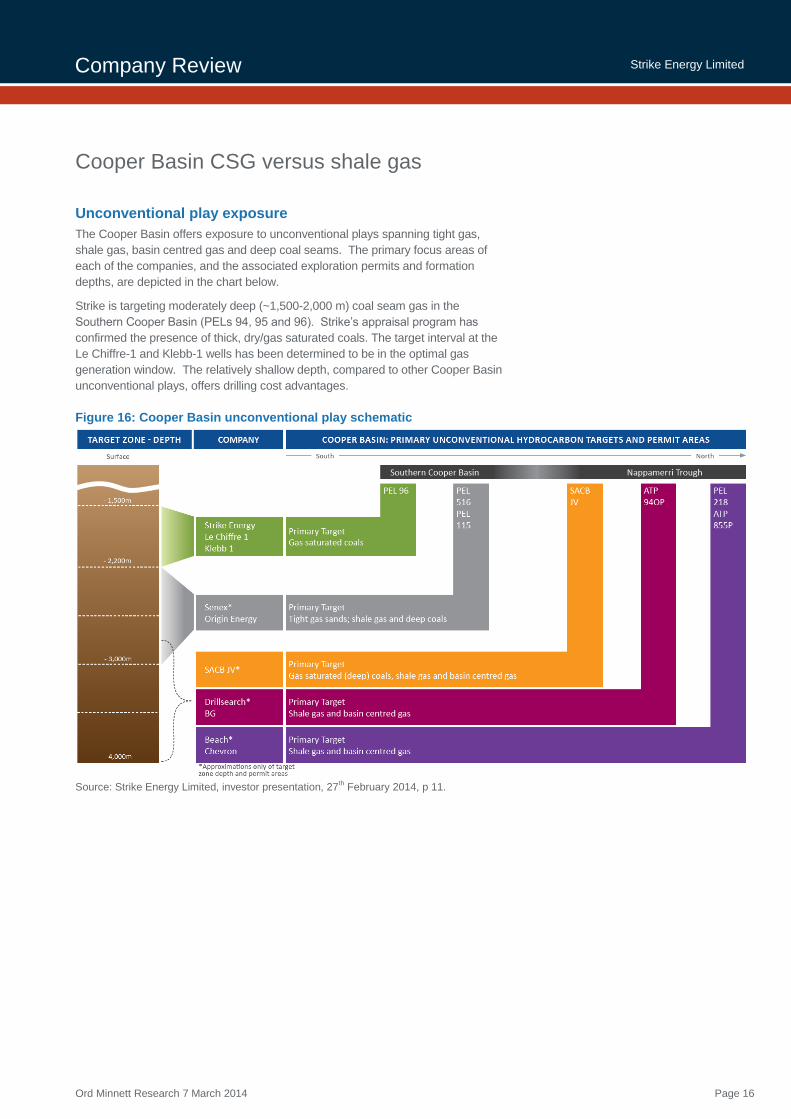
The Cooper Basin offers exposure to unconventional plays spanning tight gas,
shale gas, basin centred gas and deep coal seams. The primary focus areas of
each of the companies, and the associated exploration permits and formation
depths, are depicted in the chart below.
Strike is targeting moderately deep (~1,500-2,000 m) coal seam gas in the
Southern Cooper Basin (PELs 94, 95 and 96). Strike’s appraisal program has
confirmed the presence of thick, dry/gas saturated coals. The target interval at the
Le Chiffre-1 and Klebb-1 wells has been determined to be in the optimal gas
generation window. The relatively shallow depth, compared to other Cooper Basin
unconventional plays, offers drilling cost advantages.
Figure 16: Cooper Basin unconventional play schematic
Source: Strike Energy Limited, investor presentation, 27
th February 2014, p 11.

Ord Minnett Research 7 March 2014 Page 17
Company Review
Strike Energy Limited
Technical comparison
Strike believes the Southern Cooper coal formations can be appraised and
developed for approximately one quarter of the cost (per unit of gas recovered) of
Cooper shale projects, due to the shallower and less demanding conditions.
Strike’s work suggests that the in-place gas content of Southern Cooper CSG is
similar to Cooper Basin shale at 30-50 bcf/km2. This is significantly higher than the
shallower CSG formations being developed in Queensland’s Surat and Bowen
Basins (at 5-10 bcf/km2).
Our analysis comparative project economics is summarized on the following page.
Figure 17: CSG vs. shale technical comparison
Figure 18: Well productivity comparison
Source: Strike Energy Limited, 2012 AGM presentation, 21
st November 2012, pp. 13-14

Ord Minnett Research 7 March 2014 Page 18
Company Review
Strike Energy Limited
Figure 19: Comparative unrisked NPV per unit of gas
Source: Ord Minnett analysis. 12% nominal discount rate. After tax basis.
Table 4: Comparative cost structure for notional 1000 PJ gas projects
Source: Ord Minnett analysis.
Notes:
- Life cycle costs, real Dec-2013 $ basis.
- Cooper Shale Gas assumes 11 bbl liquids/mmscf raw gas; Cooper Dry Shale Gas assumes zero liquids
- 1000 PJ gas, drilling commences Jan 2014, first gas 2nd
half 2015, plateau from 2019 onwards
- Own gas plant. ~20% CO2 Southern Cooper CSG, 30% Cooper Shale, 5% Bowen CSG
- Shale gas well capex at 30% premium to US analogues
Units Southern Cooper
CSG
Cooper Shale
Gas
Cooper Dry
Shale Gas
Bowen Basin
CSG
Development assumptions
Number of new wells successful - 345 146 146 954
EUR well PJe 2.90 7.30 6.80 1.02
Peak production (6 mth avg) TJe/d 123.3 132.4 123.3 123.3
Well capex per successful well M$A 3.8 15.1 15.1 1.5
Total capex (excluding restoration) M$A 1,839 2,713 2,635 1,771
Performance measures
IRR (after tax) % 19.9 15.8 13.1 18.0
Profitability Index (=1+NPV/PV capex) - 1.3 1.2 1.0 1.2
DCF Payback period years 11.5 11.5 21.5 11.5
NPV/well (unrisked) M$A/well 0.59 0.90 0.23 0.16
NPV/resource (unrisked) $A/GJ 0.20 0.12 0.03 0.16
Cost structure (real Dec-13 $) $A/GJ
Revenue $A/GJ 6.32 7.08 6.31 6.32
Capex $A/GJ 1.66 2.22 2.31 1.58
Cash opex $A/GJ 1.52 1.51 1.46 1.71
Royalties $A/GJ 0.59 0.66 0.57 0.58
Taxes $A/GJ 1.24 1.29 0.92 1.17
Total cost (inc. taxes) $A/GJ 4.42 5.02 4.69 4.45
Net cash (after royalties, before tax) $A/GJ 4.21 4.91 4.28 4.03
NPAT $A/GJ 1.31 1.40 1.05 1.28

Ord Minnett Research 7 March 2014 Page 19
Company Review
Strike Energy Limited
Southern Cooper project development concept
Strike’s planned development concept involves the drilling of five deviated wells
from each drilling pad, with each of the wells intersecting over 50 net metres of
Patchawarra coals, with an expected ultimate recovery of ~3 PJ/well.
This is 50 to 100% more than the 1.5-2.0 PJ of gas that Strike estimates it needs to
recover to break even (based on a $6/GJ price for sales gas delivered into the
MAPS pipeline and drilling and completion costs of $3.5m per well Strike).
Figure 20: Southern Cooper development concept
Source: Strike Energy Limited, investor presentation, 27
th February 2014, p 12

Ord Minnett Research 7 March 2014 Page 20
Company Review
Strike Energy Limited
Valuation model
Methodology
Risk adjusted DCF: We have valued Strike using discounted cash flow analysis for
projects for which sufficient data are available and enterprise value (EV) to area or
EV to resource metrics for exploration prospects and early stage appraisal projects.
We apply a risk factor for each project based on our assessment of the project’s
technical and commercial maturity. We compare resources based on an energy
price equivalent basis, rather than an energy thermal equivalent basis, to better
account for the value differences between liquids and gas prospects.
Simulation model: Our investment model incorporates probability distributions for
key variables (such as reserves, commodity prices and exploration outcomes) and
uses Monte Carlo simulation to quantify the range of share price outcomes.
Long run commodity prices: Our valuation assumes a long run Brent oil price of
$US90/bbl real, USD/AUD exchange rate of 0.80 and 12% nominal discount rate.
We assume the following received price differentials:
Australia: Cooper Basin crude oil: Brent plus $US3/bbl quality and location
premium, less transport; Condensate: North West Shelf Condensate (~95%
of Brent), less transport; LPG: Saudi Contract Price, less processing fee; and
natural gas: ~$A2.90/GJ field gate, increasing to ~$A6.00/GJ from 2015
following the commencement of industry LNG exports.
USA: Crude oil and condensate: Texas (WTI) & Louisiana (LLS), less $US3-
7/bbl transport; NGLs: 33% of crude price; natural gas: Henry Hub:
$US3.20/mmBtu in FY13, rising to $US4.70/mmBtu in real dollar terms by
2017.
The Orica gas prepayment of $52.5m for 150 PJ gas is equivalent to
~$0.35/GJ. Applying a similar multiple to the Orora (30 PJ) and Austral
Bricks (12.5 PJ) gas supply agreements suggests further prepayments of
~$15m.
Fiscal terms: Strike’s Southern Cooper Project will incur a state royalty of 10% and
will pay an effective tax rate of 58% once PRRT (Petroleum Resources Rent Tax)
applies, based on the current corporate income tax rate of 30%. The state royalty is
deductible for PPRT.
Strike’s US projects in Texas incur a mineral owner royalty of 25% of gross
wellhead revenue, plus a state severance tax of 7.5% on gas revenues and 35%
federal income tax. Louisiana projects will incur gross wellhead royalties of 28%,
plus a state severance tax of 12.5% on oil and $US0.16/mscf for gas and NGLs in
addition to federal tax.
Petroleum Resources Rent Tax (PRRT) is levied at 40%. PRRT is deductible for
income tax purposes and is recognised as an income tax under AASB 112 'Income
Taxes'. From 1 July 2012, the existing PRRT regime was extended to all Australian
petroleum production sourced from projects located onshore and in territorial
waters. On transition to the extended PPRT regime, a starting tax base is available
to be deducted against the relevant project profits, giving rise to a potential deferred
tax asset. Strike, unlike other operators in the Cooper Basin, did not apply to the
Minister of Resources and Energy for a combination certificate to treat a list of
petroleum licences as a single project for PRRT purposes, given Strike’s limited
previous expenditure.
Ord Minnett Research 7 March 2014 Page 21
Company Review
Strike Energy Limited
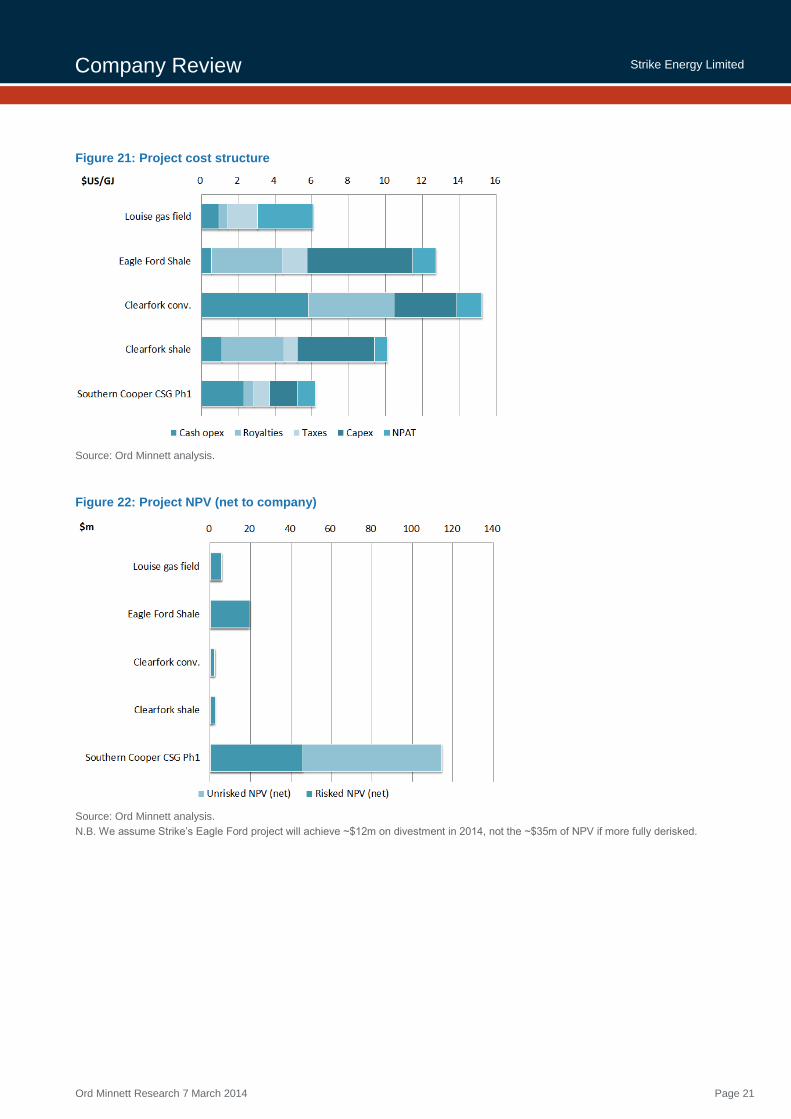
Figure 21: Project cost structure
Source: Ord Minnett analysis.
Figure 22: Project NPV (net to company)
Source: Ord Minnett analysis.
N.B. We assume Strike’s Eagle Ford project will achieve ~$12m on divestment in 2014, not the ~$35m of NPV if more fully derisked.

Ord Minnett Research 7 March 2014 Page 22
Company Review
Strike Energy Limited
Project assumptions
Our primary project assumptions are summarized below. Our valuation of USA
conventional and unconventional projects and Southern Cooper CSG is based on
DCF analysis. Other projects are based on resource or area metrics. We have
valued Strike’s Eagle Ford shale project interest on recent transaction metrics,
described in Appendix 3.
Table 5: Project assumptions
Project Assumptions
USA conventional o Louise gas field: DCF model. 2P reserves produced from single existing well.
o MB Clearfork: DCF model. 1P (PDP) reserves from 19 existing wells.
Eagle Ford shale o DCF model. ~300 gross well sites @ 120 acre spacing (41,550 gross acres) 27.5% STX
o 450-550 kboe/well, 2200 scf/bbl, 1.25 mmBtu/kscf.
o $10m to drill/complete (over-pressured reservoir), ~20% EUR in first year.
o 2 wells CY13, 4-8 wells CY15, full field development CY16+
o Opex k$US6/month/well + $US0.50/mmBtu
o Strike divests 2H CY14. Transaction metric based on $US1,000/acre => $A12m after tax
Permian Basin unconventional
(Clearfork)
o ~190 gross well sites @ 40 acre spacing.
o 125-175 kboe/well, 3600 scf/bbl, 1.4 mmBtu/kscf.
o $2.5m to drill/complete. IP30 ~125 boepd.
o 2 wells CY13, 5-10 wells CY14, full field development CY15+
o Opex k$US6/month/well + $US0.50/mmBtu
o Strike divests CY15 after proof-of-concept is demonstrated.
Southern Cooper CSG
(Phase 1)
o Phase 1 area gross gas resource of 1840 PJ (1227 PJ net to Strike). 70% conversion to 2P
o 5 wells per well pad, 600 acre spacing per pad (120 acres per well).
o $3.5m/well to drill/complete. EUR 2.9 PJ/well (after deducing 12-20% CO2), 2.2 TJ/d IP
o ~$1.00/GJ gas gathering, 3rd
party processing and compression
o ~$1.20/GJ field opex and overheads.
o 2 appraisal wells FY14, 6 pilot wells late CY14, FID Stage 1 field development late CY15.
o Strike retains 66.7% interest.
Southern Cooper CSG (Phase 2+)
o Resource multiple valuation, based on Phase 1 NPV value.
o 21,822 bcf gross per 19th
September 2012 resource estimate less Phase 1 development
o 20% assumed CO2, 50% net interest (PEL 94/95/96), 50% conversion to reserves
o (21,822*(1-0.2)*0.99*1.0551*50%-1,227)*50% = 3,945 PJ * $0.15/GJ * 10% risk = ~$60m.
Cooper Basin shale gas
o Area multiple valuation
o 2,198 km2 gross permit area (PEL 94/95), ~44% average net interest
o Value at $140-550/acre for Cooper Basin shale transactions => $33-132 net.
Kingston Lignite o 587 Mt JORC resource (523.5 Mt Measured, 54.8 Mt Inferred)
o $0.10/t EV/thermal coal resource multiple after adjusting for calorific value (Newcastle
standard thermal coal 6,080 kcal/kg Net As Received (6,300 kcal/kg GAR); Kingston lignite
22.7 MJ/kg (dry basis) = ~2500 kcal/kg GAR).
o 10% risk factor (for technical and commercial maturity, likely community opposition).
Carnarvon Basin o $3.5m upper value based on recent farm-out proposal (which did not complete).
o No value ascribed to WA 460P following the recent Palta-1 outcome (P&A’d).
Source: company data and Ord Minnett estimates
Ord Minnett Research 7 March 2014 Page 23
Company Review
Strike Energy Limited
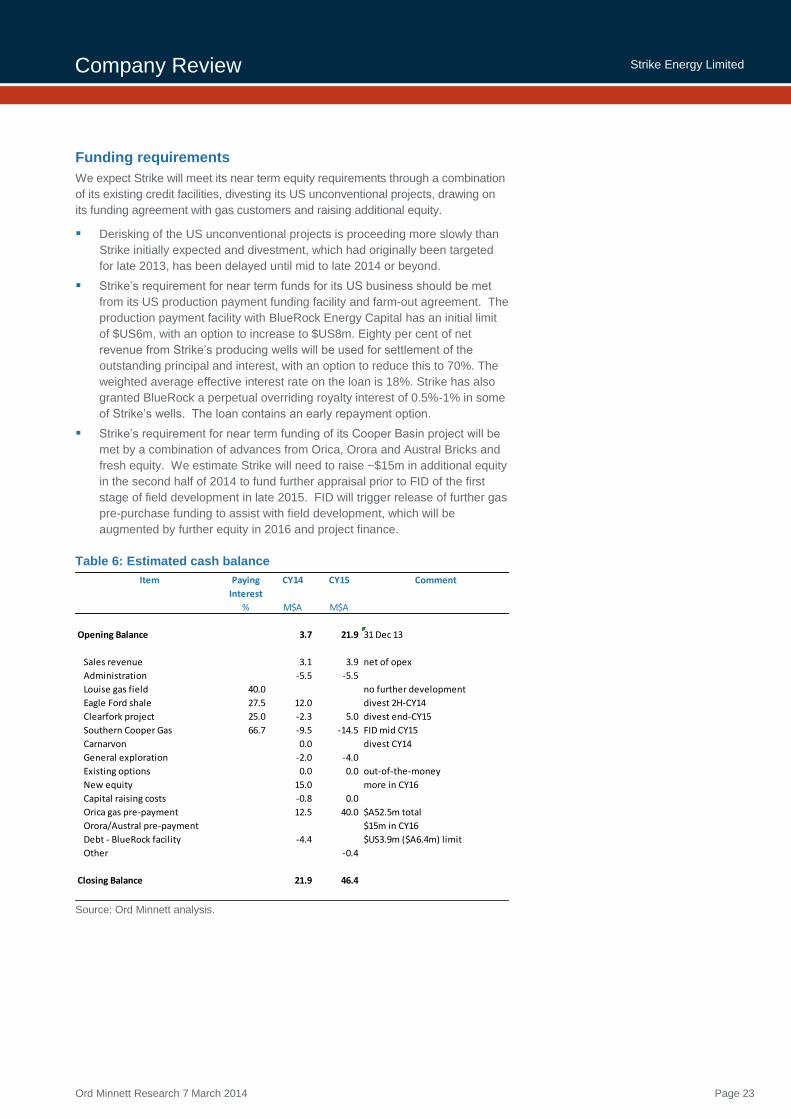
Funding requirements
We expect Strike will meet its near term equity requirements through a combination
of its existing credit facilities, divesting its US unconventional projects, drawing on
its funding agreement with gas customers and raising additional equity.
Derisking of the US unconventional projects is proceeding more slowly than
Strike initially expected and divestment, which had originally been targeted
for late 2013, has been delayed until mid to late 2014 or beyond.
Strike’s requirement for near term funds for its US business should be met
from its US production payment funding facility and farm-out agreement. The
production payment facility with BlueRock Energy Capital has an initial limit
of $US6m, with an option to increase to $US8m. Eighty per cent of net
revenue from Strike’s producing wells will be used for settlement of the
outstanding principal and interest, with an option to reduce this to 70%. The
weighted average effective interest rate on the loan is 18%. Strike has also
granted BlueRock a perpetual overriding royalty interest of 0.5%‐1% in some
of Strike’s wells. The loan contains an early repayment option.
Strike’s requirement for near term funding of its Cooper Basin project will be
met by a combination of advances from Orica, Orora and Austral Bricks and
fresh equity. We estimate Strike will need to raise ~$15m in additional equity
in the second half of 2014 to fund further appraisal prior to FID of the first
stage of field development in late 2015. FID will trigger release of further gas
pre-purchase funding to assist with field development, which will be
augmented by further equity in 2016 and project finance.
Table 6: Estimated cash balance
Source: Ord Minnett analysis.
Item Paying CY14 CY15 Comment
Interest
% M$A M$A
Opening Balance 3.7 21.9 31 Dec 13
Sales revenue 3.1 3.9 net of opex
Administration -5.5 -5.5
Louise gas field 40.0 no further development
Eagle Ford shale 27.5 12.0 divest 2H-CY14
Clearfork project 25.0 -2.3 5.0 divest end-CY15
Southern Cooper Gas 66.7 -9.5 -14.5 FID mid CY15
Carnarvon 0.0 divest CY14
General exploration -2.0 -4.0
Existing options 0.0 0.0 out-of-the-money
New equity 15.0 more in CY16
Capital raising costs -0.8 0.0
Orica gas pre-payment 12.5 40.0 $A52.5m total
Orora/Austral pre-payment $15m in CY16
Debt - BlueRock facility -4.4 $US3.9m ($A6.4m) limit
Other -0.4
Closing Balance 21.9 46.4

Ord Minnett Research 7 March 2014 Page 24
Company Review
Strike Energy Limited
Valuation model
Production
Production declines modestly in the early years due to natural decline from
the Louise gas field, before building strongly from 2017 once Phase 1 of the
Southern Cooper CSG project comes on-line.
Product mix is approximately 20-30% liquids in the early years, and then
effectively 100% gas following start-up of the Southern Cooper CSG project.
Income statement
Revenue is relatively flat at $5-7m in the early years, before growing strongly
from 2017, building to over $200m by 2020.
EBITDA grows strongly from 2017 driven by Southern Cooper CSG
production.
Normalized NPAT is negative in the early years before building from 2017 to
over $70m by 2020.
NPAT is negative in the early years, with impairment of oil and gas assets.
Cash flow statement
Operating cash flow remains negative in the early years, until building
strongly from 2017, to over $100m per year from 2020. “Other operating
cash flow” includes the gas sales agreement prepayments from Orica, Orora
and Austral Bricks.
Capex is substantial, growing from ~$13m in FY14 to over $50m by 2017
and $70m from 2020, associated with Phase 1 development of the Southern
Cooper CSG project.
Other investing items include the assumed divestment of Strike’s Eagle
Ford assets in late 2014 and Permian Basin assets in 2015.
Financing cash flow includes assumed equity raisings in FY15 and FY16
and debt in FY17 and FY18 to develop Phase 1 of the Southern Cooper CSG
project.
Balance sheet
Cash fluctuates due to project development requirements. Cash builds after
2020 once the bulk of the Phase 1 development is completed.
Net debt increases during FY17 and FY18 before being paid down with
increasing operating cash flows late in the decade.
Financial ratios
EBITDA margin rises to ~$18/boe once production commences from the
Southern Cooper Gas project.
Interest cover rises to 6-7 times by around 2020.
Price to earnings ratio drops to ~2.5 times by 2020.

Ord Minnett Research 7 March 2014 Page 25
Company Review
Strike Energy Limited
Production and revenue
Production Sales revenue
PRODUCTION units FY12A FY13A FY14E FY15E FY16E FY17E FY18E FY19E FY20E FY21E
Production by project
Louise gas field mmboe 0.1 0.1 0.1 0.1 0.1 0.1 0.0 0.0 0.0 0.0
Eagle Ford Shale mmboe - 0.0 0.0 0.0 - - - - - -
Clearfork conv. mmboe 0.0 0.0 0.0 0.0 0.0 - - - - -
Clearfork shale mmboe - 0.0 0.0 0.0 0.0 - - - - -
Southern Cooper CSG Ph1 mmboe - - 0.0 0.0 0.0 0.0 1.9 2.7 4.1 4.9
Southern Cooper CSG mmboe - - - - - - - - - -
Cooper Shale Gas mmboe - - - - - - - - - -
Cooper Dry Shale Gas mmboe - - - - - - - - - -
Bowen Basin CSG mmboe - - - - - - - - - -
Tigre Lagoon mmboe - - - - - - - - - -
Total mmboe 0.2 0.1 0.1 0.1 0.1 0.1 2.0 2.7 4.1 4.9
Total production kboed 0.42 0.36 0.31 0.32 0.26 0.14 5.43 7.43 11.22 13.38
Production growth % -14.1 -13.3 2.8 -20.5 -45.0 3,746.2 36.9 51.0 19.3
PRICES & REVENUE nominal $ FY12A FY13A FY14E FY15E FY16E FY17E FY18E FY19E FY20E FY21E
Price markers
Forex (period average) $US/$A 1.03 1.03 0.90 0.88 0.83 0.80 0.80 0.80 0.80 0.80
WTI $US/bbl 95 92 102 96 91 91 93 95 97 100
Brent $US/bbl 113 109 109 102 97 97 99 101 103 105
Nat Gas (Henry Hub) $US/mmBtu 3.0 3.2 3.8 4.4 4.9 5.1 5.2 5.3 5.4 5.5
Nat Gas (NE Australia) $A/GJ 3.9 4.3 5.7 7.1 7.3 7.3 7.5 7.6 7.8 7.9
LNG $US/mmBtu 16.7 16.1 16.2 15.2 14.6 14.5 14.8 15.1 15.4 15.8
Qld average RRP $A/MWh 9 12 16 16 20 20 21 21 22 22
Received prices
Oil $US/bbl 90 88 98 94 89 - - - - -
Condensate $US/bbl 103 98 98 90 86 85 87 89 91 93
Gas $US/mmBtu 3.0 3.2 3.7 3.8 4.2 5.1 5.3 5.6 5.8 6.0
LPG $US/bbl - - - - - - - - - -
LNG $US/t - - - - - - - - - -
Electricity $US/MWh - - - - - - - - - -
Total 28 34 40 43 41 33 31 32 34 35
Revenue
Oil M$A 1 1 2 3 2 - - - - -
Condensate M$A 1 2 1 1 0 0 0 0 0 0
Gas M$A 2 2 2 2 2 2 76 110 174 213
LPG M$A - - - - - - - - - -
LNG M$A - - - - - - - - - -
Electricity M$A - - - - - - - - - -
Total modelled M$A 4 4 5 6 5 2 76 110 174 213
Total reported M$A 5 5 - - - - - - - -
Source: company data and Ord Minnett forecasts $A currency unless otherwise noted. Nominal $ basis. Year ending June.
-
1.0
2.0
3.0
4.0
5.0
6.0
2012
2013
2014
2015
2016
2017
2018
2019
2020
2021
mmboe Electricity LNG LPG GasCondensate Oil Act/Target
-
50
100
150
200
250
2012
2013
2014
2015
2016
2017
2018
2019
2020
2021
$m Electricity LNG LPG Gas Condensate Oil

Ord Minnett Research 7 March 2014 Page 26
Company Review
Strike Energy Limited
Financial Statements
Earnings Cash flow
INCOME STATEMENT M$A FY12A FY13A FY14E FY15E FY16E FY17E FY18E FY19E FY20E FY21E
Sales revenue 5 5 5 6 5 2 77 110 174 213
Other revenue 1 2 - - - - - - - -
COGS & opex -8 -7 -7 -8 -7 -6 -43 -58 -88 -106
Other 0 3 - - - - - - - -
EBITDA -2 3 -2 -2 -2 -4 34 52 86 107
Depreciation and Amortization -13 -13 -1 -2 -3 -1 -3 -5 -8 -13
EBIT -15 -11 -3 -4 -5 -5 31 46 78 94
Net Interest Expense 0 0 -1 -3 -2 -2 -7 -12 -13 -13
EBT -14 -11 -4 -6 -7 -7 24 35 65 81
Tax expense - 0 -0 1 -1 -0 -0 -0 -18 -24
Minorities / prefered dividends - - - - - - - - - -
Normalized NPAT -14 -10 -4 -5 -8 -7 24 34 46 56
Abnormals -0 -4 - 7 -2 - - - - -
Reported NPAT -14 -14 -4 2 -10 -7 24 34 46 56
Effective tax rate % 0.0 8.4 0.0 41.0 0.0 0.0 0.3 0.2 28.6 30.1
CASH FLOW STATEMENT M$A FY12A FY13A FY14E FY15E FY16E FY17E FY18E FY19E FY20E FY21E
EBITDA -2 3 -2 -2 -2 -4 34 52 86 107
Other operating items (tax, etc) 0 -3 9 5 56 1 -4 -4 -13 -27
Operating cash flow -2 -0 7 3 53 -3 29 47 73 80
PPE capex -0 -0 - - - - - - - -
Exploration capex -22 -10 -0 -4 -4 -4 -4 -4 - -
Development capex -3 -7 -7 -22 -19 -25 -46 -67 -69 -70
Other investing items 0 - 2 12 7 - - - - -
Investing cash flow -25 -17 -5 -14 -16 -29 -50 -71 -69 -70
Inc/(Dec) in Equity 40 - 9 14 19 - - - - -
Inc/(Dec) in Borrowings - 2 2 -2 - 20 32 -11 -11 -11
Dividends paid - - - - - - - - - -
Other financing items -0 - -0 -1 - - - - - -
Financing Cash Flow 40 2 11 10 19 20 32 -11 -11 -11
Net Inc/(Dec) in Cash 13.7 -15.1 12.7 -0.6 56.7 -11.6 11.6 -34.9 -6.8 -1.3
Free cash flow -26.3 -17.5 1.9 -10.9 37.7 -31.6 -20.1 -24.1 4.1 9.5
BALANCE SHEET M$A FY12A FY13A FY14E FY15E FY16E FY17E FY18E FY19E FY20E FY21E
Cash & cash equivalents 17 1 9 8 65 53 65 30 23 22
Other current assets 3 4 4 4 3 3 10 15 18 21
PPE, Exp & Dev 45 46 53 75 86 114 161 227 287 344
Other non-current assets 0 0 0 2 2 2 2 2 8 4
Total Assets 65 51 66 89 156 172 237 274 337 391
Short term debt - 3 1 1 1 5 11 9 7 4
Other current liabilities 4 1 1 1 1 1 4 5 19 36
Long term debt - 0 4 2 2 18 43 35 26 17
Other non-current liabilities 1 0 1 5 7 10 17 28 38 50
Total Liabilities 4 4 7 9 10 34 75 77 90 109
Minorities - - - - - - - - - -
Total Funds Employed 61 47 58 80 146 138 162 196 247 282
Debt - 3 5 3 3 23 54 44 33 22
Net debt -17 1 -4 -5 -62 -31 -10 14 10 0
Source: company data and Ord Minnett forecasts $A currency unless otherwise noted. Nominal $ basis. Year ending June.
-100
-80
-60
-40
-20
-
20
40
60
80
100
2012
2013
2014
2015
2016
2017
2018
2019
2020
2021
$m Financing Cash Flow Investing cash flowOperating cash flow Free cash flow
-50
-
50
100
150
200
250
2012
2013
2014
2015
2016
2017
2018
2019
2020
2021
$m Sales revenue EBITDA Normalized NPAT Abnormals

Ord Minnett Research 7 March 2014 Page 27
Company Review
Strike Energy Limited
Financial Analysis
Debt Funding
OPERATIONAL METRICS FY12A FY13A FY14E FY15E FY16E FY17E FY18E FY19E FY20E FY21E
EBITDA margin % -34.3 55.6 -44.8 -32.0 -50.2 -188.2 44.0 46.9 49.5 50.2
EBIT margin % -313.5 -232.8 -60.7 -62.4 -106.0 -236.8 40.5 42.1 44.6 44.0
Normalized NPAT margin % -307.1 -222.4 -80.0 -81.3 -163.3 -353.8 31.0 31.3 26.5 26.4
Revenue growth % -2.1 10.9 13.7 -19.0 -55.3 3,542.9 43.8 58.3 22.4
EBITDA growth % -258.6 -189.4 -18.7 27.0 67.5 -951.8 53.3 66.9 24.2
EBIT growth % -27.3 -71.1 16.8 37.6 -0.2 -722.7 49.5 67.8 20.8
Normalized ROA % -22.2 -20.0 -6.2 -5.3 -4.9 -4.3 10.0 12.6 13.7 14.4
Normalized ROE % -23.7 -21.7 -7.0 -5.9 -5.3 -5.4 14.6 17.5 18.7 20.0
VALUATION RATIOS FY12A FY13A FY14E FY15E FY16E FY17E FY18E FY19E FY20E FY21E
Fully diluted shares (end of period) 000,000 614.5 614.5 1,003.2 1,003.2 1,003.2 1,003.2 1,003.2 1,003.2 1,003.2 1,003.2
Weighted fully diluted shares 000,000 434.2 614.5 906.1 1,003.2 1,003.2 1,003.2 1,003.2 1,003.2 1,003.2 1,003.2
Share price (end of period) $/share 0.15 0.07 0.14 0.14 0.14 0.14 0.14 0.14 0.14 0.14
Market Cap M$A 92 45 135 135 135 135 135 135 135 135
Less Net Debt M$A -17 1 -4 -5 -62 -31 -10 14 10 0
Market EV M$A 76 47 132 130 73 105 125 149 145 136
EPS before abnormals c -3.3 -1.7 -0.5 -0.5 -0.8 -0.7 2.4 3.4 4.6 5.6
EPS growth % -49.9 -72.9 4.3 62.8 -3.2 -418.9 45.4 33.8 22.3
PER x -4.1 -8.1 -30.0 -28.7 -17.6 -18.2 5.7 3.9 2.9 2.4
Op Cash flow per share c -0.4 -0.1 0.8 0.3 5.3 -0.3 2.9 4.7 7.3 8.0
Price / Op Cash flow x -37.1 -227.3 17.2 39.7 2.5 -52.4 4.6 2.9 1.9 1.7
EV/EBITDA (n.b. future EV) x -73.8 53.5 -57.7 -70.0 -31.1 -26.5 3.7 2.9 1.7 1.3
LEVERAGE FY12A FY13A FY14E FY15E FY16E FY17E FY18E FY19E FY20E FY21E
Net Debt / Book Equity % -27 3 -6 -7 -43 -22 -6 7 4 0
Net Debt / (ND+Book Equity) % -37 3 -6 -7 -74 -28 -7 6 4 0
Net Debt / Total Assets % -25 2 -5 -6 -40 -18 -4 5 3 0
EBIT Interest cover x - - -3.5 -1.4 -3.0 -2.1 4.3 3.9 5.9 7.1
Debt / Free Cash Flow x - -0.2 2.7 -0.2 0.1 -0.7 -2.7 -1.8 8.0 2.3
MARGIN ANALYSIS real $ FY12A FY13A FY14E FY15E FY16E FY17E FY18E FY19E FY20E FY21E
Revenue/boe $A/boe 41 53 44 48 48 38 35 36 37 37
Opex/boe $A/boe 52 33 64 63 72 110 20 19 19 19
EBITDA margin/boe $A/boe -11 20 -20 -15 -24 -72 15 17 18 19
D&A/boe $A/boe 88 102 7 15 27 18 1 2 2 2
Tax and financing/boe $A/boe -2 -4 9 9 27 44 3 4 7 7
Cash margin % -26 37 -45 -32 -50 -188 44 47 49 50
EBIT margin % -241 -156 -61 -62 -106 -237 40 42 45 44
NPAT margin % -236 -207 -80 38 -205 -354 31 31 26 26
Resource to production ratio years 955.6 1,114.3 1,283.7 1,248.1 1,563.9 2,851.3 73.6 53.0 34.1 28.3
Product mix (liquids % of total) % 13 21 25 30 26 7 0 0 0 0
Source: company data and Ord Minnett forecasts $A currency unless otherwise noted. Nominal $ basis. Year ending June.
-
2.0
4.0
6.0
8.0
10.0
12.0
14.0
16.0
18.0
20.0
-
10
20
30
40
50
60
70
2012
2013
2014
2015
2016
2017
2018
2019
2020
2021
x$mDebt Net cashNet Debt / (ND+Book Equity) EBIT Interest cover
-
10
20
30
40
50
60
70
-20
-10
-
10
20
30
40
50
2012
2013
2014
2015
2016
2017
2018
2019
2020
2021
Cash ->
$mDividends paid Inc/(Dec) in BorrowingsInc/(Dec) in Equity Cash & cash equivalents
Ord Minnett Research 7 March 2014 Page 28
Company Review
Strike Energy Limited
Corporate overview
Board
Mark Carnegie, BA and a BSc (Hons), Chairman
Mark Carnegie has over 30 years’ experience as an entrepreneur, investor and
corporate adviser in New York, London and Sydney. He was a principal of
Carnegie, Wylie & Company before the acquisition by Lazard Limited and was
previously the CEO of Lazard Australia Private Equity Pty Ltd. He established M.H.
Carnegie & Co. Pty Ltd in 2010, a venture capital and private equity firm. Mark is a
Director of Macquarie Radio Network Ltd, Chandler Macleod Group Limited and a
large number of private companies. He was appointed Non-Executive Director on
9th August 2013 and Chairman 19th August 2010
David Wrench, B Eng (Mining) Hons, Managing Director
David Wrench has worked in Australia and North America with Macquarie Bank,
Credit Suisse and Chase Manhattan Bank in the precious metals, base metals and
energy sectors. David was a co-founder and director of CH4 Gas Limited. He was
appointed to the Board on 29 October 1998 and assumed the role of Managing
Director on 1 October 2011.
Tim Clifton, BSc (Hons), Non-Executive Director
Tim Clifton has over 40 years mining and corporate experience as a geologist and
company director. He was appointed to the Board on 13 August 2008 and
appointed Chairman on 19 August 2010. He stood down as Chairman on 11th
September 2013.
Simon Ashton, B Sc (Hons) M Sc MBA, Non-Executive Director
Simon Ashton has over 30 years’ experience in the Australian and international
petroleum and resources industries. He established Western Mining Corporation’s
USA petroleum subsidiary, Greenhill Petroleum, co-founded Strike Energy in 1997
and served as MD until September 2011.
Tim Goyder, Non-Executive Director
Tim Goyder has over 30 years’ experience in the natural resources industry and
has been involved in the formation and management of a number of publicly listed
companies. He is currently the chairman of Chalice Gold Mines Limited and
Liontown Resources Limited, and a director of Uranium Equities Limited. Tim was
appointed a director on 19 August 2010.
David L Baker BA, LL.B (Hons), Non-Executive Director
David Baker is a lawyer with experience in structured debt, utility financing, project
finance and mergers and acquisitions as an adviser, lender and principal in
Australia and Singapore. He was previously Executive Director of Gryphon
Partners, a corporate advisory house focused on the resources industry and a
senior executive in the resources team at Standard Chartered Bank. He conducts
his own corporate advisory business and, in that capacity, provides consulting
services to Strike Energy. David was appointed as a Non-Executive Director on 11
August 2013.

Ord Minnett Research 7 March 2014 Page 29
Company Review
Strike Energy Limited
Management
David Wrench, B Eng (Mining) Hons, Managing Director
As above.
Ben Thomas, B Sc (Petroleum Engineering), Executive Director
Ben Thomas joined Strike in mid-2010 and is the Company’s President of US
Operations. Prior to joining Strike, Ben had over 40 years upstream petroleum
sector experience with Mobil Oil Corporation, Superior Oil Company, Mark
Producing, Edisto Resources and Hall-Houston Oil Company. He was appointed a
Director on 29 September 2011
Sean McGuinness, B Comm, Chief Financial Officer and Company Secretary
Sean McGuinness was previously GM-Finance with the ASX listed Group Lynas
Corporation (LYC.AX, Spe Buy) and prior to that, Chief Accountant with Rank
Group Limited (New Zealand). Sean worked in the UK and US with ConocoPhillips
and in Australia with KPMG and PricewaterhouseCoopers.
Chris Thompson, General Manager - Cooper Basin
Chris Thompson has 20 years of experience in the oil and gas industry with
qualifications in both geology and reservoir engineering. He previously worked for
Oil Company of Australia, Schlumberger, Oil Search, Novus Petroleum, Leed
Petroleum and Origin Energy. He joined Strike in September 2012.
Don Poynton, Manager of Exploration and Environment
Don Poynton joined Strike Energy in 1997 after working for 25 years in technical
and management roles with GSI, Burmah/Woodside, Mesa and WMC Resources.
Rob Weeden, Manager of Geoscience
Rob Weeden has over 30 years’ experience in both the mineral and petroleum
industries, in Australia, the USA and South America. He joined Strike in 1997.

Ord Minnett Research 7 March 2014 Page 30
Company Review
Strike Energy Limited
Capital structure
Shares on
issue:
706,519,664
Options: 20,200,000 @ various dates and various prices
Performance
rights:
-
Convertible
notes:
-
Substantial
shareholders:
M H Carnegie & Co Pty Ltd 8.0%
Ownership: Top 20 shareholders as of 30th
June 2013
Source: Strike Energy Limited, 2013 Annual Report, p 74

Ord Minnett Research 7 March 2014 Page 31
Company Review
Strike Energy Limited
Appendices
Appendix 1: Tenement summary
Source: Ord Minnett, company data
Permit Current Area Expiry Partners Status
Interest gross date
% km2
Cooper/Otway conventional
PEL 71 75.00 4,609
PEL 515 100.00 3,038 -
PEL 575 100.00 3,804 -
ATP 549P - Cypress Block 5.00 540 Australian Gasfields
PPL 210 50.00 BPT
PEL 127 (Otway) 100.00 - Kingston Lignite project
Cooper Basin unconventional
PEL 94 35.00 901 BPT 1 vertical well (Davenport-1)
PEL 95 50.00 1,297 BPT 1 vertical well (Marsden-1)
PEL 96 66.70 2,707 EWC 2 vertical wells late CY13
Carnarvon Basin
EP 110 61.54 attempted divestment 1H CY13
EP 325 44.50 "
EP 424 61.54 "
WA 261P 19.94 Apache Rivoli gas discovery (small)
WA 460P 33.33 Shell Palta-1 next door, P&A'd
USA conventional
Eaglewood JV 40.00 49 Cypress Louise-1 in prod'n, 1.4 mmscfd
St Landry Canyon 10.00 150 West Plum Bob P&A'd 2H CY11
Tigre Lagoon 15.00 3D seismic 2H CY12
USA unconventional
Eagle Landing JV 27.50 157 Torch Bingham-1H 2H CY12
MB Clearfork 25.00 30 Cypress 16 existing conv, core testing
Geothermal / coal
GEL 526 100.00 -
GEL 527 100.00 -
EL 5476 (Mineral) 100.00 - JORC resource (lignite)
Net area km2 13,180
acres 3,255,562
Ord Minnett Research 7 March 2014 Page 32
Company Review
Strike Energy Limited
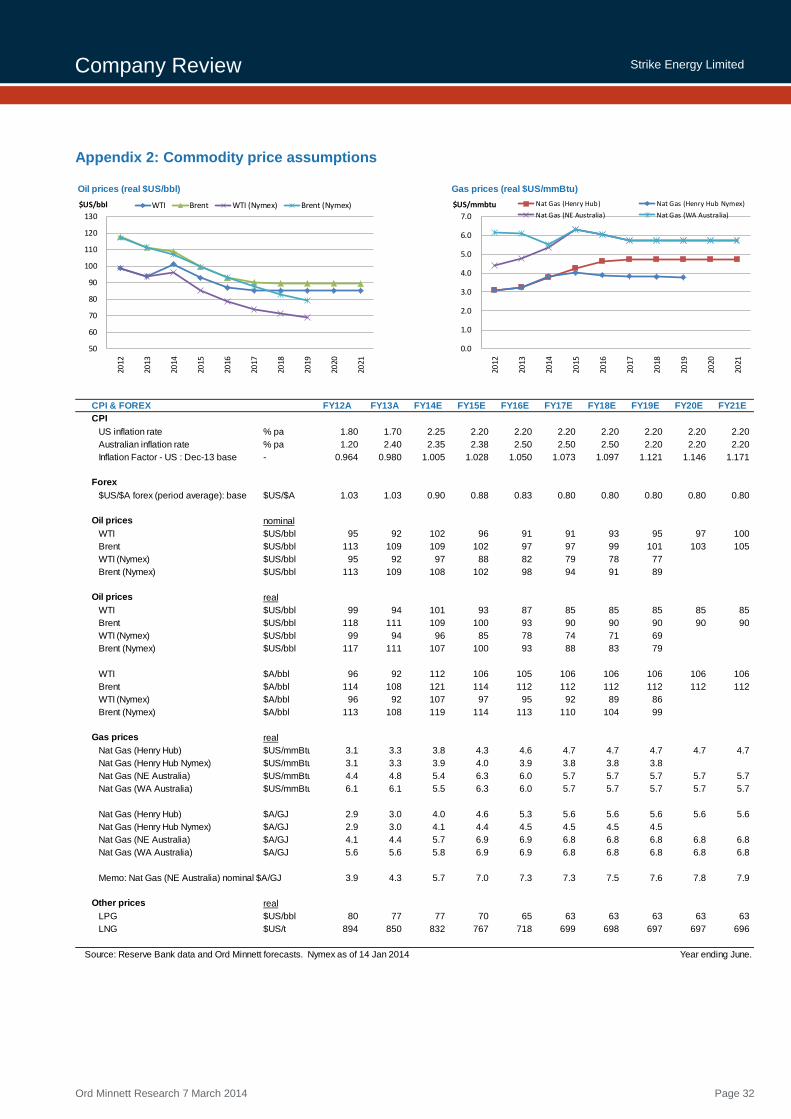
Appendix 2: Commodity price assumptions
Oil prices (real $US/bbl) Gas prices (real $US/mmBtu)
CPI & FOREX FY12A FY13A FY14E FY15E FY16E FY17E FY18E FY19E FY20E FY21E
CPI
US inflation rate % pa 1.80 1.70 2.25 2.20 2.20 2.20 2.20 2.20 2.20 2.20
Australian inflation rate % pa 1.20 2.40 2.35 2.38 2.50 2.50 2.50 2.20 2.20 2.20
Inflation Factor - US : Dec-13 base - 0.964 0.980 1.005 1.028 1.050 1.073 1.097 1.121 1.146 1.171
Forex
$US/$A forex (period average): base $US/$A 1.03 1.03 0.90 0.88 0.83 0.80 0.80 0.80 0.80 0.80
Oil prices nominal
WTI $US/bbl 95 92 102 96 91 91 93 95 97 100
Brent $US/bbl 113 109 109 102 97 97 99 101 103 105
WTI (Nymex) $US/bbl 95 92 97 88 82 79 78 77
Brent (Nymex) $US/bbl 113 109 108 102 98 94 91 89
Oil prices real
WTI $US/bbl 99 94 101 93 87 85 85 85 85 85
Brent $US/bbl 118 111 109 100 93 90 90 90 90 90
WTI (Nymex) $US/bbl 99 94 96 85 78 74 71 69
Brent (Nymex) $US/bbl 117 111 107 100 93 88 83 79
WTI $A/bbl 96 92 112 106 105 106 106 106 106 106
Brent $A/bbl 114 108 121 114 112 112 112 112 112 112
WTI (Nymex) $A/bbl 96 92 107 97 95 92 89 86
Brent (Nymex) $A/bbl 113 108 119 114 113 110 104 99
Gas prices real
Nat Gas (Henry Hub) $US/mmBtu 3.1 3.3 3.8 4.3 4.6 4.7 4.7 4.7 4.7 4.7
Nat Gas (Henry Hub Nymex) $US/mmBtu 3.1 3.3 3.9 4.0 3.9 3.8 3.8 3.8
Nat Gas (NE Australia) $US/mmBtu 4.4 4.8 5.4 6.3 6.0 5.7 5.7 5.7 5.7 5.7
Nat Gas (WA Australia) $US/mmBtu 6.1 6.1 5.5 6.3 6.0 5.7 5.7 5.7 5.7 5.7
Nat Gas (Henry Hub) $A/GJ 2.9 3.0 4.0 4.6 5.3 5.6 5.6 5.6 5.6 5.6
Nat Gas (Henry Hub Nymex) $A/GJ 2.9 3.0 4.1 4.4 4.5 4.5 4.5 4.5
Nat Gas (NE Australia) $A/GJ 4.1 4.4 5.7 6.9 6.9 6.8 6.8 6.8 6.8 6.8
Nat Gas (WA Australia) $A/GJ 5.6 5.6 5.8 6.9 6.9 6.8 6.8 6.8 6.8 6.8
Memo: Nat Gas (NE Australia) nominal $A/GJ 3.9 4.3 5.7 7.0 7.3 7.3 7.5 7.6 7.8 7.9
Other prices real
LPG $US/bbl 80 77 77 70 65 63 63 63 63 63
LNG $US/t 894 850 832 767 718 699 698 697 697 696
Source: Reserve Bank data and Ord Minnett forecasts. Nymex as of 14 Jan 2014 Year ending June.
50
60
70
80
90
100
110
120
130
2012
2013
2014
2015
2016
2017
2018
2019
2020
2021
$US/bbl WTI Brent WTI (Nymex) Brent (Nymex)
0.0
1.0
2.0
3.0
4.0
5.0
6.0
7.0
2012
2013
2014
2015
2016
2017
2018
2019
2020
2021
$US/mmbtu Nat Gas (Henry Hub) Nat Gas (Henry Hub Nymex)
Nat Gas (NE Australia) Nat Gas (WA Australia)

Ord Minnett Research 7 March 2014 Page 33
Company Review
Strike Energy Limited
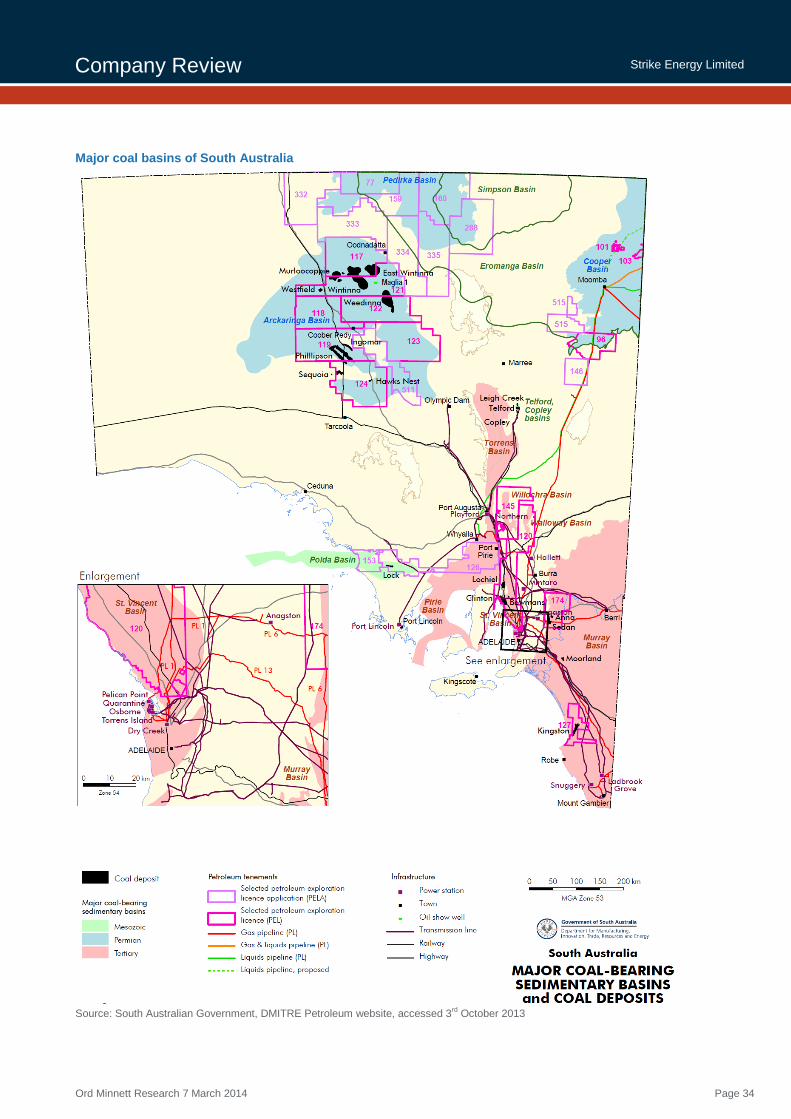
Appendix 3: South Australian coal seam gas potential
Limited existing data: Evaluation of the CSG potential of South Australia is less
advanced than in Queensland. Almost all known coal deposits have been
evaluated for mining potential, but not for coal seam gas. The depth and maturity of
the coal deposits and distance to infrastructure and markets have prevented
economic exploitation of all except the Leigh Creek Coalfield. A collaborative
research project between PIRSA and the Australian School of Petroleum was
established in 2006 to undertake a desktop evaluation of the state’s CSG and UCG
potential. Some seismic, drilling and coal desorption analysis is included in current
company work programs.
Predominantly immature coals: Gas content is a major economic consideration in
assessing CSG potential. As yet there are no desorption measurements of South
Australian coals. The South Australian coals at exploitable depths for CSG are
generally immature and have Vitrinite Reflectance maturities below the 0.8%
threshold needed for significant thermogenic methane production (200–300 scf/t).
Hence South Australian CSG prospects may need a contribution from a biogenic
methane (similar to the Powder River Basin in the USA) to have economic gas
contents.
Permian coals: Extensive and thick Permian coal measures occur in the
Arckaringa, Pedirka and Cooper basins. These deposits are similar in age to proven
eastern Australian CSG producing basins (i.e. Bowen and Surat basins). Coals in
the Pedirka and Arckaringa basins are shallower and less mature for oil and gas
generation (sub-bituminous) than Cooper Basin coals. Coals in the Cooper Basin
are a proven source of conventional oil and gas and occur at depths from 2000–
3500 m (bituminous to anthracite rank). The Patchawarra Formation contains a
major coal seam which forms an important seismic reflector. The Weena Trough in
the southern Cooper Basin, targeted by Strike Energy, contains the shallowest
occurrences of thick Patchawarra Formation sub-bituminous coal seams.
Deep CSG: The deepest CSG production in the USA is from 2500m in the
Piceance Basin and 2000m is generally considered the floor for CSG production
due to cleat closure and permeability reduction at these depths. However Santos
has flowed gas to surface from a fracced Patchawarra coal at ~2900m in the
Moomba 77 well. .
Triassic coals measures are currently being mined at Leigh Creek (the only
operating coal mine in South Australia). This Triassic coal is sub-bituminous in rank,
and is mined at the margins of the Telford Basin, but extends to depths in excess of
1000 m in the basin centre. Jurassic coal measures form a deposit at Lock in the
Polda Basin. Jurassic coals also occur in the deeper parts of the Eromanga Basin in
the Poolowanna and Birkhead formations. Cretaceous coal measures are known
from the Otway Basin (e.g. Eumeralla Formation) and Eromanga Basin (Winton
Formation); the latter is a potential exploration target for CSG.
Tertiary coals are typically low-grade shallow lignites (<100 m deep) that occur in
intracratonic and structurally controlled basins located along Australia’s southern
margin. In South Australia this includes the Pirie-Torrens, St Vincent and Murray
basins. These coals are typically high in moisture, sulphur, sodium and chlorine and
the shallow depth limits reservoir pressure and gas content. Mining some of these
deposits for coal to gas or coal to liquids projects is currently being evaluated.
Eromanga Basin: AGL explored for CSG in PELs 101 and 103 on the Innamincka
Dome in joint venture with Acer Petroleum. Three cored drillholes evaluated the
coals in the Early Cretaceous Winton Formation. A gas kick was recorded on the
mudlog through Winton Formation coals in the Aspen 1 exploration well.
Ord Minnett Research 7 March 2014 Page 34
Company Review
Strike Energy Limited
Major coal basins of South Australia
Source: South Australian Government, DMITRE Petroleum website, accessed 3
rd October 2013
Ord Minnett Research 7 March 2014 Page 35
Company Review
Strike Energy Limited
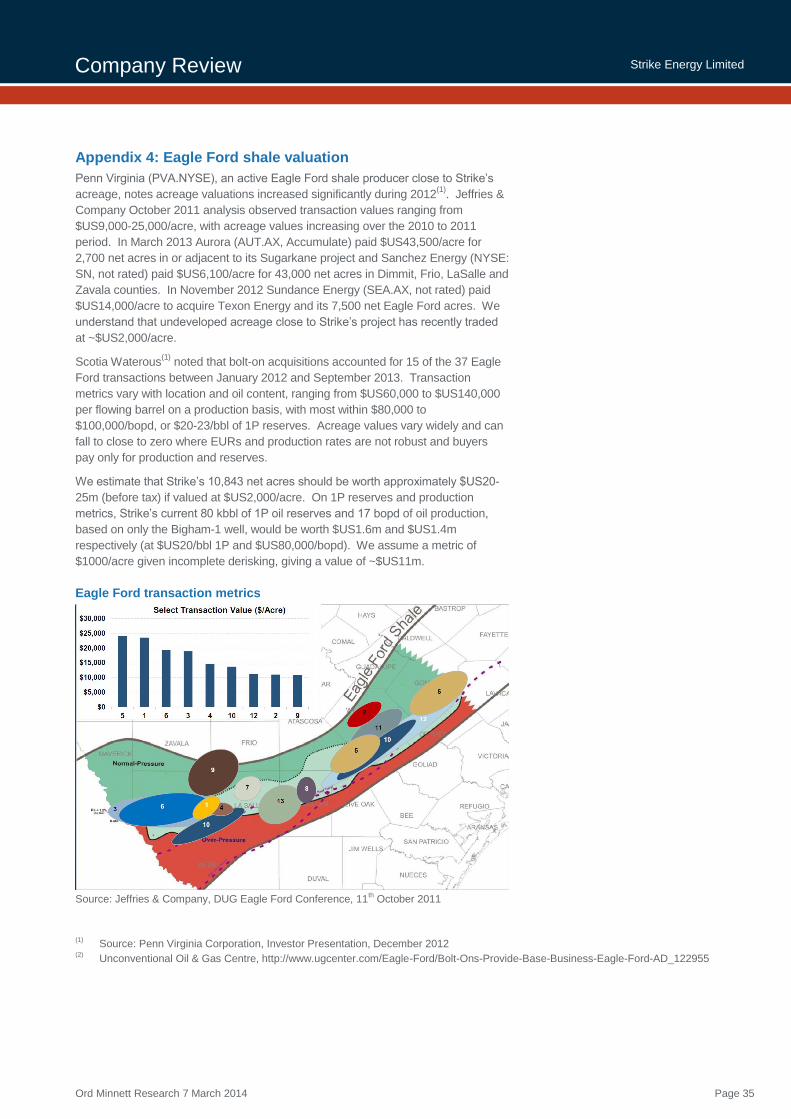
Appendix 4: Eagle Ford shale valuation
Penn Virginia (PVA.NYSE), an active Eagle Ford shale producer close to Strike’s
acreage, notes acreage valuations increased significantly during 2012(1)
. Jeffries &
Company October 2011 analysis observed transaction values ranging from
$US9,000-25,000/acre, with acreage values increasing over the 2010 to 2011
period. In March 2013 Aurora (AUT.AX, Accumulate) paid $US43,500/acre for
2,700 net acres in or adjacent to its Sugarkane project and Sanchez Energy (NYSE:
SN, not rated) paid $US6,100/acre for 43,000 net acres in Dimmit, Frio, LaSalle and
Zavala counties. In November 2012 Sundance Energy (SEA.AX, not rated) paid
$US14,000/acre to acquire Texon Energy and its 7,500 net Eagle Ford acres. We
understand that undeveloped acreage close to Strike’s project has recently traded
at ~$US2,000/acre.
Scotia Waterous(1)
noted that bolt-on acquisitions accounted for 15 of the 37 Eagle
Ford transactions between January 2012 and September 2013. Transaction
metrics vary with location and oil content, ranging from $US60,000 to $US140,000
per flowing barrel on a production basis, with most within $80,000 to
$100,000/bopd, or $20-23/bbl of 1P reserves. Acreage values vary widely and can
fall to close to zero where EURs and production rates are not robust and buyers
pay only for production and reserves.
We estimate that Strike’s 10,843 net acres should be worth approximately $US20-
25m (before tax) if valued at $US2,000/acre. On 1P reserves and production
metrics, Strike’s current 80 kbbl of 1P oil reserves and 17 bopd of oil production,
based on only the Bigham-1 well, would be worth $US1.6m and $US1.4m
respectively (at $US20/bbl 1P and $US80,000/bopd). We assume a metric of
$1000/acre given incomplete derisking, giving a value of ~$US11m.
Eagle Ford transaction metrics
Source: Jeffries & Company, DUG Eagle Ford Conference, 11
th October 2011
(1)
Source: Penn Virginia Corporation, Investor Presentation, December 2012 (2)
Unconventional Oil & Gas Centre, http://www.ugcenter.com/Eagle-Ford/Bolt-Ons-Provide-Base-Business-Eagle-Ford-AD_122955

Ord Minnett Research 7 March 2014 Page 36
Company Review
Strike Energy Limited
Eagle Ford shale project data
Penn Virginia (PVA.NYSE) analysis indicates attractive development economics,
with break-even oil pricing (at a 10% discount rate before tax) of $US50-57/bbl.
Eagle Ford project characteristics and rates of return
Source: Penn Virginia Corporation, Investor Presentation, December 2012
Ord Minnett Research 7 March 2014 Page 37
Company Review
Strike Energy Limited
Please contact your Ord Minnett Adviser for further information on our document.
Research
Tim Smart Head of Research Sydney [email protected]
David Brennan, CFA Senior Resource Analyst Sydney [email protected]
Paresh Patel Senior Research Analyst Sydney [email protected]
John Young Senior Research Analyst Melbourne [email protected]
Brad Dunn Analyst Sydney [email protected]
Nicholas McGarrigle Analyst Sydney [email protected]
Ord Minnett Offices Adelaide Level 11 13 Grenfell Street Adelaide SA 5000 Tel: (08) 8203 2500 Fax: (08) 8203 2525
Brisbane Level 31 10 Eagle St Brisbane QLD 4000 Tel: (07) 3214 5555 Fax: (07) 3214 5550
Buderim Sunshine Coast 1/99 Burnett Street Buderim QLD 4556 Tel: (07) 5430 4444 Fax: (07) 5430 4400
Caloundra, Sunshine Coast 79-81 Bulcock Street Caloundra QLD 4551 Tel: (07) 5491 3100 Fax: (07) 5491 3222
Canberra 101 Northbourne Avenue Canberra ACT 2600 Tel: (02) 6206 1700 Fax: (02) 6206 1720
Coffs Harbour Suite 4 21 Park Avenue Coffs Harbour NSW 2450 Tel: (02) 6652 7900 Fax: (02) 6652 5716
Gold Coast Level 7, 50 Appel Street Surfers Paradise QLD 4217 Tel: (07) 5557 3333 Fax: (07) 5557 3377
Mackay 45 Gordon Street Mackay QLD 4740 Tel: (07) 4969 4888 Fax: (07) 4969 4800
Melbourne Level 23 120 Collins Street Melbourne VIC 3000 Tel: (03) 9608 4111 Fax: (03) 9608 4142
Newcastle 426 King Street Newcastle NSW 2300 Tel: (02) 4910 2400 Fax: (02) 4910 2424
Tamworth Suite 3 344-346 Peel Street Tamworth NSW 2340 Tel: (02) 6761 3333 Fax: (02) 6761 3104
Wollongong Level 1 17 Flinders Street Wollongong NSW 2520 Tel: (02) 4226 1688 Fax: (02) 4226 1604
Head Office
Sydney Level 8, NAB House 255 George Street Sydney NSW 2000 Tel: (02) 8216 6300 Fax: (02) 8216 6311 www.ords.com.au
International
Hong Kong 1801 Ruttonjee House 11 Duddell Street Central, Hong Kong Tel: +852 2912 8980 Fax: +852 2813 7212 www.ords.com.hk
Ord Minnett Research 7 March 2014 Page 38
Company Review
Strike Energy Limited
Guide to Ord Minnett Recommendations
SPECULATIVE BUY We expect the stock’s total return (nominal yield plus capital appreciation) to exceed 20% over 12 months. The investment may have a strong capital appreciation but also has high degree of risk and there is a
significant risk of capital loss.
BUY The stock’s total return (nominal dividend yield plus capital appreciation) is expected to exceed 15% over the
next 12 months.
ACCUMULATE We expect a total return of between 5% and 15%. Investors should consider adding to holdings or taking a
position in the stock on share price weakness.
HOLD We expect the stock to return between 0% and 5%, and believe the stock is fairly priced.
LIGHTEN We expect the stock’s return to be between 0% and negative 15%. Investors should consider decreasing their
holdings.
SELL We expect the total return to lose 15% or more.
RISK ASSESSMENT Classified as Lower, Medium or Higher, the risk assessment denotes the relative assessment of an individual
stock’s risk based on an appraisal of its disclosed financial information, historic volatility of its share price,
nature of its operations and other relevant quantitative and qualitative criteria. Risk is assessed by
comparison with other Australian stocks, not across other asset classes such as Cash or Fixed Interest.
Disclosure: Ord Minnett is the trading brand of Ord Minnett Limited ABN 86 002 733 048, holder of AFS Licence Number 237121, and an ASX Market Participant. Ord Minnett Limited and/or its associated entities, directors and/or its employees may have a material interest in, and may earn brokerage from, any securities referred to in this document, or may provide services to the company referred to in this report. This document is not available for distribution outside Australia, New Zealand and Hong Kong and may not be passed on to any third party or person without the prior written consent of Ord Minnett Limited. Further, Ord Minnett and/or its affiliated companies may have acted as manager or co-manager of a public offering of any such securities in the past three years. Ord Minnett and/or its affiliated companies may provide or may have provided corporate finance to the companies referred to in the report.
Ord Minnett and associated persons (including persons from whom information in this report is sourced) may do business or seek to do business with companies covered in its research reports. As a result, investors should be aware that the firm or other such persons may have a conflict of interest that could affect the objectivity of this report. Investors should consider this report as only a single factor in making their investment decision.
This document is current as at the date of the issue but may be superseded by future publications. You can confirm the currency of this document by checking Ord Minnett’s internet site.
Additional Disclosure: The analyst discloses that when conducting on-site visits to inspect property, plant and equipment that the analyst may have received assistance from the company or companies involved. This assistance may have included on-site transport, incidental expenses, and access to equipment. Where practical, OML policy is to pay for all travel and accommodation expenses. The analyst has not conducted a site visit to the company’s operations.
Disclaimer: Ord Minnett Limited believes that the information contained in this document has been obtained from sources that are accurate, but has not checked or
verified this information. Except to the extent that liability cannot be excluded, Ord Minnett Limited and its associated entities accept no liability for any loss or damage caused by any error in, or omission from, this document. This document is intended to provide general financial product advice only, and has been prepared without taking account of your objectives, financial situation or needs, and therefore before acting on advice contained in this document, you should consider its appropriateness having regard to your objectives, financial situation and needs. If any advice in this document relates to the acquisition or possible acquisition of a particular financial product, you should obtain a copy of and consider the Product Disclosure Statement prospectus or other disclosure material for that product before making any decision. Investments can go up and down. Past performance is not necessarily indicative of future performance.
Analyst Certification: The analyst certifies that: (1) all of the views expressed in this research accurately reflect their personal views about any and all of the subject securities or issuers; (2) no part of their compensation was, is, or will be directly or indirectly related to the specific recommendations or views expressed herein.
Ord Minnett Hong Kong: This document is issued in Hong Kong by Ord Minnett Hong Kong Limited, CR Number 1792608, which is licensed by the Securities and Futures Commission (CE number BAI183) for Dealing in Securities (Type 1 Regulated Activity) in Hong Kong. Ord Minnett Hong Kong Limited believes that the information contained in this document has been obtained from sources that are accurate, but has not checked or verified this information. Except to the extent that liability cannot be excluded, Ord Minnett Hong Kong Limited and its associated entities accept no liability for any loss or damage caused by any error in, or omission from, this document. This document is directed at Professional Investors (as defined under the Securities and Futures Ordinance of Hong Kong) and is not intended for, and should not be used by, persons who are not Professional Investors. This document is provided for information purposes only and does not constitute an offer to sell (or solicitation of an offer to purchase) the securities mentioned or to participate in any particular trading strategy. The investments described have not been, and will not be, authorized by the Hong Kong Securities and Futures Commission.
For summary information about the qualifications and experience of the Ord Minnett Limited research service, please visit http://www.ords.com.au/our-team-2/
For information regarding Ord Minnett Research’s coverage criteria, methodology and spread of ratings, please visit http://www.ords.com.au/methodology/
For information regarding any potential conflicts of interest and analyst holdings, please visit http://www.ords.com.au/methodology/
This report has been authorised for distribution by Tim Smart, Head of Research at Ord Minnett Limited.


