International Association for Management of Technology IAMOT 2015 Conference Proceedings
P275
COMMERCIAL FISHING AND AQUACULTURE IMPLICATIONS OF A GREEN ECONOMY
TRANSITION IN THE WESTERN CAPE
LIZE DUMINY Stellenbosch University, Department of Industrial Engineering, South Africa
Email Address: [email protected]
ALAN C BRENT
Stellenbosch University, Department of Industrial Engineering and the Centre for Renewable and Sustainable
Energy Studies (CRSES), South Africa
E‐mail Address (Corresponding): [email protected]
JOSEPHINE K MUSANGO Stellenbosch University, School of Public Leadership and the Centre for Renewable and Sustainable Energy
Studies (CRSES), Stellenbosch University, South Africa E‐mail Address (Corresponding): [email protected]
Copyright © 2015 by Stellenbosch University. Permission granted to IAMOT to publish and use.
ABSTRACT
The Western Cape provincial government has prioritised shifting the Western Cape economy from
its current carbon intensive and resource‐wasteful nature to one that is smarter, greener and more
economically sustainable. However, modern policy design often results in unintended outcomes or
adverse secondary effects that were not considered by policy makers due to the complex and inter‐
related nature of the problem at hand. It is therefore anticipated that government intervention, as
well as the gradual effect of climate change in the area, will influence fisheries and aquaculture in
the Western Cape both directly and indirectly. Fisheries and aquaculture are identified as complex
dynamic systems using systems thinking. Finally system dynamics modelling is introduced and
proposed as a suitable tool for analysis and policy design of complex systems such as fisheries and
aquaculture in the Western Cape. This article concludes that system dynamics modelling is an
appropriate tool for determining the influence of both climate change and government intervention
on fisheries and aquaculture in the Western Cape. It is then recommended to construct a system
dynamics model with the overall modelling goal of evaluating proposed provincial governmental
frameworks and action plans in terms of social, economic and environmental sustainability, taking
into account the anticipated future climate change in the Province.
Key words: system dynamics, climate change, commercial fishing, aquaculture.
INTRODUCTION
Since the introduction of the term “green economy” in the Blueprint for a Green Economy (Pearce,
et al., 1992), the interest and demand for the “green transition” is steadily increasing. At a visionary
level, the United Nations Environment Programme (UNEP) defines a green economy as an economy
where the action of significantly reducing the environmental risks and ecological scarcities directly
benefits human well‐being and social equity. At an operational level, the United Nations
Environmental Programme defines a green economy as an economy that is driven by investments,
including investments in human and social capital in the South African Green Economy Modelling
Report (UNEP, 2013). The investments are sought to reduce carbon emissions and pollution,
Page 2011

International Association for Management of Technology IAMOT 2015 Conference Proceedings
P275
enhance energy and resource efficiency and prevent the loss of biodiversity and ecosystem services.
Furthermore, the May 2010 Summit Report (DEA, 2010) states that South Africa defines a green
economy as a development path that is sustainable in addition to addressing the interdependence
between natural ecosystems, economic growth and social protection.
South Africa used the 2008 world financial and economic crisis as an opportunity to stimulate
economic growth through activities relating to environmental and social development as part of an
economic stimulus package by allocating US$800 million to environment related themes.
In November 2011, South Africa announced commitment to a Green Economy Accord; an agreement
between government, industry, labour and trade unions, as well as the greater society. The Green
Economy Accord aims to create 300000 new jobs by 2020. A priority area for green economy
promotion in South Africa is the innovation of new technologies and behaviours, preparation for
future flourishing green markets by expanding infrastructure as well as promotion of developing
green industries (UNEP, 2013).
These initiatives prove that the South African government is committed to sustainably developing a
green economy in the face of a global economic crisis, imminent depletion of natural resources and
climate change.
In this article, a summary of national and provincial responses to climate change is followed by an
overview of commercial fishing and aquaculture. Next, mathematical modelling and system
dynamics modelling is introduced, followed by the article conclusion.
NATIONAL RESPONSE TO CLIMATE CHANGE
This section contains an overview of the three most relevant governmental reports used to develop
the Western Cape Climate Change Response Strategy (DEA&DP, 2014). It is assumed that the reports
used in such a prominent provincial document would be a fair overview of the national response on
climate change as a whole. The three most relevant governmental reports are: the National Climate
Change Response Policy (NCCRP), the National Development Plan (NDP) and the National Strategy
for Sustainable Development and Action Plan (NSSD1). The Western Cape provincial response on
climate change follows after this section.
The National Climate Change Response Policy
The NCCRP was released near the end of 2011 (RSA, 2011). The white paper formalised the South
African Government’s vision for an effective national response to climate change as well as a long‐
term transition to a low‐carbon and climate‐resilient economy. The report defines the two main
objectives of South Africa’s response to climate change. The first objective is to manage inevitable
climate change impacts and the second objective is to make a fair contribution to the global efforts
to stabilise greenhouse gas concentrations in the atmosphere (RSA, 2011). In addition to the two
main objectives, the NCCRP identifies eight short‐term Priority Flagship Programmes. The Priority
Flagship Programmes identified are: Climate Change Response Public Works, Water Conservation,
Renewable Energy, Energy Efficiency and Energy Demand, Transport, Waste Management, Carbon
Capture and Sequestration and Adaptation Research. Finally, the NCCRP includes a Monitoring and
Evaluation System developed to serve as a national tracking and reporting structure for South
African climate change responses (RSA, 2011).
Page 2012
International Association for Management of Technology IAMOT 2015 Conference Proceedings
P275
The National Development Plan
The NDP was developed by the National Planning Commission with the target of eliminating poverty
and reducing inequality by 2030 (National Planning Commission of South Africa, 2012). The NDP
acknowledges South Africa’s role as a contributor to greenhouse gas emissions. The document also
points out that South Africa is very vulnerable to the effects of climate change regarding health,
livelihoods as well as water and food security. In addition, the report notes that the poor, especially
women and children, are most exposed to the before mentioned risks. The topic of climate change is
dealt with explicitly in Chapter 5 of the National Development Plan: Environmental Sustainability and
Resilience. References to climate change can also be found in Chapter 3, 4, 6 and 8.
The National Strategy for Sustainable Development and Action Plan
The NSSD1 was approved by the Cabinet on 23 November 2011 and builds on the 2008 National
Framework for Sustainable Development which laid out a plan of strategic interventions required to
ensure South Africa’s development path moves in an economic, social and environmentally
sustainable direction (DEA, 2011). Five strategic objectives are identified in the NSSD1:
i. Enhancing systems for integrated planning and implementation;
ii. Sustaining our ecosystems and using natural resources more efficiently;
iii. Transitioning towards a green economy;
iv. Building sustainable communities; and
v. Responding effectively to climate change.
The common thread of the above mentioned documents, among other less significant documents
and mandates, are used as the basis of the Western Cape Climate Change Response Strategy of
2014. This ensures consistency between the National Climate Change Response Strategy and the
Western Cape Climate Change Response Strategy.
THE WESTERN CAPE STRATEGIC CLIMATE POLICY DOCUMENTS
This section contains an overview of the most prominent provincial climate change policies. Using
national policies, strategies and plans as a basis for developing a provincial climate change response
strategy ensures that the focus areas and priorities highlighted on a national level is enforced at an
operational level in the Western Cape (DEA&DP, 2014).
The Western Cape Climate Change Response Strategy and Action Plan
The Western Cape Climate Change Response Strategy and Action Plan was released in 2008 by the
Department of Environmental Affairs and Development Planning and introduced four prioritized
programmes for the province (DEA&DP, 2008):
i. Integrating climate change and the relevant risk management into an joined water supply
and infrastructure management programme;
ii. Establishing clear links between land stewardship, livelihoods and the economy and a whole;
iii. Establishing focused climate change research and weather information programmes; and
iv. Reducing the Western Cape’s carbon footprint.
Page 2013
International Association for Management of Technology IAMOT 2015 Conference Proceedings
P275
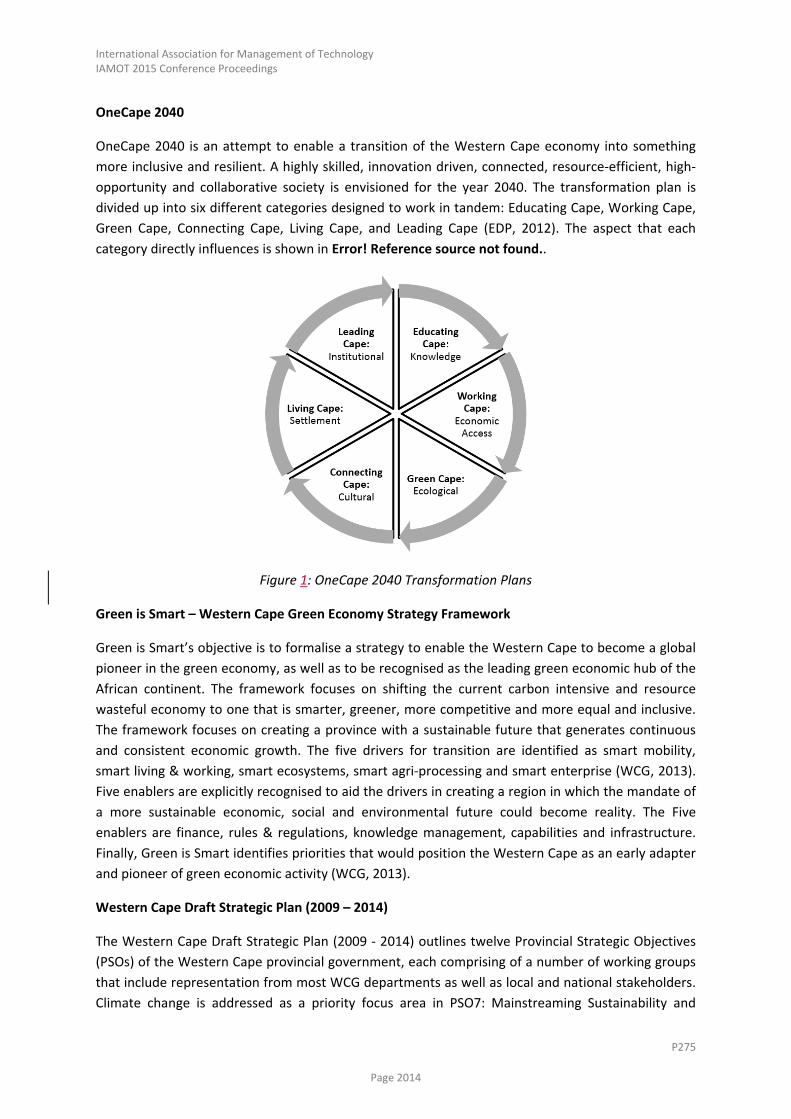
OneCape 2040
OneCape 2040 is an attempt to enable a transition of the Western Cape economy into something
more inclusive and resilient. A highly skilled, innovation driven, connected, resource‐efficient, high‐
opportunity and collaborative society is envisioned for the year 2040. The transformation plan is
divided up into six different categories designed to work in tandem: Educating Cape, Working Cape,
Green Cape, Connecting Cape, Living Cape, and Leading Cape (EDP, 2012). The aspect that each
category directly influences is shown in Error! Reference source not found..
Figure 1: OneCape 2040 Transformation Plans
Green is Smart – Western Cape Green Economy Strategy Framework
Green is Smart’s objective is to formalise a strategy to enable the Western Cape to become a global
pioneer in the green economy, as well as to be recognised as the leading green economic hub of the
African continent. The framework focuses on shifting the current carbon intensive and resource
wasteful economy to one that is smarter, greener, more competitive and more equal and inclusive.
The framework focuses on creating a province with a sustainable future that generates continuous
and consistent economic growth. The five drivers for transition are identified as smart mobility,
smart living & working, smart ecosystems, smart agri‐processing and smart enterprise (WCG, 2013).
Five enablers are explicitly recognised to aid the drivers in creating a region in which the mandate of
a more sustainable economic, social and environmental future could become reality. The Five
enablers are finance, rules & regulations, knowledge management, capabilities and infrastructure.
Finally, Green is Smart identifies priorities that would position the Western Cape as an early adapter
and pioneer of green economic activity (WCG, 2013).
Western Cape Draft Strategic Plan (2009 – 2014)
The Western Cape Draft Strategic Plan (2009 ‐ 2014) outlines twelve Provincial Strategic Objectives
(PSOs) of the Western Cape provincial government, each comprising of a number of working groups
that include representation from most WCG departments as well as local and national stakeholders.
Climate change is addressed as a priority focus area in PSO7: Mainstreaming Sustainability and
Page 2014
International Association for Management of Technology IAMOT 2015 Conference Proceedings
P275
Optimising Resource‐Use Efficiency (GWC, 2010). The working groups directly related to climate
change are Energy, Climate Change Adaption, Sustainable Resource Management as well as Land‐
use Planning. PSO1: Increasing Opportunities for Growth and Jobs contains the Green Economy
Work Group who focuses on promoting the Green Economy in the Western Cape. Clear links to
climate change are also made in PSO11: Creating Opportunities for Growth and Development in
Rural Areas, which deals with the development of the rural economy (GWC, 2010).
Provincial Spatial Development Framework
The Provincial Spatial Development Framework, currently being finalised by the Department of
Environmental Affairs and Development Planning, sets out a framework of spatial governance, the
sustainable use and management of the provinces assets, encouragement of participation in the
Western Cape’s space‐economy as well as the development of integrated and sustainable human
settlements (DEA&DP, 2013). The Provincial Spatial Development Framework supports the spatial
priorities of the NDP.
Western Cape Sustainable Water Management Plan
The Western Cape Sustainable Water Management Plan was a collaborative effort between Western
Cape Government’s Provincial Departments and the Western Cape Regional Office of the National
Department of Water affairs. The plan has three primary objectives: protecting water resources
from environmental degradation, incorporating integrated planning processes, and promoting
efficient water utilisation (WCG, 2012). A conclusive action‐plan is proposed with the aim of
achieving integrated and sustainable management of water in the Western Cape. The four strategic
goals identified by the Western Cape sustainable Water Management Plan is to ensure the
sustainability and integrity of socio‐ecological systems, the sustainability of water resources for
growth and development, effective co‐operative governance and institutional planning for
sustainable water management, and effective and appropriate information management and
reporting of sustainable water management (WCG, 2012).
Provincial Land Transport Framework
The Provincial Land Transport Framework informs all provincial decision‐making bodies with respect
to all transport and land‐use related topics. The framework aims to transform the current transport
system into one that is an efficient, accessible and integrated multi‐modal public transport system
managed by municipalities with both capacity and necessary infrastructure in addition to being well
maintained, safe and sustainable to operate (Department of Transport and Public Works, 2012).
The Western Cape Infrastructure Framework
The Western Cape Infrastructure Framework has been developed by the Provincial Transport and
Public Works Departments to align the planning, management and delivery of infrastructure. The
framework envisions a future provincial infrastructure that satisfies current needs and backlogs,
maintains the existing infrastructure, and plans proactively for a desired future outcome. Topics
addressed in the Western Cape Infrastructure Framework that deal directly with climate change
response are Energy, Water, Transport and Settlements (Department of Transport and Public Works,
2013).
Page 2015

International Association for Management of Technology IAMOT 2015 Conference Proceedings
P275
From the summaries of the most relevant provincial strategic climate change policies below, a
uniform theme, in line with the national response to climate change, can be observed throughout
each provincial document. The next section gives and overview of the commercial fishing and
aquaculture industry of South Africa as well as the Western Cape.
OVERVIEW OF THE COMMERCIAL FISHING AND AQUACULTURE INDUSTRY
This section deals with the commercial fishing and aquaculture industry of both South Africa, and
the Western Cape, respectively. Aquaculture is the process of farming freshwater and saltwater
populations under controlled conditions whereas commercial fishing describes the process of
harvesting wild fish. According to the Status of World Fisheries and Aquaculture report, Africa
contributed only around 1.5% of global aquaculture production in 2006 with South Africa
responsible for less than 1% (Food and Agriculture Organization of the United Nations, 2008). With
the current unsustainable rate of depletion of global wild fish stocks, promotion and growth of
aquaculture is cardinal to curb global overexploitation of fish. The vast South African coastline
stretching over more than 3200km is home to well‐established fisheries considered to be fully used
or overexploited, especially in the case of high‐value fisheries such as abalone, linefish and prawns
(WESGRO, 2012). The commercial fishery industry creates approximately 27000 jobs and has an
annual turnover of about 2bn South African Rands (WESGRO, 2012). Vulnerabilities in South Africa’s
fishing industry are identified as pollution, poaching, inappropriate developments and over‐use.
In contrast to fisheries, aquaculture is considered an underdeveloped sector in South Africa (DEA,
2010). The South African government thus identified aquaculture as an area to develop since
historically, aquaculture focussed exclusively on a small number of high value species such as
abalone, mussels and oysters. The WESGRO report of 2012 estimates that South Africa’s aquaculture
production has the potential to grow from 3453 tonnes (ZAR218m) to more than 90000 tonnes
(ZAR2.4bn) over the next two decades (WESGRO, 2012).
The aquaculture industry of South Africa consists of both marine and fresh water aquaculture.
Marine aquaculture exports consist mainly of abalone, oysters and mussels whereas oysters,
mussels and salmon are imported and contributed to 0.02% of South Africa’s Gross Domestic
Product in 2011 (DAFF, 2012). Freshwater aquaculture is the oldest aquaculture sector in South
Africa and is more developed in terms of both diversity of species cultured and the number of
producers (DAFF, 2012). The major farmed fresh water species are rainbow trout, koi carp and
ornamental species, tilapia and catfish. The Western Cape has been dominant in terms of total
national production, accounting for approximately 85% of total fish exports. Frozen hake fillets have
been the largest export from the Western Cape in 2012 (WESGRO, 2012). The demand for high‐end
fishery products, generally synonymous with high profit margins, is expected to increase at a steady
rate for the next two decades, providing substantial opportunity for a sustainable increase in
aquaculture production in the Western Cape.
Since aquaculture is less dependent on climate change than most other food production industries in
the Western Cape, including fisheries, it is anticipated to become increasingly relevant for the food
security and economic stability of the province. A medium‐term need for aquaculture to be
developed is identified to ensure social, economic and environmental sustainability of both the
aquaculture and the commercial fishing industry. Such sustainable development requires a reliable,
universal aquaculture framework based on sound analysis, planning and forecasting. Mathematical
Page 2016
International Association for Management of Technology IAMOT 2015 Conference Proceedings
P275
modelling is identified as a potential tool during the development of an aquaculture framework due
to the combination of importance and complexity of commercial fishing and aquaculture in the
Western Cape.
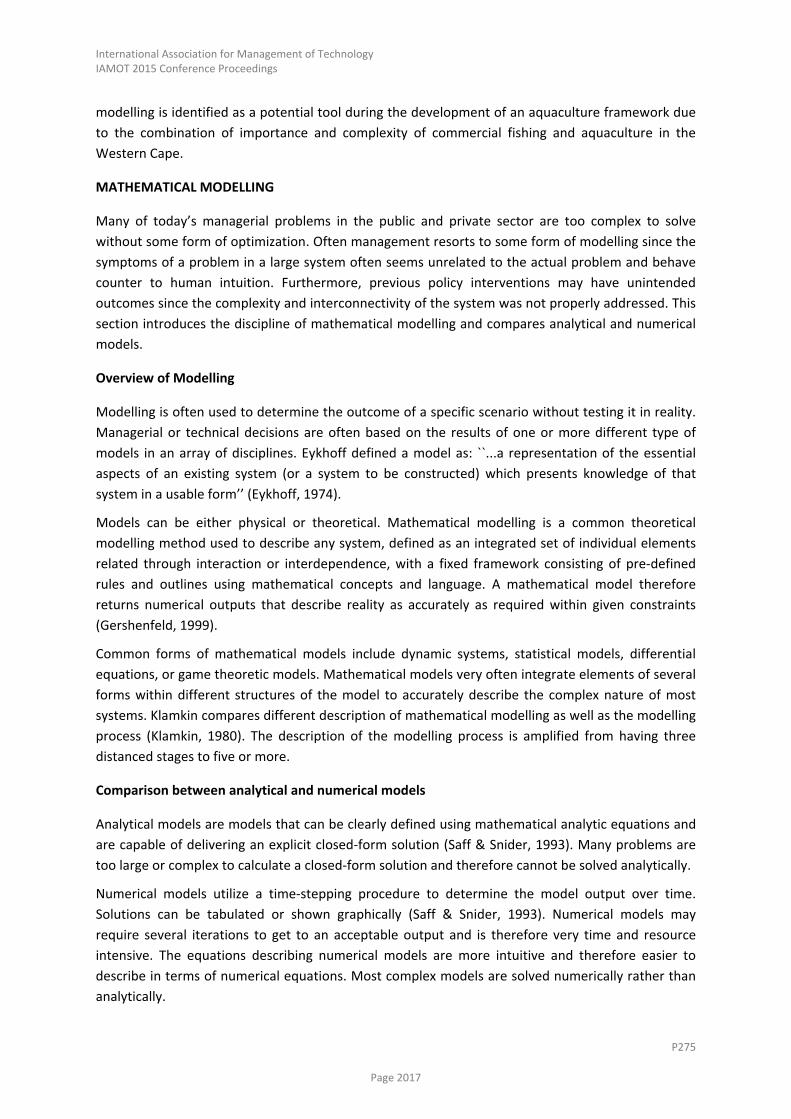
MATHEMATICAL MODELLING
Many of today’s managerial problems in the public and private sector are too complex to solve
without some form of optimization. Often management resorts to some form of modelling since the
symptoms of a problem in a large system often seems unrelated to the actual problem and behave
counter to human intuition. Furthermore, previous policy interventions may have unintended
outcomes since the complexity and interconnectivity of the system was not properly addressed. This
section introduces the discipline of mathematical modelling and compares analytical and numerical
models.
Overview of Modelling
Modelling is often used to determine the outcome of a specific scenario without testing it in reality.
Managerial or technical decisions are often based on the results of one or more different type of
models in an array of disciplines. Eykhoff defined a model as: ``...a representation of the essential
aspects of an existing system (or a system to be constructed) which presents knowledge of that
system in a usable form’’ (Eykhoff, 1974).
Models can be either physical or theoretical. Mathematical modelling is a common theoretical
modelling method used to describe any system, defined as an integrated set of individual elements
related through interaction or interdependence, with a fixed framework consisting of pre‐defined
rules and outlines using mathematical concepts and language. A mathematical model therefore
returns numerical outputs that describe reality as accurately as required within given constraints
(Gershenfeld, 1999).
Common forms of mathematical models include dynamic systems, statistical models, differential
equations, or game theoretic models. Mathematical models very often integrate elements of several
forms within different structures of the model to accurately describe the complex nature of most
systems. Klamkin compares different description of mathematical modelling as well as the modelling
process (Klamkin, 1980). The description of the modelling process is amplified from having three
distanced stages to five or more.
Comparison between analytical and numerical models
Analytical models are models that can be clearly defined using mathematical analytic equations and
are capable of delivering an explicit closed‐form solution (Saff & Snider, 1993). Many problems are
too large or complex to calculate a closed‐form solution and therefore cannot be solved analytically.
Numerical models utilize a time‐stepping procedure to determine the model output over time.
Solutions can be tabulated or shown graphically (Saff & Snider, 1993). Numerical models may
require several iterations to get to an acceptable output and is therefore very time and resource
intensive. The equations describing numerical models are more intuitive and therefore easier to
describe in terms of numerical equations. Most complex models are solved numerically rather than
analytically.
Page 2017

International Association for Management of Technology IAMOT 2015 Conference Proceedings
P275
SYSTEM DYNAMICS MODELLING
After a general overview of modelling, the system dynamics modelling is defined in order to create a
feasibility checklist to determine whether a problem is suitable for system dynamic modelling.
System dynamics is one of many techniques that can be used to facilitate quantitative simulation
modelling and analysis in complex systems (Wolstenholme, 1990). It is currently being applied in aid
of policy analysis and design in both the public and private sector. The founder of system dynamics,
Jay Forrester, defined the technique as: ``… the investigation of the information‐feedback
characteristics of [managed] systems and the use of models for the design of improved
organizational form and guiding policy ‘’ (Forrester, 1961).
Forrester’s original description however, does not give any reference to time. Coyle proposes a
thorough definition compiled by combining existing definitions from (Coyle, 1996), (Forrester, 1961)
and (Wolstenholme, 1990): ``System dynamics deals with the time‐dependent behaviour of
managed systems with aim of describing the system and understanding, through qualitative and
quantitative models, how information feedback governs its behaviour, and designing robust
information feedback structures and control polices through simulation and optimization.’’
In the context of System Dynamics, a system is defined as individual parts being integrated to
achieve a certain outcome (Coyle, 1996). It is noted that, in this definition of a system, a system can
fail to achieve its required outcome due to any number of reasons, including: design flaws, problems
with implementation, problems with integrating parts, inadequate policies or even an external force.
Within the same context, a dynamic system is described as a system that changes behaviour as time
passes. This description emphasises the idea that System Dynamics can be a useful tool when
deciding on new policy to be implemented due to changes in the existing system over an extended
period of time.
Coyle points out common features between dynamic feedback control systems and system dynamics
models (Coyle, 1996):
i. Measuring or sensing the actual current state of the system
ii. Comparison of actual state to desired state
iii. Heavy dependence on information feedback to control the system
iv. Employment of policies to reconcile the actual state with the set desired state
v. Often involve time‐delays before actions have any effect on the state of the system
A basic example of a dynamic feedback control system is a domestic storage water heater, or geyser,
that keeps water continuously hot and ready for use by using electricity as an energy source. The
required water temperature is specified on the geyser thermostat after which the geyser is expected
to control itself over time where circumstances constantly change, for example, fluctuations in the
outside temperature or change in the rate of water usage.
System Dynamics Modelling Feasibility
System dynamics modelling is one of many modelling and simulation tools available. A checklist is
devised from the various descriptions in the previous section to ensure that the type of system at
Page 2018
International Association for Management of Technology IAMOT 2015 Conference Proceedings
P275
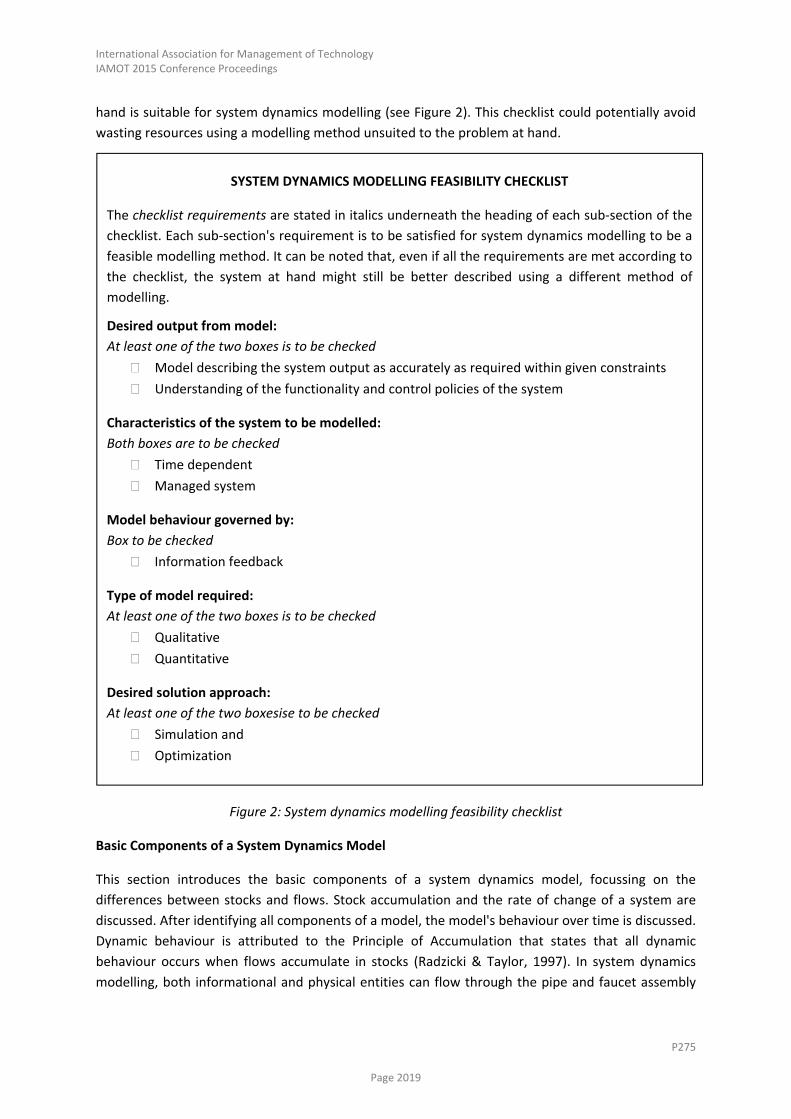
hand is suitable for system dynamics modelling (see Figure 2). This checklist could potentially avoid
wasting resources using a modelling method unsuited to the problem at hand.
Figure 2: System dynamics modelling feasibility checklist
Basic Components of a System Dynamics Model
This section introduces the basic components of a system dynamics model, focussing on the
differences between stocks and flows. Stock accumulation and the rate of change of a system are
discussed. After identifying all components of a model, the model's behaviour over time is discussed.
Dynamic behaviour is attributed to the Principle of Accumulation that states that all dynamic
behaviour occurs when flows accumulate in stocks (Radzicki & Taylor, 1997). In system dynamics
modelling, both informational and physical entities can flow through the pipe and faucet assembly
SYSTEM DYNAMICS MODELLING FEASIBILITY CHECKLIST
The checklist requirements are stated in italics underneath the heading of each sub‐section of the
checklist. Each sub‐section's requirement is to be satisfied for system dynamics modelling to be a
feasible modelling method. It can be noted that, even if all the requirements are met according to
the checklist, the system at hand might still be better described using a different method of
modelling.
Desired output from model:
At least one of the two boxes is to be checked
Model describing the system output as accurately as required within given constraints
Understanding of the functionality and control policies of the system
Characteristics of the system to be modelled:
Both boxes are to be checked
Time dependent
Managed system
Model behaviour governed by:
Box to be checked
Information feedback
Type of model required:
At least one of the two boxes is to be checked
Qualitative
Quantitative
Desired solution approach:
At least one of the two boxesise to be checked
Simulation and
Optimization
Page 2019

International Association for Management of Technology IAMOT 2015 Conference Proceedings
P275
to accumulate in the stocks. A stock can have an unlimited amount of both inflows and outflows
since the principal of accumulation holds regardless of the number of inflows or outflows.
Figure 3: Simple Stock and Flow Structure
A graphic example of a simple stock and flow structure is shown in Figure . In this example, the
system is only capable of stock inflow, indicated by a unidirectional arrow pointing in the direction of
the stock. An example of a simple stock‐flow structure with two flows, an inflow and outflow, is a
water tank where the stock is represented by the water in the tank and the flow can be thought of
as the valves, faucets and pipes that either fill or empty the tank. If the inflow is more than the
outflow at a given point in time, the stock is increasing, whereas, if the outflow is less than the
inflow, the stock is decreasing. The system is in a state of dynamic equilibrium if the inflow and the
outflow are equal.
Identifying Stocks and Flows
A fundamental skill when building a system dynamics model, which beginners often find challenging,
is correctly identifying each stock and flow in a particular system. A solid guideline is to distinguish
between variables defining the state and the variables defining the changes in state. Variables
responsible for defining the state are considered the system stocks whereas variables responsible
for defining the changes in states are considered the system flows (Radzicki & Taylor, 1997).
Differences between stocks and flows discussed by Coyle and Ford are listed in Table 1:
Table 1: Difference between stocks and flows (Coyle, 1996), (Ford, 1999).
Stocks Flows
Represented by nouns, for example debt Represented by verbs, for example deficit
If a hypothetical snapshot of a system were to be taken, stocks remain constant at the value observed in the instance of the snapshot.
If a hypothetical snapshot of a system were to be taken, all flows would be zero.
Serves as a source of information about the state to the rest of the system
Serves as a source of information about the state of the stock flow is flowing in/out.
Stocks
Radzicki and Taylor identified four individual stock characteristics that are responsible for the
dynamic behaviour in systems (Radzicki & Taylor, 1997). The first characteristic is that stocks have
memory. In the above example of the water tank, if both the inflow and outflow are shut off, the
amount of stock stays as is until an inflow or outflow is re‐introduced. The fallacy of shutting off an
inflow to stop a population over‐supply can be discredited using the characteristic of memory:
shutting off inflow doesn’t address the amount of entities currently in stock. A good example of the
influence this characteristic can have on a system can be found in (Meadows, et al., 1992).
Page 2020

International Association for Management of Technology IAMOT 2015 Conference Proceedings
P275
The second characteristic is that the nature of the flow is determined by the derivative of stock.
Mathematically this means that flow rate at t, q(t), is the derivative of the stock at t, s(t), with
respect to time. A thorough discussion of this characteristic can be found in (Forrester, 1968).
The third characteristic is that stocks “decouple” flows and allow disequilibrium behaviour at the
stocks. Therefore, regardless of stock level, the inflow does not necessarily have to equal the
outflow. This also means that the inflows and outflows can be controlled by different sources of
information that do not necessarily relate to each other at all (Radzicki & Taylor, 1997).
The final characteristic of stocks is that they create delays in the system and therefore enable
analysis over time. Identifying delays is an important step in the modelling process due to the
significant impact on the system. It is not always easy to perceive a connection between cause and
effect if there is a significant delay between the two.
Analysis over time
After identifying all components of a model, the next step is to identify key patterns of behaviour
over time. The performance of crucial components, or system variables, over time is defined as the
system variable’s time path. Time paths can be described as being linear, exponential, goal‐seeking,
oscillating, or S‐shaped in nature. Complex time paths can be described as exhibiting a combination
of several traits where the traits can be combined concurrently. For example, a steady increase with
small oscillations throughout evaluation, or sequentially, for example oscillating for 10 seconds
before continuing linearly.
Linear time paths
Linear time paths are categorised as growing, declining, or in a state of equilibrium. Systems are
seldom in a state of perfect balance. System equilibrium implies that all state variables are exhibiting
equilibrium time paths simultaneously. System dynamics modelling method recognises that it is
unlikely that a system would ever achieve equilibrium in reality, in contrast to much of modern
economics and management science, that uses the assumption of equilibrium as a basis for their
models. System dynamics models are only placed in an artificial state of equilibrium to study their
behaviour to the implementation of policy changes.
Exponential Time Paths
Exponential time paths are categorised as either growing or decaying. Most systems have
exponential time paths rather than linear time paths (Wagenaar & Sagaria, 1975), (Wagenaar &
Timmeri, 1978), (Wagenaar & Timmeri, 1979). In practice, problems consisting exclusively of pure
linear time paths usually contain no feedback and are likely not to conform to the definition of a
system in the context of system dynamics. The problems are therefore most likely better described
using a different method op applied mathematics or operations research.
Goal‐seeking Time Paths
Goal‐seeking time paths are paths that iteratively move as close as possible to a certain target‐value
over time. An exponential time path, where the exponent is negative, is an example of a path
seeking a goal since the time path asymptotically moves closer to a certain goal y‐value.
Page 2021

International Association for Management of Technology IAMOT 2015 Conference Proceedings
P275
Oscillating Time Paths
Oscillating time paths can be sustained, damped, exploding or chaotic in nature (Radzicki, 1990). A
period within an oscillating time path is defined as the number of peaks that occur before the
oscillation cycle repeats. Sustained oscillations are characterized by having a period of one,
therefore each oscillation is the exact replica of the previous oscillation. Damped oscillations
decrease in amplitude with each oscillation until finally settling at a mean value whereas exploding
oscillations increases in amplitude with each oscillation until the system either settles, therefore no
longer characterised as exploding, or until the system falls apart. A chaotic time path has an infinite
period since the irregular time path never repeats and is therefore considered random (Mosekilde,
et al., 1988).
S‐shaped Time Paths
Time paths that grow in an “S” shape over time have both exponential and goal‐seeking attributes.
The time path initially grows or declines exponentially before becoming goal‐seeking when the
system approaches its limit or carrying capacity.
Feedback
The final building block of dynamical systems is feedback. This section introduces the concept of
model feedback with emphasis on closed system feedback. The concept of positive and negative
feedback is also introduced. Feedback loops are often responsible for counter‐intuitive behaviour in
systems. A system can be classified as either ``open” or ``closed” (Ford, 1999).
Systems are classified as either open or closed. Closed systems have outputs that can both react to,
and influence their respective inputs. Open systems have no influence upon their inputs. Open
systems may only have outputs that respond to their respective inputs.
For a closed system a feedback path includes a stock, information about the stock, and a decision
rule that is influences the flow strictly in the order that it is mentioned. Coyle uses an
information/action/consequences paradigm schematic, coupled with a systematic procedure, to
explain the basic principles of feedback in system dynamics modelling.
Feedback loops are considered to be either positive, or negative. Positive feedback loops, or
reinforcing loops, reinforces the actions and results along loops resulting in a vicious or virtuous
cycle. Positive feedback is responsible for growth or decline of systems, often up to the point of
destabilization. Negative feedback loops work on bringing a system as close as possible to its desired
state. Negative feedback either stabilizes the system, or causes oscillation.
CONCLUSION
Both the South African government and the Western Cape government are committed to the
development of a green economy, even in the face of a global economic crisis, imminent depletion
of natural resources and climate change. This article gives an overview of national and provincial
responses to climate change that intentionally share the same common thread. An overview of
commercial fishing and aquaculture follows, forecasting a growing demand in aquaculture to
compensate for our current over‐fished fish stock as well as other, more resource intensive, sources
of protein. Commercial fishing and aquaculture are deemed fit to be modelled mathematically due
Page 2022
International Association for Management of Technology IAMOT 2015 Conference Proceedings
P275
to the combination of importance and complexity of the industries in relation to the green economy
transition. Next, this article reviews the discipline of mathematical modelling with emphasis on
system dynamics modelling. With a general introduction to the discipline of system dynamics, basic
components of a system dynamics model are introduced. System dynamics model behaviour over
time, as well as system feedback, is also explained in the before mentioned context.
The analysis and policy design of commercial fishing and aquaculture over time is of both high
priority and high complexity. It is therefore concluded that system dynamics modelling is a suitable
tool for commercial fishing and aquaculture policy makers on a provincial and national level. System
dynamics modelling can be used to explore a variety of scenarios where the severity and effect of
both climate change and government intervention is varied without much structural changes to the
model created.
The recommended further action is to construct a system dynamics model, combining commercial
fishing and aquaculture, with the overall modelling goal of evaluating proposed provincial
governmental frameworks and action plans in terms of social, economic and environmental
sustainability, taking into account the anticipated future climate change in the province.
REFERENCES
Coyle, R. G., 1996. System Dynamics Modelling: A PRACTICAL APPROACH. s.l.:Chapman and Hall.
DAFF, 2012. Acquaculture Yearbook, Cape Town: Department of Agriculture, Forestry and Fisheries.
DEA&DP, 2008. Western Cape Climate Change Response Strategy and Action Plan, Cape Town:
Western Cape Department of Envirionmental Affairs and Development Planning.
DEA&DP, 2013. Western Cape Provincial Spatial Development Framework ‐ Draft for Public
Comment, Cape Town: Western Cape Department of Environmental Affairs and Development
Planning.
DEA&DP, 2014. Western Cape Climate Change Response Strategy, Cape Town: Western Cape
Department of Environmental Affairs and Development Planning.
DEA, 2010. Department of Agriculture, Forestry and Fisheries Sector Growth and Development Plan
Draft, s.l.: Department of Agriculture, Forestry and Fisheries.
DEA, 2010. Summit Report, Pretoria: Department of Environmental Affairs.
DEA, 2011. National Strategy for Sustainable Development and Action Plan, Pretoria: Department of
Environmental Affairs.
Department of Environmental Affairs, 2011. National Strategy for Sustainable Development and
Action Plan, Johannesburg: s.n.
Department of Transport and Public Works, 2012. Provincial Land Transport Framework, Cape Town:
Western Cape Government.
Department of Transport and Public Works, 2013. Western Cape Infrastructure Framework, Cape
Town: Western Cape Government.
EDP, 2012. OneCape2040, Cape Town: Western Cape Economic Development Partnership.
Eykhoff, P., 1974. System Identification: Parameter and State Estimation. s.l.:John Wiley & Sons Ltd.
Page 2023

International Association for Management of Technology IAMOT 2015 Conference Proceedings
P275
Food and Agriculture Organization of the United Nations, 2008. Fisheries and Aquaculture, s.l.:
United Nations.
Ford, F. A., 1999. Modeling the Environment: An Introduction to System Dynamics Models of
Environmental. s.l.:Island Press.
Forrester, J. W., 1961. Industrial Dynamics. 1 ed. s.l.:The M.I.T. Press and John Wiley & Sons.
Forrester, J. W., 1968. Principles of Systems. Waltham: Pegasus Communications.
Gershenfeld, N., 1999. The nature of mathematical modeling. New York: Cambridge University Press.
GreenCape, 2014. GreenCape. [Online]
Available at: http://www.green‐cape.co.za/what‐we‐do/
[Accessed 03 10 2014].
GWC, 2010. Western Cape's Draft Strategic Plan, Cape Town: Government of the Western Cape.
Klamkin, M. S., 1980. Mathematical modelling: die cutting for a fresnel lens. Mathematical
Modelling, 1(1), pp. 63‐69.
Meadows, D. H., Meadows, D. L. & Randers, J., 1992. Beyond the Limits: Confronting Global Collapse,
Envisioning a Sustainable Future. Vermont: Chelsea Green: Post Mills.
Mosekilde, E., Aracil, J. & Allen, P. M., 1988. Special Issue on Chaos. System Dynamics Review,
Volume 4, pp. 1‐2.
National Planning Commission of South Africa, 2012. National Development Plan 2030: Our Future ‐
Make It Work, Pretoria: National Planning Commission.
Pearce, D., Markandya, A. & Barbier, E., 1992. Blueprint for a Green Economy. 6th ed. London:
Earthscan Publications Limited.
Radzicki, M. J., 1990. Industrial Dynamics, Deterministic Chaos, and Self‐Organizing Systems. Journal
of Economic Issues, Volume 4, pp. 1‐2.
Radzicki, M. J. & Taylor, R. A., 1997. Introduction to System Dynamics: A Systems Approach to
Understanding Complex Policy Issues, s.l.: US Department of Energy.
RSA, 2011. National Climate Change Response Policy White Paper, Pretoria: Republic of South Africa.
Saff, E. B. & Snider, A. D., 1993. Fundamentals of complex analysis for mathematics, science, and
engineering. s.l.:Prentice Hall.
UNEP, 2013. Green Economy Scoping Study: South African Green Economy Modelling Report, s.l.:
United Nations Environment Programme.
Wagenaar, W. A. & Sagaria, S. D., 1975. Misperception of exponential growth. Perception &
Psychophysics, Volume 18, pp. 416‐422.
Wagenaar, W. A. & Timmeri, H., 1978. Extrapolation of Exponential Time Series Is Not Enhanced By
Having More Data Points. Perceptions and Psychophysics, Volume 24, pp. 182‐184.
Wagenaar, W. & Timmeri, H., 1979. The Pond and Duckweed Problem: Three Experiments in the
Misperception of Exponential Growth. Acta Psychologica, Volume 43, pp. 239‐251.
WCG, 2012. Provincial Spatial Development Framework Draft, Cape Town: Western Cape
Government.
Page 2024

International Association for Management of Technology IAMOT 2015 Conference Proceedings
P275
WCG, 2013. GREEN IS SMART ‐ Western Cape Green Economy Strategy Framework, Cape Town:
Western Cape Government.
WESGRO, 2012. Annual Report, Cape Town: Western Cape Tourism, Trade & Investment Promotion
Agency.
Wolstenholme, E. F., 1990. System enquiry: a system dynamics approach. New York: Wiley
Chichester.
Page 2025


