Download - Cohu, Inc. Corporate Access Day

Page 1
July 11, 2017
Cohu, Inc. Corporate Access Day
Event to be Held July 13, 2017
9:00 am – 12:00 pm
Marriott, Santa Clara, CA

Page 2
July 11, 2017
..Safe Harbor StatementCertain matters discussed in this presentation, including statements concerning market growth rates for IoT, auto
semiconductor, processor and advanced packaging; “Cohu400” and “Cohu500” strategy goals and financial targets; market
share gain targets; SLT platform market opportunity; contactor market growth and Cohu sales goals; estimated 2017 financial
results and balance sheet; and strategic investment goals are forward-looking statements that are subject to risks and
uncertainties that could cause actual results to differ materially from those projected or forecasted. Such risks and uncertainties
include, but are not limited to, our ability to convert new products under development into production on a timely basis and to
meet customer delivery and acceptance requirements for new products; failure to obtain customer acceptance resulting in the
inability to recognize revenue and accounts receivable collection problems; market adoption of new products; intense
competition in the test handler industry; our reliance on patents and intellectual property; failure of critical suppliers; customer
concentration; compliance with U.S. export regulations; our ability to successfully integrate acquired businesses and
operations; ERP system implementation issues; the seasonal, volatile and unpredictable nature of capital expenditures by
semiconductor manufacturers; and rapid technological change. These and other risks and uncertainties are discussed more fully
in Cohu's filings with the Securities and Exchange Commission, including the most recently filed Form 10-K and Form 10-Q.
These forward-looking statements are not guarantees of future performance and speak only as of the date hereof, based on
information currently available to us. Cohu assumes no obligation to update the information in this presentation.
This presentation includes certain non-GAAP financial measures, including non-GAAP EBITDA, Adj. EBITDA, gross margin and
diluted earnings per share. These non-GAAP measures are in addition to, not a substitute for or superior to, measures of
financial performance prepared in accordance with U.S. GAAP. The non-GAAP financial measures used by Cohu may differ from
the non-GAAP financial measures used by other companies. A reconciliation of these measures to the most directly comparable
U.S. GAAP measure is included in the Appendix to these slides.
Page 3
July 11, 2017
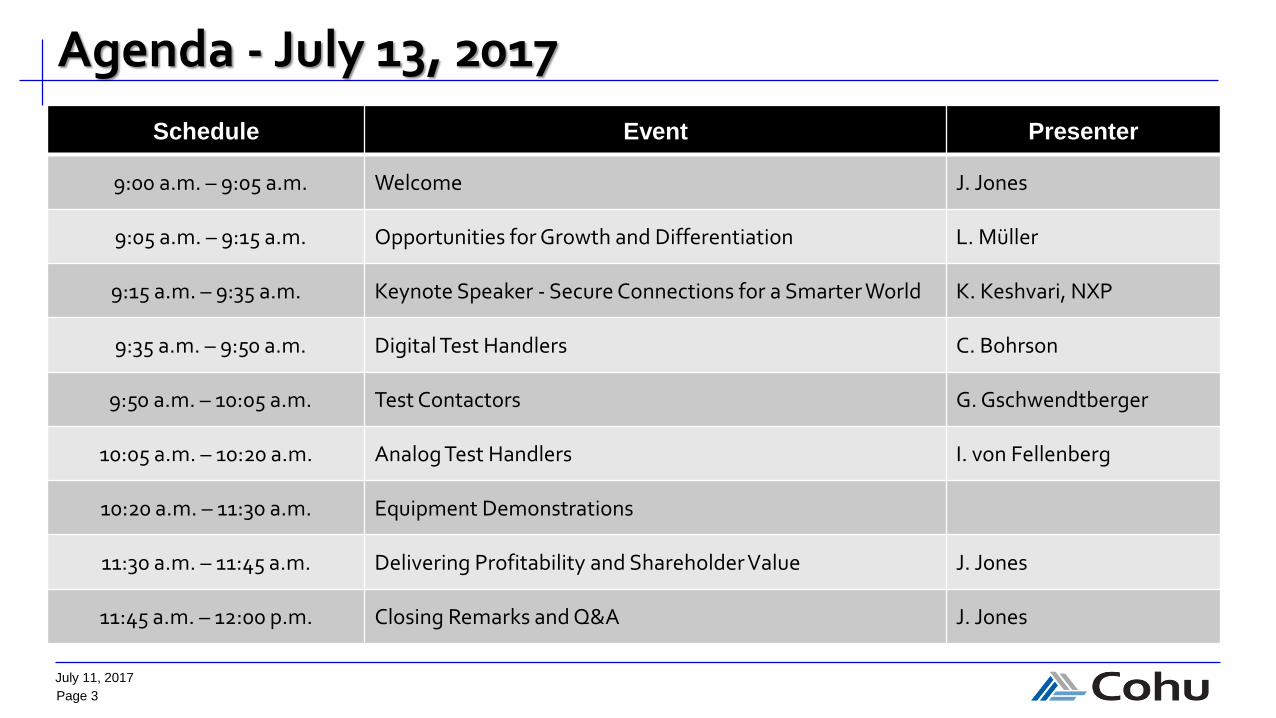
Schedule Event Presenter
9:00 a.m. – 9:05 a.m. Welcome J. Jones
9:05 a.m. – 9:15 a.m. Opportunities for Growth and Differentiation L. Müller
9:15 a.m. – 9:35 a.m. Keynote Speaker - Secure Connections for a Smarter World K. Keshvari, NXP
9:35 a.m. – 9:50 a.m. Digital Test Handlers C. Bohrson
9:50 a.m. – 10:05 a.m. Test Contactors G. Gschwendtberger
10:05 a.m. – 10:20 a.m. Analog Test Handlers I. von Fellenberg
10:20 a.m. – 11:30 a.m. Equipment Demonstrations
11:30 a.m. – 11:45 a.m. Delivering Profitability and Shareholder Value J. Jones
11:45 a.m. – 12:00 p.m. Closing Remarks and Q&A J. Jones
Agenda - July 13, 2017

Page 4
July 11, 2017
Opportunities for Growth and Differentiation
Luis MüllerPresident & CEO

Page 5
July 11, 2017
Corporate Profile
Global technology and market leader in $1.5 billion*
Semiconductor Final Test Handlers and Contactors
CompanyNASDAQ
COHU
Revenue(LTM**)
$297M
EBITDA(LTM**)
12%
Net Cash(1Q17)
$96M
Employees(Worldwide)
~1,750
We create leading-edge solutions for semiconductor test and inspection
* VLSI Research and Company estimates
** LTM as of 1Q17; EBITDA reflects non-GAAP

Page 6
July 11, 2017
Multiple Markets – Leading SolutionsThermal and Vision Inspection technologies enabling higher yield customer value

Page 7
July 11, 2017
Key Industry Trends
(all devices in color are WLCSPs)
Unit Growth
Increasing IC content in vehicles, factory automation (robotics) and exponential increase in connectivity (Internet-of-Things)
System in Package Integration
Growing integration of wafer-level CSP in complex packages (2.5D – 3D technologies)
Semiconductor Integration
Increasing integration test and inspection challenges
* Source: Zephyr: IoT and Its Impact on Testing
Page 8
July 11, 2017
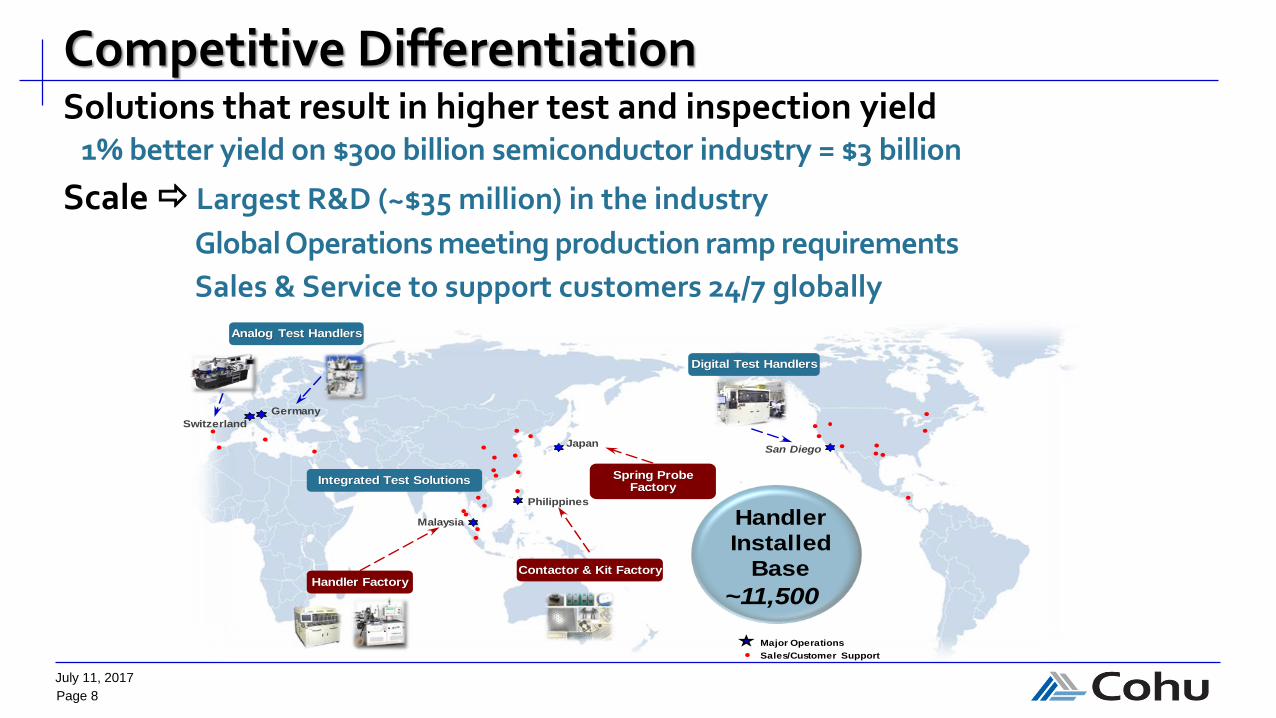
Competitive DifferentiationSolutions that result in higher test and inspection yield
1% better yield on $300 billion semiconductor industry = $3 billion
Scale Largest R&D (~$35 million) in the industry
Global Operations meeting production ramp requirements
Sales & Service to support customers 24/7 globally
Japan
Philippines
Malaysia
San Diego
Germany
Switzerland
Major Operations
Sales/Customer Support
Analog Test Handlers
Digital Test Handlers
Contactor & Kit FactoryHandler Factory
~11,500
Handler
Installed
Base
Integrated Test Solutions Spring Probe Factory

Page 9
July 11, 2017
Delivering Positive Results
Achieving growth share gain in core handlers, new WLCSP prober, expansion in test contactors
200
220
240
260
280
300
320
340
360
380
400
2015 2016 2017 Cohu400
$269M
$282M
$400M
** Since introduction of Cohu400 in June 2015
*** Company estimates
$345M*
RevenueCohu400Strategy
Results to-date**
4 to 6 points handler share gain
+2 points share in mobility and automotive markets***
4 to 8 points test contactor share gain
+3 points share inc. Kita acquisition, new RF product***
Enter WLCSP probe for 30-50% share
Unveiling PANTHER today, WLCSP prober
Ship 90% handlers from Asia Operations
90%+ handlers shipping from Malaysia since 1Q17
* Analyst consensus estimates
Page 10
July 11, 2017
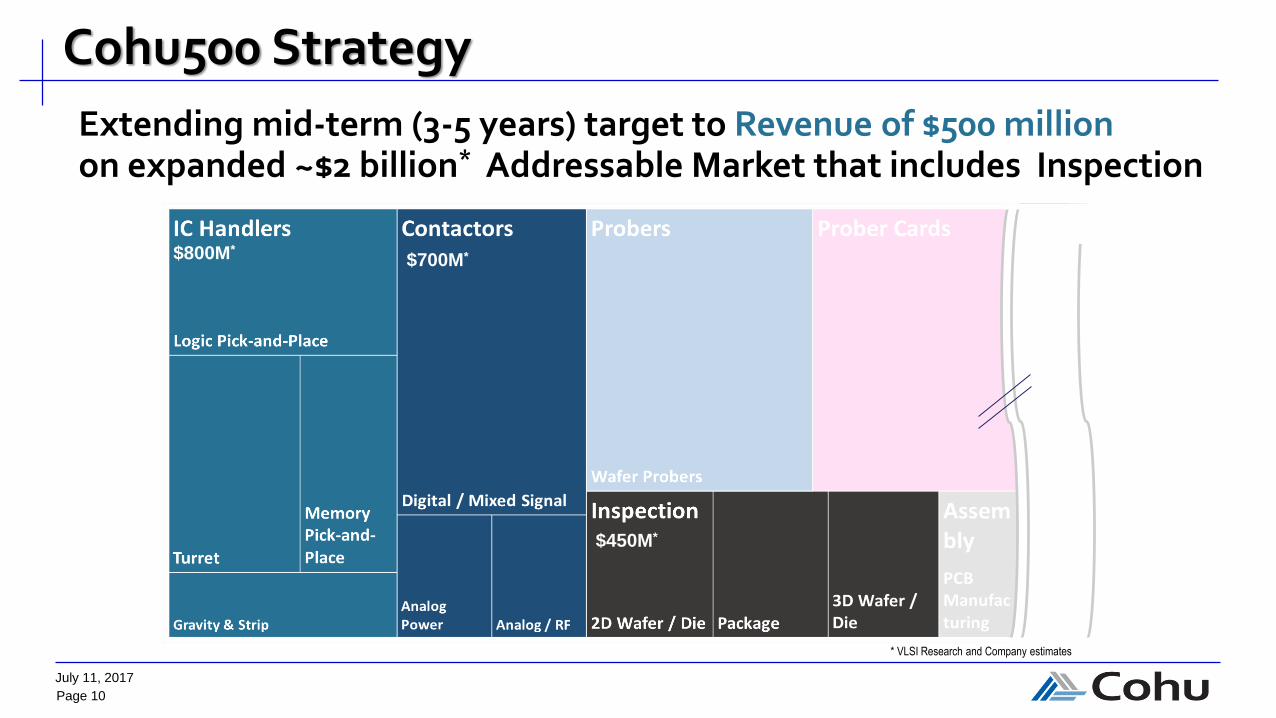
Cohu500 Strategy
Extending mid-term (3-5 years) target to Revenue of $500 million on expanded ~$2 billion* Addressable Market that includes Inspection
* VLSI Research and Company estimates
$800M*$700M*
$450M*
Page 11
July 11, 2017
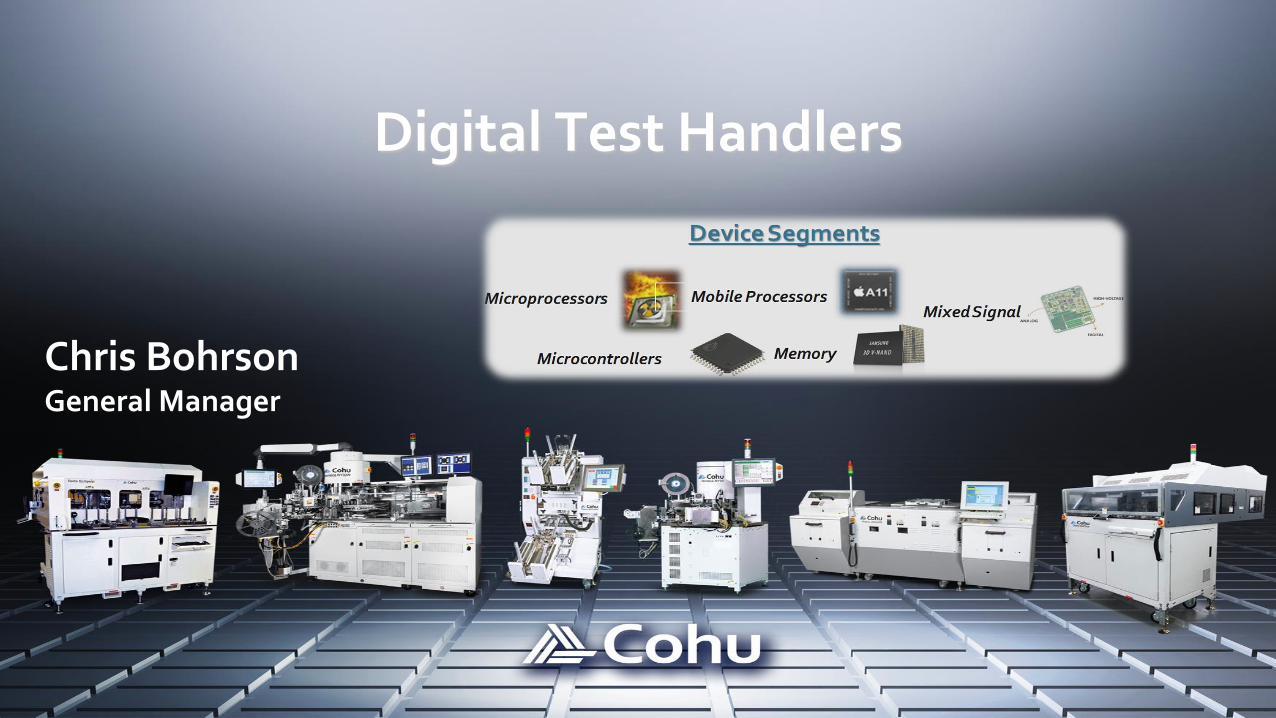
Digital Test Handlers
Chris BohrsonGeneral Manager

Page 12
July 11, 2017
Attractive Growth MarketsCAGR through 2020*
Mixed signal: 7%
• ASIC (application specific IC)
• DSP (digital signal processor)
Automotive Processors: 12%
• Microprocessor Unit (MPU)
• Microcontroller Unit (MCU)
Growth of autonomous vehicles will benefit Graphics Processor Units
CAGR through 2020*
Mobile: 10%
Server/cloud 2.2%
PCs growing at less than 1%
Rise of AI (10X growth)
Advanced wireless 5%
Internet of a trillion things 27%
Gaming 25%, AR/VR 200%+
4% CAGR
* Sources: McKinsey, Gartner, IC Insights, Bank of America & company estimates
10.3% CAGR
Automotive IC Sales
22.9
37.4
10% CAGR

Page 13
July 11, 2017
Increasing Thermal Related Yield Challenges
Automotive Processors
Yield Loss ($$)
100W
100W
100W 100W
100W
100W
Extreme temperature control range
With high test parallelism
Market: Handler:
Page 14
July 11, 2017
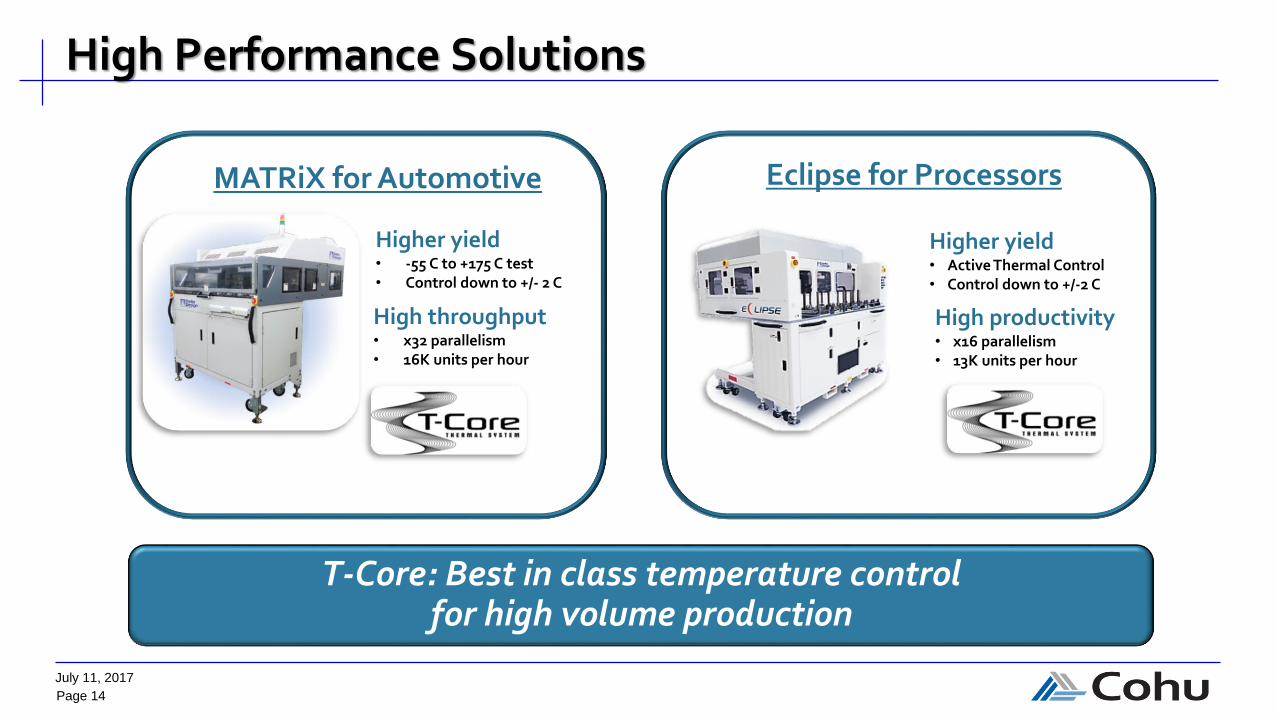
High Performance Solutions
MATRiX for Automotive Eclipse for Processors
Higher yield• -55 C to +175 C test• Control down to +/- 2 C
High throughput• x32 parallelism• 16K units per hour
Higher yield• Active Thermal Control• Control down to +/-2 C
High productivity• x16 parallelism• 13K units per hour
T-Core: Best in class temperature control for high volume production
Page 15
July 11, 2017
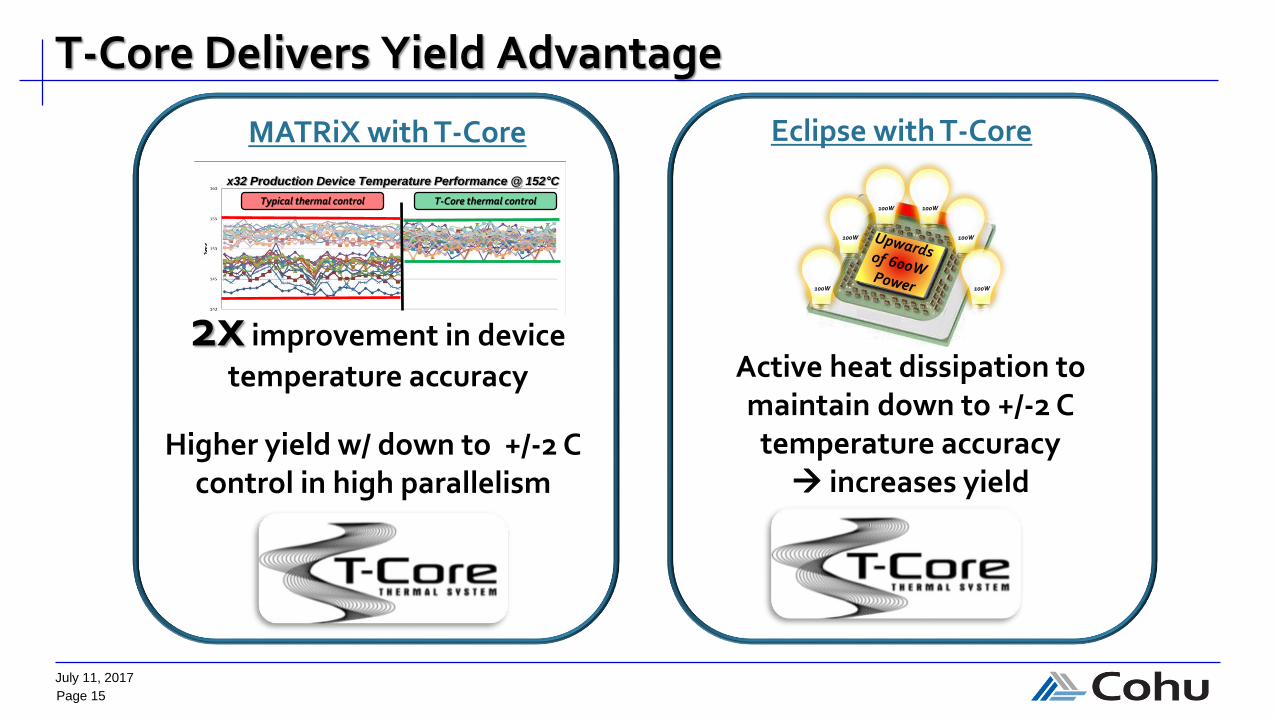
T-Core Delivers Yield Advantage
MATRiX with T-Core Eclipse with T-Core
100W
100W
100W 100W
100W
100W
Active heat dissipation to maintain down to +/-2 C
temperature accuracy increases yield
2x improvement in device
temperature accuracy
Extreme temperature thermal control range
x32 Production Device Temperature Performance @ 152°C
Typical thermal control T-Core thermal control
Higher yield w/ down to +/-2 C control in high parallelism

Page 16
July 11, 2017
What is System Level Testing; why is it needed?Discontinuity: denser devices (< 10 nm devices) & higher quality levels driving changes in testing
Gap: traditional test coverage from Functional and Structural testing no longer adequate for testing complex devices
Solution:
System Level Test emulates real-world device configuration (boot test, high speed interfaces…)
Combination of Structural, Functional and System Level Testing leads to highest quality
Testing requires thermal management
System Level Test
StructuralTest
FunctionalTest
FullTest
Coverage
Page 17
July 11, 2017
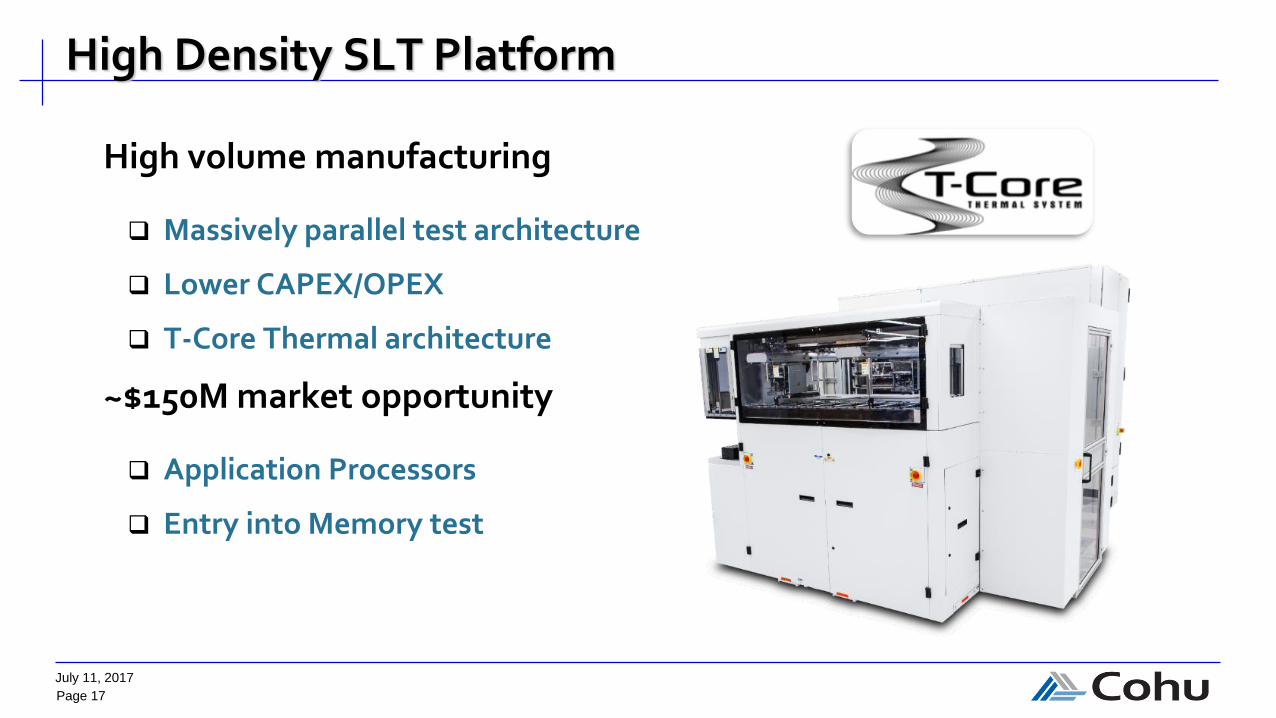
High Density SLT Platform
High volume manufacturing
Massively parallel test architecture
Lower CAPEX/OPEX
T-Core Thermal architecture
~$150M market opportunity
Application Processors
Entry into Memory test

Page 18
July 11, 2017
Gerhard GschwendtbergerGeneral Manager
Integrated Test Solutions
Page 19
July 11, 2017
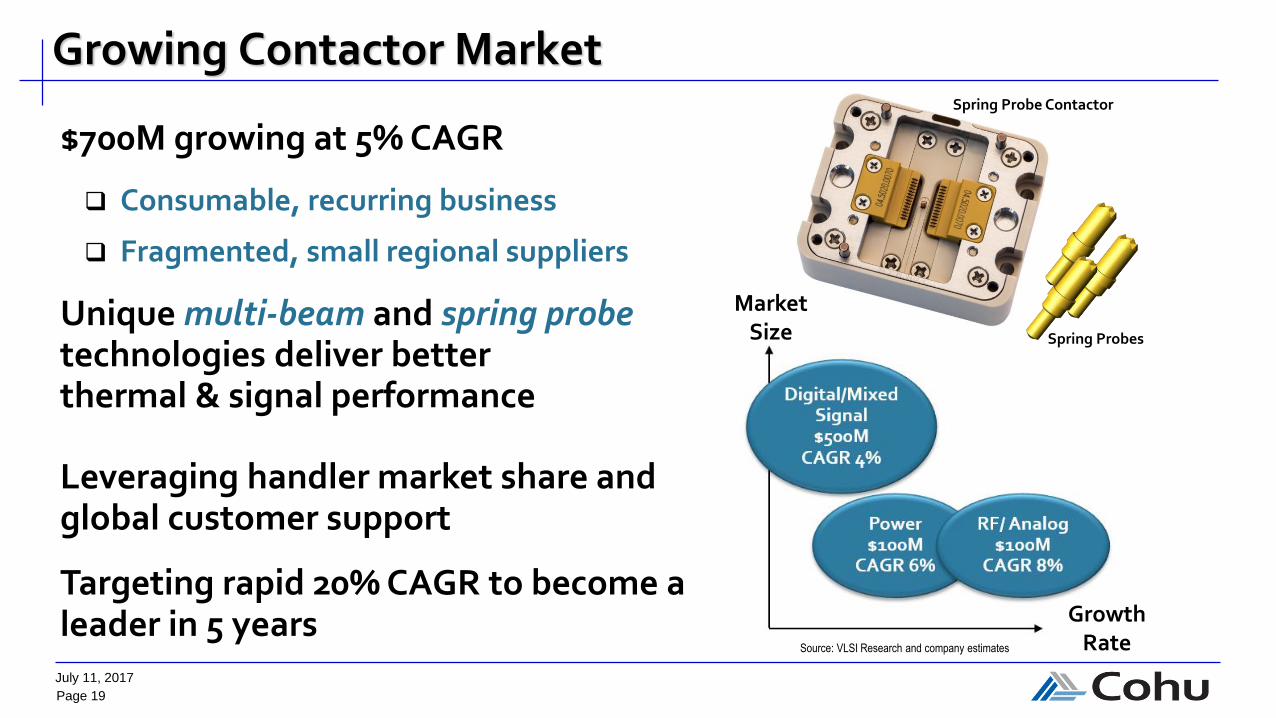
Growing Contactor Market
$700M growing at 5% CAGR
Consumable, recurring business
Fragmented, small regional suppliers
Unique multi-beam and spring probe technologies deliver better thermal & signal performance
Leveraging handler market share and global customer support
Targeting rapid 20% CAGR to become a leader in 5 years
Market Size
Spring Probe Contactor
Growth Rate
Spring Probes
Source: VLSI Research and company estimates
Page 20
July 11, 2017
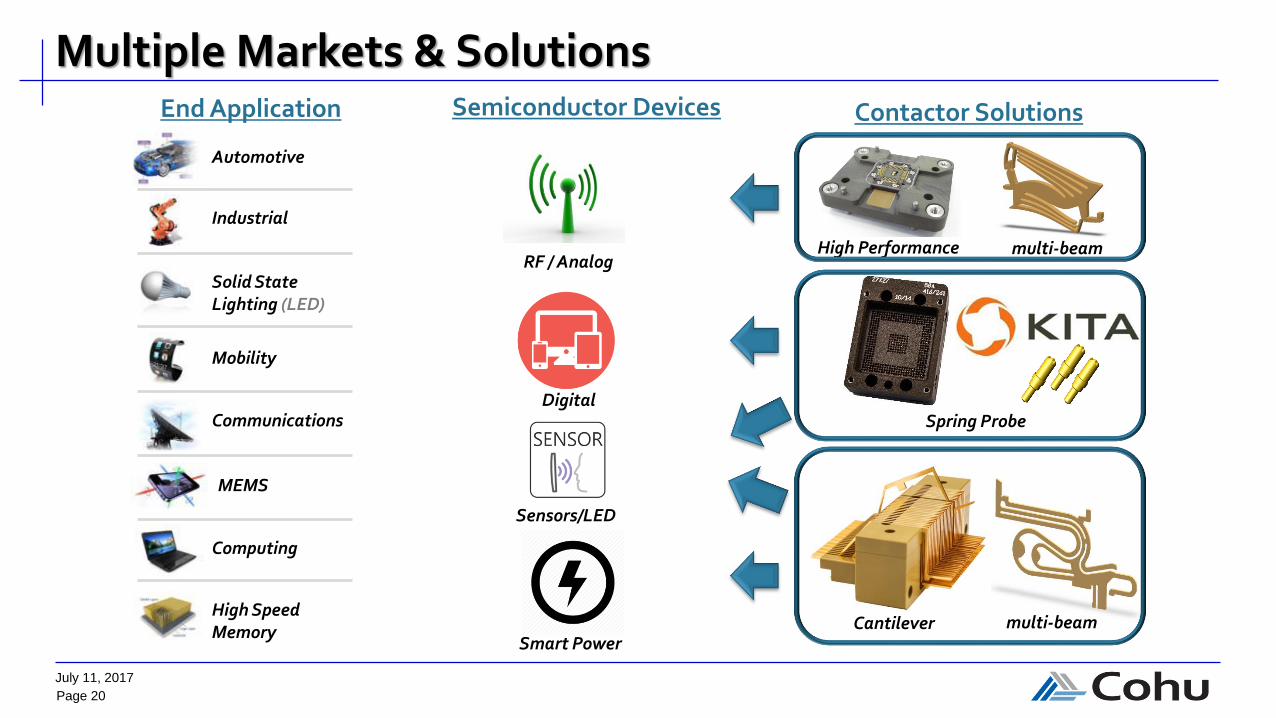
Multiple Markets & Solutions
Automotive
Industrial
Solid StateLighting (LED)
Mobility
Communications
MEMS
Computing
High Speed Memory
End Application Semiconductor Devices
RF / Analog
Digital
Sensors/LED
Smart PowerCantilever
Spring Probe
High Performance
Contactor Solutions
multi-beam
multi-beam

Page 21
July 11, 2017
Achieving Higher Yield Faster
Contact Element
Contactor Housing
Handling System
Accurate temperature control, integration with Cohu handlers
One-stop-shop reduces integration & setup time – “time to yield” is key differentiation for our large handler installed base
Total Integration
Time to
Yield
Temperature
Control
Page 22
July 11, 2017
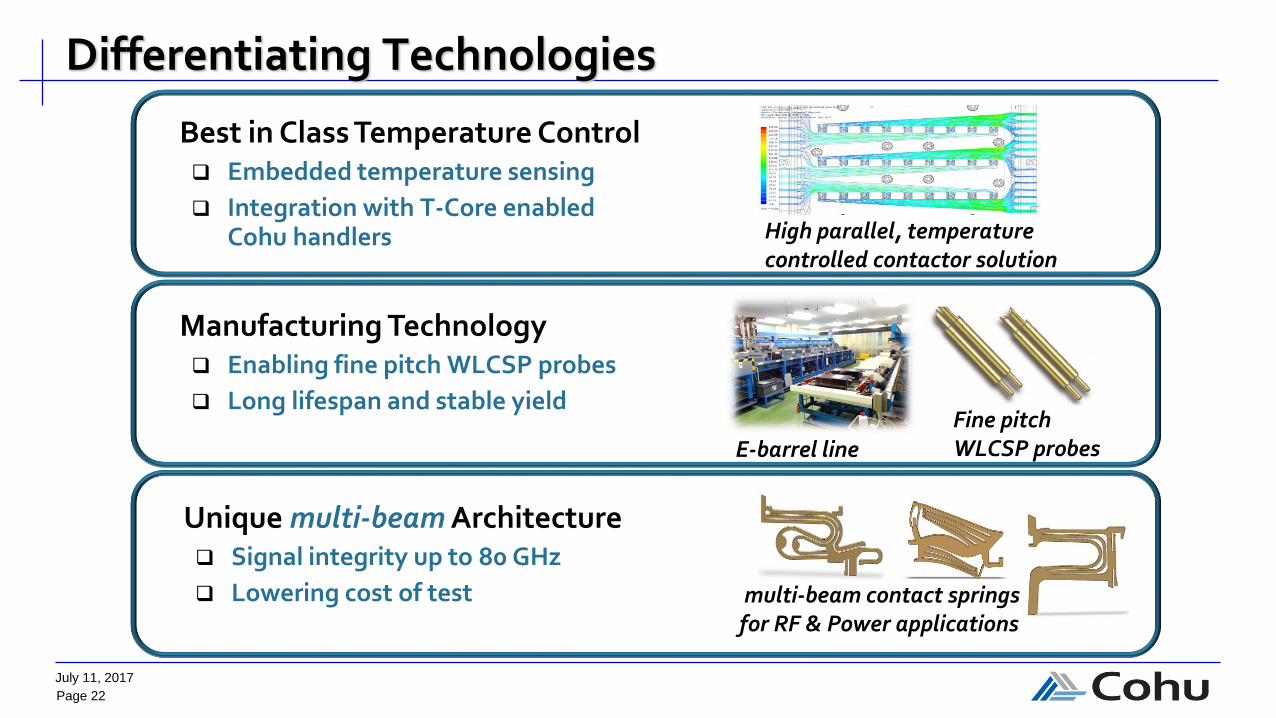
Differentiating Technologies
Best in Class Temperature Control Embedded temperature sensing
Integration with T-Core enabled Cohu handlers
E-barrel line Fine pitchWLCSP probes
High parallel, temperature controlled contactor solution
Unique multi-beam Architecture Signal integrity up to 80 GHz
Lowering cost of test
Manufacturing Technology Enabling fine pitch WLCSP probes
Long lifespan and stable yield
multi-beam contact springs for RF & Power applications

Page 23
July 11, 2017
Solving Next Generation Test Challenges
CAGR (2017-2020) ~10%
Unique WLCSP solution for 5G / WiGig high frequency test
Traceability & recipe management enabling Industry 4.0
Optimized for stringent quality requirements in Automotive radar
Source: Yole Development and company estimates
Page 24
July 11, 2017
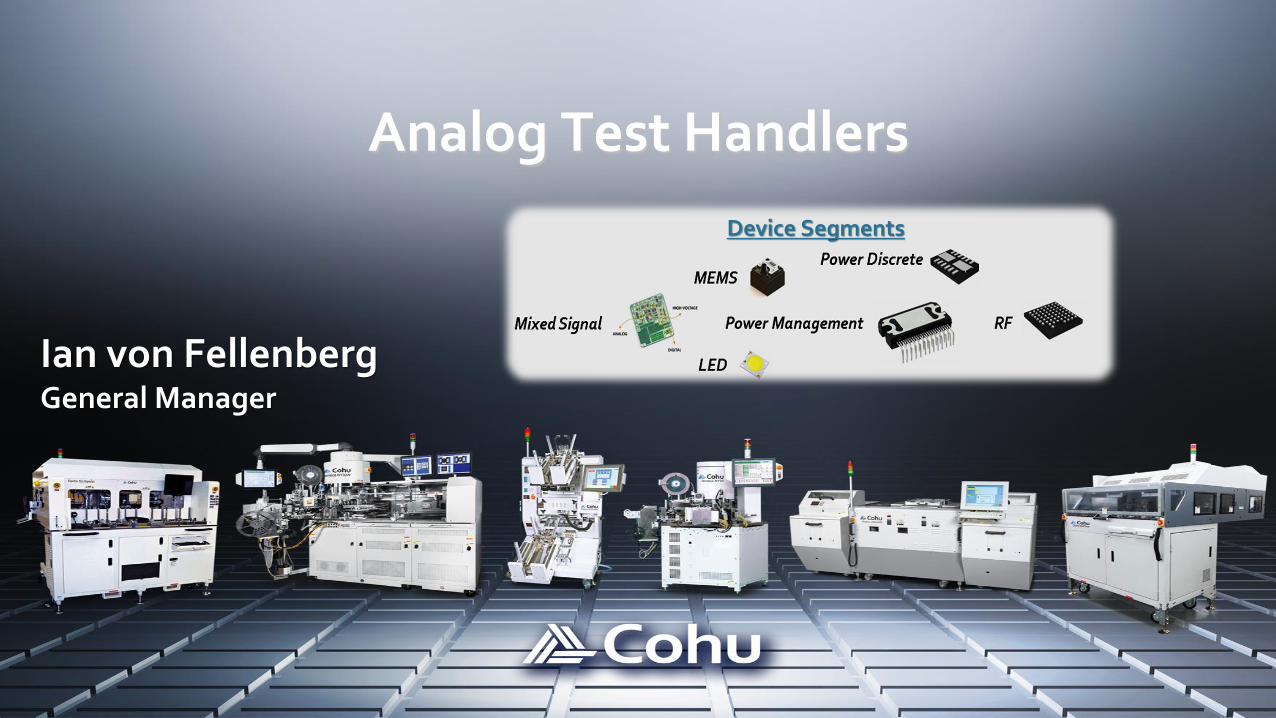
Ian von FellenbergGeneral Manager
Device Segments
Analog Test Handlers
Page 25
July 11, 2017
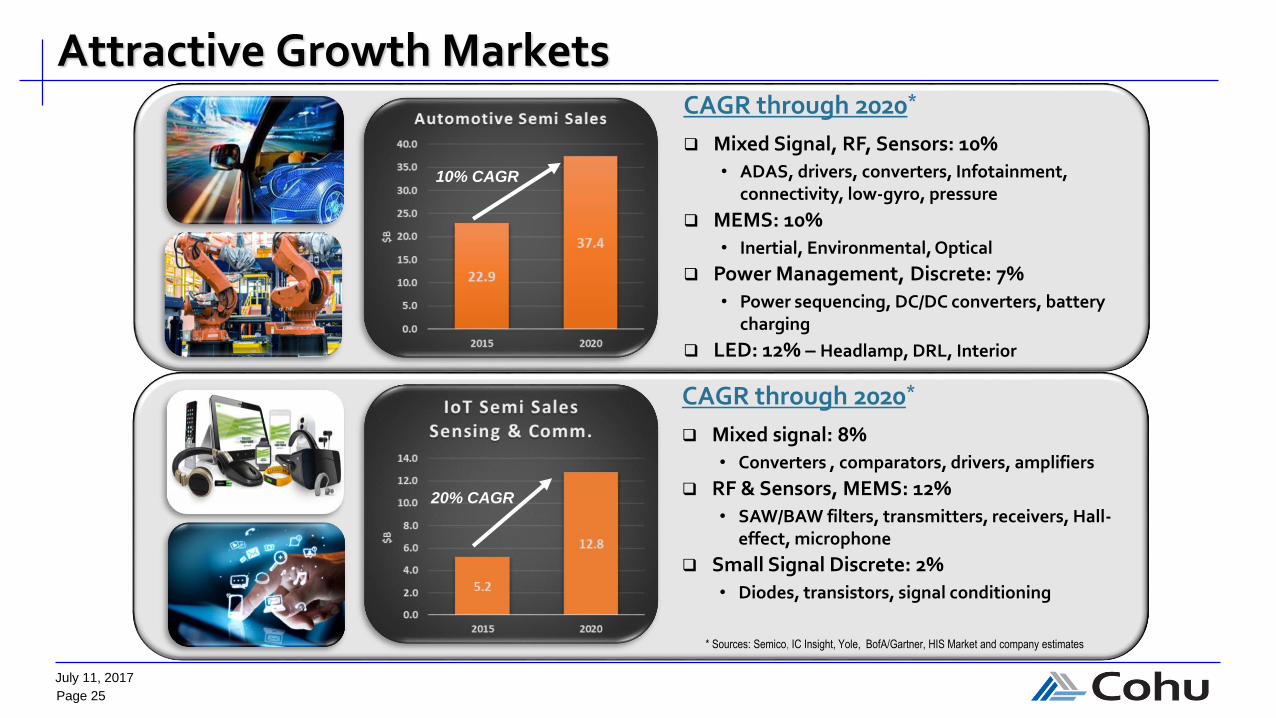
Attractive Growth Markets
CAGR through 2020*
Mixed signal: 8%
• Converters , comparators, drivers, amplifiers
RF & Sensors, MEMS: 12%
• SAW/BAW filters, transmitters, receivers, Hall-effect, microphone
Small Signal Discrete: 2%
• Diodes, transistors, signal conditioning
10.3% CAGR
Automotive IC Sales
22.9
37.4
* Sources: Semico, IC Insight, Yole, BofA/Gartner, HIS Market and company estimates
10% CAGR
CAGR through 2020*
Mixed Signal, RF, Sensors: 10%
• ADAS, drivers, converters, Infotainment, connectivity, low-gyro, pressure
MEMS: 10%
• Inertial, Environmental, Optical
Power Management, Discrete: 7%
• Power sequencing, DC/DC converters, battery charging
LED: 12% – Headlamp, DRL, Interior
20% CAGR

Page 26
July 11, 2017
Increasing Quality Requirements
Micro-scale defect detection in thin & fragile devices and WLCSPs is a growing challenge
ElectricalOptical
ThermalMechanical
Large defect
Electrical test
Micro-scale defect
Electrical test
Need micro-scale defect detection systems

Page 27
July 11, 2017
Broad Product Solutions
NY Turret – JaguarMobile & IoT
High throughput • 50K units per hour • Fully integrated
Back-end processes,optimized footprint
• WLCSP test• High parallelism
Higher yield• Test contact
solutions• Hi-Resolution vision
inspection• Thin & Fragile device
handling
NY Turret – Gravity – JaguarAutomotive & Industrial
High productivity • High parallelism • Process traceability • Configurable
platform
Higher yield • High power test• Vision inspection• Tri-Temperature
testing
NVCore: Highest resolution vision inspection atproduction throughput
Page 28
July 11, 2017
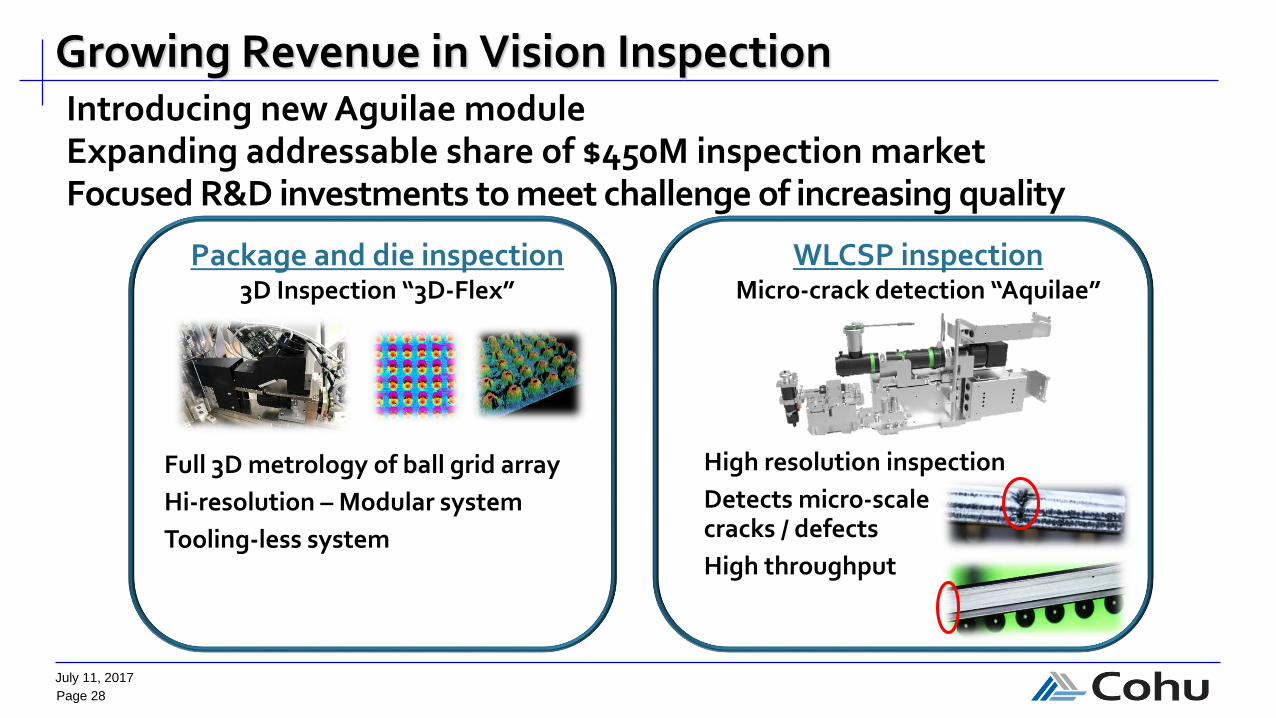
Growing Revenue in Vision Inspection
Package and die inspection 3D Inspection “3D-Flex”
WLCSP inspection Micro-crack detection “Aquilae”
Full 3D metrology of ball grid array
Hi-resolution – Modular system
Tooling-less system
High resolution inspection
Detects micro-scale cracks / defects
High throughput
Introducing new Aguilae moduleExpanding addressable share of $450M inspection marketFocused R&D investments to meet challenge of increasing quality
Page 29
July 11, 2017
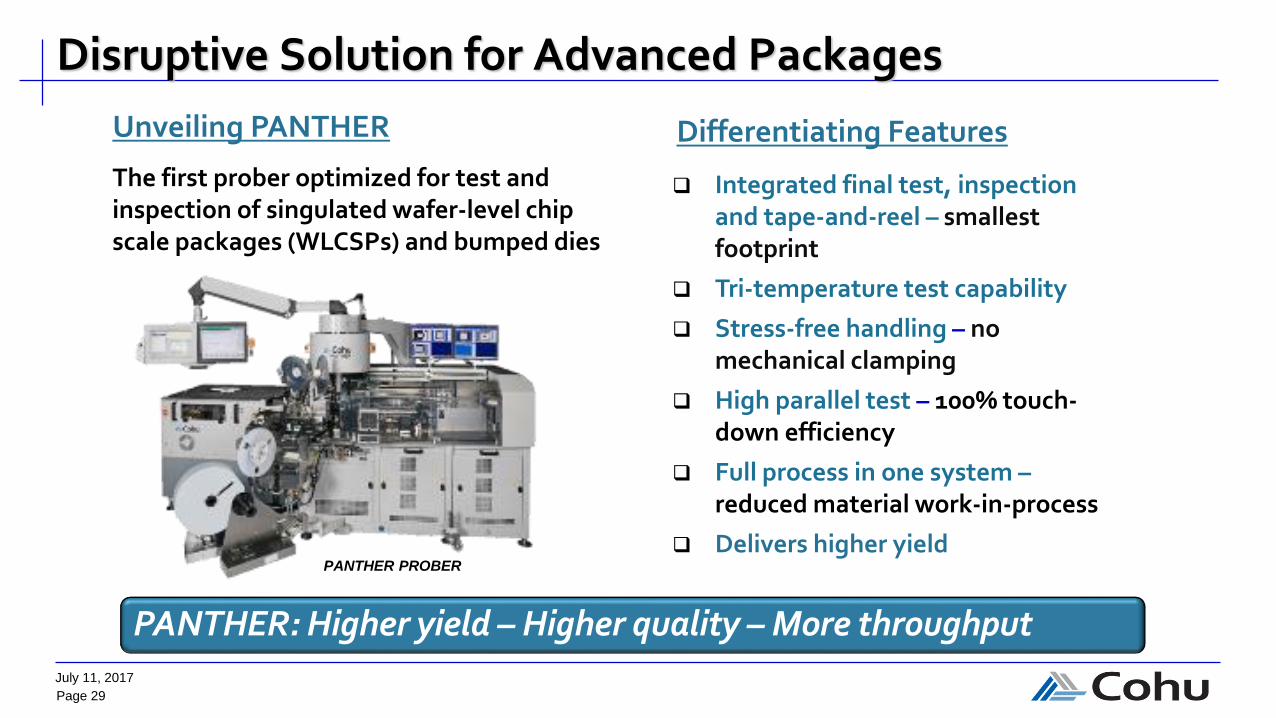
Disruptive Solution for Advanced Packages
Unveiling PANTHER
The first prober optimized for test and inspection of singulated wafer-level chip scale packages (WLCSPs) and bumped dies
Differentiating Features
PANTHER PROBER
Integrated final test, inspection and tape-and-reel – smallest footprint
Tri-temperature test capability
Stress-free handling – no mechanical clamping
High parallel test – 100% touch-down efficiency
Full process in one system –reduced material work-in-process
Delivers higher yield
PANTHER: Higher yield – Higher quality – More throughput
Page 30
July 11, 2017
Jeff JonesVP Finance & CFO
Delivering Profitability and Shareholder Value

Page 31
July 11, 2017
Sales ~ $93M ~ $174M
Gross Margin*** ~ 40% ~ 41%
Operating Expense*** ~ $23M ~ $45M
Preliminary Q2 and 1H17 Results
Record orders in 2Q17
Strong 2Q17 results reflects early customer acceptance of new products and increased recurring revenue due to higher utilization
Projecting second half 2017 sales to be approximately the same as first half sales, with typical seasonality in Q3 and Q4
Unaudited Prelim. Results
* Preliminary 2Q17 results announced on July 11, 2017** 1H17 amounts consist of 1Q17 actual results combined with 2Q17 preliminary results*** Amounts are Non-GAAP and exclude amortization of purchased intangibles, stock based compensation expense, acquisition and inventory mark-up costs, manufacturing transition and severance costs.
2Q17* 1H17**

Page 32
July 11, 2017
Strategy & Execution Yielding Results
Share gain in handler automotive and mobility marketsGrowth in contactors with Kita acquisitionGross margin expansion from Asia manufacturingTight Opex control while investing for growth
$270$282
$345
2015 2016 2017Est.*
Revenue ($M)
35%
36%
40%
2015 2016 2017Est.*
Gross Margin**
9%10%
16%
2015 2016 2017Est.*
EBITDA**
$0.58 $0.68
$1.45
2015 2016 2017Est.*
Diluted EPS**
* Analyst consensus estimates
** Amounts are Non-GAAP and exclude amortization of purchased intangibles, stock based compensation expense, acquisition costs, manufacturing transition and severance costs.
Page 33
July 11, 2017
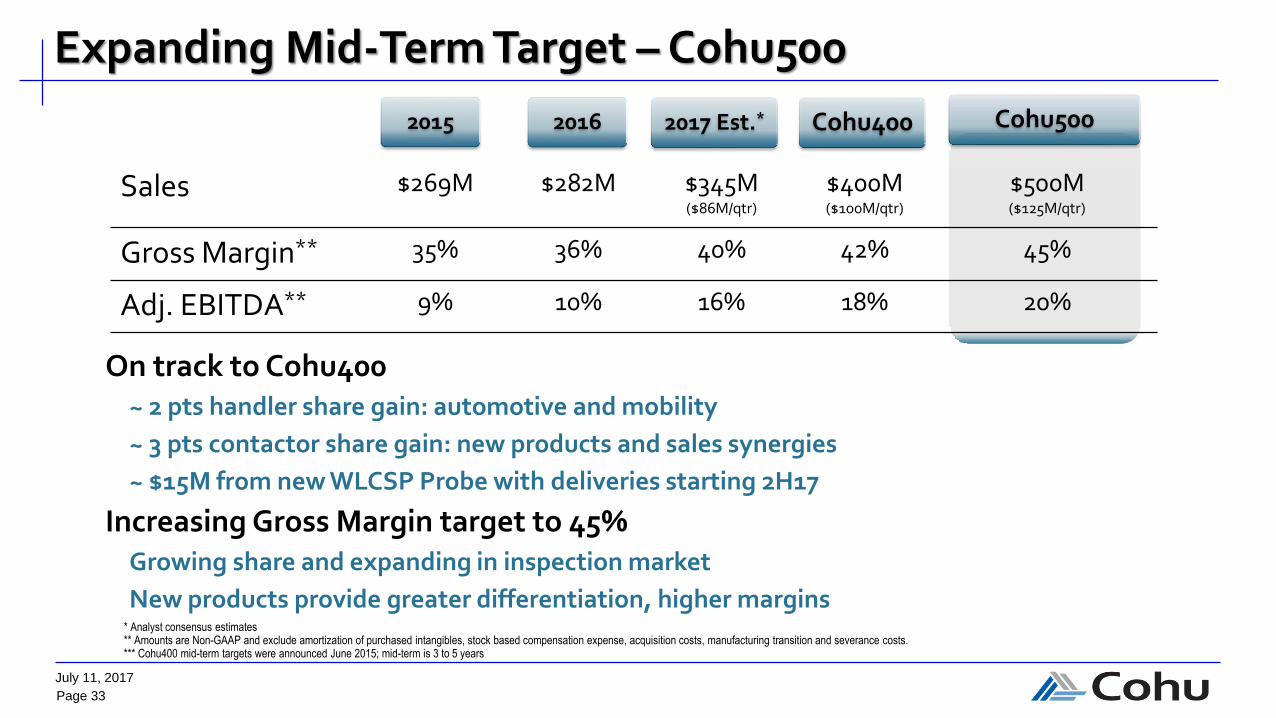
Sales $269M $282M $345M($86M/qtr)
$400M($100M/qtr)
$500M($125M/qtr)
Gross Margin** 35% 36% 40% 42% 45%
Adj. EBITDA** 9% 10% 16% 18% 20%
Expanding Mid-Term Target – Cohu500
On track to Cohu400~ 2 pts handler share gain: automotive and mobility
~ 3 pts contactor share gain: new products and sales synergies
~ $15M from new WLCSP Probe with deliveries starting 2H17
Increasing Gross Margin target to 45%Growing share and expanding in inspection market
New products provide greater differentiation, higher margins
2015 2016 Cohu5002017 Est.* Cohu400
* Analyst consensus estimates** Amounts are Non-GAAP and exclude amortization of purchased intangibles, stock based compensation expense, acquisition costs, manufacturing transition and severance costs.*** Cohu400 mid-term targets were announced June 2015; mid-term is 3 to 5 years

Page 34
July 11, 2017
$250
$300
$350
$400
$450
$500
2017 Est.(Analysts)
HandlerShare Gain
ContactorShare Gain
PANTHER InspectionSystems
Sales
WLCSP Probe
Path to Cohu500$M
Approx. 6 pts handler share gain in growing automotive and mobilityGrow to #1/#2 in contactors: product performance, global supportExpand in inspection market with automotive and advanced packages

Page 35
July 11, 2017
Accelerating Growth with Acquisitions
Strong track record of successful acquisitions
Acquisition investment criteriaExpand into profitable, complementary markets
Deliver margin in-line with mid-term financial model
Leverage infrastructure: technology, operations, sales and support
CriteriaRasco
Dec 2008
Ismeca
Jan 2013
Kita
Jan 2017
Market Expansion Gravity, Test-in-Strip, MEMS Turret, Inspection, LED Spring Probe Contactor
Market Share #2 in 2008, grew to #1 in 2014 #1, acquired the leader Top 5 leader and growing
Infrastructure
Leverage
100% complementary products;
Common sales and customer
support
100% complementary products;
Common sales and customer
support; Malaysia Mfg. and Supply
Chain
100% complementary products;
Japan Mfg. and Customer
Relationships
Realized Synergies Sales ~ $16M; Costs ~ $2M Sales ~ $25M; Costs ~$14M Mid-Term Target Sales ~ $16M

Page 36
July 11, 2017
$0
$20
$40
$60
$80
$100
$120
$140
FY13 FY14 FY15 FY16 FY17 Est.
Net Cash
Strong Cash Balance to Support Growth$M
$15M deployed to acquire Kita in January 2017Operating cash flow of >$20M annually in last 3 yearsHealthy cash conversion cycle at 114 days (1Q17)
Cash req’dfor Ops, Capex & Dividend
Excess cash for strategic investments
1Q17 Balance
Est. cash
increase

Page 37
July 11, 2017
Closing Remarks
Jeff JonesVP Finance & CFO

Page 38
July 11, 2017
Expanding Mid-Term Target to $500M
Increasing TAM to $2 Billion
with new WLCSP prober, investments in vision inspection
and test contactors
StrategicAcquisitions
in profitable, complementary markets leveraging
infrastructure and delivering synergies
Profitability & Cash Flow
with low cost manufacturing structure and Opex leverage
Gaining Share in Core Markets
with growing automation, artificial intelligence and
communications requirements in automotive, mobility & IoT
Focused on Differentiationthermal control, vision
inspection and integrated test solutions that enable higher
customer yield
Cohu500 Targets
delivers 45% gross margin* and 20% EBITDA* at $500M
* Amounts are Non-GAAP and exclude amortization of purchased intangibles, stock based compensation expense, acquisition costs, manufacturing transition and severance costs.

Page 39
July 11, 2017
Thank You
July 13, 2017
9:00 am – 12:00 pm
Marriott, Santa Clara, CA

Page 40
July 11, 2017
Appendix
Page 41
July 11, 2017
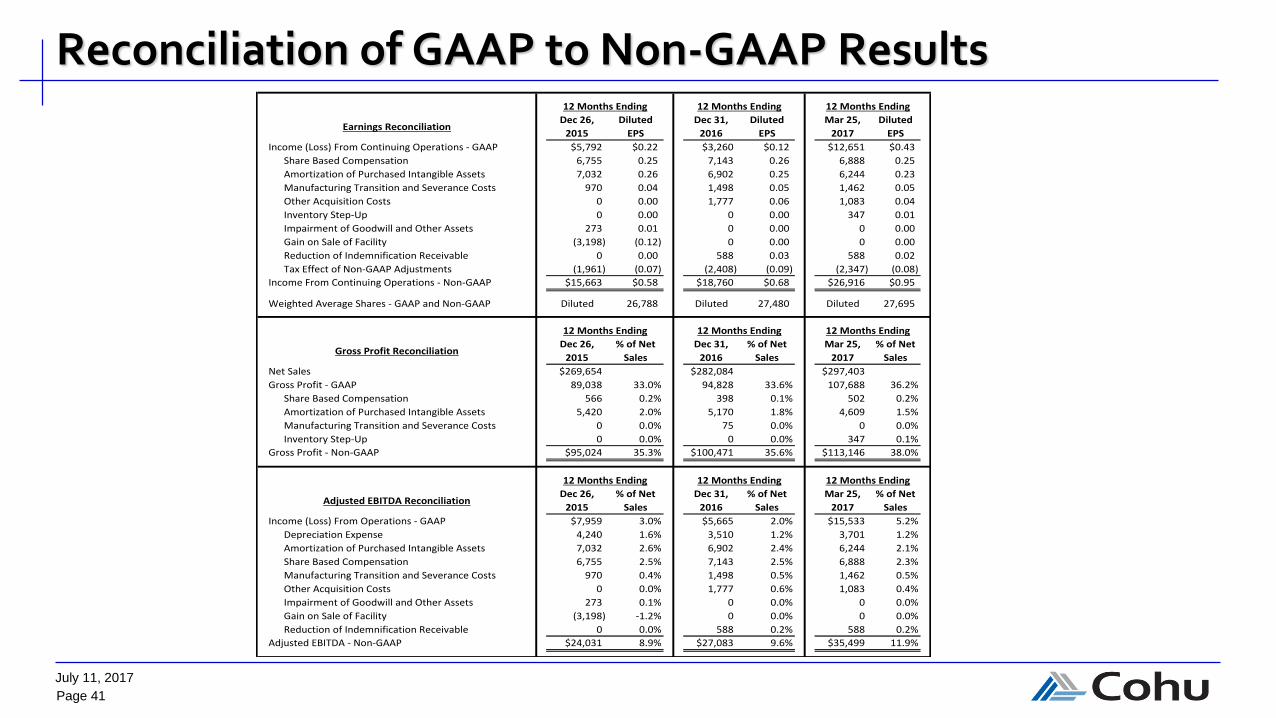
Reconciliation of GAAP to Non-GAAP Results
Earnings ReconciliationDec 26,
2015
Diluted
EPS
Dec 31,
2016
Diluted
EPS
Mar 25,
2017
Diluted
EPS
Income (Loss) From Continuing Operations - GAAP $5,792 $0.22 $3,260 $0.12 $12,651 $0.43
Share Based Compensation 6,755 0.25 7,143 0.26 6,888 0.25
Amortization of Purchased Intangible Assets 7,032 0.26 6,902 0.25 6,244 0.23
Manufacturing Transition and Severance Costs 970 0.04 1,498 0.05 1,462 0.05
Other Acquisition Costs 0 0.00 1,777 0.06 1,083 0.04
Inventory Step-Up 0 0.00 0 0.00 347 0.01
Impairment of Goodwill and Other Assets 273 0.01 0 0.00 0 0.00
Gain on Sale of Facility (3,198) (0.12) 0 0.00 0 0.00
Reduction of Indemnification Receivable 0 0.00 588 0.03 588 0.02
Tax Effect of Non-GAAP Adjustments (1,961) (0.07) (2,408) (0.09) (2,347) (0.08)
Income From Continuing Operations - Non-GAAP $15,663 $0.58 $18,760 $0.68 $26,916 $0.95
Weighted Average Shares - GAAP and Non-GAAP Diluted 26,788 Diluted 27,480 Diluted 27,695
Gross Profit ReconciliationDec 26,
2015
% of Net
Sales
Dec 31,
2016
% of Net
Sales
Mar 25,
2017
% of Net
Sales
Net Sales $269,654 $282,084 $297,403
Gross Profit - GAAP 89,038 33.0% 94,828 33.6% 107,688 36.2%
Share Based Compensation 566 0.2% 398 0.1% 502 0.2%
Amortization of Purchased Intangible Assets 5,420 2.0% 5,170 1.8% 4,609 1.5%
Manufacturing Transition and Severance Costs 0 0.0% 75 0.0% 0 0.0%
Inventory Step-Up 0 0.0% 0 0.0% 347 0.1%
Gross Profit - Non-GAAP $95,024 35.3% $100,471 35.6% $113,146 38.0%
Adjusted EBITDA ReconciliationDec 26,
2015
% of Net
Sales
Dec 31,
2016
% of Net
Sales
Mar 25,
2017
% of Net
Sales
Income (Loss) From Operations - GAAP $7,959 3.0% $5,665 2.0% $15,533 5.2%
Depreciation Expense 4,240 1.6% 3,510 1.2% 3,701 1.2%
Amortization of Purchased Intangible Assets 7,032 2.6% 6,902 2.4% 6,244 2.1%
Share Based Compensation 6,755 2.5% 7,143 2.5% 6,888 2.3%
Manufacturing Transition and Severance Costs 970 0.4% 1,498 0.5% 1,462 0.5%
Other Acquisition Costs 0 0.0% 1,777 0.6% 1,083 0.4%
Impairment of Goodwill and Other Assets 273 0.1% 0 0.0% 0 0.0%
Gain on Sale of Facility (3,198) -1.2% 0 0.0% 0 0.0%
Reduction of Indemnification Receivable 0 0.0% 588 0.2% 588 0.2%
Adjusted EBITDA - Non-GAAP $24,031 8.9% $27,083 9.6% $35,499 11.9%
12 Months Ending
12 Months Ending
12 Months Ending12 Months Ending
12 Months Ending
12 Months Ending
12 Months Ending
12 Months Ending
12 Months Ending


