
Rik Leemans, Martin Rice, Ghassem Asnar, Bruce Campbell, Pep Canadell, Anantha K. Duraiappah
Rob Jackson, Anne Larigauderie, Sybil Seitzinger, Barbara Solich and Ruben Zondervan
UNFCCC-SBSTA meeting Bonn19-5-2012
Rik Leemans, Martin Rice, Ghassem Asnar, Rik Leemans, Martin Rice, Ghassem Asnar, Bruce Campbell, Pep Canadell, Bruce Campbell, Pep Canadell, Anantha K. Duraiappah Anantha K. Duraiappah
Rob Jackson, Anne Rob Jackson, Anne Larigauderie, Sybil Seitzinger, Larigauderie, Sybil Seitzinger, Barbara Barbara Solich and Ruben ZondervanSolich and Ruben Zondervan
UNFCCCUNFCCC--SBSTA meeting BonnSBSTA meeting Bonn1919--55--20122012
Coastal and marine ecosystems: Greenhouse gas sources, sinks and reservoirs: Results from research
by the ESSP on coastal and marine ecosystems-related research
Coastal and marine ecosystems: Greenhouse gas sources, sinks and reservoirs: Results from research
by the ESSP on coastal and marine ecosystems-related research

The oceans have warmed since 1955 due to GHG increase
Levitus et al. 2012. World ocean heat content and thermosteric sea level change (0-2000), 1955-2010. GEOPHYSICAL RESEARCH
LETTERS, doi:10.1029/2012GL051106
oA strong positive linear trend is observed in oceans’heat content since 1955
oOne third of the warming occurs in the deeper ocean.
oThe warming can only be explained by the increase in atmospheric GHG.

http://www.globalcarbonproject.org/carbonbudget
Peters GP, Marland G, Le Quéré C, Boden T, Canadell JG, Raupach MR (2011) Rapid
growth in CO2 emissions after the 2008-2009 global financial crisis. Nature Climate Change,
doi. 10.1038/nclimate1332.
Carbon Budget 2010

Trends in sinks of carbon
The fraction of CO2 emissions that remains in the atmosphere has likely increased from about 40% to 45%. Models suggest that thistrend was caused by a decrease in the uptake of CO2 by carbon sinks in response to climate change and variability.
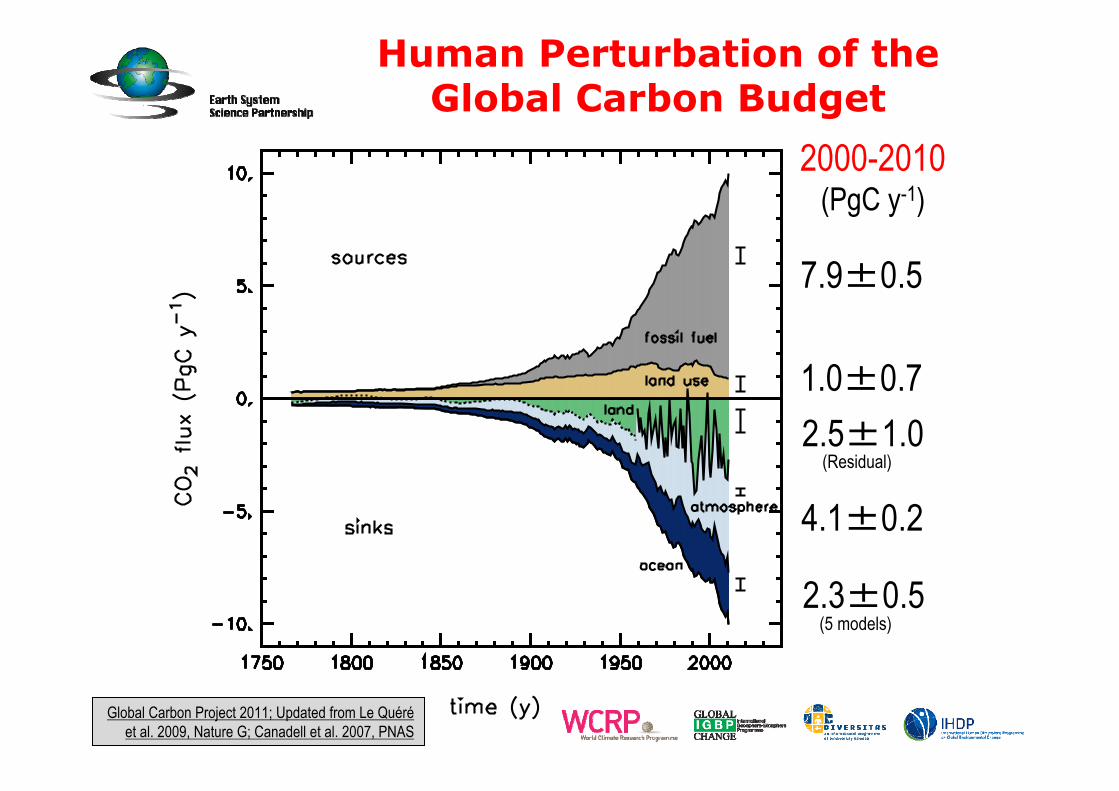
Human Perturbation of the Global Carbon Budget
Global Carbon Project 2011; Updated from Le Quéréet al. 2009, Nature G; Canadell et al. 2007, PNAS
2000-2010(PgC y-1)
(Residual)
2.3±0.5(5 models)
4.1±0.2
7.9±0.5
1.0±0.72.5±1.0
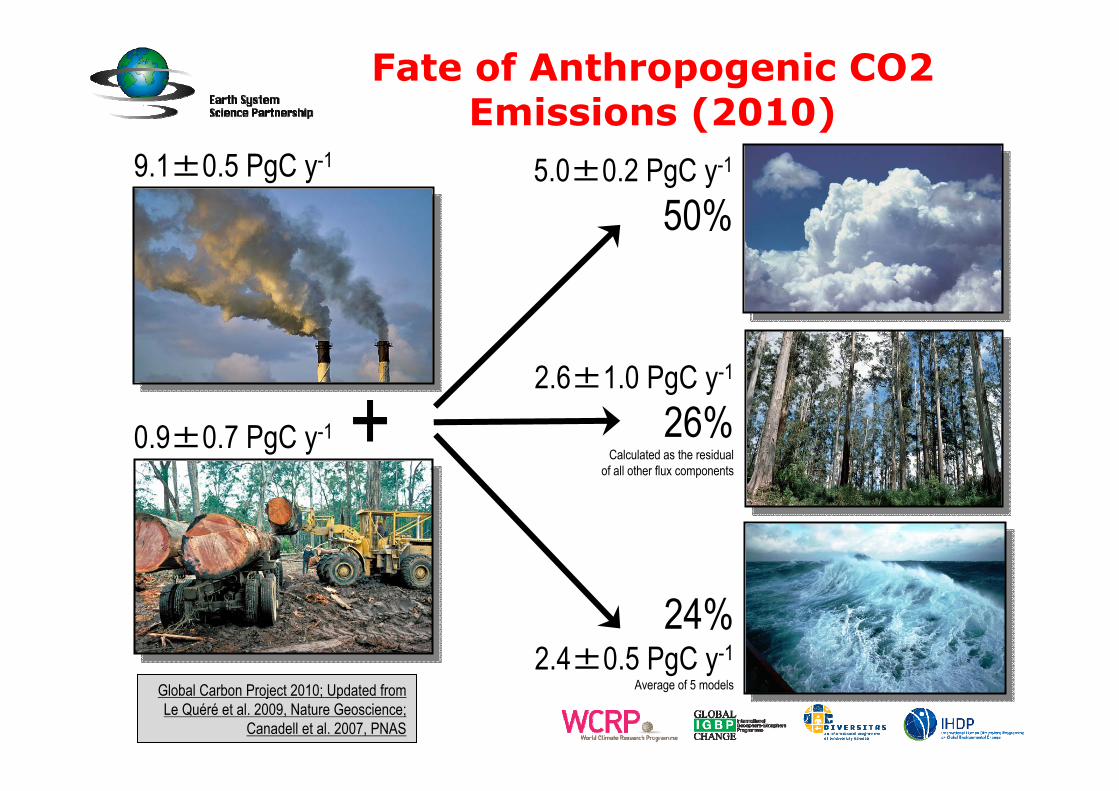
Fate of Anthropogenic CO2 Emissions (2010)
9.1±0.5 PgC y-1
+0.9±0.7 PgC y-1
2.6±1.0 PgC y-1
26%Calculated as the residual
of all other flux components
5.0±0.2 PgC y-1
50%
24%2.4±0.5 PgC y-1
Average of 5 modelsGlobal Carbon Project 2010; Updated from Le Quéré et al. 2009, Nature Geoscience;
Canadell et al. 2007, PNAS

Large-scale carbon release as warming feedback (generally included in climate-model runs)
o High northern latitude permafrost thawing leads to carbon release (CO2 and methane)o By 2100 under high business-as-usual: release of carbon estimated
at 120-420 GtCO2 0.04-0.23°C additional warming
o “Frozen methane” below sea floor: possible destabilizationdue to warming and be released (recorded in geological past)o Could lead to a slow, chronic release of
methane from ocean hydrates blocking warming to return to lower levels for millennia
An observation: Kort et al (2012) measured increased methane levels while flying at low altitudes above the Chukchi and Beaufort Seas
Schneider von Deimling et al (2011); Schuur and Abbott (2011); Archer et al (2009), Kort, E.A., et al (2012) Atmospheric observations of Arctic Ocean methane emissions up to 82°north. Nature Geoscience 5, 318–321

ESSP-GWSP on vulnerability of rivers and water security
Vorosmarty, C. J., P. B. McIntyre, M. O. Gessner, D. Dudgeon, A. Prusevich, P. Green, S. Glidden, S. E.
Bunn, C. A. Sullivan, C. R. Liermann, and P. M. Davies. 2010. Global threats to human water security
and river biodiversity. Nature 467:555-561.

Vulnerability of US and European electricity supply to climate
change
o Thermoelectric (nuclear and fossil fueled) power plants currently produce 91% of all electricity in the US and 78% in Europe
o Directly depend on availability and temperature of water resources for cooling
o Mean capacity decrease of 6.3-19% (Europe) and 4.4-16% (US) depending on cooling system type and climate scenario
o Strong need for improved climate adaptation strategies in the thermoelectric power sector to assure future energy security.van Vliet et al., in press Nature climate change

Coral Reefs: CO2 and Ocean acidification
Increasing CO2 concentration acidifying the world oceanso Likely to have wide ranging adverse effectso 550 ppm CO2 coral reefs dissolve
(reached by 2050s)o 450 ppm CO2 coral stop growing
(reached by 2030s)o Below 350 ppm CO2 appears to be ‘safe’

Much better insights in ocean acidification impacts
Wernberg, T., D. A. Smale, and M. S. Thomsen. 2012. A decade of climate change experiments on marine organisms: procedures, patterns and problems. Global Change Biology 18:1491-1498.
Hönisch, B., A. Ridgwell, D. N. Schmidt, E. Thomas, S. J. Gibbs, A. Sluijs, R. Zeebe, L. Kump, R. C. Martindale, S. E. Greene, W. Kiessling, J. Ries, J. C. Zachos, D. L. Royer, S. Barker, T. M. Marchitto, R. Moyer, C. Pelejero, P. Ziveri, G. L. Foster, B. Williams. 2012. The Geological Record of Ocean Acidification. Science 335:1058-1063.
Wei, G., M. T. McCulloch, G. Mortimer, W. Deng, and L. Xie. 2009. Evidence for ocean acidification in the Great Barrier Reef of Australia. Geochimica et Cosmochimica Acta 73:2332-2346.
This suggests that the increased levels of
anthropogenic CO2 in atmosphere has already
caused a significant trend towards acidification in the oceans during the
past decades.
Although similarities exist, no past event perfectly
parallels future projectionsin terms of disrupting the
balance of ocean carbonate chemistry—a
consequence of theunprecedented rapidity of
CO2 release currently taking place.
Increasing calcification rates on reefs off Western Australia contrast with the
decline of Australia’s Great Barrier Reef and
provide additional evidence that recent
changes in coral calcification are responses to temperature rather than
ocean acidification.
Cooper, T. F., R. A. O’Leary, and J. M. Lough. 2012. Growth of Western Australian Corals in the Anthropocene. Science 335:593-596.

The process of ocean acidification
When CO2 dissolves, it reacts with seawater to form carbonic acid, which then dissociates to bicarbonate, carbonate, and hydrogen ions. The hydrogen ions makes seawater acidic, but this process is buffered on long time scales by the interplay of seawater, seafloor carbonate sediments, and weathering on land. Shown are the major pathways of reduced carbon (black) and alkalinity (yellow). Ocean acidification or reduction of CaCO3 saturation are indicated in red, and ocean alkalinization or CaCO3 saturation increases are indicated in blue.

Latest scenario projections:Atmospheric CO2
concentration (ppm)
Martin RiceESSP Coordinator
Email: [email protected]: www.essp.org
Martin RiceESSP Coordinator
Email: [email protected]: www.essp.org
ContactContact
More information in our websites, newsletters and
magazines:
More information in our websites, newsletters and
magazines:


