
December 06,2010
Phillips Carbon Black Ltd
On a ambitious growth plan.
SKP Securities Ltd www.skpmoneywise.com Page 1 of 14
Outlook & Recommendation
We have valued the company by applying the Discounted Cash Flow
Method and have arrived a fair value of Rs 254 implying an upside of
40% from current levels to be reached in 15 months time. While
calculating, we taken a WACC of 12.45% from FY11E to FY15E and a
terminal growth rate of 2% thereafter and hence initiate a BUY
recommendation.
CMP Rs. 180 Target Rs 254 Buy
Key Share Data Face Value (Rs.) 10.00
Equity Capital (Rs. Crs) 33.22
Market. Capitalization (Rs. Crs) 597
52-wk High / Low (Rs.) 242/134
Average Yearly Volume 57057
BSE code 506590
NSE code PHILIIPCARB
Reuters code PHIL.BO
Bloomberg code PHCB IN
Shareholding Pattern – 30
th September, 2010
Financials (Rs. Crs)
FY09 FY10 FY11E FY12E
Net Sales 1200 1344 1407 1783 Sales Gr 4% 15% 14% 27%
Operating Profit 9 204 224 332 PAT -65 123 106 179 PAT Gr -178% 289% -14% 69% EPS (Rs.) 0 43 32 52
Key Financial Ratios
FY09 FY10 FY11E FY12E
P/E 0.00 4.51 5.62 3.46 P/BV 0.42 1.69 1.11 0.86 MCap/Sales 0.08 0.41 0.42 0.33 EV/EBIDTA 56.76 5.25 4.78 3.22 ROCE -1.81% 22.73% 18.00% 28.00% RONW -28.13% 45.22% 20.00% 24.00% OPM(%) 0.84% 16.57% 15.95% 18.63% NPM (%) 0.00% 9.90% 7.53% 10.03% Debt-Equity 1.55 1.81 0.96 0.63
Performance comparison PCBL Vs BSE MidlCap
Analyst: Pinaki Banerjee
Tel No.: +91 33 4007 7416; Mobile: +919674040602
Email: [email protected]
Company profile:- Philips Carbon Black (PCBL), a member of RP Goenka
Group was incorporated on March 30, 1960 and is a leading
manufacturer of various grades of carbon black in India. Columbian
Chemical Corporation, US, a leading international producer of rubber
blacks is the Technical Collaborator of the company.
Investment Rationale
Largest Carbon Black company in India and eighth in the world.
� The company is the largest carbon black producer in the country
with a production capacity of 360,000 MT at present which is
expected to go upto 410,000 by end of FY11. Along with that, it
has also got co-generation power plants which, after meeting
their own requirements are sold to the grid.
� Apollo, MRF, CEAT, Bridgestone, JK etc are some of the
renowned clients of the company who have now embarked on a
massive expansion plan.
Connected to the automobile growth story
The Indian automobile industry has been on a strong growth path since
last year, and is expected to continue its growth momentum in future.
The growth in the automobile industry shall drive up the demand for
tyres also which in turn will drive the growth of the company.
Revenues from power also to add significantly to the topline.
The company is also increasing its power generation capacity from
60.5MW at present to 76 MW by Sep 2012. The revenues from power
which stood at 4% of the topline in FY10 is expected to go upto 7%-8% in
the next two years time. Since the company sources its own power from
the plants, the power cost is significantly low, thereby easing the operating
margins to a significant extent.
Foray into Vietnam to be another feather in the cap
The company has embarked upon ambitious expansion plans in India
and abroad. It is setting up two plants in Vietnam with a capacity of
about 100,000 MT in 80:20 joint venture with some local companies. The
first phase of about 60,000 MT is expected to become operational by
Sep 2012.

Phillips Carbon Black Ltd.
SKP Securities Ltd www.skpmoneywise.com Page 2 of 14
Global Industry Overview:-
Carbon Black is well recognized to be the best reinforcing material in rubber compounds. The tyre industry
consumes about 80% of the total carbon black production around the world. As per estimates about nine million
metric tons of Carbon Black are manufactured annually worldwide.
Key Points:-
Global demand expected to rise by about 4.30% through 2013
Source:- SKP Research
Special Blacks expected to be a key item in the future
The market for special blacks is expected to grow by 5.90% every year to 1.20 million metric tons which at
present they constitute about 10% of the overall global carbon black market on a tonnage basis. This segment,
apart from offering higher margins provides the suppliers with a shield against the cyclic nature of the tyre and
motor vehicles industries. Apart from the regular users like plastics, inks and paint industry, other users as
conductive fillers are expected to hold out good growth prospects till 2013 and thereafter.
Asia/Pacific region to be the key players
]
Source:- SKP Research
• A healthy global rubber market is
expected to help raise the demand for
world carbon black by 4.30% every year
to 2013 to about 11.60 million metric
tons .
• Majority of carbon black find use as a
reinforcement material in vulcanized
rubber goods, including over 60% in
motor vehicles tyres alone.
• It is estimated that the demand for
carbon black from the tyre industry is
expected to increase from 3.70% every
year to 6.90 million metric tons through
2013. The non tyre carbon black market
is estimated to increase by 4.80% every
year to 3.60 million metric tons to 2013.

Phillips Carbon Black Ltd.
SKP Securities Ltd www.skpmoneywise.com Page 3 of 14
Scenario in India
Source:- Company
Demand to be led by the growth in the tyre industry Source:-Company
Majority of the major tyre manufactures have embarked on a massive investment drive to ramp up production to
meet the demand of the ever growing automobile industry. 40% of the tyre demand are led by the OEM segment
and 60% in the Replacement segment. Apart from OEM, the replacement demand for tyres are also showing signs
of momentum. A replacement cycle for passenger cars is normally 3-4 years while that of commercial vehicles is
of 1-2 years. The industry produced about 97 million tyres in various segments in FY10 compared to 82 million
tyres produced in FY09.
Source:- Company
About 65% of the carbon black manufactured in the
country are consumed by the tyre industry, 15% by the
rubber industry and the rest 20% are utilized by ink,
plastics and paint manufacturing industries
• This region, with the exclusion of Japan is expected to be the key player upto 2013. This is due to the fact that the
markets of China and India look lucrative due to the rapid expansion in their respective motor vehicles and tyre
industries on the back of a robust economic growth. Both these countries combined together posted the largest
increase in carbon black capacity from 2003 to 2008 and is expected to keep up the same momentum till 2013.
• The growth in US, Japan and other European nations is expected to remain muted during this time period on a
weaker economic recovery, post 2008 crisis. The situation in US presents a grim picture where capacity utilization
fell below 70% resulting in a number of carbon black plants being shutdown.
• In 1998, North America and Western Europe combined together produced 48% of the world’s carbon black and
is expected to account for only 23% of it by 2013. On the other hand the Asia/Pacific region which produced 36%
of the world’s carbon black in 1998, stands to account for about 57% of the world production in 2013.

Phillips Carbon Black Ltd.
SKP Securities Ltd www.skpmoneywise.com Page 4 of 14
India emerging to be a major hub for automobile manufacturers
Major international car makers as Hyundai, Toyota, Nissan have set up shops in the country to ride the ever
increasing auto demand in the country in the passenger cars segment. Apart from this, a rise in industrial activity,
strong rural demand and availability of credit at attractive rates will drive up the demand for commercial vehicles
also.
Other segments also hold out a good promise
As mentioned before, apart from the tyre industry, ink, plastics and the paint manufacturing industry also hold
out a good promise for growth in the future.
• Ink- The Indian Printing Ink Industry is currently valued at about Rs 1800 crore- Rs 2000 crore with an
average growth rate of about 12%-15% annually. In terms of tonnage of ink manufactured in India, it is
estimated to be about 110 million tons annually.
• Plastics- The historical growth of the Indian plastic industry has been quite impressive at about 12%-14%
annually. The consumption level which at present is about 8 million tons is expected to reach a projected
level of 12 million tons by 2012.
• Paints- The phenomenal growth of the housing sector in India, rapid urbanization along with the
availability of easy to secure housing loans have been the prime drivers of the decorative paints industry
which comprises about 70% of $2 billion paint industry in India. Industrial paints add up to 30% of the
revenues of the industry. The size of the Indian Paint Industry is about 940 million liters. The organized
sector comprises about 54% of the total volume and 65% of the value. In the last 10 years, the industry
has shown a CAGR growth of about 10%-12% annually.
• Rubber- The production of rubber in the country varies between 7-8 Lakh tons annually amounting to
about Rs 4000 crore. It is estimated that about 6000 rubber manufacturing units are present comprising
of large, medium and small scale industry. The industry contributes about Rs 50 billion to the National
Exchequer in the form of various taxes. The per capital consumption of rubber in the country is only
about 800 grams compared to 12 to 14 kilos in Japan, USA and Europe. Thus, the country is still far from
attaining saturation levels and hence provides the industry with tremendous growth prospects in the
times of come.
Company Overview:-
Source:- Company
Source:- Company
Philips Carbon Black (PCBL), a member of RP Goenka
Group was incorporated on March 30, 1960 and is a
leading manufacturer of various grades of carbon black in
India. Columbian Chemical Corporation, US, a leading
international producer of rubber blacks is the Technical
Collaborator of the company.

Phillips Carbon Black Ltd.
SKP Securities Ltd www.skpmoneywise.com Page 5 of 14
Year Milestones
1960 Incorporated in Kolkata
1962 Production begins with its collaborator Phillips Petroleum Company, USA
1978 Collaboration with Phillips Petroleum Company, USA ends
1988 Signs Technical agreement with Columbian Chemicals Company, USA
2003 Sets up a 12MW co-generation power plant in Baroda
2005 Sets up a 12MW CPP in Palej
2007 Signs MOU for setting up a plant in Vietnam
2008 Sets up a 30 MW CPP in Durgapur
2009 90000 MT facility in Mundra commences production taking total capacity to 360000 MT
2009 Sets up a 16MW CPP in Mundra
2010 Has plans to add another 50000MT in Mundra Source:-Company
Largest producer of carbon black in India and ninth in the world
Rank Name Origin Country Capacity(MT)
1 Cabot USA 2010000
2 Evonik Germany 1450000
3 Columbian USA 1130000
4 Birla India 790000
5 CSRC Taiwan 740000
6 Sid Rich USA 450000
7 Tokai Japan 370000
8 PCBL India 360000
9 Omsk Russia 350000
10 Black Cat China 290000 Source:- SKP Research
Source:- Company

Phillips Carbon Black Ltd.
SKP Securities Ltd www.skpmoneywise.com Page 6 of 14
Clientele:- Renowned clients of the company include some of the world’s renowned as well as the leading
domestic tyre manufacturers of the country. These are Apollo, MRF, CEAT, Bridgestone, JK etc.
Last 5 Years Revenues
825
1123 1165 12001344
0
500
1000
1500
FY06 FY07 FY08 FY09 FY10
Financial Years
In R
s C
r
Projects Under Implementation Source:- Company
Growth In power revenues
Revenue:- At present about 96% of the total revenues
accrue from sale of carbon black while the rest is come
sale of surplus power to the grid. Of the total revenues
85% comes through domestic sales while 15% is through
exports.
The company took full advantage of the Electricity
Act of 2003 and began to generate power through
the waste gases produced from the production of
carbon black. After meeting its internal
requirements, the surplus power is sold to the
grid. Power revenues of the company have grown
at a CAGR of 85% through FY06-10 since the
commissioning of its power plants
Growth in Power Revenues
46106
149 155
545
0
100
200
300
400
500
600
FY06 FY07 FY08 FY09 FY10
Financial Years
In M
n

Phillips Carbon Black Ltd.
SKP Securities Ltd www.skpmoneywise.com Page 7 of 14
Source:- Company
Vietnam Joint Venture:- The company has began work on its Vietnam project in a JV with 3 local companies
where it would be having 80% share. The project is to be funded through a debt equity ratio of 2:1. The total cost
of the project is estimated to be about Rs 450 Cr.
Source:- Company
Investment Rationale
Growth in the tyre segment to be the main growth driver
Source:- SKP Research
Strategic locations of all its plants
Particulars Phase-I Phase-II
Carbon Black(MT) 60000 55000
CPP(MW) 12 6
Investment($Mn) 63 21
Commissioning 2012 2013
Revenue at 90% capacity utilization($Mn) 60 53
• The auto industry in India is one of the largest
in the world. It produces about 11 million 2
and 4 wheeled vehicles and exports about 1.50
million vehicles every year.
• By 2050 the country is expected to top the
world in car volumes with approximately 611
million vehicles on the roads. This in turn is
expected to drive the tyre industry forward
thus paving the way for the company to grow
at a CAGR growth of about 10%-12% anually.
• Since the company holds a dominant position
in the carbon black market, it is expected to
gain significantly with the growth in the
automobile segment and subsequently an
increase in the demand for tyres.
• The company’s 4 plants are strategically
located to cater to the tyre demands of the
respective regions, thereby reducing the
cost of freight.
• It is also on the look out to buy further land
to set up a new carbon black facility in
southern India to cater to the upcoming auto
hub. The company is in talks with the
governments of Tamil Nadu and Andhra
Pradesh for this and the deal is expected to
be finalized soon.
Plant Tyre Companies
Kochi Apollo,JK,Michelin,MRF
Palej Bridgestone
Mundra Ceat
Automobile Production
12641473
17131846
2166
363547 540 486 466
0
500
1000
1500
2000
2500
2005 2006 2007 2008 2009
Years
In '
00
0
Passenger Cars
Commercial Vehicles

Phillips Carbon Black Ltd.
SKP Securities Ltd www.skpmoneywise.com Page 8 of 14
Vietnam venture to enhance the fortunes of the company
Exports to be stronger in the times to come Source:- SKP Research
Currently the exports constitute about 16%-17% of the top line growth. Now with the various capacity expansions
in place and the foray into Vietnam the exports are likely to go up to 20%-22% of the total sales of the company.
Power segment to increase revenues and improve margins
At present about 5% of the revenues accrue from the sale of power. With the increase in the power generation
capacity from 60.5 MW to 76 MW by Sep 2011, the share of revenues from power sale is expected to increase to
6%-7% over the next 2 years. At present about 15%-20% of the power produced are used for their own captive
consumption and about 35%-40% of it is sold to the grid. The cost incurred to generate power is about 70p/unit
while it can be sold to the grid at about Rs2-3/unit. In the absence of raw material cost the power business has
got EBIDTA margins of about 90%.
Power Projects lead to carbon credits
The Palej power plant of the company has been registered with UNCDM(Clean Development Mechanism) board
and have subsequently sold the same and added to the topline. The company plans to register other power plants
too with UNCDM, but the process is a lengthy one and can take at least a couple of years. However, the Palej
power plant is expected to generate carbon credits till FY15.
Backward integration in the form of Coal Tar Distillation
Carbon Black Feed stock is the main raw materials used by the company at present which has to be imported. The
price of these is directly linked to the international crude oil prices. An increase in those can put some severe
pressure on the operating margins of the company. To mitigate the risk the company plans to start using coal tar
in future as its raw material. Coal Tar is a by product generated through the processing of coal into coke for use in
steel manufacturing. The process of putting the plans into action has started and this can take effect in another 2-
3 years. The company plans to go into long term contracts with domestic steel manufacturers in this regard.
The country is known to be the fourth largest producer of
rubber but unfortunately does not have a single carbon
black facility. All the demands are met through imports. It
is estimated that the current demand for carbon black ,
which at present stands around 60,000 MT is expected to
reach at least 100,000 MT in two years time. Apart from
the expansion of local tyre companies many foreign
players are also looking to set up shop there. The company
presently has a 40% market share in Vietnam.
Phillips Carbon Black Ltd.
SKP Securities Ltd www.skpmoneywise.com Page 9 of 14
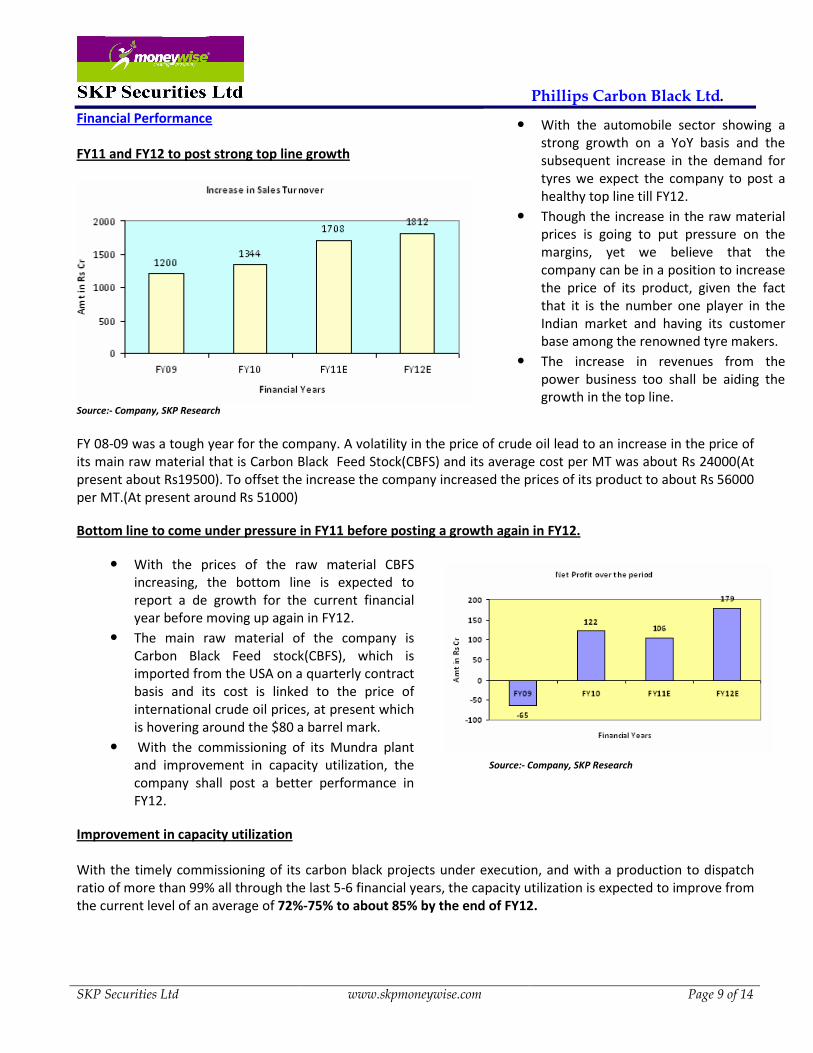
Financial Performance
FY11 and FY12 to post strong top line growth
Source:- Company, SKP Research
FY 08-09 was a tough year for the company. A volatility in the price of crude oil lead to an increase in the price of
its main raw material that is Carbon Black Feed Stock(CBFS) and its average cost per MT was about Rs 24000(At
present about Rs19500). To offset the increase the company increased the prices of its product to about Rs 56000
per MT.(At present around Rs 51000)
Bottom line to come under pressure in FY11 before posting a growth again in FY12.
Source:- Company, SKP Research
Improvement in capacity utilization
With the timely commissioning of its carbon black projects under execution, and with a production to dispatch
ratio of more than 99% all through the last 5-6 financial years, the capacity utilization is expected to improve from
the current level of an average of 72%-75% to about 85% by the end of FY12.
• With the automobile sector showing a
strong growth on a YoY basis and the
subsequent increase in the demand for
tyres we expect the company to post a
healthy top line till FY12.
• Though the increase in the raw material
prices is going to put pressure on the
margins, yet we believe that the
company can be in a position to increase
the price of its product, given the fact
that it is the number one player in the
Indian market and having its customer
base among the renowned tyre makers.
• The increase in revenues from the
power business too shall be aiding the
growth in the top line.
• With the prices of the raw material CBFS
increasing, the bottom line is expected to
report a de growth for the current financial
year before moving up again in FY12.
• The main raw material of the company is
Carbon Black Feed stock(CBFS), which is
imported from the USA on a quarterly contract
basis and its cost is linked to the price of
international crude oil prices, at present which
is hovering around the $80 a barrel mark.
• With the commissioning of its Mundra plant
and improvement in capacity utilization, the
company shall post a better performance in
FY12.

Phillips Carbon Black Ltd.
SKP Securities Ltd www.skpmoneywise.com Page 10 of 14
Increase in capacity utlization
270000
360000
410000 410000
212150
258000295200
348500
0
50000
100000
150000
200000
250000
300000
350000
400000
450000
FY09 FY10 FY11E FY12E
Financial Years
Am
t in
MT
Capacity
Production
Source:- Company, SKP Research
Increase in realization price
Source:- Company, SKP Research
Operating margins expected to increase
Source:- Company, SKP Research
Sales Quantity and Realization Price
215
256
326345
56
51
50.550.5
0
50
100
150
200
250
300
350
400
FY09 FY10 FY11E FY12E
Financial Years
Sa
les
In M
T i
n '
00
0'
47
48
49
50
51
52
53
54
55
56
57
Re
ali
zati
on
Pri
ce M
T i
n
'00
0'
Sales
RealizationThe company is expected to increase its
realization price gradually over the next few
years with increase in sales quantity. With the
price of the raw material and other
manufacturing expenses expected to increase
over a period of time, the company will be
bound to increase the realization price to
offset the increase in manufacturing costs.
With the increase in the realization
price along with an increase in the
sales volume, the operating margins
are expected to show an increase from
the current levels of about 16% in
FY11 to about 18% in FY12. An
increase in contribution from power
sales too shall aid the growth as it has
got higher margins.
Operating Profit
0
50
100
150
200
250
300
350
Am
t In
Rs
Cr
0
5
10
15
20
In %
Operating Profit
OPM(%)

Phillips Carbon Black Ltd.
SKP Securities Ltd www.skpmoneywise.com Page 11 of 14
ROCE and RONW to show a decrease in FY11
Source:- Company, SKP Research
Risks and Concerns
Highly dependent on the performance of the tyre industry
The company derives its maximum revenues from the tyre industry which in turn is dependent on the fortunes of
the auto sector. Any adverse happening in the auto industry is going to have a negative effect on the company. It
had faced a similar situation in FY09 due to the effect of the global financial crisis.
Volatility in the prices of its raw materials
Carbon Black Feed Stock(CBFS), the main raw material of the company is imported from the USA and is
dependent on the prices of international oil prices. An increase in that is going to put pressure on the margins of
the company. To mitigate this risk, the company has initiated the process of replacing CBFS with coal tar pitch
which is a byproduct from the steel manufacturing process. It has already started discussions with some major
steel manufacturers in this regard. However, it shall take another 2 years time to actually put that into practice.
Delay in project execution will increase cost and hamper earnings
The company is at present executing a 50000MT carbon black facility in Mundra along with a 10MW power
project and a 8MW power facility in Kochi. A delay in executing these projects could affect company’s earnings.
The Vietnam project also has not yet achieved financial closure. Any delay in that is also going to be prove
detrimental to the company.
Threat of cheap imports
Though an anti dumping duty is in place, yet a threat of cheap imports always remain high which may prove
detrimental to the interest of the company.
Due to the ongoing capacity expansion
plans the RONW and ROCE shall decline in
FY11, after which they are expected to
stabilize in FY12.

Phillips Carbon Black Ltd.
SKP Securities Ltd www.skpmoneywise.com Page 12 of 14
Valuations and Outlook
We have valued the company by applying the Discounted Cash Flow method by taking a WACC of 12.45% from
FY11E to FY15E and a terminal growth rate of 2% thereafter and have arrived at a fair value price of Rs 254
implying a upside of 40% from current levels to be achieved in 15 months time. However, we have not factored
in the Vietnam Project as of now, since it is in a preliminary stage and yet to achieve financial closure.
PV of Projected Cash Flows 307
PV of Terminal Value 537
Fair Value 844
No of Shares Outstanding 3.32
Fair Value Per Share 254
• We firmly believe that the company is going to reap the benefits of the automobile growth story as
depicted in the YoY sales increases of all the auto majors which includes two wheelers, four wheelers and
commercial vehicles.
• Being the No1 choice of all the major tyre manufacturers of the country as well as some renowned ones
outside, it is going to put up a good performance in the times to come. This shall further be aided by the
timely and successful commissioning of the projects under implementation.
• The Vietnam project is expected to be completed fully by the end of FY14 and this shall be the focal point
of supplying its products to the South East Asian region thereby decreasing the shipping and
transportation costs of the company which till now is being sent from India.
• The company is expected to sell all its surplus power after meeting all its own requirements which till now
is just about 20%-25% of the total power generated.
• Volatility of raw materials mainly the CBFS remains a key concern of dragging the margins down.
However, the company has already started to look at using coal tar pitch instead and is in talks with some
major steel producers. Though things are still on paper, yet it is expected to start taking effect slowly
after 2 years time. This shall reduce the company’s dependency on CBFS gradually.
• FY13 to FY15 shall be the consolidation phase for the company. On the domestic side, it is expected to
achieve 100% capacity utilization and the Vietnam project is also expected to become operational by
then.
• New capacity expansions in the form of a new carbon black facility in South India along with
diversification into carbon chemicals manufacturing are in the pipeline.

Phillips Carbon Black Ltd.
SKP Securities Ltd www.skpmoneywise.com Page 13 of 14
Income Statement
Particulars FY09 FY10 FY11E FY12E
Net sales 1076 1233 1407 1783
Growth (%) 4% 15% 14% 27%
Other Income 14 24 28 45
Stock Adjustments 10 15 17 255
Total Income 1100 1272 1452 1849
Raw Material Consumed 940 884 1016 1231
Power and Fuel Cost 6 14 15 18
Employee Cost 33 35 40 50
Other Mfg Expenses 38 49 56 78
Selling and Admn Expenses 43 50 58 79
Misc Expenses 32 36 42 62
Total Expenditure 1091 1068 1228 1517
Operating Profit 9 204 224 332
OPM(%) 0.84% 16.57% 15.95% 18.63%
Interest 87 43 45 50
Depreciation 20 31 38 44
PBT -97 131 142 238
Tax 33 8 35 60
PAT -65 123 106 179
Growth in PAT -173% 289% -14% 69%
EPS 0.00 43 32 52
NPM(%) 0.00 9.90% 7.53% 10.03%
Dividend Per Sh. (Rs.) 0.00 5.00 5.00 5.00
Balance Sheet
Particulars FY09 FY10 FY11E FY12E
Equity Capital 28 28 33 35
Reserves 190 296 485 719
Share Warrants 0.00 0.00 0.12 0.00
Net worth 218 324 519 754
Secured Loan 413 496 447 405
Unsecured Loan 13 60 50 45
Total Liabilities 644 880 1016 1204
Net Fixed Assets 228 593 661 717
Capital WIP 383 92 112 135
Investments 38 38 46 40
Inventories 121 197 225 357
Accounts receivable 181 295 338 446
Cash & Bank 7 33 32 28
Loan & Advances 84 149 86 40
Current Assets 393 674 681 871
Current Liab. 395 448 457 517
Provisions 2 20 17 21
Total Curr. liab. & prov. 397 508 474 538
Net Current Assets -4 166 207 332
Net Deferred Tax -2 -10 -10 -20
Total Assets 644 880 1016 1204
Cash Flow Statement
Particulars FY09 FY10 FY11E FY12E
Profit before Tax -97 131 142 238
Add: Depreciation, Int. & Other
Expenses 41 57 75 84
Net changes in WC, tax interest 169 -139 -63 -120
Cash flow from operating activities 113 49 153 202
Cash flow from investing activities -232 -97 -133 -117
Cash flow from financing activities 111 74 -21 -89
Net Increase/Decrease in Cash &
Cash Equivalents -8 26 -1 -4
Opening Cash Balance 15 7 33 32
Closing Cash Balance 7 33 32 28
Key Ratios
Particulars FY09 FY10 FY11E FY12E
Valuation Ratios
P/E 0.00 4.51 5.62 3.46
P/BV 0.42 1.69 1.11 0.86
EV/EBIDTA 56.76 5.25 4.78 3.22
Mkp/Sales 0.08 0.41 0.42 0.33
Earnings Ratios
OPM 0.84% 16.57% 15.95% 18.63%
NPM 0.00% 9.95% 7.55% 10.02%
ROCE -1.81% 22.73% 18.00% 28.00%
RONW -28.13% 45.22% 20.00% 24.00%
Balance Sheet Ratios
Current Ratio 0.97 0.93 1.43 1.62
Debt/Equity 1.55 1.81 0.96 0.63
Debtor days 67 69 81 79
Inventory Days 49 58 62 69
Consolidated Financials in Rs. Crores

Phillips Carbon Black Ltd.
SKP Securities Ltd www.skpmoneywise.com Page 14 of 14
Consolidated Financials (in Rs. Crores)
Member: NSE BSE NSDL CDSL NCDEX* MCX* MCX-SX FPSB *Group Entities
INB/INF: 230707532, BSE INB: 010707538, CDSL IN-DP-CDSL-132-2000, DPID: 021800, NSDL IN-DP-NSDL: 222-2001, DP ID: IN302646, ARN: 0006, NCDEX: 00715, MCX: 31705, MCX-SX: INE 260707532
The above analysis and data are based on last available prices and not official closing rates.
SKP Research is also available on Bloomberg, Thomson First Call & Investext Myiris, Moneycontrol, Tickerplant and ISI Securities
.
DISCLAIMER: This document has been issued by SKP Securities Ltd (SKP), a stock broker registered with and regulated by Securities & Exchange Board of India,
for the information of its clients/potential clients and business associates/affiliates only and is for private circulation only, disseminated and available electronically
and in printed form. Additional information on recommended securities may be made available on request. This document is supplied to you solely for your
information and no matter contained herein may be reproduced, reprinted, sold, copied in whole or in part, redistributed or passed on, directly or indirectly, to any
other person for any purpose, in India or into any other country without prior written consent of SKP. The distribution of this document in other jurisdictions may be
strictly restricted and/ or prohibited by law, and persons into whose possession this document comes should inform themselves about such restriction and/ or
prohibition, and observe any such restrictions and/ or prohibition. If you are dissatisfied with the contents of this complimentary document or with the terms of this
Disclaimer, your sole and exclusive remedy is to stop using the document and SKP shall not be responsible and/ or liable in any manner. Neither this document nor
the information or any opinion expressed therein should be construed as an investment advice or offer to anybody to acquire, subscribe, purchase, sell, dispose of,
retain any securities or derivatives related to such securities or an offer to sell or the solicitation of an offer to purchase or subscribe for any investment or as an
official endorsement of any investment. Any recommendation or view or opinion expressed on investments in this document is not intended to constitute investment
advice and should not be intended or treated as a substitute for necessary review or validation or any professional advice. The views expressed in this document are
those of the analyst which are subject to change and do not represent to be an authority on the subject. SKP may or may not subscribe to any and/ or all the views
expressed herein. It is the endeavor of SKP to ensure that the analyst(s) use current, reliable, comprehensive information and obtain such information from sources,
which the analyst(s) believes to be reliable. However, such information may not have been independently verified by SKP or the analyst(s). The information, opinions
and views contained within this document are based upon publicly available information, considered reliable at the time of publication, which are subject to change
from time to time without any prior notice. The Document may be updated anytime without any prior notice to anybody. SKP makes no guarantee, representation or
warranty, express or implied; and accepts no responsibility or liability as to the accuracy or completeness or correctness of the information in this Report. SKP, its
Directors, affiliates and employees do not accept any liability whatsoever, direct or indirect, that may arise from the use of the information or recommendations
herein. Please note that past performance is not necessarily a guide to evaluate future performance. SKP or its affiliates, may, from time to time render advisory and
other services to companies being referred to in this document and receive compensation for the same. SKP and/or its affiliates, directors and employees may trade for
their own account or may also perform or seek to perform investment banking or underwriting services for or relating to those companies and may also be represented
in the supervisory board or on any other committee of those companies or may sell or buy any securities or make any investment, which may be contrary to or
inconsistent with this document. This document should be read and relied upon at the sole discretion and risk of the reader. The value of any investment made at your
discretion based on this document or income there from may be affected by changes in economic, financial and/ or political factors and may go down as well as up
and you may not get back the full or the expected amount invested. Some securities and/ or investments involve substantial risk and are not suitable for all investors.
Neither SKP nor its affiliates or their directors, employees, agents or representatives/associates, shall be responsible or liable in any manner, directly or indirectly, for
information, views or opinions expressed in this document or the contents or any errors or discrepancies herein or for any decisions or actions taken in reliance on the
document or inability to use or access our service or this document or for any loss or damages whether direct or indirect, incidental, special or consequential including
without limitation loss of revenue or profits or any loss or damage that may arise from or in connection with the use of or reliance on this document or inability to use
or access our service or this document.
SKP Securities Ltd Contacts Research Sales
Mumbai Kolkata Mumbai Kolkata
Phone 022 2281 9012 033 4007 7000 022 2281 1015 033 4007 7400
Fax 022 2283 0932 033 4007 7007 022 2283 0932 033 4007 7007
E-mail [email protected] [email protected] [email protected]


![Florida Star. (Titusville, Florida) 1902-04-04 [p 8].ufdcimages.uflib.ufl.edu/UF/00/07/59/01/00620/00204.pdfPhillips position MELBOURNE directions enjoyed reason con-tributed enjoyed](https://cdn.vdocuments.us/doc/165x107/5fbb3dead70908426903e60e/florida-star-titusville-florida-1902-04-04-p-8-phillips-position-melbourne.jpg)