
Clinical PathologyQuality Dashboard
March 2010

Clinical Pathology Quality Dashboard
Inpatient Phlebotomy First AM Blood Draws
0%
20%
40%
60%
80%
100%
Jan Feb Mar Apr May Jun Jul Aug Sep Oct Nov Dec Jan Feb
2009 2010
University Hospital
8am
9am
10am
Drawn by
0%
20%
40%
60%
80%
100%
Jan Feb Mar Apr May Jun Jul Aug Sep Oct Nov Dec Jan Feb
2009 2010
Mott Hospital
8am
9am
10am
Drawn by

Clinical Pathology Quality Dashboard
Inpatient Phlebotomy First AM Blood Test Results:
PT/PTT, CBCP, and Comprehensive Panel
0
100
200
300
400
0%
20%
40%
60%
80%
100%
Jan Feb Mar Apr May Jun Jul Aug Sep Oct Nov Dec Jan Feb
Av
g D
ail
y V
olu
me
2009 2010
University Hospital
8am
9am
10am
Results by
0
1
2
3
4
5
6
7
8
9
0%
20%
40%
60%
80%
100%
Jan Feb Mar Apr May Jun Jul Aug Sep Oct Nov Dec Jan Feb
Avg
Da
ily
Vo
lum
e
2009 2010
Mott Hospital
8am
9am
10am
Results by

Inpatient Phlebotomy Draws
Clinical Pathology Quality Dashboard
19,598 19,795
21,992 21,71420,986
21,65122,073
22,675
20,208
22,942
21,65020,940
22,907
20,934
0
5,000
10,000
15,000
20,000
25,000
30,000
Jan Feb Mar Apr May June July Aug Sep Oct Nov Dec Jan Feb
2009 2010

Clinical Pathology Quality Dashboard
Turnaround Times
0
200
400
600
800
1000
1200
1400
Jan Feb Mar Apr May Jun Jul Aug Sep Oct Nov Dec Jan Feb
Mo
nth
ly V
olu
me
2009 2010
Emergency Department Cardiac MarkerVolume and Turnaround Time
> 2 hours
1-2 hours
<1 hour
TAT
Point of Care service began
0
20
40
60
80
100
120
140
160
Jan Feb Mar Apr May Jun Jul Aug Sep Oct Nov Dec Jan Feb
Mo
nth
ly V
olu
me
2009 2010
CSF Gram StainVolume and Turnaround Time
> 1 hour
30 min-1 hour
<30 minutes
TAT
Clinical Pathology Quality Dashboard
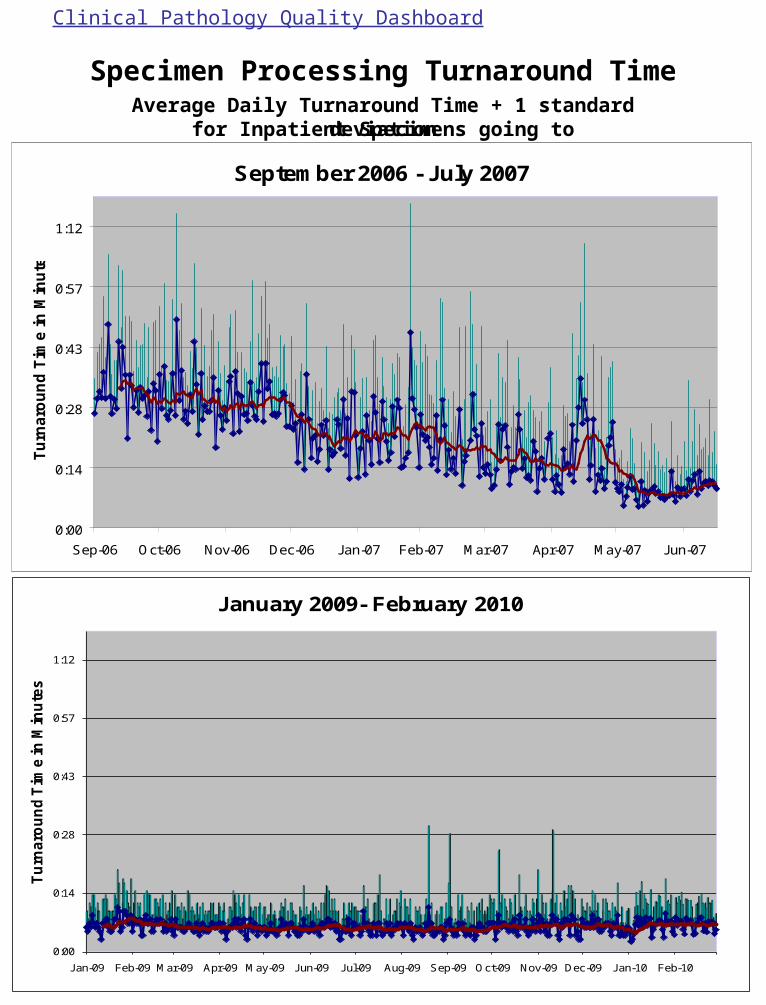
Specimen Processing Turnaround TimeAverage Daily Turnaround Time + 1 standard deviation
for Inpatient Specimens going to Chemistry
September 2006 - July 2007
0:00
0:14
0:28
0:43
0:57
1:12
Sep-06 Oct-06 Nov-06 Dec-06 Jan-07 Feb-07 Mar-07 Apr-07 May-07 Jun-07
Tu
rnaro
un
d T
ime i
n M
inu
tes
0:00
0:14
0:28
0:43
0:57
1:12
Jan-09 Feb-09 Mar-09 Apr-09 May-09 Jun-09 Jul-09 Aug-09 Sep-09 Oct-09 Nov-09 Dec-09 Jan-10 Feb-10
Tu
rnaro
un
d T
ime in
Min
ute
s
January 2009- February 2010

Clinical Pathology Quality Dashboard
Molecular Diagnostics Laboratory
0
1
2
3
4
5
6
7
8
9
10
0
200
400
600
800
1000
1200
1400
January 2002
July 2002
January 2003
July 2003
January 2004
July 2004
January 2005
July 2005
January 2006
July 2006
January 2007
July 2007
January 2008
July 2008
January 2009
July 2009
January 2010
TAT
(day
s)
Sp
ecim
ens
Rec
eive
d p
er M
on
th
Month/Year
Specimens Received and Turnaround TimeJanuary 2002 - February 2010
# Specimens TAT Linear (# Specimens) Linear (TAT)
Shift in client testing

Clinical Pathology Quality Dashboard
Chemistry In-Lab Turnaround Times
0
5
10
15
20
25
30
Pe
rce
nta
ge
Oct 07 - Feb 2010
Sample Turn-Around Time
Routine >60 min stat >45 Inpt stat >45 Outpt stat

UMHS Blood Product Utilization
Clinical Pathology Quality Dashboard
0
1000
2000
3000
4000
5000
6000
7000
8000
0
1000
2000
3000
4000
5000
6000
7000
8000
Jan Feb Mar Apr May Jun Jul Aug Sep Oct Nov Dec Jan Feb
Pa
tie
nt
Po
pu
lati
on
2009 2010
Blood Product Utilization
Random Platelets
Allo RBC Units
Plasma Units
Cryo Units
Partial Units
SD Platelets
AdjustedDischarges
Units Used
1.3
1.4
1.5
1.6
1.7
1.8
1.9
Jan Feb Mar Apr May Jun Jul Aug Sep Oct Nov Dec Jan Feb
2009 2010
Crossmatch/Transfusion Ratio
Threshold
0.0%
0.5%
1.0%
1.5%
2.0%
2.5%
Jan Feb Mar Apr May Jun Jul Aug Sep Oct Nov Dec Jan Feb
2009 2010
Wasted RBC
Threshold
0%
1%
2%
3%
4%
5%
Jan Feb Mar Apr May Jun Jul Aug Sep Oct Nov Dec Jan Feb
2009 2010
Wasted Platelets
Threshold
0%
1%
2%
3%
4%
5%
6%
Jan Feb Mar Apr May Jun Jul Aug Sep Oct Nov Dec Jan Feb
2009 2010
Wasted Plasma
Threshold
0%
5%
10%
15%
20%
25%
30%
Jan Feb Mar Apr May Jun Jul Aug Sep Oct Nov Dec Jan Feb
2009 2010
Wasted Cryoprecipitate
Threshold

Clinical Pathology Quality Dashboard
CAP Proficiency Testing
2nd Quarter FY 2010
Clinical Pathology 126 = Number of Challenges 98% = Satisfactory ResultsAnatomic Pathology 0 = Number of Challenges N/A = Satisfactory ResultsDepartment Total 126 = Number of Challenges 98% = Satisfactory Results
100
9799.5 99 100
92
99 98
50
60
70
80
90
100
0
100
200
300
400
500
600
3rd Qtr 4th Qtr 1st Qtr 2nd Qtr 3rd Qtr 4th Qtr 1st Qtr 2nd Qtr
Per
cen
t S
atis
fact
ory
Nu
mb
er o
f C
hal
len
ges
Clinical Pathology Scores
FY2008 FY2009 FY2010

Clinical Pathology Quality Dashboard
CP Financial Measures
0
2
4
6
8
10
12
1.00
1.05
1.10
1.15
1.20
1.25
1.30
1.35
1.40
1.45
Jan Feb Mar Apr May Jun Jul Aug Sept Oct Nov Dec Jan Feb
Blo
od
Pro
du
ct
Un
its (
tho
usan
ds)
Do
lla
rs (
mil
lio
ns)
paid
to
SE
Mic
h
Am
eri
can
Red
Cro
ss
2009 2010
Blood Costs vs. Total Blood Products Used
Units
Cost
$4
$5
$6
$7
$8
$9
$10
$11 Clinical Path Expense per Test*
* Excludes Blood Bank and Phlebotomy
275000
300000
325000
350000
375000
400000
425000
1,000
1,200
1,400
1,600
1,800
2,000
To
tal T
ests
Tes
t per
FT
E
Clinical Path Tests per FTE and Total Tests By Month
Tests per FTE Total Tests

• Chemistry Lab has achieved targeted turnaround times by over 95% in every category (routine, inpatient STAT, outpatient STAT) since June, 2009!
• Jerry Davis provided a spectacular power
point presentation that chronicles the service-friendly, cost-effective “Retraction of a Clinical Satellite Hematology Laboratory”. Great work by our Hematology Lab team!
Clinical Pathology Quality Dashboard
Clinical Laboratory Operations Initiatives

• Jerry Davis provided a spectacular power point presentation that chronicles the service-friendly, cost-effective “Retraction of a Clinical Satellite Hematology Laboratory”. Great work by our Hematology Lab team!
Clinical Pathology Quality Dashboard
Clinical Laboratory Service Enhancements

• Blood Bank/Transfusion Medicine, in conjunction with the Transfusion Committee, has led a reduction in monthly blood product cost from $1.3 M/month to $1.1M/month.
• Congratulations and thank you to all for great turnout and participation in the March 2, 2010 All Staff Meeting.
Clinical Pathology Quality Dashboard
Kudos


