Energy Research and Development Division
FINAL PROJECT REPORT
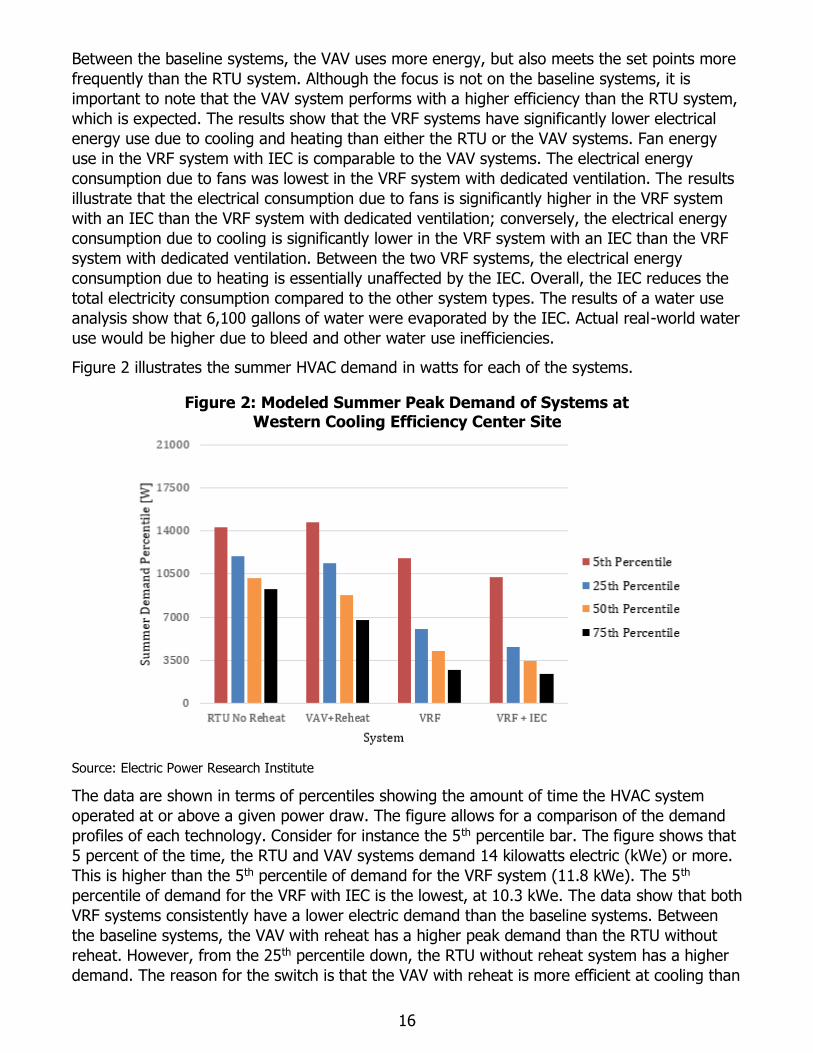
Climate Appropriate Innovations for Variable Refrigerant Flow Systems Integrated Indirect Evaporative Cooling Adaptive Controls and Advanced Refrigerants
Gavin Newsom, Governor
April 2021 | CEC-500-2021-028
PREPARED BY:
Primary Authors:
Omar Siddiqui1
Mukesh Khattar, Ph.D.1
Ryan Berg1
Ram Narayanamurthy1
Nelson Dichter2
Edwin Huestis3
1Electric Power Research Institute
3420 Hillview Ave., Palo Alto, CA 94304 (http://www.epri.com)
2University of California, Davis
1 Shields Ave., Davis, CA 95616 (www.ucdavis.edu)
3Pacific Gas and Electric Company, Applied Technology Services
3400 Crow Canyon Road, San Ramon, CA 94583 (www.pge.com)
Contract Number: EPC-15-004
PREPARED FOR:
California Energy Commission
Bradley Meister, Ph.D., P.E.
Project Manager
Virginia Lew
Office Manager
ENERGY EFFICIENCY RESEARCH OFFICE
Laurie ten Hope
Deputy Director
ENERGY RESEARCH AND DEVELOPMENT DIVISION
Drew Bohan
Executive Director
DISCLAIMER
This report was prepared as the result of work sponsored by the California Energy Commission. It does not necessarily
represent the views of the Energy Commission, its employees or the State of California. The Energy Commission, the
State of California, its employees, contractors and subcontractors make no warranty, express or implied, and assume
no legal liability for the information in this report; nor does any party represent that the uses of this information will
not infringe upon privately owned rights. This report has not been approved or disapproved by the California Energy
Commission nor has the California Energy Commission passed upon the accuracy or adequacy of the information in
this report.

i
ACKNOWLEDGEMENTS
The project team would like to thank the California Energy Commission Contract Agreement
Manager Bradley Meister, for his guidance and assistance throughout this project. The Electric
Power Research Institute recognizes and appreciates the contributions of major project
subcontractors: the University of California, Davis Western Cooling Efficiency Center (Nelson
Dichter and Jose Garcia), and Pacific Gas and Electric Company’s Advanced Technology
Services laboratory (Edwin Huestis, Yi Qu, and Michael Daukoru). The team extends special
thanks to its demonstration partners for their cooperation throughout the planning,
installation, and commissioning phases at their respective sites.
This report is dedicated to the memory of Mukesh Khattar, a dear Electric Power Research
Institute colleague who passed away on February 13, 2020. Mukesh was a technical expert in
heating, ventilation, and air-conditioning systems who contributed immensely to this project
and was admired and beloved by his colleagues.
ii
PREFACE
The California Energy Commission’s (CEC) Energy Research and Development Division
supports energy research and development programs to spur innovation in energy efficiency,
renewable energy and advanced clean generation, energy-related environmental protection,
energy transmission and distribution and transportation.
In 2012, the Electric Program Investment Charge (EPIC) was established by the California
Public Utilities Commission to fund public investments in research to create and advance new
energy solutions, foster regional innovation and bring ideas from the lab to the marketplace.
The CEC and the state’s three largest investor-owned utilities—Pacific Gas and Electric
Company, San Diego Gas & Electric Company and Southern California Edison Company—were
selected to administer the EPIC funds and advance novel technologies, tools, and strategies
that provide benefits to their electric ratepayers.
The CEC is committed to ensuring public participation in its research and development
programs that promote greater reliability, lower costs, and increase safety for the California
electric ratepayer and include:
• Providing societal benefits.
• Reducing greenhouse gas emission in the electricity sector at the lowest possible cost.
• Supporting California’s loading order to meet energy needs first with energy efficiency
and demand response, next with renewable energy (distributed generation and utility
scale), and finally with clean, conventional electricity supply.
• Supporting low-emission vehicles and transportation.
• Providing economic development.
• Using ratepayer funds efficiently.
Climate Appropriate Innovations for Variable Refrigerant Flow is the final report for the Climate
Appropriate Innovations for Variable Refrigerant Flow Systems project (Contract Number: EPC
15-004) conducted by the Electric Power Research Institute with support from the University
of California, Davis and Pacific Gas and Electric Company. The information from this project
contributes to the Energy Research and Development Division’s EPIC Program.
For more information about the Energy Research and Development Division, please visit the
CEC’s research website (www.energy.ca.gov/research/) or contact [email protected].
iii
ABSTRACT
This project demonstrated the application of a hybrid space conditioning system that
integrates variable refrigerant flow with indirect evaporative cooling as a more energy-efficient
alternative to the rooftop units prevalent in small- to medium-sized commercial buildings
throughout California. While variable refrigerant flow has been demonstrated as an energy-
efficient space conditioning technology, one of its inherent challenges is limited ventilation
capacity. This hybrid configuration uses indirect evaporative cooling as a dedicated outside air
system to satisfy ventilation requirements, eliminate outside air loads during cooling, and
reduce heating loads as an air-air heat exchanger.
Field demonstrations at three California sites sought to validate energy savings relative to
modeled baseline performance, as well as peak load reduction, demand responsiveness, and
maintained or enhanced occupant comfort.
A key advancement of this project was the development of an integrated system controller
that optimizes operation of the combined variable refrigerant flow and indirect evaporative
cooling configuration through zonal occupancy sensing and learned building behavior. Control
sequence algorithms were based on governing logic informed by adaptive capabilities and
response to inputs such as ambient weather conditions, humidity control, occupancy, and
occupant comfort preferences.
This project also advanced modeling of variable refrigerant flow, indirect evaporated cooling,
and hybrid variable refrigerant flow-indirect evaporative cooling systems by adding associated
modules to the EnergyPlus building simulation software. This modeling work, which was
calibrated with results from the field demonstrations, has developed and refined EnergyPlus
for future modeling of these emerging space conditioning technologies and configurations.
Finally, this project featured laboratory testing of three leading natural refrigerants – propane,
carbon dioxide, and ammonia – as sustainable, low global warming potential alternatives to
traditional refrigerants. Novel heat pump and chiller equipment featuring these natural
refrigerants were tested in three different laboratories, demonstrating energy-efficient
performance coupled with low global warming potential.
Keywords: Variable refrigerant flow, indirect evaporative cooling, natural refrigerants, low
global warming potential refrigerants, climate-appropriate heating, ventilation, and air
conditioning.
Please use the following citation for this report:
Siddiqui, Omar, Mukesh Khattar, Ram Narayanamurthy, Ryan Berg, Edwin Huestis, and Nelson
Dichter. 2021. Climate Appropriate Innovations for Variable Refrigerant Flow Systems.
California Energy Commission. Publication Number: CEC-500-2021-028.

iv
v
TABLE OF CONTENTS
Page
ACKNOWLEDGEMENTS ......................................................................................................... i
PREFACE ............................................................................................................................ ii
ABSTRACT ......................................................................................................................... iii
EXECUTIVE SUMMARY ........................................................................................................1
Introduction .....................................................................................................................1
Project Purpose ................................................................................................................2
Project Approach ..............................................................................................................2
Project Results .................................................................................................................3
Demonstration of Variable Refrigerant Flow Plus Indirect Evaporative Cooling Hybrid
System .........................................................................................................................3
Testing of Natural Refrigerant Systems ...........................................................................3
Technology Transfer (Advancing Research to Market) ........................................................4
Benefits to California’s Ratepayers and Environment...........................................................4
Conclusions......................................................................................................................5
CHAPTER 1: Introduction ....................................................................................................7
Background .....................................................................................................................7
Project Objective ..............................................................................................................8
CHAPTER 2: Project Approach ........................................................................................... 10
Approach: Variable Refrigerant Flow Plus Indirect Evaporative Cooling Hybrid System
Demonstration ............................................................................................................... 10
Technical Barriers ........................................................................................................ 11
Nontechnical Barriers ................................................................................................... 11
Approach: Laboratory Testing of Natural Refrigerants ....................................................... 12
Technical Barriers ........................................................................................................ 12
Nontechnical Barriers ................................................................................................... 13
CHAPTER 3: Modeling ....................................................................................................... 14
Modeling Method ............................................................................................................ 14
Modeling Results for Western Cooling Efficiency Center Site .............................................. 15
Modeling Results for Del Taco Site .................................................................................. 23
Modeling Results for Energy Innovation Center Site .......................................................... 27
Model Calibration ........................................................................................................... 27
Calibration Process ...................................................................................................... 27
vi
Calibration Results ....................................................................................................... 28
Improving Future Modeling of Integrated Variable Refrigerant Flow+Indirect Evaporative
Cooling Systems ............................................................................................................. 30
Ducting ....................................................................................................................... 30
Ventilation .................................................................................................................. 30
Evaporative Cooling ..................................................................................................... 30
Variable Refrigerant Flow ............................................................................................. 30
Calibration Tools.......................................................................................................... 31
Runtime Errors ............................................................................................................ 31
CHAPTER 4: Field Demonstration of Variable Refrigerant Flow Indirect Evaporative Cooling
Systems ........................................................................................................................... 32
Site Selection ................................................................................................................. 32
Western Cooling Efficiency Center Site .......................................................................... 33
Del Taco Site ............................................................................................................... 34
Energy Innovation Center Site ...................................................................................... 35
Controller Development .................................................................................................. 37
Economizer-Only Mode to Provide “Free-Cooling” .......................................................... 38
Indirect Evaporative Cooling Mode................................................................................ 38
Variable Refrigerant Flow Only Mode ............................................................................ 39
Variable Refrigerant Flow + Indirect Evaporative Cooling Mode ...................................... 39
Western Cooling Efficiency Center Site............................................................................. 42
Instrumentation and Baseline Measurement .................................................................. 42
Installation and Commissioning Process ........................................................................ 45
Field Results................................................................................................................ 47
Del Taco Site ................................................................................................................. 51
Baseline Determination ................................................................................................ 51
Process Description ..................................................................................................... 51
Field Results................................................................................................................ 54
Energy Innovation Center Site......................................................................................... 59
Baseline Determination ................................................................................................ 59
Process Description ..................................................................................................... 60
Field Results................................................................................................................ 61
CHAPTER 5: Laboratory Testing of Alternative Refrigerants ................................................. 62
Background ................................................................................................................... 62
Bundgaard Propane (R290) Chiller .................................................................................. 63
Equipment Information ................................................................................................ 63
vii
Testing Plan ................................................................................................................ 66
Testing Results ............................................................................................................ 74
Supplemental Modeling ................................................................................................ 77
Results ....................................................................................................................... 83
CTS Custom Carbon Dioxide (R744) Heat Pump ............................................................... 86
Equipment Information ................................................................................................ 86
Testing Plan ................................................................................................................ 90
Testing Results ............................................................................................................ 92
Ammonia (R717) Heat Pump ........................................................................................... 95
Conclusions and Recommended Next Steps ................................................................... 101
CHAPTER 6: Knowledge Transfer Activities ....................................................................... 102
Variable Refrigerant Flow + Indirect Evaporative Cooling Demonstration ......................... 102
Natural Refrigerant Testing ........................................................................................... 103
CHAPTER 7: Conclusions and Recommendations ............................................................... 104
Variable Refrigerant Flow + Indirect Evaporative Cooling Demonstration ......................... 104
Natural Refrigerant Testing ........................................................................................... 104
LIST OF ACRONYMS ........................................................................................................ 108
LIST OF FIGURES
Page
Figure 1: Modeled Annual Electricity Consumption of Systems at Western Cooling Efficiency
Center Site ....................................................................................................................... 15
Figure 2: Modeled Summer Peak Demand of Systems at Western Cooling Efficiency Center
Site .............................................................................................................................. 16
Figure 3: Modeled Annual Demand Profile of Systems at Western Cooling Efficiency Center
Site (Watts) ...................................................................................................................... 17
Figure 4: Modeled Electric Heating Consumption per California Climate Zone ........................ 18
Figure 5: Modeled Unmet Set Point Heating Hours per California Climate Zone ..................... 19
Figure 6: Modeled Cooling Electricity Use in 16 California Climate Zones............................... 20
Figure 7: Modeled Unmet Set Point Cooling Hours per California Climate Zone...................... 20
Figure 8: Modeled Annual Electricity Use per Heating, Ventilation, and Air Conditioning System
per Climate Zone .............................................................................................................. 21
Figure 9: Modeled Variable Refrigerant Flow + Indirect Evaporative Cooling Annual Energy and
Water Savings per Climate Zone ........................................................................................ 22
viii
Figure 10: Variable Refrigerant Flow + Indirect Evaporative Cooling Energy Savings by Climate
Zone, Normalized by Water Use ......................................................................................... 22
Figure 11: Modeled Share of Energy Savings from Indirect Evaporative Cooling Economizing 23
Figure 12: Del Taco Simulated Annual Energy Use by Climate Zone ..................................... 24
Figure 13: Del Taco Monthly Energy Use for Climate Zone 3 ................................................ 25
Figure 14: Del Taco Carbon Impact of Avoided Gas Use by Climate Zone ............................. 25
Figure 15: Del Taco Unmet Cooling Hours by Setpoint, Indirect Evaporative Cooling Only .... 26
Figure 16: Model Calibration Results, Electricity Consumption – Del Taco Site ....................... 29
Figure 17: Rendering of Western Cooling Efficiency Center Exterior ..................................... 33
Figure 18: Aliso Viejo Del Taco .......................................................................................... 35
Figure 19: Rooftop Views Del Taco Treatment (left) and Control (right) Sites ....................... 35
Figure 20: Energy Innovation Center Street Facing View ..................................................... 36
Figure 21: Energy Innovation Center Conditioned Zones for Variable Refrigerant Flow
Retrofit ............................................................................................................................. 36
Figure 22: Incumbent Heating, Ventilation, and Air Conditioning Equipment at Energy
Innovation Center, Building Automation View ..................................................................... 37
Figure 23: Indirect Evaporative Cooler Schematic Diagram .................................................. 39
Figure 24: Control System Architecture .............................................................................. 40
Figure 25: Automatic Demand Response Control Architecture .............................................. 41
Figure 26: Open Standards Communications for Control of Components ............................... 42
Figure 27: Indirect Evaporative Cooling Insulated Supply Flex Duct During Construction ....... 46
Figure 28: Completed Indirect Evaporative Cooling Supply and Exhaust Connections ............ 46
Figure 29: Completed Indirect Evaporative Cooling Inlet Ducting ......................................... 47
Figure 30: Outdoor Dry-Bulb Temperature on Similar Days .................................................. 48
Figure 31: Power Draw on Similar Days, Pre-Retrofit and Post-Retrofit ................................. 49
Figure 32: Total Heating, Ventilation, and Air Conditioning Energy Consumption on
Similar Days ..................................................................................................................... 50
Figure 33: Variable Refrigerant Flow and Indirect Evaporative Cooling Units Installed on Roof
of Del Taco ....................................................................................................................... 52
Figure 34: Data Monitoring Layout at Del Taco Treatment Site ............................................ 53
Figure 35: Data Monitoring Layout at Del Taco Control Site ................................................. 54
Figure 36: Monthly Cumulative Heating, Ventilation, and Air Conditioning Energy Use, Del Taco
Sites .............................................................................................................................. 55
ix
Figure 37: Del Taco Cooling Season Average Daily Heating, Ventilation, and Air Conditioning
Demand Profile ................................................................................................................. 56
Figure 38: Del Taco Summer Peak Day Heating, Ventilation, and Air Conditioning Demand
Profile .............................................................................................................................. 57
Figure 39: Del Taco Heating Season Average Daily Demand Profile ...................................... 58
Figure 40: Del Taco Winter Peak Day Heating, Ventilation, and Air Conditioning Demand
Profile .............................................................................................................................. 59
Figure 41: Energy Innovation Center Variable Refrigerant Flow Installation Diagram ............ 60
Figure 42: Hydronic Heat Pump Cooling (Left) and Heating (Right) Mode ............................. 64
Figure 43: ClimaCheck Portable Performance Analyzer and Online Platform .......................... 65
Figure 44: Bundgaard R290 Chiller Piping and Instrumentation Diagram .............................. 66
Figure 45: Bundgaard R290 Chiller Cooling Mode Factory Acceptance Test of Coefficient of
Performance Values .......................................................................................................... 67
Figure 46: Bundgaard R290 Chiller Factory Acceptance Testing Cooling Mode Test Capacity
Values .............................................................................................................................. 67
Figure 47: Schematic Layout for Testing Propane Refrigerant System ................................ 68
Figure 48: Chilled Water Feeding Condenser Side Hydronic Tempering System ..................... 69
Figure 49: Condenser Side Hydronic Instrumentation Schematic .......................................... 70
Figure 50: Evaporator Side Hydronic Instrumentation Schematic .......................................... 70
Figure 51: Coefficient of Performance and Liquid Refrigerant Temperature for Cooling Mode
Tests .............................................................................................................................. 75
Figure 52: Coefficient of Performance and Vapor Refrigerant Temperature for Heating Mode
Tests .............................................................................................................................. 76
Figure 53: Flow Cycles in Secondary Loop Bundgaard Refrigeration Unit .............................. 78
Figure 54: Example of p-h Diagram in an R290 Refrigeration System ................................... 79
Figure 55: Components in R290 Refrigeration System ......................................................... 79
Figure 56: Compressor Capacity Performance Map .............................................................. 81
Figure 57: Compressor Power Performance Map ................................................................. 81
Figure 58: Compressor EER Performance Map .................................................................... 82
Figure 59: Condenser Specifications ................................................................................... 82
Figure 60: Evaporator Specifications................................................................................... 83
Figure 61: Capacity as Function of Outdoor Temperature .................................................... 85
Figure 62: Efficiency as a Function of Outdoor Temperature ................................................ 86
Figure 63: Carbon Dioxide Heat Pump and Air Flow Diagram ............................................... 87
x
Figure 64: Diagram of Carbon Dioxide Heat Pump Component Locations .............................. 88
Figure 65: Carbon Dioxide Heat Pump Schematic and Instrumentation Locations .................. 89
Figure 66: Carbon Dioxide Heat Pump Testing Facility Setup ............................................... 90
Figure 67: Heat Rejection Chamber .................................................................................... 90
Figure 68: Heat Load Chamber .......................................................................................... 91
Figure 69: Pressure/Enthalpy Diagram (Left) and Performance Diagram (Right) .................... 93
Figure 70: Cooling Conditions Test Results ......................................................................... 93
Figure 71: Comparison to Other Commercially Ready R410A Systems .................................. 95
Figure 72: Mayekawa Sierra System at EPRI Knoxville Labs ................................................. 96
Figure 74: Secondary Loop Configuration, Ammonia Chiller, and Carbon Dioxide Working
Fluid .............................................................................................................................. 97
Figure 75: Outdoor System Fully Installed .......................................................................... 97
Figure 76: Cooling Capacity vs. Time at Approximately75˚F Ambient Temperature ............... 99
Figure 77: Cooling Capacity vs. Time at Approximately 86.5oF Ambient Temperature .......... 100
Figure 78: Cooling Capacity & Outdoor Temperature vs. Time (High Ambient) .................... 100
LIST OF TABLES
Page
Table 1: Model Parameters ................................................................................................ 15
Table 2: Parameter Values for Final Generic Building Simulations ......................................... 18
Table 3: Calibrated Modeling Parameters ............................................................................ 28
Table 4: Comparison of Calibrated Model Results to Experimental Results ............................ 28
Table 5: Summary of Variable Refrigerant Flow + Indirect Evaporative Cooling Demonstration
Sites .............................................................................................................................. 32
Table 6: Mapping of Indirect Evaporative Cooling Units to Conditioning Zones ...................... 37
Table 7: Total Heating, Ventilation, and Air Conditioning Energy Consumption on Similar
Days .............................................................................................................................. 50
Table 8: Monthly Cumulative Energy Savings for Del Taco Site ............................................ 55
Table 9: Bundgaard R290 Chiller Specifications ................................................................... 63
Table 10: Bill of Material in Bundgaard R290 Chiller Piping and Instrumentation Diagram ..... 66
Table 11: Hydronic Heat Pump Cooling and Heating Testing Conditions ............................... 71
Table 12: Advanced Technology Performance Laboratory Testing Instrument List ................. 72
xi
Table 13: Bundgaard Hydronic Heat Pump Laboratory Test Results ...................................... 74
Table 14: Measurement Uncertainty of Applied Technology Services Laboratory Test Results76
Table 16: Bundgaard Propane System, Performance Data ................................................... 85
Table 16: Comparison of Propane System and Simulated R410A VRF System ....................... 86
Table 17: List of Carbon Dioxide Heat Pump Components .................................................... 87
Table 18: List of Sensors ................................................................................................... 89
Table 19: Cooling Mode Testing Conditions......................................................................... 91
Table 20: Heating Mode Testing Conditions ........................................................................ 91
Table 21: System Optimization Testing Results for Cooling and Heating ............................... 94
Table 22: Traditional versus Ammonia/Carbon Dioxide Refrigerant Systems ......................... 98
Table 23: Summary of Refrigerant Testing Results ............................................................ 101
Table 24: Summary of Refrigerant Testing Results ............................................................ 105

xii
1
EXECUTIVE SUMMARY
Introduction Small- and medium-sized commercial buildings in California, such as office buildings, retail
establishments, restaurants, and schools, are predominantly air-conditioned with packaged
rooftop units. These ubiquitous rooftop units are economical and familiar for heating,
ventilation, and air-conditioning (HVAC) contractors to install. However, they are inherently
inefficient, suffering from significant thermal losses through leaks from ducts and cabinets,
poor distribution efficacy, and low peak performance. Replacing rooftop units with more
efficient space conditioning technology represents a significant opportunity for energy
efficiency to help California make progress toward the goal of Senate Bill 350 (de León,
Chapter 547, Statutes of 2015) to double end-use energy savings, relative to a 2015 baseline,
by 2030.
Fortunately, more energy-efficient space conditioning alternatives exist on the market. Variable
refrigerant flow, a type of ductless heat pump technology that flows refrigerant to indoor heat
exchange units rather than blowing conditioned air through ducts, offers a particularly novel
approach to achieving a high degree of energy efficiency. Indirect evaporative cooling offers
an even more energy-efficient solution since it operates without using a compressor, instead
passing outside air through a heat exchanger that evaporates water to cool indoor air
circulated through ductwork. However, both technologies are inhibited by inherent technical
limitations. Variable refrigerant flow has limited ventilation capacity, while indirect evaporative
cooling has limited cooling capacity to address peak cooling demand of buildings.
Recognizing that their limitations are complementary, a hybrid solution that features the two
technologies working in concert is a potentially compelling solution for energy savings. In
theory, indirect evaporative cooling can provide highly energy-efficient cooling during major
portions of the year, with variable refrigerant flow being activated to efficiently satisfy higher
cooling demands during the warmer summer periods. Extrapolating prior tests and applications
of variable refrigerant flow and indirect evaporative cooling systems separately, replacing
packaged rooftop units with a combined variable refrigerant flow plus indirect evaporative
cooling approach has an assumed potential to reduce energy use in these small and medium
commercial segments by 30 percent to 50 percent. Rooftop units have an average economic
useful life of 15 years, meaning that about one-fifteenth of building rooftop units will naturally
turn over each year, representing a retrofit opportunity, not including potential early
replacements of equipment.
While variable refrigerant flow plus indirect evaporative cooling is an elegant solution in
theory, there has been no prior field demonstration of this technology pairing to validate
energy savings, payback, and other customer benefits. Given the higher initial cost of a
variable refrigerant flow plus indirect evaporative cooling combination relative to rooftop units,
and the lack of familiarity among local HVAC contractors with installing and commissioning
such systems, which involves a higher degree of complexity, it is doubtful that the market
would start adopting this technology on its own without external intervention.
Another significant California policy goal is to reduce the use of refrigerants with high global
warming potential. Therefore, conversion to HVAC systems using alternative low global
warming potential refrigerants is an important component to achieving California’s climate
2
policy objectives and aligns with California Assembly Bill 3232 (Friedman, Chapter 373,
Statutes of 2018), Senate Bill 1477 (Stern, Chapter 378, Statutes of 2018), and the United
States Environmental Protection Agency’s mandate to phase out hydro-chlorofluorocarbons.
An added consideration is the use of natural refrigerants, which exist in nature and do not
have to be synthetically produced. Although some natural refrigerants have been used in niche
market applications for decades, their use is virtually absent in packaged air-conditioning
systems. This conversion requires extensive testing to identify suitable refrigerants on the
basis of global warming potential, thermodynamic properties that drive energy efficiency
performance, compatibility with existing equipment, and safety issues such as corrosion,
toxicity, and flammability.
Project Purpose The project’s overall objective was — through field demonstration, laboratory testing, and
energy simulation modeling — to advance technologies that can help California achieve its
policy goals for energy efficiency, building decarbonization, and greenhouse gas reduction.
Specifically, this project sought to demonstrate the application of a hybrid space conditioning
system that integrates variable refrigerant flow with indirect evaporative cooling as a more
energy-efficient alternative to rooftop units prevalent in small- to medium-sized commercial
buildings throughout California. This hybrid configuration uses indirect evaporative cooling as a
dedicated outside air system to satisfy ventilation requirements, eliminate outside air loads
during cooling, and reduce heating loads as an air-air heat exchanger.
Field demonstrations at three sites — a multipurpose office building in Northern California; a
quick-serve restaurant, Del Taco, in Southern California; and a multi-purpose office building in
San Diego — sought to validate energy savings relative to modeled baseline performance of
rooftop units, as well as peak load reduction, demand responsiveness, and maintained or
enhanced occupant comfort.
A key advancement of this project was the development of an integrated system controller
that optimizes operation of the combined variable refrigerant flow plus indirect evaporative
cooling configuration through zonal occupancy sensing and learned building behavior.
This project also advanced modeling of variable refrigerant flow, indirect evaporative cooling,
and hybrid variable refrigerant flow plus indirect evaporative cooling systems by adding
associated modules to the EnergyPlus building simulation software. This modeling work will
enable more accurate estimates of the energy saving effects of variable refrigerant flow,
indirect evaporative cooling, and variable refrigerant flow plus indirect evaporative cooling in
other buildings throughout California’s diverse climate zones.
Finally, this project conducted laboratory testing to assess trade-offs between performance
and environmental effects of three leading natural refrigerants — propane, carbon dioxide,
and ammonia — as sustainable, low global warming potential alternatives to traditional
refrigerants.
Project Approach The core project team consisted of the Electric Power Research Institute and two major
subcontractors: the University of California, Davis Western Cooling Efficiency Center and
Pacific Gas and Electric Company’s Applied Technology Services center. Another subcontractor,
3
MelRok, developed the controller unit based on governing logic furnished by the core project
team. Qualified contractors installed and commissioned the technologies at each site.
The variable refrigerant flow plus indirect evaporative cooling research aspect of the project,
as well as the alternative refrigerant component research aspect, each applied a series of
steps to model, demonstrate, test, document, and analyze the potential energy-saving and
mitigation potential of global warming, respectively, overcoming technical and non-technical
obstacles in each aspect of the research.
Project Results
Demonstration of Variable Refrigerant Flow Plus Indirect Evaporative Cooling Hybrid System
Overall, the demonstrations validated the energy savings and demand reduction impact of the
variable refrigerant flow plus indirect evaporative cooling hybrid system as an alternative to
rooftop unit systems or to variable refrigerant flow systems alone.
The Del Taco results showed significant energy savings and peak demand reduction. Over the
course of a six-month period spanning September 2019 through February 2020, the Del Taco
treatment site with the variable refrigerant flow plus indirect evaporative cooling system
yielded average monthly energy savings of approximately 32.4 percent compared to the
rooftop unit control site. On the summer peak day during this period, the demonstration
system resulted in energy savings of 20.0 percent, including a 14.7 percent reduction in peak
demand during the 1:00 pm hour. During the winter peak day, the variable refrigerant flow in
heating mode resulted in 45 percent energy savings compared to the control site heating
system. The pre-retrofit configuration was a roof top unit system and the post-retrofit
configuration was variable refrigerant flow plus indirect evaporative cooling.
The Northern California office building demonstration yielded an average energy savings of
18.7 percent beyond the previous operation of a variable refrigerant flow system on similar
days across a variety of ambient temperatures during the cooling season. The pre-retrofit
configuration was variable refrigerant flow only, and the post-retrofit configuration was
variable refrigerant flow plus indirect evaporative cooling.
The nature of the Southern California office site demonstration was different from the other
two in that the operative objective was not energy savings but rather enhancing occupant
comfort and increasing utilization of the space during periods of high temperature and high
indoor occupancy. Despite circumstances inhibiting full measurement of the energy savings
impact, the variable refrigerant flow plus indirect evaporative cooling system performed as
commissioned and met all qualitative measures of comfort.
Further deployments in other California climate zones and in different types of commercial
buildings would provide even greater insight into the energy savings potential of this unique
hybrid configuration.
Testing of Natural Refrigerant Systems
The refrigerant testing component of the project offered a range of results that validate that
the use of low global warming potential refrigerants, particularly natural refrigerants of
propane, carbon dioxide, and ammonia, does not adversely compromise system performance
4
and efficiency compared to more common, higher global warming potential, synthetic
refrigerants.
Test results demonstrated that equipment operating on low global warming potential natural
refrigerants exhibits performance and efficiency commensurate with traditional synthetic
refrigerants. This suggests that converting to low global warming potential refrigerants does
not compromise energy efficiency and performance efficacy.
The natural refrigerants tested in this project, as well as R32, can be suitable for variable
refrigerant flow systems. These alternate refrigerants cannot be used as a drop-in replacement
for R410A but rather in systems (variable refrigerant flow or otherwise) for which they are
specifically designed.
Technology Transfer (Advancing Research to Market) The results from this project will be widely shared following the release of this report through
presentations and papers at such industry outreach events as the American Council for an
Energy-Efficient Economy Building Summer Study, Emerging Technologies Summit, California
Emerging Technology Coordination Council, Utility Energy Forum, and meetings of the
California Institute for Energy and Environment, Western Cooling Efficiency Center, and New
Buildings Institute, as well as through articles in the trade press for HVAC technology. Electric
Power Research Institute plans to conduct similar demonstration projects in California with a
greater variety of appropriate commercial buildings in different climate zones, in conjunction
with utilities and other partners. The company also intends to work with utility partners to
replicate this type of technology demonstration around the country.
By selecting a quick-serve chain restaurant, Del Taco, as one of the demonstration sites, the
results are directly replicable and scalable to the other 580-plus Del Taco restaurants in
California. This represents an immediate and sizable “warm market” for this technology.
By extension, other quick-serve restaurant chains represent an additional addressable market.
According to a 2020 market research report by Ibis World, there are nearly 90,000 restaurants
in California, with approximately one-third in the fast food or quick-serve segment. Outreach
to industry trade organizations such as the California Restaurant Association can help transfer
the knowledge and experience of this research.
Enhancements to the EnergyPlus building energy simulation tool developed by the project
have been communicated to the United States Department of Energy.
The research results will be promulgated through papers and presentations at industry
conferences, as well as through articles in the trade press for energy research and HVAC
technology.
Benefits to California’s Ratepayers and Environment The project directly benefits California ratepayers by demonstrating that a combined variable
refrigerant flow plus indirect evaporative cooling approach has the potential to reduce energy
consumption in small- and medium-sized commercial buildings by 20 percent to 32 percent as
a replacement for the less energy-efficient packaged rooftop units ubiquitous to this market.
This project demonstrated that the hybrid system can reduce demand on a peak summer hour
by 15 percent. The energy savings reduces emissions of carbon and other pollutants and also
5
improves occupant comfort. The overall system cost can be competitive to rooftop
replacement when the two systems are right sized using optimized economizer operation.
In addition, laboratory testing results of the three natural refrigerants (propane, carbon
dioxide, and ammonia) demonstrated efficiencies in cooling mode commensurate with
traditional synthetic refrigerants and suggest that converting to natural refrigerants with low
global warming potential does not compromise energy efficiency and performance efficacy.
This significant finding can encourage further tests and scaled deployments of natural
refrigerant systems to help meet California’s greenhouse gas reduction goals.
The research has benefited numerous stakeholders.
Del Taco has expressed interest in expanding the technology to other locations. Because of
COVID the dining areas have been closed, which has reduced the near-term urgency to
implement at other locations. Del Taco is pleased with the operations of the Aliso Viejo
location. The site consistently maintains comfortable kitchen temperatures and the system
has not required any service calls. The HVAC contractor also plans to discuss this hybrid
HVAC configuration with other fast food accounts, including a notable pizza chain.
A key market influencer with this type of system is the HVAC contractor, who can serve as the
system integrator. The team sees an important step as the continual education transfer to the
HVAC contractor/installer community.
This project developed modules that had previously not existed in EnergyPlus: (1) multi-zone
variable refrigerant flow; (2) variable refrigerant flow plus dedicated outside air system; and
(3) indirect evaporative cooling as part of a dedicated outside air system solution. The project
team communicated and transferred these innovations to the EnergyPlus community through
such organizations as Big Ladder (an industry trainer for EnergyPlus), the National Renewable
Energy Laboratory and Lawrence Berkeley National Laboratory. The latest version of
EnergyPlus (v9.4) reflects some of these enhancements. EnergyPlus v9.4 is available for the
HVAC/building community to use for Title 24 compliance calculations. These enhancements in
EnergyPlus can influence future iterations of Title 24, insofar as the energy savings
performance of variable refrigerant flow plus indirect evaporative cooling can be explicitly
included. This can allow for aesthetic tradeoffs preferred by builders and customers such as
greater window to wall ratio.
Information on alternative refrigerants has been shared in public forums, industry conferences
and Electric Power Research Institute meetings and will lead to future installations using
refrigerants with lower global warming.
Energy policy makers and regulators in California and throughout the United States can better
understand the potential role of this hybrid system in achieving climate goal objectives.
Utilities can inform similar demonstrations, scaled field deployments, and customer incentive
programs to help attain prescribed energy efficiency goals. And the results can also bolster the
confidence of HVAC contractors to offer these solutions to customers.
Conclusions By providing a unique research and demonstration opportunity to bridge disjointed silos within
the building industry, this research sets the stage for further demonstrations at small- and
medium-sized commercial buildings throughout California.

6
7
CHAPTER 1: Introduction
Background
Small- and medium-sized commercial buildings in California are predominantly air-conditioned
with packaged rooftop units (RTUs). Economical and familiar for heating, ventilation, and air-
conditioning (HVAC) contractors to install, RTUs are ubiquitous for small- and medium-size
office buildings, retail establishments, restaurants, and schools throughout the state. However,
RTUs are inherently inefficient, suffering from significant thermal losses though leaks from
ducts and cabinets, poor distribution efficacy, and low peak performance. Replacing RTUs with
more efficient space conditioning technology represents a significant opportunity for energy
efficiency to help California make progress toward the ambitious goal directed in Senate Bill
350 (De León, Chapter 547, Statutes of 2015) to double end-use energy savings, relative to a
2015 baseline, by 2030.
Fortunately, more energy-efficient space conditioning alternatives exist on the market,
including heat pumps and indirect evaporative cooling (IEC). Variable refrigerant flow (VRF), a
type of ductless heat pump technology that flows refrigerant to indoor heat exchange units,
rather than blowing conditioned air through ducts, offers a particularly novel approach to
achieving a high degree of energy efficiency. IEC offers an even more energy-efficient solution
since it operates without using a compressor, instead passing outside air through a heat
exchanger that evaporates water to cool indoor air circulated through ductwork. However, VRF
and IEC are each inhibited by inherent technical limitations. VRF has limited ventilation
capacity, while IEC has limited cooling capacity to address peak cooling demand of buildings.
Recognizing that the limitations of VRF and IEC are complementary, a hybrid solution that
features VRF and IEC working in concert is a potentially compelling solution for energy
savings. In theory, IEC can provide highly energy-efficient cooling during major portions of the
year, with VRF being activated to efficiently satisfy higher cooling demands during the warmer
summer periods. Extrapolating prior tests and applications of VRF and IEC systems separately,
replacing packaged RTUs with a combined VRF+IEC approach has an assumed potential to
reduce energy use in these small- and medium-sized commercial segments by 30 percent to
50 percent. For perspective, a 40 percent reduction in energy use for these building segments
represents 2,800 gigawatt-hours (GWh) of energy savings or about 5 percent of electricity use
in commercial buildings in California.1 A commensurate reduction in peak demand would be 2
gigawatts (GW), or about 4 percent of total California peak demand. Not only is this energy
savings opportunity vast, it is also immediately addressable. RTUs have an average economic
useful life of 15 years, meaning that about one-fifteenth of building RTUs will naturally turn
over each year. Each instance of turnover represents a retrofit opportunity, not including
potential early replacements of equipment.
While VRF+IEC is an elegant solution in theory, there has been no prior field demonstration of
this technology pairing to validate energy savings, payback, and other customer benefits.
1 California Energy Commission. “California Commercial End-Use Survey.” CEC-400-2006-005. March 2006.
8
Given the higher initial cost of a VRF+IEC combination relative to RTUs, and the lack of
familiarity among local HVAC contractors with installing and commissioning such systems,
which involves a higher degree of complexity, it is doubtful that the market would start
adopting this technology on its own without external intervention. Demonstrating the
performance of this technology in actual commercial buildings can inform building owners,
HVAC contractors, and other market actors and thereby accelerate market adoption.
Accordingly, allocating funds from California ratepayers to demonstrate this technology in the
field is a prudent investment.
Another significant California policy goal is to reduce the use of refrigerants with high global
warming potential (GWP). Leakage of synthetic refrigerants into the atmosphere, including
hydrochlorofluorocarbons widely used in HVAC and refrigeration systems, is known to have
high GWP. California Assembly Bill 3232 (Friedman, Chapter 373, Statutes of 2018requires the
California Energy Commission (CEC), in consultation with the California Public Utilities
Commission, California Air Resources Board, and the California Independent System Operator,
to assess by January 1, 2021 the potential to reduce greenhouse gases (GHG) in buildings by
40 percent below 1990 levels by 2030. In addition, California Senate Bill 1477 (Stern, Chapter
378, Statutes of 2018) allocates funding for building decarbonization programs. The United
States Environmental Protection Agency (USEPA) mandates a phase-out of
hydrochlorofluorocarbons, including the common refrigerants R-22 and R-142b, due to their
ozone-depleting attributes. Although their production and import are banned starting in 2020,
continued use of existing stockpiles can continue through 2030.2
Conversion to HVAC systems using alternative low-GWP refrigerants is therefore an important
component to achieving these California policy objectives. An added consideration is the use of
natural refrigerants, which exist in nature and do not have to be synthetically produced.
Although some natural refrigerants have been used in niche market applications for decades,
their use is virtually absent in packaged air-conditioning systems. However, this conversion
requires extensive testing to identify suitable refrigerants on the basis of GWP, thermodynamic
properties that drive energy efficiency performance, compatibility with existing equipment, and
safety issues such as corrosion, toxicity, and flammability. Laboratory testing of low-GWP,
natural refrigerant HVAC systems warrants California ratepayer funding to inform policy
makers, HVAC equipment manufacturers, and contractors, and thereby accelerate market
adoption and use.
Project Objective
This project sought to demonstrate the application of a hybrid space conditioning system that
integrates VRF with IEC as a more energy-efficient alternative to RTUs prevalent in small- to
medium-sized commercial buildings throughout California. While VRF has been demonstrated
as an energy-efficient space conditioning technology, one of its inherent challenges is limited
ventilation capacity. This hybrid configuration uses IEC as a dedicated outside air system
(DOAS) to satisfy ventilation requirements, eliminate outside air loads during cooling, and
reduce heating loads as an air-air heat exchanger.
2 U.S. Environmental Protection Agency. https://www.epa.gov/ods-phaseout.
9
Field demonstrations at three sites — a multi-purpose office building in Northern California
(Pacific Gas and Electric Company [PG&E] territory), a quick-serve restaurant in Southern
California (Southern California Edison [SCE] territory), and a multi-purpose office building in
San Diego (San Diego Gas & Electric Company [SDG&E] territory) — sought to validate
energy savings relative to modeled baseline performance of RTUs, as well as peak load
reduction, demand responsiveness, and maintained or enhanced occupant comfort.
A key advancement of this project was the development of an integrated system controller
that optimizes operation of the combined VRF+IEC configuration through zonal occupancy
sensing and learned building behavior. Control sequence algorithms were based on governing
logic informed by adaptive capabilities and response to inputs such as ambient weather
conditions, humidity control, occupancy, and occupant comfort preferences.
This project also advanced modeling of VRF, IEC, and hybrid VRF+IEC systems by adding
associated modules to the EnergyPlus building simulation software. This modeling work, which
was calibrated with results from the field demonstrations, has developed and refined
EnergyPlus for future modeling of these emerging space conditioning technologies and
configurations. This will enable more accurate estimates of the energy savings effects of VRF,
IEC, and VRF+IEC in other buildings throughout California’s diverse climate zones.
Finally, this project conducted laboratory testing of three leading natural refrigerants —
propane, carbon dioxide, and ammonia — as sustainable, low-GWP alternatives to traditional
refrigerants. Novel heat pump and chiller equipment featuring these natural refrigerants were
tested in three different laboratories, demonstrating energy-efficient performance coupled with
low-GWP properties. The objective of these tests was to assess the trade-offs between
performance and environmental effect as well as to document other important considerations
such as safety.
The project’s overall objective was — through field demonstration, laboratory testing, and
energy simulation modeling — to advance technologies that can help California achieve its
policy goals for energy efficiency, building decarbonization, and GHG reduction. These project
objectives offer multifold benefits to California residents and businesses, including reduced
energy bills, reduced carbon emissions to address climate change, and reduced emission of air
pollutants to improve air quality. Accordingly, this project merited ratepayer funding.
The results of this research can benefit numerous stakeholders in addition to California
residents and businesses. Energy policy makers and regulators, both in California and
throughout the United States, can gain a better understanding of the potential role that
VRF+IEC and natural refrigerants can play in achieving government policy objectives. Utilities
can learn from these results to inform similar demonstrations, scaled field deployments, and
customer incentive programs to help attain prescribed energy efficiency goals. These results
can also bolster the confidence of HVAC contractors to offer these solutions to customers.
The research results will be promulgated through papers and presentations at industry
conferences, as well as through articles in the trade press for energy research and HVAC
technology.
10
CHAPTER 2: Project Approach
This chapter describes the approach taken for both aspects of the project — the
demonstration of the VRF+IEC hybrid system and laboratory testing of three natural
refrigerants, each operating in a different HVAC system.
Approach: Variable Refrigerant Flow Plus Indirect Evaporative Cooling Hybrid System Demonstration The core project team consisted of the Electric Power Research Institute (EPRI) and two major
subcontractors: the University of California, Davis’ Western Cooling Efficiency Center (WCEC)
and PG&E’s Applied Technology Services center. EPRI provided project management and led
two field demonstration sites. Since WCEC’s own building on the campus of UC Davis was
selected as a demonstration site, WCEC was responsible for managing its demonstration site,
and it also led the modeling work. PG&E conducted testing of one of the alternative refrigerant
units — a propane chiller — at its laboratory facilities. Another subcontractor, MelRok,
developed the controller unit based on governing logic furnished by the core project team.
The demonstration sites were:
• WCEC multi-purpose office building and laboratory space located on the campus of UC
Davis, managed by WCEC.
• Del Taco quick-service restaurant located in Aliso Viejo, California, managed by EPRI.
• Del Taco quick-service restaurant located in Irvine, California, serving as an
experimental control site to the Aliso Viejo site, managed by EPRI.
• The San Diego Gas & Electric (SDG&E) Energy Innovation Center (EIC) located in San
Diego, California, managed by EPRI.
Qualified contractors installed and commissioned the technologies at each site, including SH
Mechanical at the Davis site, Aire-Rite for the Del Taco treatment site, and Jackson & Blanc for
the San Diego site.
The VRF+IEC research in this project applied the following steps:
• Modeled the energy savings potential of a VRF+IEC hybrid system under a variety of
California climate zones
• Scouted viable sites in each of the three investor-owned utility (IOU) service territories
with a diversity of building types and incumbent HVAC technologies
• Developed a baseline monitoring and data collection plan for each demonstration
treatment site
• Installed and commissioned VRF+IEC hybrid systems at the demonstration sites
• Collected and analyzed data from the demonstration sites
• Calibrated building energy models based on field data
• Documented results
11
Technical Barriers
A key technical challenge was developing a stand-alone controller for the VRF + IEC hybrid
system. This challenge was compounded by the fact that all commercial VRF systems employ
proprietary control systems. This involved first developing a control schema based on
governing logic on how the system should function in various modes — economizer-only, IEC,
VRF, or simultaneous VRF and IEC operation. The next step was converting governing logic
into corresponding control algorithms and developing a cloud-based architecture and
communications platform to provide overlaying controls for both a VRF and IEC system. The
researchers addressed this challenge by identifying and securing a controls vendor, MelRok,
with the requisite expertise to build a controller using generic hardware and applying the
BACnet data communication protocol to extract data and send control signals to the VRF
system.
For the Del Taco site, the research team realized post-installation that the VRF unit had not
been commissioned with BACnet connectivity. As a result, the team had to procure and install
a compatible BACnet gateway device to enable control and data transfer.
Another technical challenge was modeling the performance of a VRF+IEC hybrid system.
Current building energy simulation models had not been able to accurately represent the “as-
is” implementation of VRF and IEC technologies separately, let alone operating in conjunction
with one another. This project developed new modules for VRF and IEC systems within the
EnergyPlus tool to simulate their energy use in the context of whole-building performance.
Nontechnical Barriers
The project team encountered non-technical barriers as well. Unexpected site issues can
compromise aspects of any field demonstration. In this case, for example, the original
demonstration site in the SCE territory, an office building in Mission Viejo, that had been
committed to the project for more than two years dropped out due to an unrelated legal
dispute between the site owners and a third party. The team had already collected more than
two years’ worth of baseline data, and despite months of attempts to salvage the situation had
to quickly improvise to secure another appropriate site.
Fortunately, the researchers were able to quickly pivot to a Del Taco restaurant in Aliso Viejo
that was being serviced by the designated local HVAC contractor and was due for a significant
HVAC retrofit. In retrospect, shifting to a restaurant site allowed the team to expand the
diversity of demonstration venues to assess the VRF+IEC technology in a setting that is, in
theory, inherently conducive due to its distinct zones (kitchen versus customer area) and high
ventilation needs. However, the change to the Del Taco site occurred at too late a juncture in
the project to allow for a years’ worth of baseline data monitoring, as had been the original
plan to compare pre-retrofit (baseline) to post-retrofit energy consumption. Accordingly, the
researchers shifted the experimental design to a side-by-side control and treatment approach
by simultaneously monitoring an identical Del Taco location in nearby Irvine as a control site to
the Aliso Viejo treatment site.
Broadly speaking, the inertia of market forces poses barriers to any new technology. VRF and
IEC systems are relatively expensive since they are not yet produced at a scale to drive costs
lower. Most contractors and design engineers are not familiar with the design needs, operating
conditions, and control considerations for VRF or IEC systems separately, let alone together.
12
The experienced gained from this project can inform future installations, reducing their
complexity and size requirements and thereby reducing costs.
The uptake of innovative energy-efficient HVAC systems depends on the interaction and
interdependence of a complex network of market actors in the building industry. Service
technicians and contractors influence customer purchase decisions with their input and
recommendations about technology choices. Design engineers are drawn to familiar
technology solutions and strategies advocated by their go-to distributors. Although policy
changes such as efficiency mandates can quickly shift industry practices, policy making is a
slow process that is challenged to address all contingencies. Incentive and rebate programs
offer some positive pressure for the adoption of efficiency measures, but even programs that
offer obvious return on investment can have little effect when other challenges to
implementation remain in place. VRF and IEC technologies are both plodding their way toward
broader application but are hindered by a reluctance to change from traditional practices, by
cost challenges and by general lack of awareness and professional understanding for the
technologies.
Approach: Laboratory Testing of Natural Refrigerants The alternative refrigerant component of this research project applied the following steps:
• Investigated alternative refrigerants most appropriate for laboratory testing, based on
mitigation of GWP, energy efficiency, and safety
• Selected three natural refrigerants — propane, carbon dioxide, and ammonia — based
on the mitigation of GWP, energy efficiency, and safety
• Developed testing protocols
• Scouted, procured or otherwise secured, and shipped heat pump or chiller units using
these natural refrigerants to laboratory facilities
• Installed and commissioned alternate refrigerant units at three laboratory locations
• Conducted evaluation tests consistent with protocols
• Collected and analyzed data
• Documented results
Technical Barriers
The primary technical barrier to laboratory testing of alternate refrigerants was planning and
designing flexible testing configurations appropriate for different applications. For example, for
a non-VRF application, a single loop configuration is appropriate since the refrigerant
conditions air that is circulated through ducts. For a VRF set up, a secondary pump loop
configuration is suitable to measure system performance while ensuring safety, due to the
potential health and safety concerns related to toxicity. This entailed working with laboratory
partners and contractors to configure tests with ancillary equipment to allow testing of HVAC
equipment using the alternate, natural refrigerant in the primary loop and a heat exchanger to
condition a separate working fluid in a secondary loop to transfer cooling or heating to indoor
fan coil units in a VRF application.
13
Nontechnical Barriers
The major barrier for natural refrigerant testing was identifying and procuring, or otherwise
securing, suitable equipment for demonstration. The project team learned that packaged
HVAC systems operating on natural refrigerants are not commercially available in the United
States. Accordingly, the team directed its focus to Europe and Asia in a search for suitable
equipment operating on alternate, natural refrigerants. Even in those regions of the world, use
of natural refrigerants is typically relegated to niche applications of large refrigeration
equipment. The project team scoured worldwide for HVAC systems operating on propane,
carbon dioxide, or ammonia that would be feasible and appropriate for laboratory testing.
After months of extensive review, the researchers sourced a water-cooled heat pump
manufactured by a Danish company, Bundgaard Refrigeration, that uses propane as a
refrigerant. Due diligence required months of correspondence to confirm equipment
specifications and readiness for lab testing in the United States. This process included
travelling to Denmark to assess the equipment in preliminary factory tests prior to shipment.
The team then had to arrange international shipment from Denmark for delivery to the San
Francisco Bay Area for testing, which required complex logistical planning, a significant test of
the resourcefulness and resiliency of the project team.
Recognizing that the value of this project would increase with the number of different
refrigerants assessed, the project team sought additional equipment to test and facilities in
which to test them. After considerable evaluation, the team identified a carbon dioxide heat
pump designed and configured by a leading HVAC research group at the University of Illinois,
Champaign-Urbana. Working in close coordination with researchers there, the project team
commissioned testing of this carbon dioxide heat pump at their lab in Illinois, following
consistent test protocols.
To round out the refrigerant testing portfolio, the project team directed attention to acquiring
ammonia refrigerant equipment to complement the propane and carbon dioxide systems.
Auspiciously, simultaneous to this project, EPRI’s thermal laboratories in Knoxville, Tennessee
had arranged the first test of an ammonia refrigerant chiller in North America, manufactured
by Mayekawa of Japan. The project team coordinated with the EPRI research team in
Knoxville, where the testing was conducted, to ensure that test results would inform the
overall project mission.
14
CHAPTER 3: Modeling
This chapter describes the approach used in this project to model the performance of baseline
RTU systems and the integrated VRF+IEC system for multiple sites.
Modeling Method
• Overcoming challenges to model VRF
• Creating new modules in EnergyPlus for VRF + dedicated outside air system (DOAS)
This research project is aimed at documenting the performance of two California climate
appropriate HVAC systems and evaluating the electrical demand and energy reductions
associated with installing the systems. The researchers created and refined a calibrated
building energy model to prove the accuracy of the modeling methods. A standard model was
then used to extend the proven modeling methods to the stock of existing commercial
buildings in California. Finally, the electric demand, energy, and water effects of different
HVAC technologies throughout California were predicted using the final models.
The building energy modeling was performed with EnergyPlus. EnergyPlus is a modeling
software that is commonly used to analyze HVAC cooling and heating loads and HVAC-related
electrical energy consumption in buildings. The software can be used to study the effects of
various energy efficiency measures and technologies. Since EnergyPlus does not include
modules to simulate several of the strategies and technologies investigated for this project,
the researchers used the energy management system feature to model these strategies and
technologies. Although some of the energy management system models do not completely
capture the behavior of the real systems, the annual effect of the errors is expected to be low.
An EnergyPlus model was calibrated using field measurements of capacity, electrical energy
use, and zone temperatures. The researchers then used the calibrated model to simulate three
other HVAC systems that could be used in the same building. The report compares the
electrical energy use, electrical demand, and water use associated with the installation of the
four HVAC technology packages, which are:
1) Roof top units (RTUs) with vapor-compression cooling, electric resistance heating, and
ductwork for air distribution; this is considered the baseline technology since it is the
prevalent incumbent equipment for small- and medium-sized buildings
2) Variable air volume (VAV) system with a central air handling and cooling system and
zone-level electric reheat coils
3) VRF system with a dedicated ventilation system
4) VRF system with a DOAS that incorporates IEC
15
Modeling Results for Western Cooling Efficiency Center Site The researchers updated the site model after the calibration study to reflect schedule changes
that occurred after the calibration period and before the retrofit study. The stack effect flow
through the ventilation chase was eliminated since it was a unique observation at the field test
site. Furthermore, a permanent fix was implemented in the building to eliminate stack effect in
the ventilation chase. The parameter values used in the final models are tabulated in Table 1.
Table 1: Model Parameters
Parameter Value
Schedule 7 a.m. to 7 p.m.
Electric Gains / Lighting Gains 12 W/m2* / 2.54 W/m2
People 18.58 people/m2
Winter Set Point 75°F (24°C)
Summer Set Point 72°F (22°C)
Exterior Wall Construction R-Value 1.4 hr-ft2-°F/BTU**
*watts per square meter
**British thermal units
Source: Electric Power Research Institute
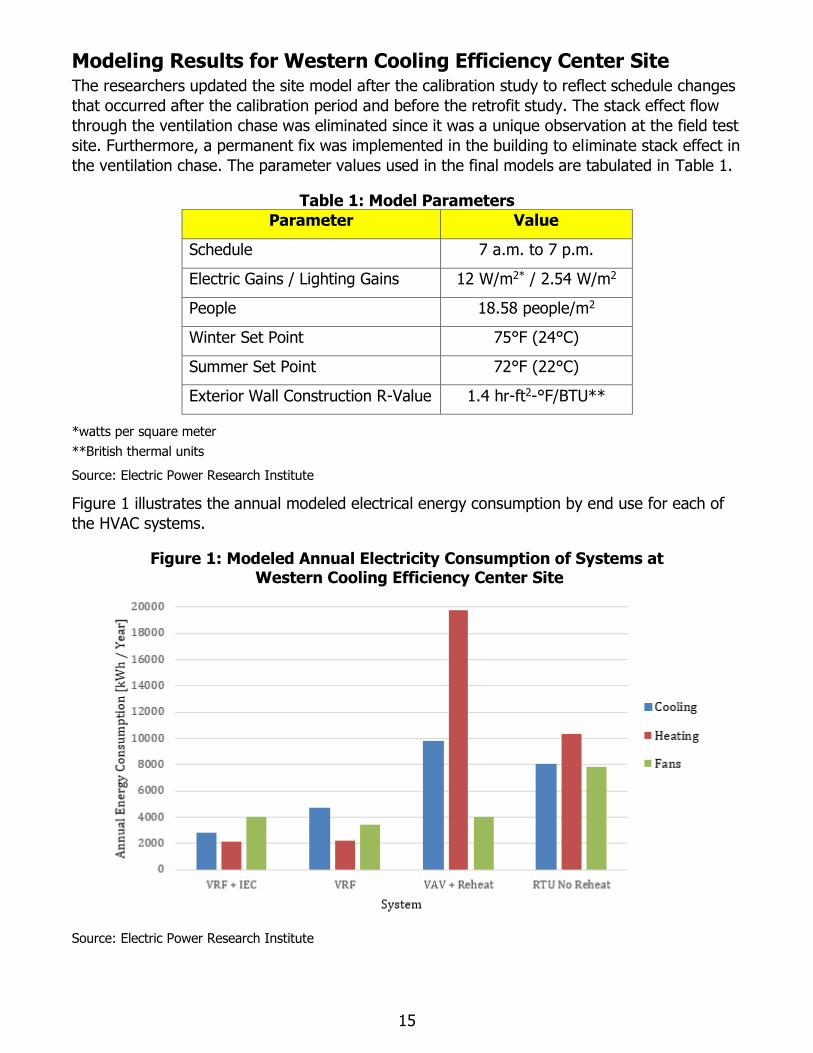
Figure 1 illustrates the annual modeled electrical energy consumption by end use for each of
the HVAC systems.
Figure 1: Modeled Annual Electricity Consumption of Systems at Western Cooling Efficiency Center Site
Source: Electric Power Research Institute
16
Between the baseline systems, the VAV uses more energy, but also meets the set points more
frequently than the RTU system. Although the focus is not on the baseline systems, it is
important to note that the VAV system performs with a higher efficiency than the RTU system,
which is expected. The results show that the VRF systems have significantly lower electrical
energy use due to cooling and heating than either the RTU or the VAV systems. Fan energy
use in the VRF system with IEC is comparable to the VAV systems. The electrical energy
consumption due to fans was lowest in the VRF system with dedicated ventilation. The results
illustrate that the electrical consumption due to fans is significantly higher in the VRF system
with an IEC than the VRF system with dedicated ventilation; conversely, the electrical energy
consumption due to cooling is significantly lower in the VRF system with an IEC than the VRF
system with dedicated ventilation. Between the two VRF systems, the electrical energy
consumption due to heating is essentially unaffected by the IEC. Overall, the IEC reduces the
total electricity consumption compared to the other system types. The results of a water use
analysis show that 6,100 gallons of water were evaporated by the IEC. Actual real-world water
use would be higher due to bleed and other water use inefficiencies.
Figure 2 illustrates the summer HVAC demand in watts for each of the systems.
Figure 2: Modeled Summer Peak Demand of Systems at Western Cooling Efficiency Center Site
Source: Electric Power Research Institute
The data are shown in terms of percentiles showing the amount of time the HVAC system
operated at or above a given power draw. The figure allows for a comparison of the demand
profiles of each technology. Consider for instance the 5th percentile bar. The figure shows that
5 percent of the time, the RTU and VAV systems demand 14 kilowatts electric (kWe) or more.
This is higher than the 5th percentile of demand for the VRF system (11.8 kWe). The 5th
percentile of demand for the VRF with IEC is the lowest, at 10.3 kWe. The data show that both
VRF systems consistently have a lower electric demand than the baseline systems. Between
the baseline systems, the VAV with reheat has a higher peak demand than the RTU without
reheat. However, from the 25th percentile down, the RTU without reheat system has a higher
demand. The reason for the switch is that the VAV with reheat is more efficient at cooling than
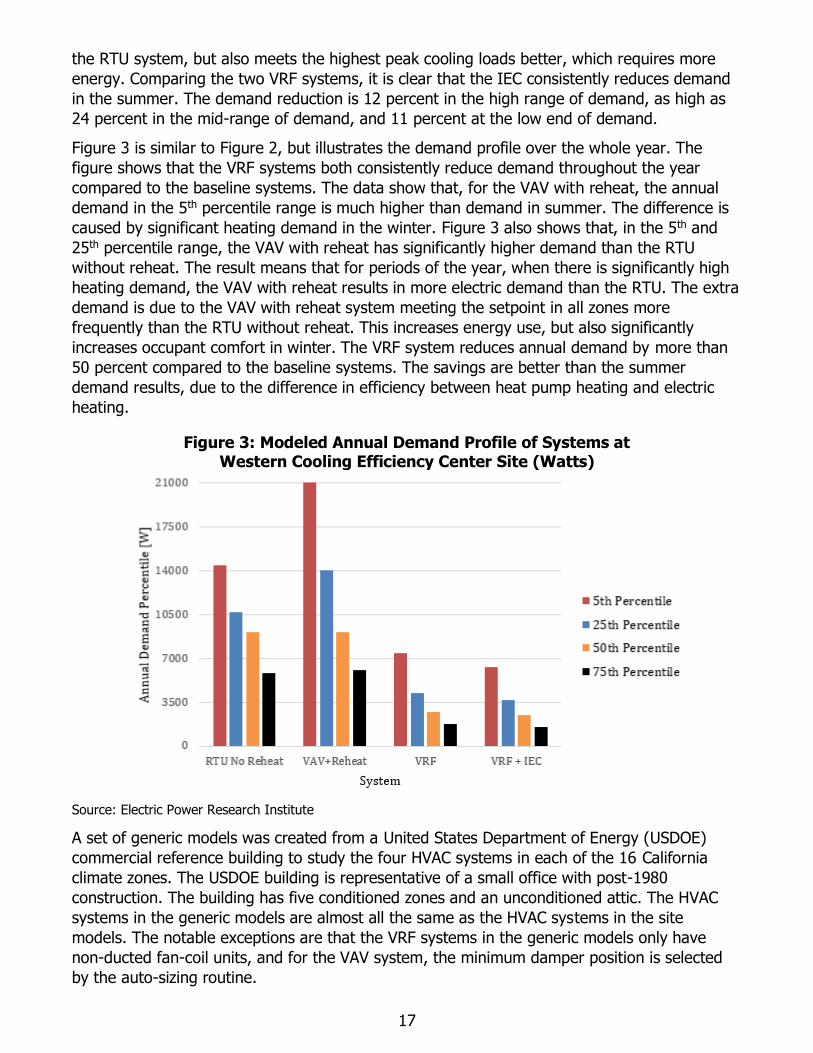
17
the RTU system, but also meets the highest peak cooling loads better, which requires more
energy. Comparing the two VRF systems, it is clear that the IEC consistently reduces demand
in the summer. The demand reduction is 12 percent in the high range of demand, as high as
24 percent in the mid-range of demand, and 11 percent at the low end of demand.
Figure 3 is similar to Figure 2, but illustrates the demand profile over the whole year. The
figure shows that the VRF systems both consistently reduce demand throughout the year
compared to the baseline systems. The data show that, for the VAV with reheat, the annual
demand in the 5th percentile range is much higher than demand in summer. The difference is
caused by significant heating demand in the winter. Figure 3 also shows that, in the 5th and
25th percentile range, the VAV with reheat has significantly higher demand than the RTU
without reheat. The result means that for periods of the year, when there is significantly high
heating demand, the VAV with reheat results in more electric demand than the RTU. The extra
demand is due to the VAV with reheat system meeting the setpoint in all zones more
frequently than the RTU without reheat. This increases energy use, but also significantly
increases occupant comfort in winter. The VRF system reduces annual demand by more than
50 percent compared to the baseline systems. The savings are better than the summer
demand results, due to the difference in efficiency between heat pump heating and electric
heating.
Figure 3: Modeled Annual Demand Profile of Systems at Western Cooling Efficiency Center Site (Watts)
Source: Electric Power Research Institute
A set of generic models was created from a United States Department of Energy (USDOE)
commercial reference building to study the four HVAC systems in each of the 16 California
climate zones. The USDOE building is representative of a small office with post-1980
construction. The building has five conditioned zones and an unconditioned attic. The HVAC
systems in the generic models are almost all the same as the HVAC systems in the site
models. The notable exceptions are that the VRF systems in the generic models only have
non-ducted fan-coil units, and for the VAV system, the minimum damper position is selected
by the auto-sizing routine.
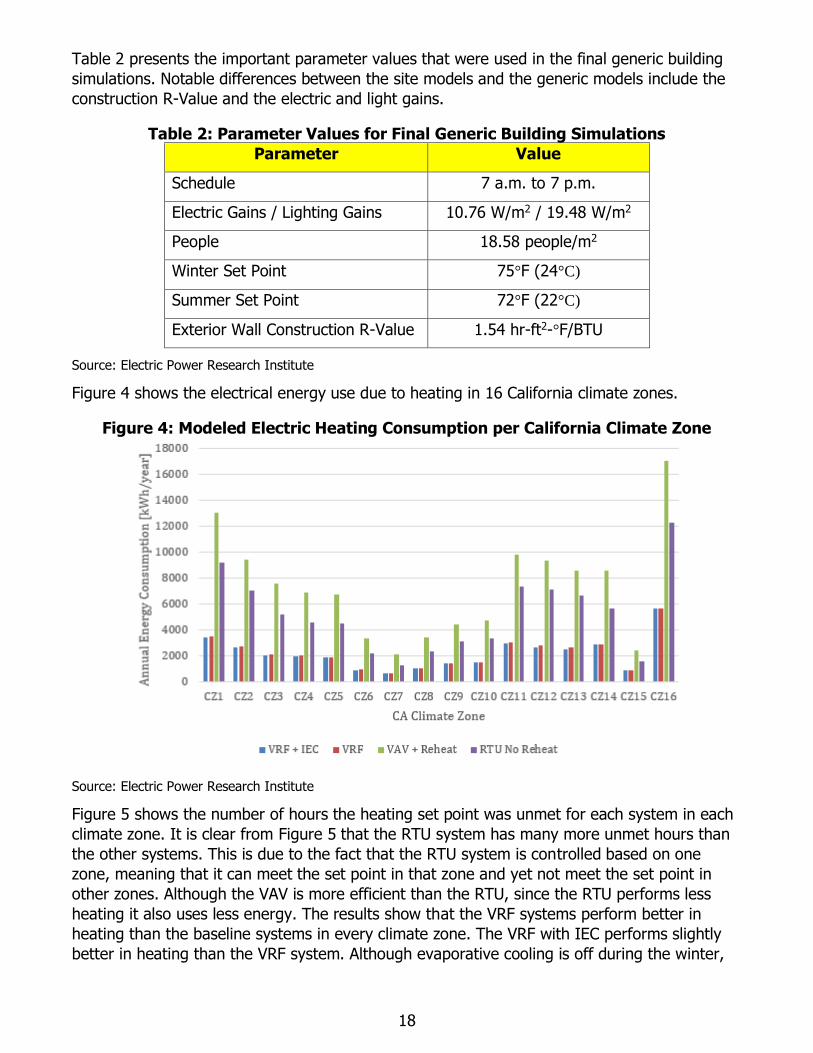
18
Table 2 presents the important parameter values that were used in the final generic building
simulations. Notable differences between the site models and the generic models include the
construction R-Value and the electric and light gains.
Table 2: Parameter Values for Final Generic Building Simulations
Parameter Value
Schedule 7 a.m. to 7 p.m.
Electric Gains / Lighting Gains 10.76 W/m2 / 19.48 W/m2
People 18.58 people/m2
Winter Set Point 75°F (24°C)
Summer Set Point 72°F (22°C)
Exterior Wall Construction R-Value 1.54 hr-ft2-°F/BTU
Source: Electric Power Research Institute
Figure 4 shows the electrical energy use due to heating in 16 California climate zones.
Figure 4: Modeled Electric Heating Consumption per California Climate Zone
Source: Electric Power Research Institute
Figure 5 shows the number of hours the heating set point was unmet for each system in each
climate zone. It is clear from Figure 5 that the RTU system has many more unmet hours than
the other systems. This is due to the fact that the RTU system is controlled based on one
zone, meaning that it can meet the set point in that zone and yet not meet the set point in
other zones. Although the VAV is more efficient than the RTU, since the RTU performs less
heating it also uses less energy. The results show that the VRF systems perform better in
heating than the baseline systems in every climate zone. The VRF with IEC performs slightly
better in heating than the VRF system. Although evaporative cooling is off during the winter,
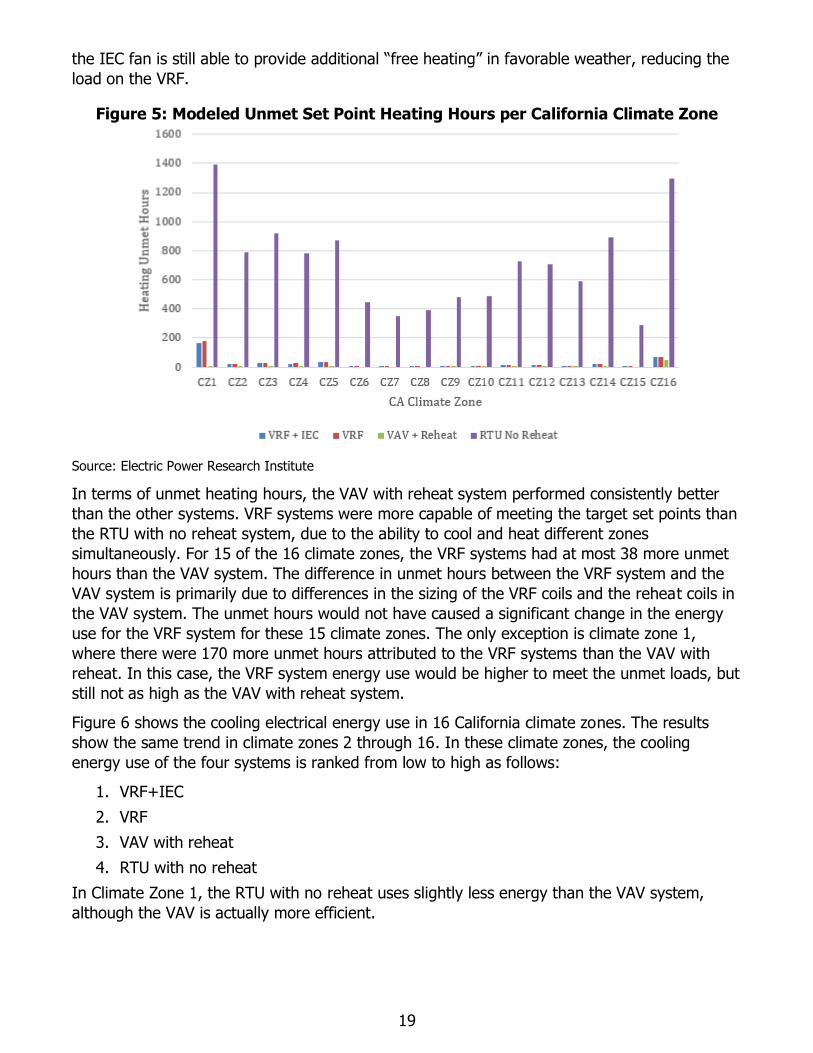
19
the IEC fan is still able to provide additional “free heating” in favorable weather, reducing the
load on the VRF.
Figure 5: Modeled Unmet Set Point Heating Hours per California Climate Zone
Source: Electric Power Research Institute
In terms of unmet heating hours, the VAV with reheat system performed consistently better
than the other systems. VRF systems were more capable of meeting the target set points than
the RTU with no reheat system, due to the ability to cool and heat different zones
simultaneously. For 15 of the 16 climate zones, the VRF systems had at most 38 more unmet
hours than the VAV system. The difference in unmet hours between the VRF system and the
VAV system is primarily due to differences in the sizing of the VRF coils and the reheat coils in
the VAV system. The unmet hours would not have caused a significant change in the energy
use for the VRF system for these 15 climate zones. The only exception is climate zone 1,
where there were 170 more unmet hours attributed to the VRF systems than the VAV with
reheat. In this case, the VRF system energy use would be higher to meet the unmet loads, but
still not as high as the VAV with reheat system.
Figure 6 shows the cooling electrical energy use in 16 California climate zones. The results
show the same trend in climate zones 2 through 16. In these climate zones, the cooling
energy use of the four systems is ranked from low to high as follows:
1. VRF+IEC
2. VRF
3. VAV with reheat
4. RTU with no reheat
In Climate Zone 1, the RTU with no reheat uses slightly less energy than the VAV system,
although the VAV is actually more efficient.
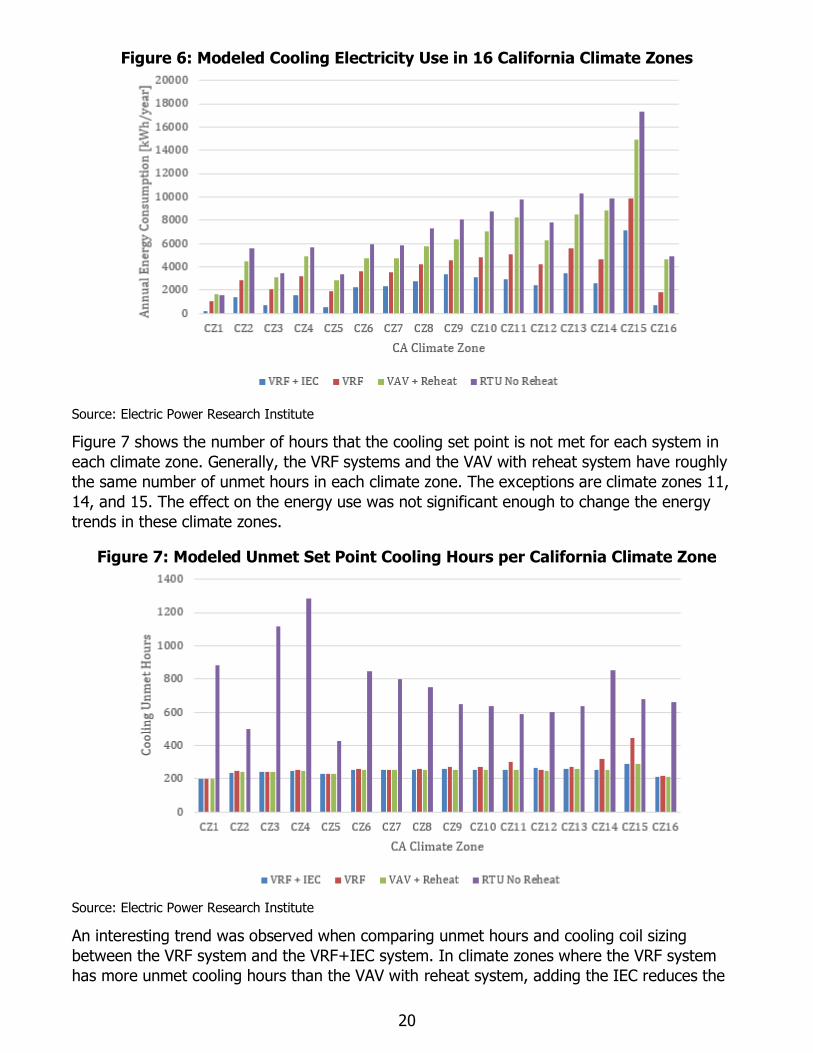
20
Figure 6: Modeled Cooling Electricity Use in 16 California Climate Zones
Source: Electric Power Research Institute
Figure 7 shows the number of hours that the cooling set point is not met for each system in
each climate zone. Generally, the VRF systems and the VAV with reheat system have roughly
the same number of unmet hours in each climate zone. The exceptions are climate zones 11,
14, and 15. The effect on the energy use was not significant enough to change the energy
trends in these climate zones.
Figure 7: Modeled Unmet Set Point Cooling Hours per California Climate Zone
Source: Electric Power Research Institute
An interesting trend was observed when comparing unmet hours and cooling coil sizing
between the VRF system and the VRF+IEC system. In climate zones where the VRF system
has more unmet cooling hours than the VAV with reheat system, adding the IEC reduces the
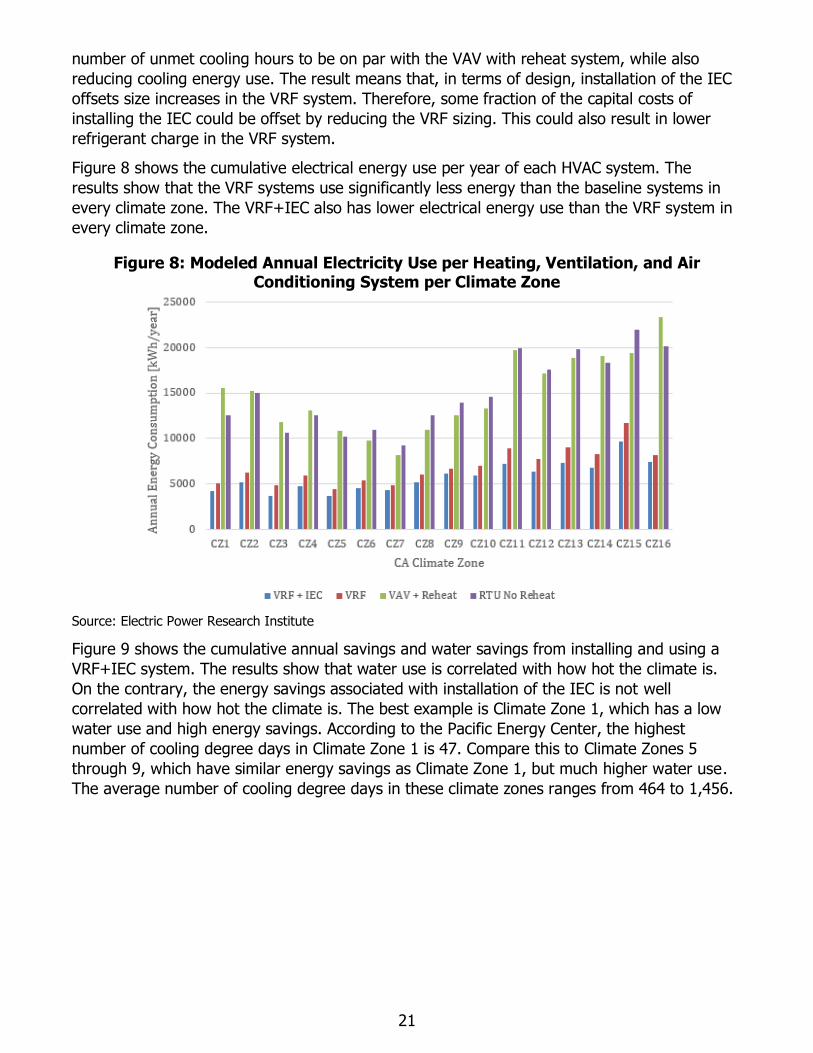
21
number of unmet cooling hours to be on par with the VAV with reheat system, while also
reducing cooling energy use. The result means that, in terms of design, installation of the IEC
offsets size increases in the VRF system. Therefore, some fraction of the capital costs of
installing the IEC could be offset by reducing the VRF sizing. This could also result in lower
refrigerant charge in the VRF system.
Figure 8 shows the cumulative electrical energy use per year of each HVAC system. The
results show that the VRF systems use significantly less energy than the baseline systems in
every climate zone. The VRF+IEC also has lower electrical energy use than the VRF system in
every climate zone.
Figure 8: Modeled Annual Electricity Use per Heating, Ventilation, and Air Conditioning System per Climate Zone
Source: Electric Power Research Institute
Figure 9 shows the cumulative annual savings and water savings from installing and using a
VRF+IEC system. The results show that water use is correlated with how hot the climate is.
On the contrary, the energy savings associated with installation of the IEC is not well
correlated with how hot the climate is. The best example is Climate Zone 1, which has a low
water use and high energy savings. According to the Pacific Energy Center, the highest
number of cooling degree days in Climate Zone 1 is 47. Compare this to Climate Zones 5
through 9, which have similar energy savings as Climate Zone 1, but much higher water use.
The average number of cooling degree days in these climate zones ranges from 464 to 1,456.
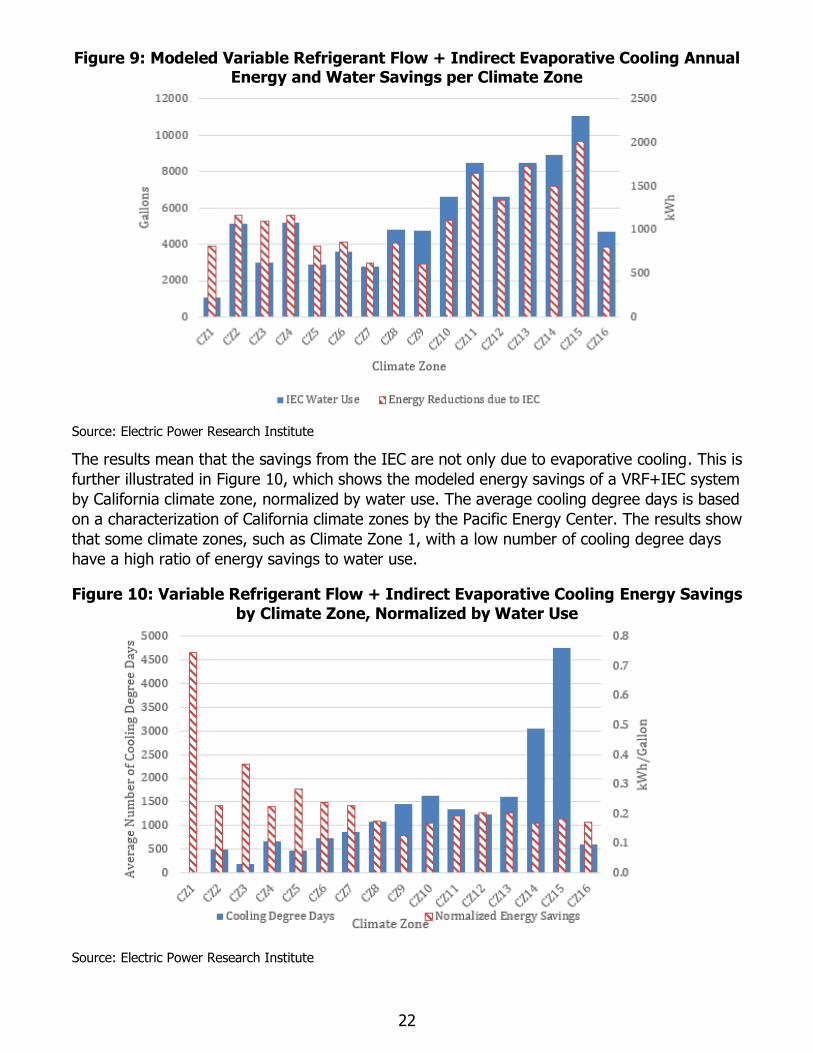
22
Figure 9: Modeled Variable Refrigerant Flow + Indirect Evaporative Cooling Annual Energy and Water Savings per Climate Zone
Source: Electric Power Research Institute
The results mean that the savings from the IEC are not only due to evaporative cooling. This is
further illustrated in Figure 10, which shows the modeled energy savings of a VRF+IEC system
by California climate zone, normalized by water use. The average cooling degree days is based
on a characterization of California climate zones by the Pacific Energy Center. The results show
that some climate zones, such as Climate Zone 1, with a low number of cooling degree days
have a high ratio of energy savings to water use.
Figure 10: Variable Refrigerant Flow + Indirect Evaporative Cooling Energy Savings
by Climate Zone, Normalized by Water Use
Source: Electric Power Research Institute
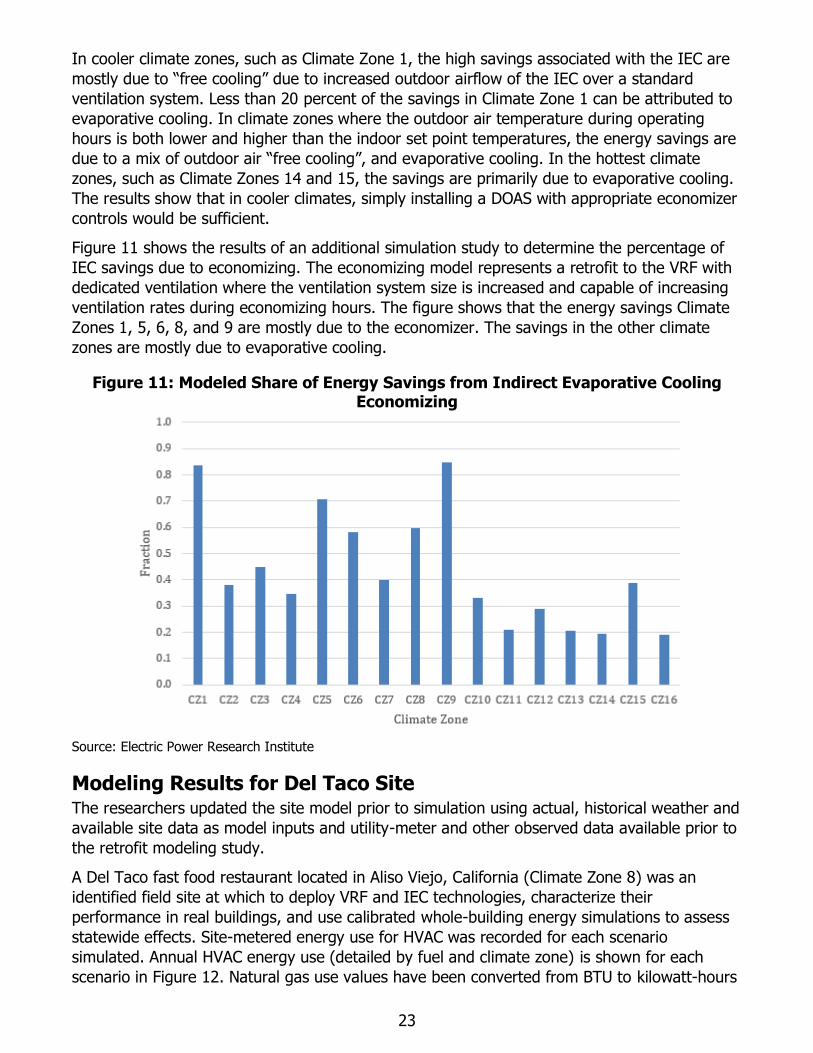
23
In cooler climate zones, such as Climate Zone 1, the high savings associated with the IEC are
mostly due to “free cooling” due to increased outdoor airflow of the IEC over a standard
ventilation system. Less than 20 percent of the savings in Climate Zone 1 can be attributed to
evaporative cooling. In climate zones where the outdoor air temperature during operating
hours is both lower and higher than the indoor set point temperatures, the energy savings are
due to a mix of outdoor air “free cooling”, and evaporative cooling. In the hottest climate
zones, such as Climate Zones 14 and 15, the savings are primarily due to evaporative cooling.
The results show that in cooler climates, simply installing a DOAS with appropriate economizer
controls would be sufficient.
Figure 11 shows the results of an additional simulation study to determine the percentage of
IEC savings due to economizing. The economizing model represents a retrofit to the VRF with
dedicated ventilation where the ventilation system size is increased and capable of increasing
ventilation rates during economizing hours. The figure shows that the energy savings Climate
Zones 1, 5, 6, 8, and 9 are mostly due to the economizer. The savings in the other climate
zones are mostly due to evaporative cooling.
Figure 11: Modeled Share of Energy Savings from Indirect Evaporative Cooling Economizing
Source: Electric Power Research Institute
Modeling Results for Del Taco Site The researchers updated the site model prior to simulation using actual, historical weather and
available site data as model inputs and utility-meter and other observed data available prior to
the retrofit modeling study.
A Del Taco fast food restaurant located in Aliso Viejo, California (Climate Zone 8) was an
identified field site at which to deploy VRF and IEC technologies, characterize their
performance in real buildings, and use calibrated whole-building energy simulations to assess
statewide effects. Site-metered energy use for HVAC was recorded for each scenario
simulated. Annual HVAC energy use (detailed by fuel and climate zone) is shown for each
scenario in Figure 12. Natural gas use values have been converted from BTU to kilowatt-hours
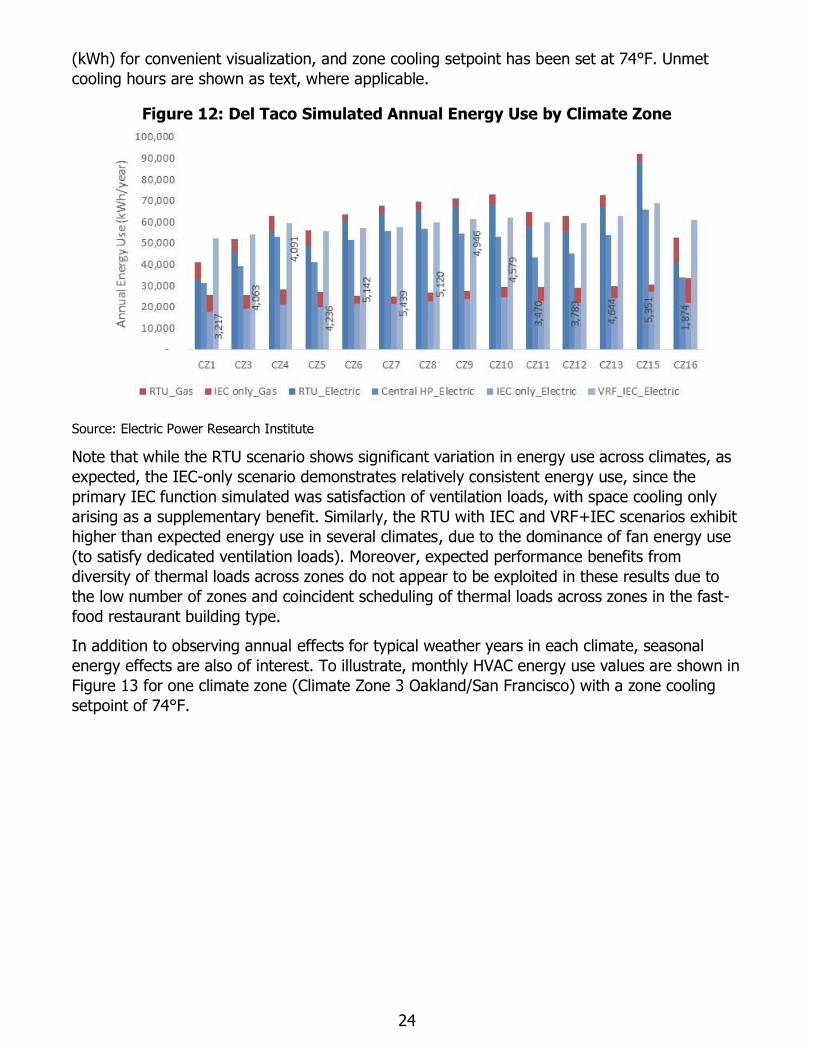
24
(kWh) for convenient visualization, and zone cooling setpoint has been set at 74°F. Unmet
cooling hours are shown as text, where applicable.
Figure 12: Del Taco Simulated Annual Energy Use by Climate Zone
Source: Electric Power Research Institute
Note that while the RTU scenario shows significant variation in energy use across climates, as
expected, the IEC-only scenario demonstrates relatively consistent energy use, since the
primary IEC function simulated was satisfaction of ventilation loads, with space cooling only
arising as a supplementary benefit. Similarly, the RTU with IEC and VRF+IEC scenarios exhibit
higher than expected energy use in several climates, due to the dominance of fan energy use
(to satisfy dedicated ventilation loads). Moreover, expected performance benefits from
diversity of thermal loads across zones do not appear to be exploited in these results due to
the low number of zones and coincident scheduling of thermal loads across zones in the fast-
food restaurant building type.
In addition to observing annual effects for typical weather years in each climate, seasonal
energy effects are also of interest. To illustrate, monthly HVAC energy use values are shown in
Figure 13 for one climate zone (Climate Zone 3 Oakland/San Francisco) with a zone cooling
setpoint of 74°F.
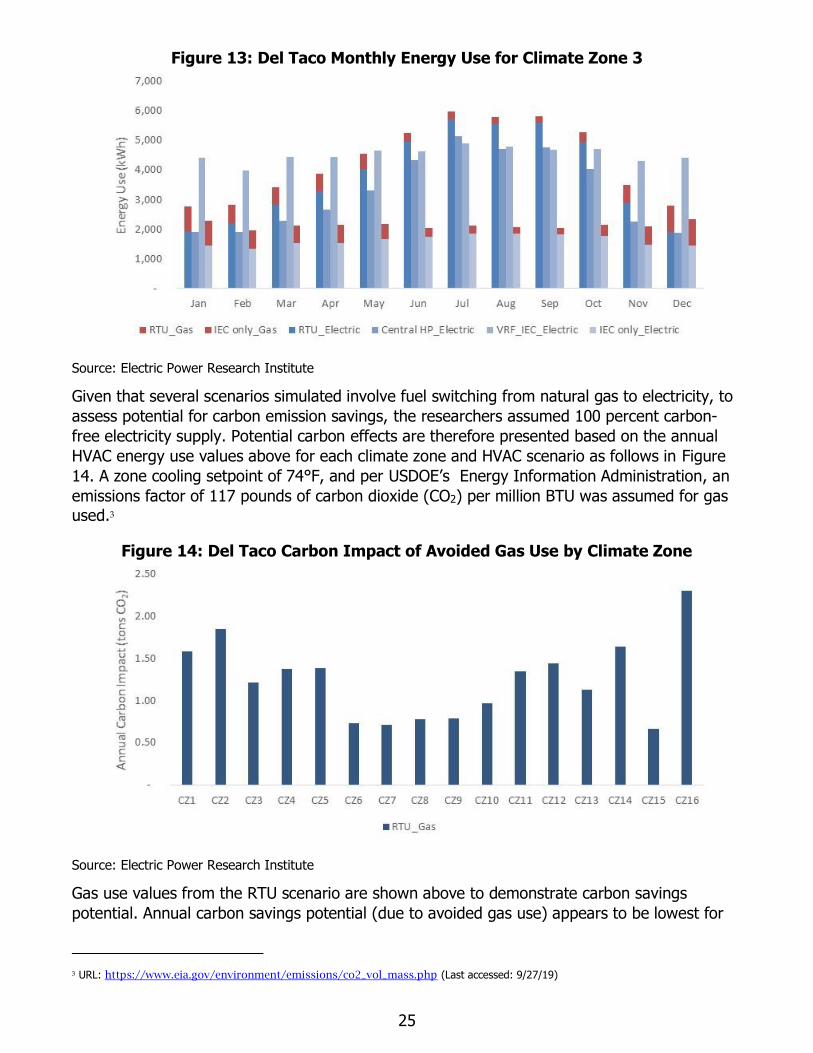
25
Figure 13: Del Taco Monthly Energy Use for Climate Zone 3
Source: Electric Power Research Institute
Given that several scenarios simulated involve fuel switching from natural gas to electricity, to
assess potential for carbon emission savings, the researchers assumed 100 percent carbon-
free electricity supply. Potential carbon effects are therefore presented based on the annual
HVAC energy use values above for each climate zone and HVAC scenario as follows in Figure
14. A zone cooling setpoint of 74°F, and per USDOE’s Energy Information Administration, an
emissions factor of 117 pounds of carbon dioxide (CO2) per million BTU was assumed for gas
used.3
Figure 14: Del Taco Carbon Impact of Avoided Gas Use by Climate Zone
Source: Electric Power Research Institute
Gas use values from the RTU scenario are shown above to demonstrate carbon savings
potential. Annual carbon savings potential (due to avoided gas use) appears to be lowest for
3 URL: https://www.eia.gov/environment/emissions/co2_vol_mass.php (Last accessed: 9/27/19)
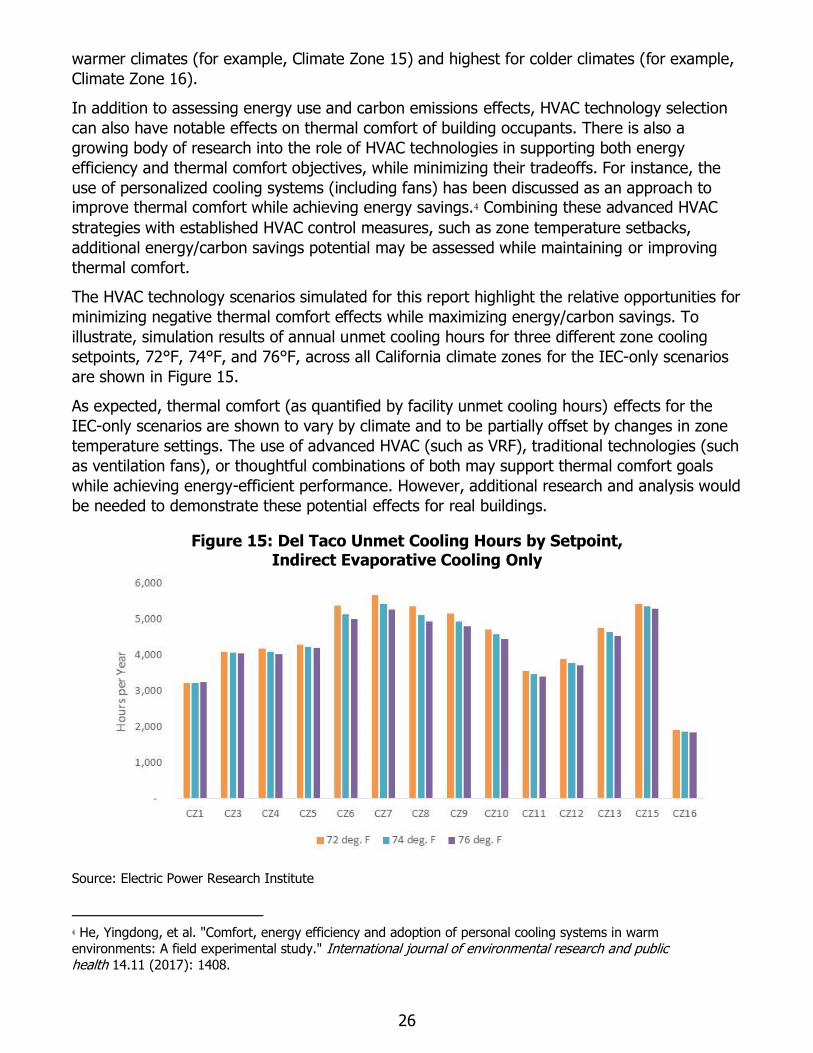
26
warmer climates (for example, Climate Zone 15) and highest for colder climates (for example,
Climate Zone 16).
In addition to assessing energy use and carbon emissions effects, HVAC technology selection
can also have notable effects on thermal comfort of building occupants. There is also a
growing body of research into the role of HVAC technologies in supporting both energy
efficiency and thermal comfort objectives, while minimizing their tradeoffs. For instance, the
use of personalized cooling systems (including fans) has been discussed as an approach to
improve thermal comfort while achieving energy savings.4 Combining these advanced HVAC
strategies with established HVAC control measures, such as zone temperature setbacks,
additional energy/carbon savings potential may be assessed while maintaining or improving
thermal comfort.
The HVAC technology scenarios simulated for this report highlight the relative opportunities for
minimizing negative thermal comfort effects while maximizing energy/carbon savings. To
illustrate, simulation results of annual unmet cooling hours for three different zone cooling
setpoints, 72°F, 74°F, and 76°F, across all California climate zones for the IEC-only scenarios
are shown in Figure 15.
As expected, thermal comfort (as quantified by facility unmet cooling hours) effects for the
IEC-only scenarios are shown to vary by climate and to be partially offset by changes in zone
temperature settings. The use of advanced HVAC (such as VRF), traditional technologies (such
as ventilation fans), or thoughtful combinations of both may support thermal comfort goals
while achieving energy-efficient performance. However, additional research and analysis would
be needed to demonstrate these potential effects for real buildings.
Figure 15: Del Taco Unmet Cooling Hours by Setpoint, Indirect Evaporative Cooling Only
Source: Electric Power Research Institute
4 He, Yingdong, et al. "Comfort, energy efficiency and adoption of personal cooling systems in warm
environments: A field experimental study." International journal of environmental research and public health 14.11 (2017): 1408.
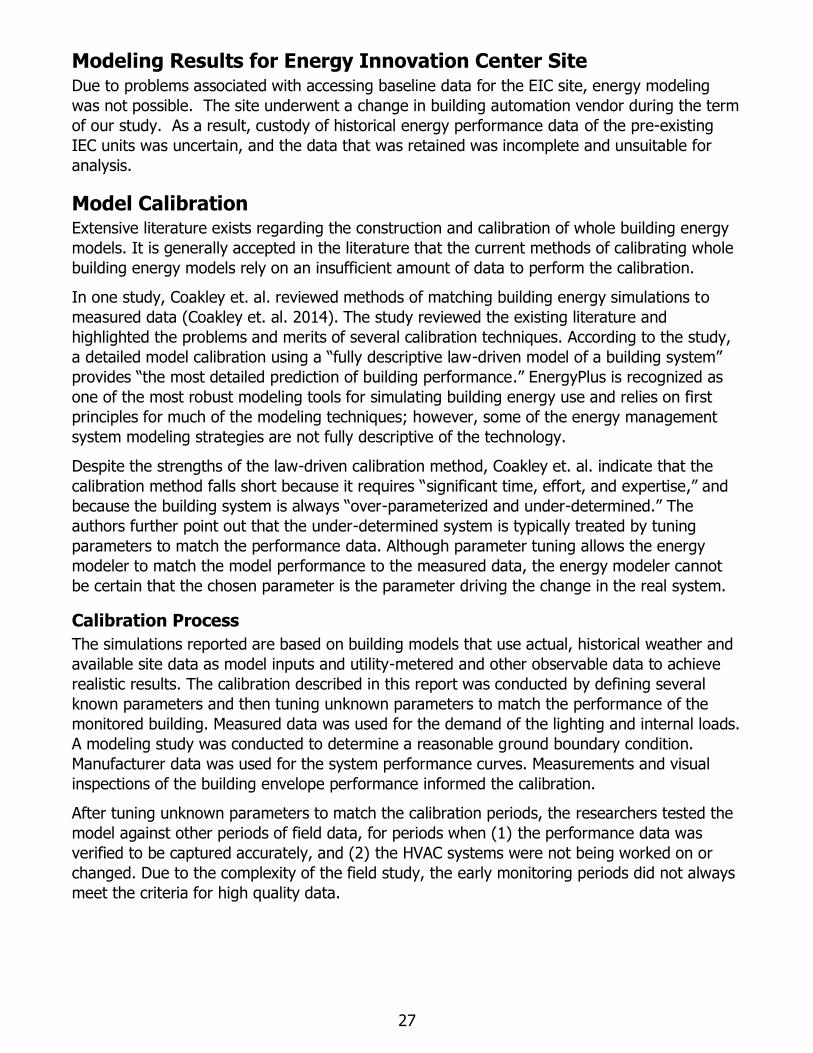
27
Modeling Results for Energy Innovation Center Site Due to problems associated with accessing baseline data for the EIC site, energy modeling
was not possible. The site underwent a change in building automation vendor during the term
of our study. As a result, custody of historical energy performance data of the pre-existing
IEC units was uncertain, and the data that was retained was incomplete and unsuitable for
analysis.
Model Calibration Extensive literature exists regarding the construction and calibration of whole building energy
models. It is generally accepted in the literature that the current methods of calibrating whole
building energy models rely on an insufficient amount of data to perform the calibration.
In one study, Coakley et. al. reviewed methods of matching building energy simulations to
measured data (Coakley et. al. 2014). The study reviewed the existing literature and
highlighted the problems and merits of several calibration techniques. According to the study,
a detailed model calibration using a “fully descriptive law-driven model of a building system”
provides “the most detailed prediction of building performance.” EnergyPlus is recognized as
one of the most robust modeling tools for simulating building energy use and relies on first
principles for much of the modeling techniques; however, some of the energy management
system modeling strategies are not fully descriptive of the technology.
Despite the strengths of the law-driven calibration method, Coakley et. al. indicate that the
calibration method falls short because it requires “significant time, effort, and expertise,” and
because the building system is always “over-parameterized and under-determined.” The
authors further point out that the under-determined system is typically treated by tuning
parameters to match the performance data. Although parameter tuning allows the energy
modeler to match the model performance to the measured data, the energy modeler cannot
be certain that the chosen parameter is the parameter driving the change in the real system.
Calibration Process
The simulations reported are based on building models that use actual, historical weather and
available site data as model inputs and utility-metered and other observable data to achieve
realistic results. The calibration described in this report was conducted by defining several
known parameters and then tuning unknown parameters to match the performance of the
monitored building. Measured data was used for the demand of the lighting and internal loads.
A modeling study was conducted to determine a reasonable ground boundary condition.
Manufacturer data was used for the system performance curves. Measurements and visual
inspections of the building envelope performance informed the calibration.
After tuning unknown parameters to match the calibration periods, the researchers tested the
model against other periods of field data, for periods when (1) the performance data was
verified to be captured accurately, and (2) the HVAC systems were not being worked on or
changed. Due to the complexity of the field study, the early monitoring periods did not always
meet the criteria for high quality data.
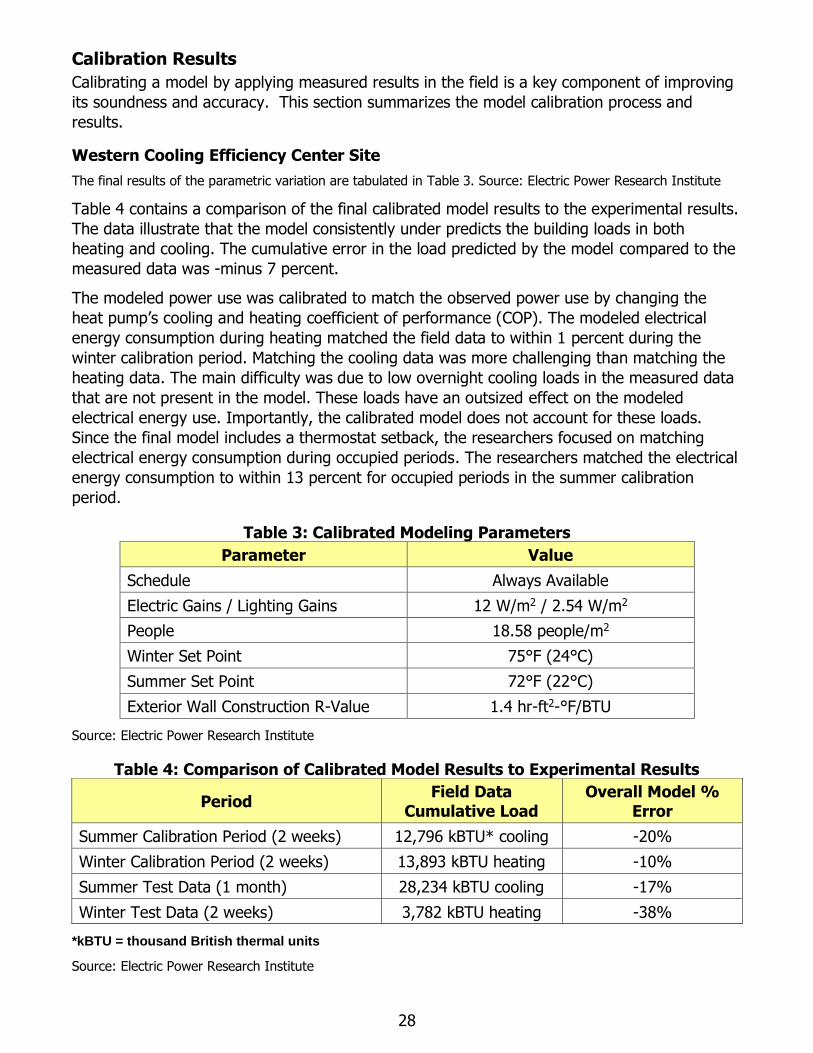
28
Calibration Results
Calibrating a model by applying measured results in the field is a key component of improving
its soundness and accuracy. This section summarizes the model calibration process and
results.
Western Cooling Efficiency Center Site
The final results of the parametric variation are tabulated in Table 3. Source: Electric Power Research Institute
Table 4 contains a comparison of the final calibrated model results to the experimental results.
The data illustrate that the model consistently under predicts the building loads in both
heating and cooling. The cumulative error in the load predicted by the model compared to the
measured data was -minus 7 percent.
The modeled power use was calibrated to match the observed power use by changing the
heat pump’s cooling and heating coefficient of performance (COP). The modeled electrical
energy consumption during heating matched the field data to within 1 percent during the
winter calibration period. Matching the cooling data was more challenging than matching the
heating data. The main difficulty was due to low overnight cooling loads in the measured data
that are not present in the model. These loads have an outsized effect on the modeled
electrical energy use. Importantly, the calibrated model does not account for these loads.
Since the final model includes a thermostat setback, the researchers focused on matching
electrical energy consumption during occupied periods. The researchers matched the electrical
energy consumption to within 13 percent for occupied periods in the summer calibration
period.
Table 3: Calibrated Modeling Parameters
Parameter Value
Schedule Always Available
Electric Gains / Lighting Gains 12 W/m2 / 2.54 W/m2
People 18.58 people/m2
Winter Set Point 75°F (24°C)
Summer Set Point 72°F (22°C)
Exterior Wall Construction R-Value 1.4 hr-ft2-°F/BTU
Source: Electric Power Research Institute
Table 4: Comparison of Calibrated Model Results to Experimental Results
Period Field Data
Cumulative Load
Overall Model %
Error
Summer Calibration Period (2 weeks) 12,796 kBTU* cooling -20%
Winter Calibration Period (2 weeks) 13,893 kBTU heating -10%
Summer Test Data (1 month) 28,234 kBTU cooling -17%
Winter Test Data (2 weeks) 3,782 kBTU heating -38%
*kBTU = thousand British thermal units
Source: Electric Power Research Institute
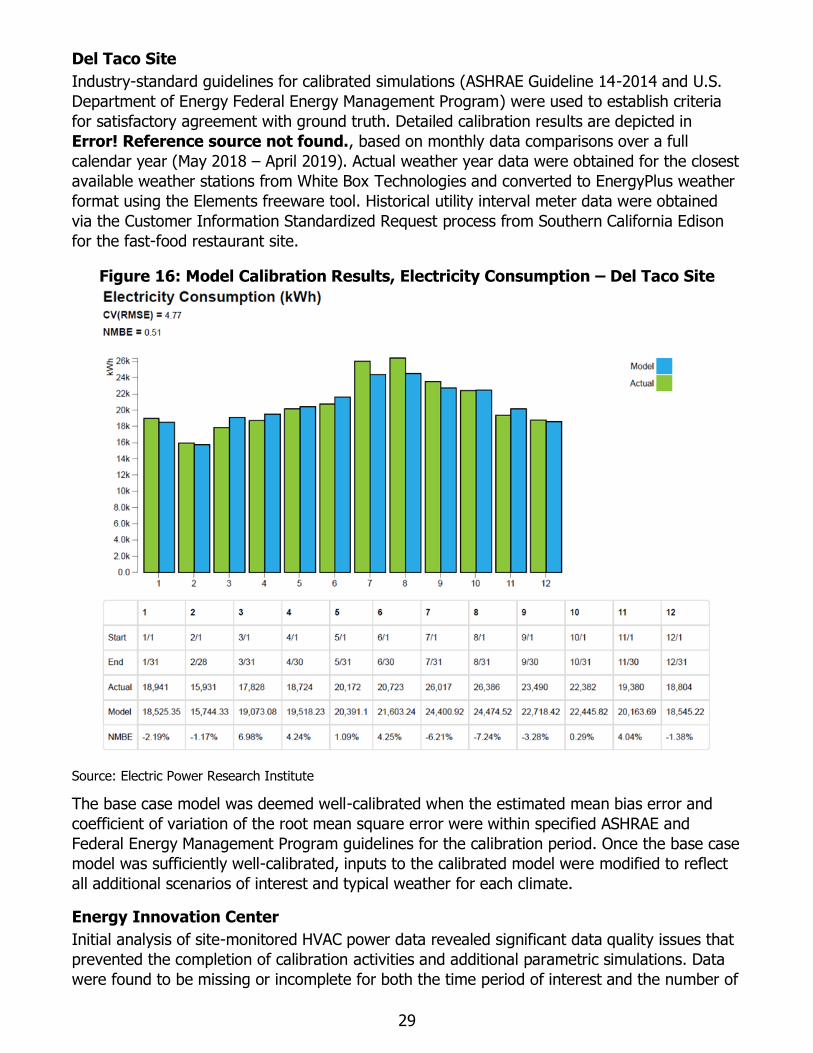
29
Del Taco Site
Industry-standard guidelines for calibrated simulations (ASHRAE Guideline 14-2014 and U.S.
Department of Energy Federal Energy Management Program) were used to establish criteria
for satisfactory agreement with ground truth. Detailed calibration results are depicted in
Error! Reference source not found., based on monthly data comparisons over a full
calendar year (May 2018 – April 2019). Actual weather year data were obtained for the closest
available weather stations from White Box Technologies and converted to EnergyPlus weather
format using the Elements freeware tool. Historical utility interval meter data were obtained
via the Customer Information Standardized Request process from Southern California Edison
for the fast-food restaurant site.
Figure 16: Model Calibration Results, Electricity Consumption – Del Taco Site
Source: Electric Power Research Institute
The base case model was deemed well-calibrated when the estimated mean bias error and
coefficient of variation of the root mean square error were within specified ASHRAE and
Federal Energy Management Program guidelines for the calibration period. Once the base case
model was sufficiently well-calibrated, inputs to the calibrated model were modified to reflect
all additional scenarios of interest and typical weather for each climate.
Energy Innovation Center
Initial analysis of site-monitored HVAC power data revealed significant data quality issues that
prevented the completion of calibration activities and additional parametric simulations. Data
were found to be missing or incomplete for both the time period of interest and the number of
30
HVAC systems of interest. As such, modeled HVAC use significantly exceeded the monitored
HVAC use.
Improving Future Modeling of Integrated Variable Refrigerant Flow+Indirect Evaporative Cooling Systems EnergyPlus is a robust whole-building energy modeling program; however, throughout the
course of this project several gaps in its capabilities were identified that affected the building
modeling efforts. Gaps in the objects available in EnergyPlus were identified in several
categories including ducting, ventilation, evaporative cooling, VRF systems, calibration tools,
and runtime errors.
Ducting
The objects for modeling air distribution ducting are flexible and allow for simulation of duct
leakage and thermal losses. One aspect of the air distribution objects that often fails to be
representative of reality is that any zone that has a supply air inlet must also have a return air
outlet. Many real buildings have air distribution systems with a single centrally located return
and several branches of ducts that distribute the supply air throughout the building. In these
buildings, air must flow from the zones with supply inlets to the zone(s) with return outlets.
Requiring a supply inlet and return outlet in each zone simplifies calculations but fails to
capture the effects that the flow of transfer air between zones has on building performance.
Ventilation
• Supply ventilation: EnergyPlus has no built-in objects that support positive pressure
ventilation systems.
• Exhaust ventilation: Although it is possible to simulate negative pressure ventilation
systems in EnergyPlus using the “AirflowNetwork” objects, these objects cannot be
simultaneously simulated with an air-loop or any other objects that incorporate a fan.
• Balanced ventilation: The majority of objects in EnergyPlus are compatible with a widely
implemented pseudo-balanced ventilation system. It is “pseudo” because only a single
fan is used to exhaust return air and supply outdoor in equal quantities Modeling a
ventilation system as pseudo-balanced may introduce acceptable error.
Evaporative Cooling
The version of EnergyPlus that was used to complete the modeling efforts in this project
included objects for modeling direct, indirect, and indirect-direct evaporative coolers. These
objects could only serve one zone and could not be incorporated into an air loop or air
distribution system. As a workaround, “EnergyManagementSystem” objects, which allow
insertion of user-defined programs into EnergyPlus, were used to simulate the evaporative
cooling equipment in multizone air loops. Recent updates to EnergyPlus have addressed this
shortcoming, and evaporative cooling equipment can now be modeled in multizone air loops
without any custom programs.
Variable Refrigerant Flow
Significant discrepancies between manufacturer-rated and actual VRF performance,
attributable to differences in manufacturer-specific system controls, have been observed and
reported. Such discrepancies may manifest as calibration errors or prediction errors between
31
simulated outputs and observed performance, undermining the validity of underlying building
models.
When actual VRF performance is unknown or uncertain, the modeler has a limited set of actual
performance data from similar or related systems on which to rely. Platforms such as the
National Renewable Energy Laboratory’s (NREL’s) Building Component Library
(https://bcl.nrel.gov/) and modeling forums such as Unmet Hours
(https://unmethours.com/questions/) could be used to alert modelers to best-practice
guidance, EnergyPlus components, and additional measures that better reflect real-world
performance of rapidly evolving HVAC technologies such as VRF. As of the time of writing, only
one example of a real-world VRF system (Daikin’s REQY series) is available on NREL’s Building
Component Library site. NREL has conceded that “VRF systems have improved rapidly in the
last few years, and researchers need to update the curves, especially for low-temperature
operation.”
Moreover, objects for modeling VRF systems are included in EnergyPlus; however, only
ductless cassettes are supported and objects for modeling ducted indoor fan coils are not
included. The control strategy implemented in these objects is rigid and cannot be
reconfigured to match the behavior of many commercially available VRF systems.
Calibration Tools
Existing calibration tools/techniques for EnergyPlus currently require use of OpenStudio
reporting measures or the OpenStudio Parametric Analysis Tool. However, for certain HVAC
application scenarios that still cannot be accurately modeled in OpenStudio (for example,
certain energy management system controls measures) such tools cannot be used, limiting the
scope for model improvements. Enabling a modeling workflow that allows for seamless
importation of EnergyPlus input (.idf) files for use in OpenStudio would expand the possibilities
and ease of model calibration to ground truth and real building performance.
Runtime Errors
There are simulation runtime errors that occur when VRF measures such as the “ZEDG VRF
with DOAS” and “NZEHVAC” from NREL’s Building Component Library are applied to
EnergyPlus models with energy management system controls (such as those present in the
VRF+IEC model described above). This issue limits the ease of modifying existing models with
site-specific HVAC controls to simulate more advanced HVAC systems such as VRF. This is a
known issue and is reportedly to be resolved by NREL.
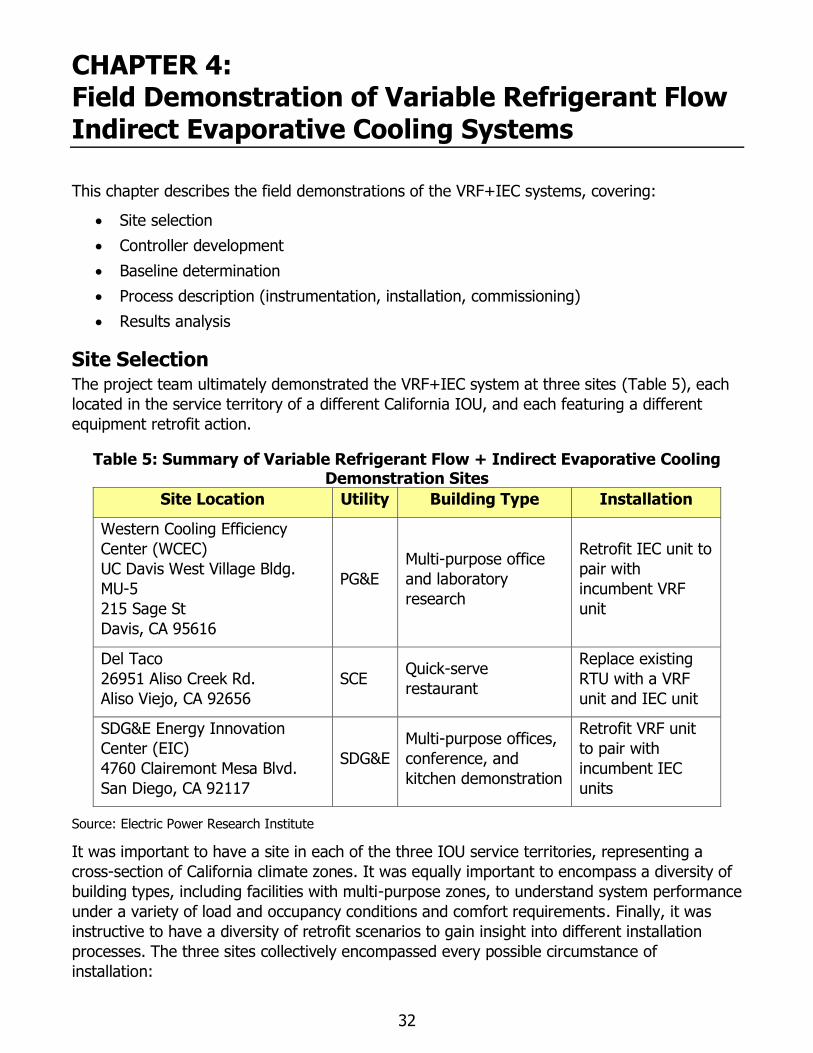
32
CHAPTER 4: Field Demonstration of Variable Refrigerant Flow Indirect Evaporative Cooling Systems
This chapter describes the field demonstrations of the VRF+IEC systems, covering:
• Site selection
• Controller development
• Baseline determination
• Process description (instrumentation, installation, commissioning)
• Results analysis
Site Selection The project team ultimately demonstrated the VRF+IEC system at three sites (Table 5), each
located in the service territory of a different California IOU, and each featuring a different
equipment retrofit action.
Table 5: Summary of Variable Refrigerant Flow + Indirect Evaporative Cooling Demonstration Sites
Site Location Utility Building Type Installation
Western Cooling Efficiency
Center (WCEC)
UC Davis West Village Bldg.
MU-5
215 Sage St
Davis, CA 95616
PG&E
Multi-purpose office
and laboratory
research
Retrofit IEC unit to
pair with
incumbent VRF
unit
Del Taco
26951 Aliso Creek Rd.
Aliso Viejo, CA 92656
SCE Quick-serve
restaurant
Replace existing
RTU with a VRF
unit and IEC unit
SDG&E Energy Innovation
Center (EIC)
4760 Clairemont Mesa Blvd.
San Diego, CA 92117
SDG&E
Multi-purpose offices,
conference, and
kitchen demonstration
Retrofit VRF unit
to pair with
incumbent IEC
units
Source: Electric Power Research Institute
It was important to have a site in each of the three IOU service territories, representing a
cross-section of California climate zones. It was equally important to encompass a diversity of
building types, including facilities with multi-purpose zones, to understand system performance
under a variety of load and occupancy conditions and comfort requirements. Finally, it was
instructive to have a diversity of retrofit scenarios to gain insight into different installation
processes. The three sites collectively encompassed every possible circumstance of
installation:
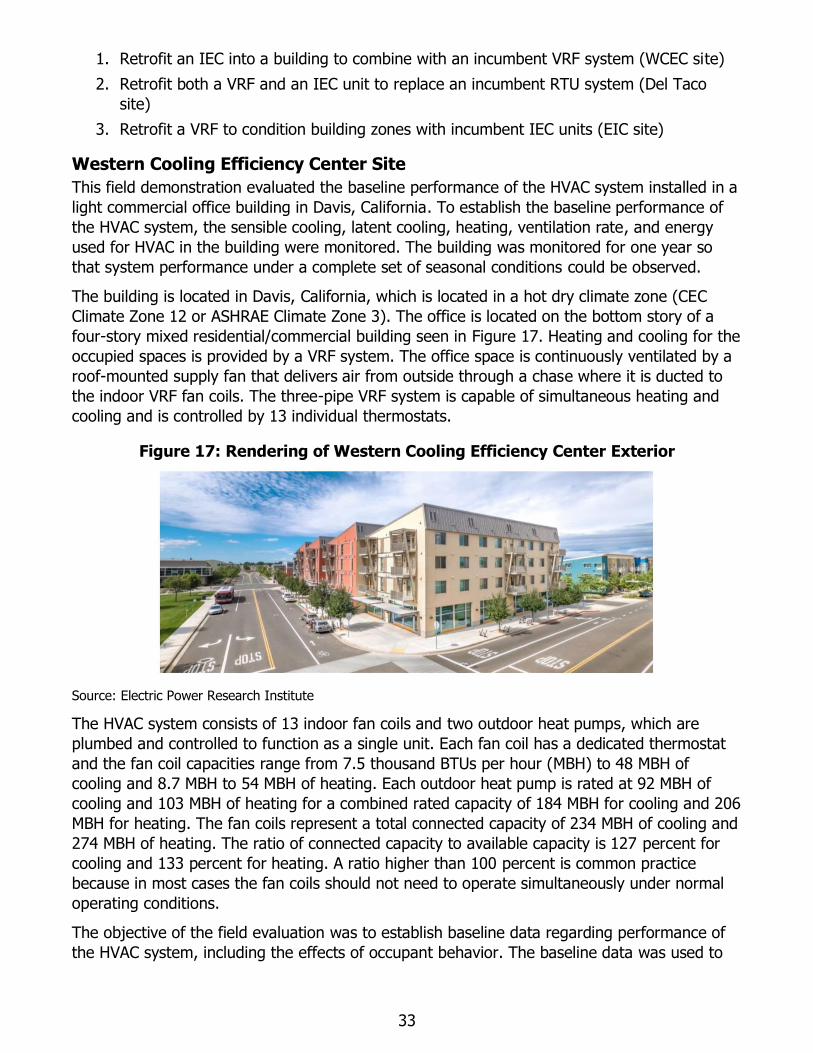
33
1. Retrofit an IEC into a building to combine with an incumbent VRF system (WCEC site)
2. Retrofit both a VRF and an IEC unit to replace an incumbent RTU system (Del Taco
site)
3. Retrofit a VRF to condition building zones with incumbent IEC units (EIC site)
Western Cooling Efficiency Center Site
This field demonstration evaluated the baseline performance of the HVAC system installed in a
light commercial office building in Davis, California. To establish the baseline performance of
the HVAC system, the sensible cooling, latent cooling, heating, ventilation rate, and energy
used for HVAC in the building were monitored. The building was monitored for one year so
that system performance under a complete set of seasonal conditions could be observed.
The building is located in Davis, California, which is located in a hot dry climate zone (CEC
Climate Zone 12 or ASHRAE Climate Zone 3). The office is located on the bottom story of a
four-story mixed residential/commercial building seen in Figure 17. Heating and cooling for the
occupied spaces is provided by a VRF system. The office space is continuously ventilated by a
roof-mounted supply fan that delivers air from outside through a chase where it is ducted to
the indoor VRF fan coils. The three-pipe VRF system is capable of simultaneous heating and
cooling and is controlled by 13 individual thermostats.
Figure 17: Rendering of Western Cooling Efficiency Center Exterior
Source: Electric Power Research Institute
The HVAC system consists of 13 indoor fan coils and two outdoor heat pumps, which are
plumbed and controlled to function as a single unit. Each fan coil has a dedicated thermostat
and the fan coil capacities range from 7.5 thousand BTUs per hour (MBH) to 48 MBH of
cooling and 8.7 MBH to 54 MBH of heating. Each outdoor heat pump is rated at 92 MBH of
cooling and 103 MBH of heating for a combined rated capacity of 184 MBH for cooling and 206
MBH for heating. The fan coils represent a total connected capacity of 234 MBH of cooling and
274 MBH of heating. The ratio of connected capacity to available capacity is 127 percent for
cooling and 133 percent for heating. A ratio higher than 100 percent is common practice
because in most cases the fan coils should not need to operate simultaneously under normal
operating conditions.
The objective of the field evaluation was to establish baseline data regarding performance of
the HVAC system, including the effects of occupant behavior. The baseline data was used to
34
validate an EnergyPlusTM model of the bottom story of the building, which assisted in the
development of improved control algorithms for VRF systems with integrated ventilation.
Upon the conclusion of the baseline monitoring, the demonstration site was retrofitted with a
DOAS with an indirect evaporative cooler. A new control system based on the modeling results
was implemented to integrate the DOAS, IEC, and VRF systems in a way that optimized
performance. Monitoring continued for an additional year to evaluate the performance of the
DOAS, IEC, and new control scheme.
Del Taco Site
One of the commercial building segments identified as a viable candidate for a hybrid
VRF+IEC system was fast food, or quick-serve, restaurants, based on the following attributes:
• Two major conditioning zones — the kitchen area and the customer dining area — each
with its unique loading conditions and setpoint requirements for comfort
• High ventilation requirements
• Peak times of operation on a daily and weekly basis
The hybrid VRF+IEC system lent itself well to these building attributes, since it offered
individual zonal control, high ventilation with IEC as a DOAS system, and the ability to switch
to VRF operation during periods of high cooling demand.
Del Taco is a nationwide operator and franchisor of quick-serve restaurants across 15 states
concentrated in the Pacific-Southwest region, with 372 of its 596 locations in California.
Through a relationship with the HVAC contractor that services Del Taco’s locations in Orange
County, the project team identified a Del Taco restaurant in Aliso Viejo, California, whose
HVAC equipment was due for a retrofit or upgrade and was therefore a prime candidate for
demonstrating the VRF+IEC system.
This Del Taco location is a single-story building with an indoor space measuring 1,894 square
feet (Figure 18). The majority of space (and cooling needs) are taken up by the dining room
and kitchen. Each of these areas had an independent, 7½-ton York HVAC unit previously
installed in 2014. There is also a small, back-office area next to the kitchen, which was
originally served by a 3½-ton HVAC unit. Del Taco desired to have these units replaced.
Original (incumbent) Del Taco HVAC unit models were:
• York model ZXG12D2B1AA1A111A1 nominal 7½-ton gas electric unit
• York model ZXG08D2B3AA1A111A2 nominal 7½-ton gas electric unit
• York model ZXG12D2B1AA1A111A2 nominal 3½-ton gas electric unit
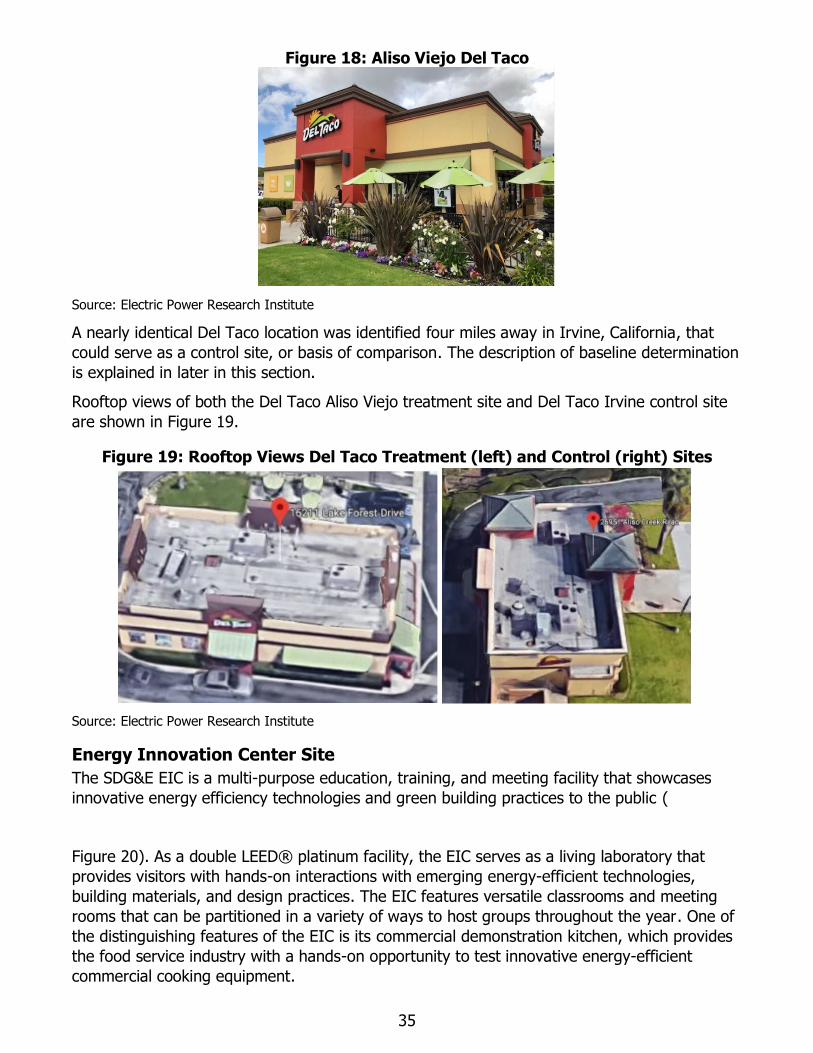
35
Figure 18: Aliso Viejo Del Taco
Source: Electric Power Research Institute
A nearly identical Del Taco location was identified four miles away in Irvine, California, that
could serve as a control site, or basis of comparison. The description of baseline determination
is explained in later in this section.
Rooftop views of both the Del Taco Aliso Viejo treatment site and Del Taco Irvine control site
are shown in Figure 19.
Figure 19: Rooftop Views Del Taco Treatment (left) and Control (right) Sites
Source: Electric Power Research Institute
Energy Innovation Center Site
The SDG&E EIC is a multi-purpose education, training, and meeting facility that showcases
innovative energy efficiency technologies and green building practices to the public (
Figure 20). As a double LEED® platinum facility, the EIC serves as a living laboratory that
provides visitors with hands-on interactions with emerging energy-efficient technologies,
building materials, and design practices. The EIC features versatile classrooms and meeting
rooms that can be partitioned in a variety of ways to host groups throughout the year. One of
the distinguishing features of the EIC is its commercial demonstration kitchen, which provides
the food service industry with a hands-on opportunity to test innovative energy-efficient
commercial cooking equipment.
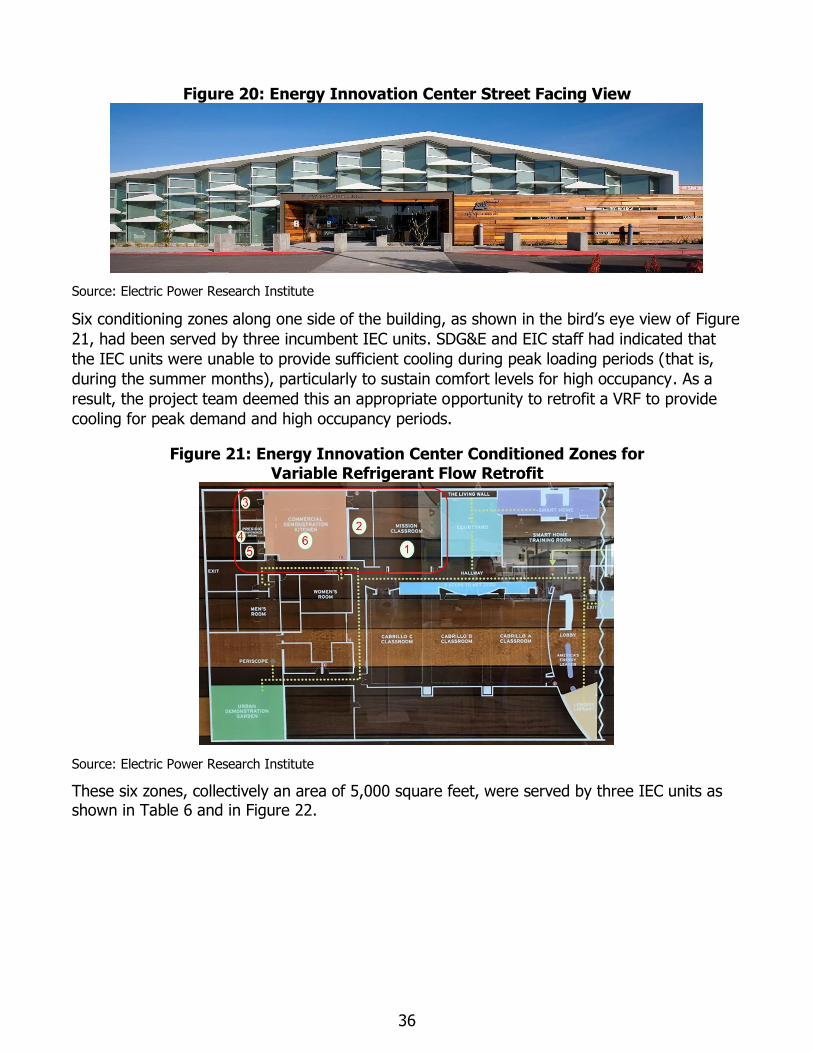
36
Figure 20: Energy Innovation Center Street Facing View
Source: Electric Power Research Institute
Six conditioning zones along one side of the building, as shown in the bird’s eye view of Figure
21, had been served by three incumbent IEC units. SDG&E and EIC staff had indicated that
the IEC units were unable to provide sufficient cooling during peak loading periods (that is,
during the summer months), particularly to sustain comfort levels for high occupancy. As a
result, the project team deemed this an appropriate opportunity to retrofit a VRF to provide
cooling for peak demand and high occupancy periods.
Figure 21: Energy Innovation Center Conditioned Zones for
Variable Refrigerant Flow Retrofit
Source: Electric Power Research Institute
These six zones, collectively an area of 5,000 square feet, were served by three IEC units as shown in Table 6 and in Figure 22.
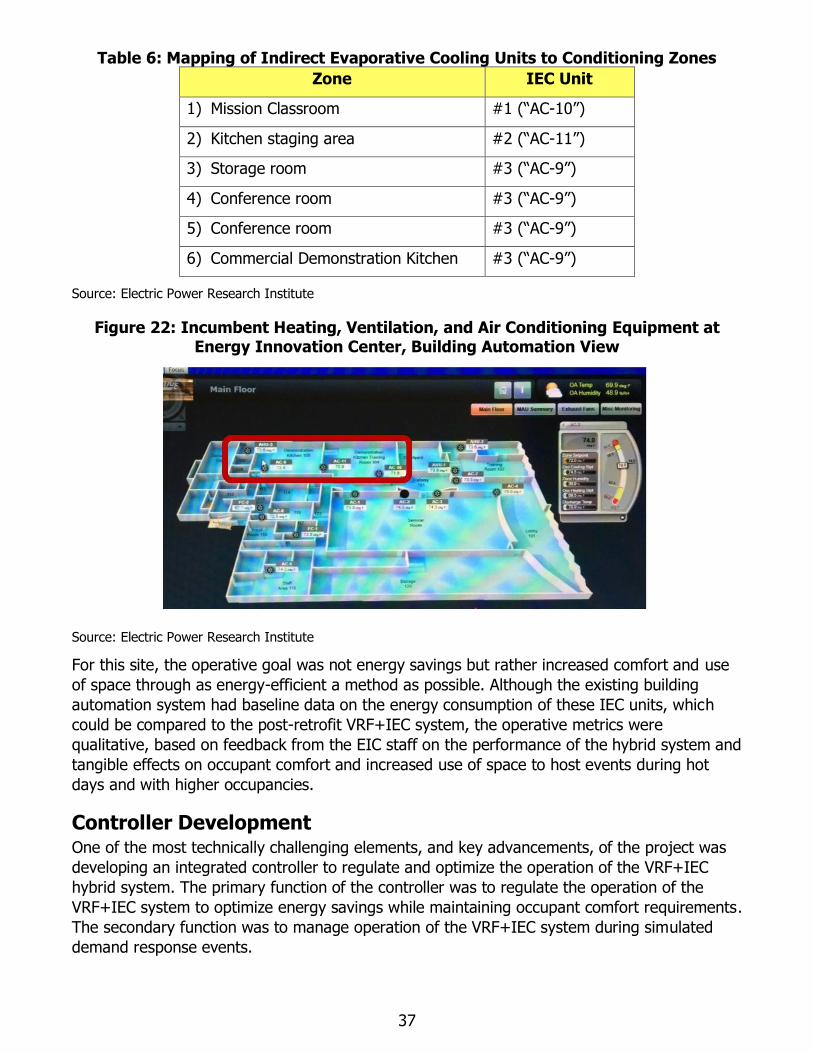
37
Table 6: Mapping of Indirect Evaporative Cooling Units to Conditioning Zones
Zone IEC Unit
1) Mission Classroom #1 (“AC-10”)
2) Kitchen staging area #2 (“AC-11”)
3) Storage room #3 (“AC-9”)
4) Conference room #3 (“AC-9”)
5) Conference room #3 (“AC-9”)
6) Commercial Demonstration Kitchen #3 (“AC-9”)
Source: Electric Power Research Institute
Figure 22: Incumbent Heating, Ventilation, and Air Conditioning Equipment at Energy Innovation Center, Building Automation View
Source: Electric Power Research Institute
For this site, the operative goal was not energy savings but rather increased comfort and use
of space through as energy-efficient a method as possible. Although the existing building
automation system had baseline data on the energy consumption of these IEC units, which
could be compared to the post-retrofit VRF+IEC system, the operative metrics were
qualitative, based on feedback from the EIC staff on the performance of the hybrid system and
tangible effects on occupant comfort and increased use of space to host events during hot
days and with higher occupancies.
Controller Development One of the most technically challenging elements, and key advancements, of the project was
developing an integrated controller to regulate and optimize the operation of the VRF+IEC
hybrid system. The primary function of the controller was to regulate the operation of the
VRF+IEC system to optimize energy savings while maintaining occupant comfort requirements.
The secondary function was to manage operation of the VRF+IEC system during simulated
demand response events.
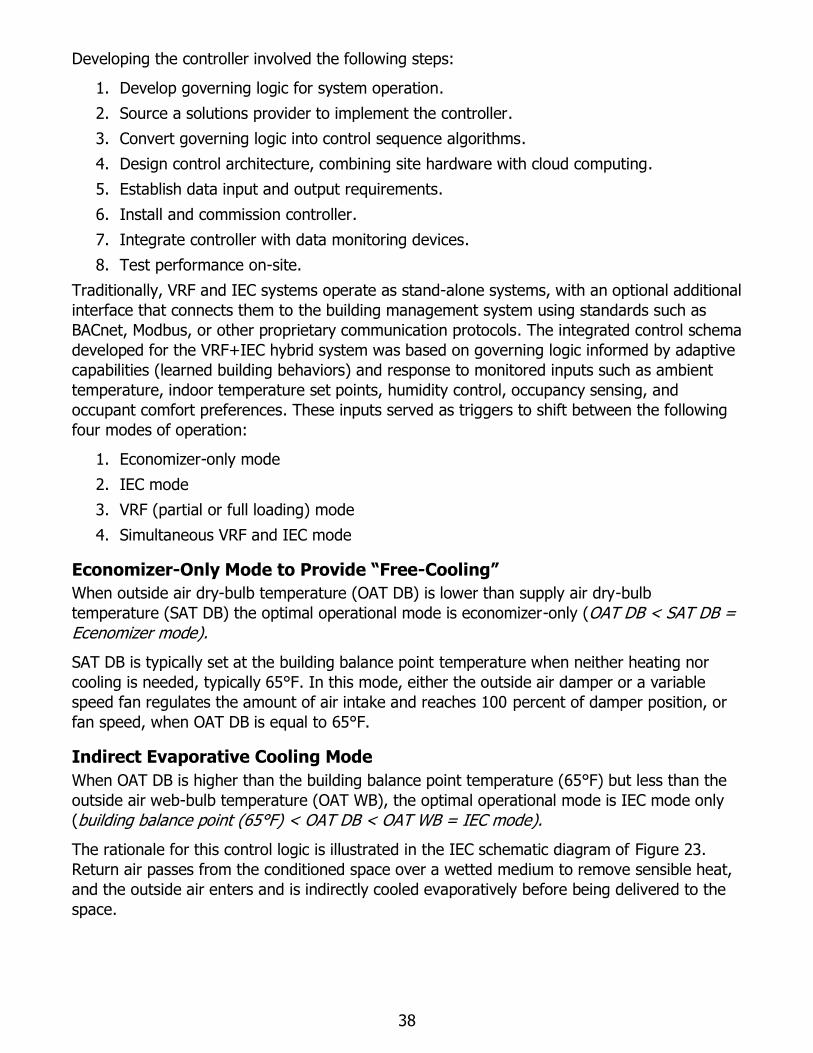
38
Developing the controller involved the following steps:
1. Develop governing logic for system operation.
2. Source a solutions provider to implement the controller.
3. Convert governing logic into control sequence algorithms.
4. Design control architecture, combining site hardware with cloud computing.
5. Establish data input and output requirements.
6. Install and commission controller.
7. Integrate controller with data monitoring devices.
8. Test performance on-site.
Traditionally, VRF and IEC systems operate as stand-alone systems, with an optional additional
interface that connects them to the building management system using standards such as
BACnet, Modbus, or other proprietary communication protocols. The integrated control schema
developed for the VRF+IEC hybrid system was based on governing logic informed by adaptive
capabilities (learned building behaviors) and response to monitored inputs such as ambient
temperature, indoor temperature set points, humidity control, occupancy sensing, and
occupant comfort preferences. These inputs served as triggers to shift between the following
four modes of operation:
1. Economizer-only mode
2. IEC mode
3. VRF (partial or full loading) mode
4. Simultaneous VRF and IEC mode
Economizer-Only Mode to Provide “Free-Cooling”
When outside air dry-bulb temperature (OAT DB) is lower than supply air dry-bulb
temperature (SAT DB) the optimal operational mode is economizer-only (OAT DB < SAT DB = Ecenomizer mode).
SAT DB is typically set at the building balance point temperature when neither heating nor
cooling is needed, typically 65°F. In this mode, either the outside air damper or a variable
speed fan regulates the amount of air intake and reaches 100 percent of damper position, or
fan speed, when OAT DB is equal to 65°F.
Indirect Evaporative Cooling Mode
When OAT DB is higher than the building balance point temperature (65°F) but less than the
outside air web-bulb temperature (OAT WB), the optimal operational mode is IEC mode only
(building balance point (65°F) < OAT DB < OAT WB = IEC mode).
The rationale for this control logic is illustrated in the IEC schematic diagram of Figure 23.
Return air passes from the conditioned space over a wetted medium to remove sensible heat,
and the outside air enters and is indirectly cooled evaporatively before being delivered to the
space.
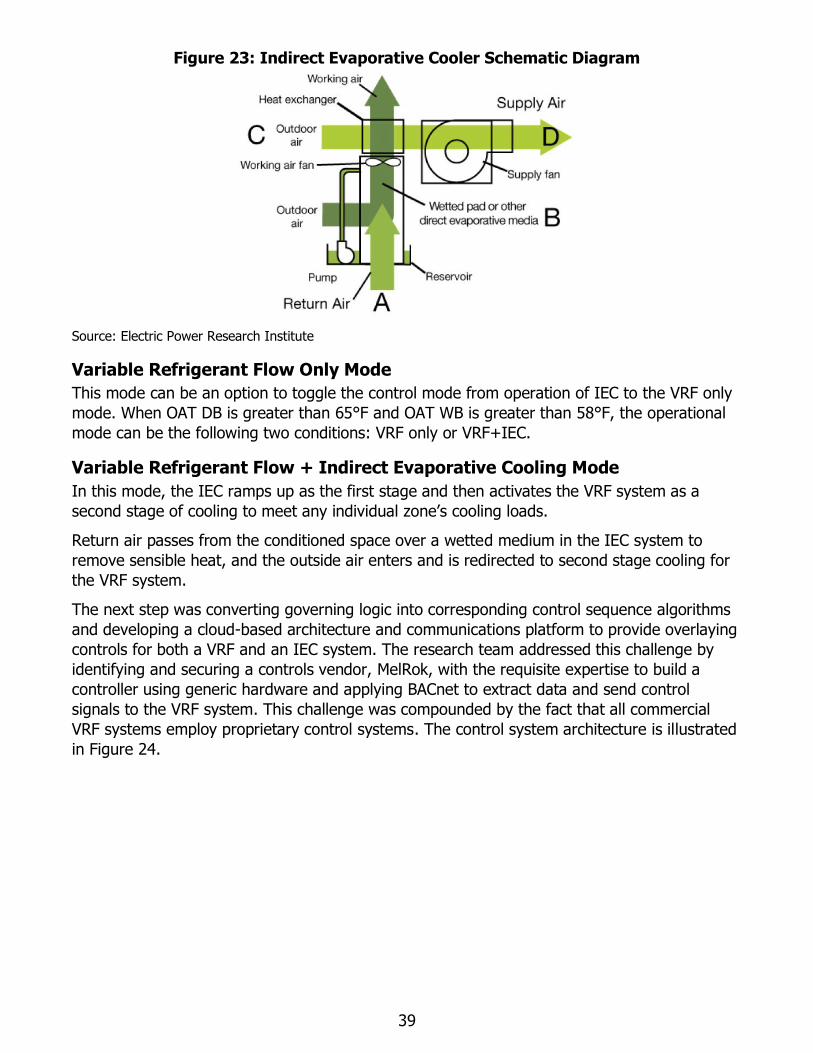
39
Figure 23: Indirect Evaporative Cooler Schematic Diagram
Source: Electric Power Research Institute
Variable Refrigerant Flow Only Mode
This mode can be an option to toggle the control mode from operation of IEC to the VRF only
mode. When OAT DB is greater than 65°F and OAT WB is greater than 58°F, the operational
mode can be the following two conditions: VRF only or VRF+IEC.
Variable Refrigerant Flow + Indirect Evaporative Cooling Mode
In this mode, the IEC ramps up as the first stage and then activates the VRF system as a
second stage of cooling to meet any individual zone’s cooling loads.
Return air passes from the conditioned space over a wetted medium in the IEC system to
remove sensible heat, and the outside air enters and is redirected to second stage cooling for
the VRF system.
The next step was converting governing logic into corresponding control sequence algorithms
and developing a cloud-based architecture and communications platform to provide overlaying
controls for both a VRF and an IEC system. The research team addressed this challenge by
identifying and securing a controls vendor, MelRok, with the requisite expertise to build a
controller using generic hardware and applying BACnet to extract data and send control
signals to the VRF system. This challenge was compounded by the fact that all commercial
VRF systems employ proprietary control systems. The control system architecture is illustrated
in Figure 24.
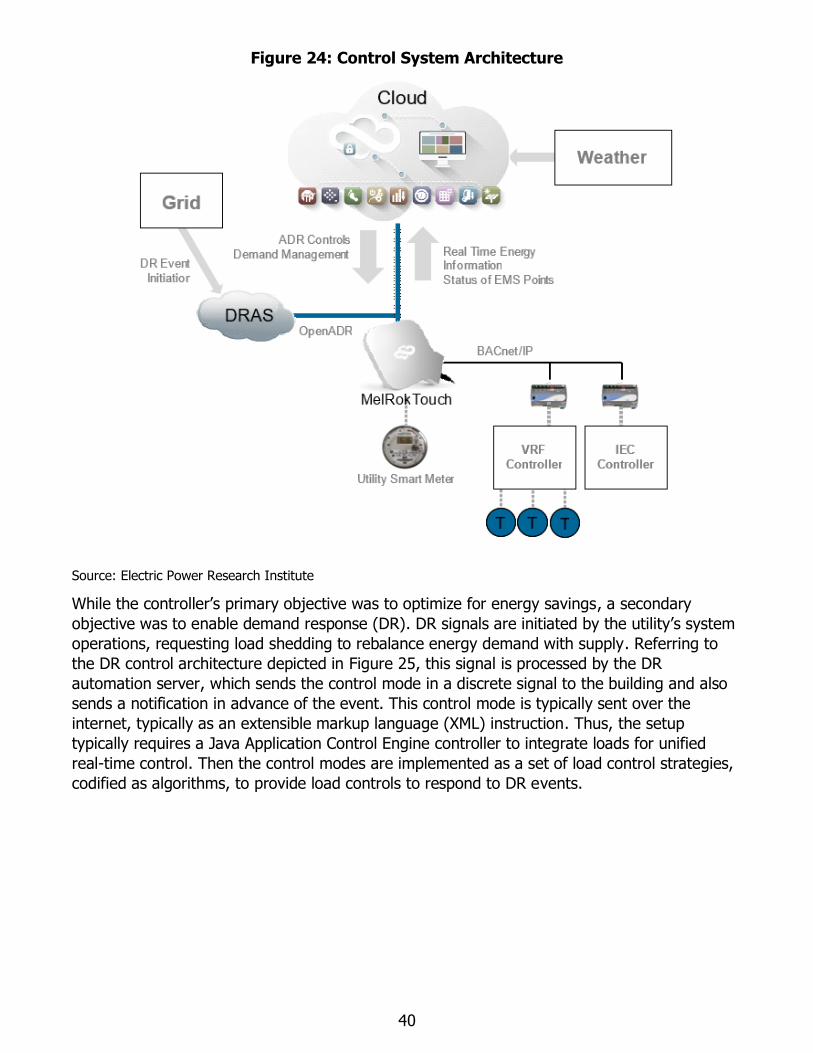
40
Figure 24: Control System Architecture
Source: Electric Power Research Institute
While the controller’s primary objective was to optimize for energy savings, a secondary
objective was to enable demand response (DR). DR signals are initiated by the utility’s system
operations, requesting load shedding to rebalance energy demand with supply. Referring to
the DR control architecture depicted in Figure 25, this signal is processed by the DR
automation server, which sends the control mode in a discrete signal to the building and also
sends a notification in advance of the event. This control mode is typically sent over the
internet, typically as an extensible markup language (XML) instruction. Thus, the setup
typically requires a Java Application Control Engine controller to integrate loads for unified
real-time control. Then the control modes are implemented as a set of load control strategies,
codified as algorithms, to provide load controls to respond to DR events.
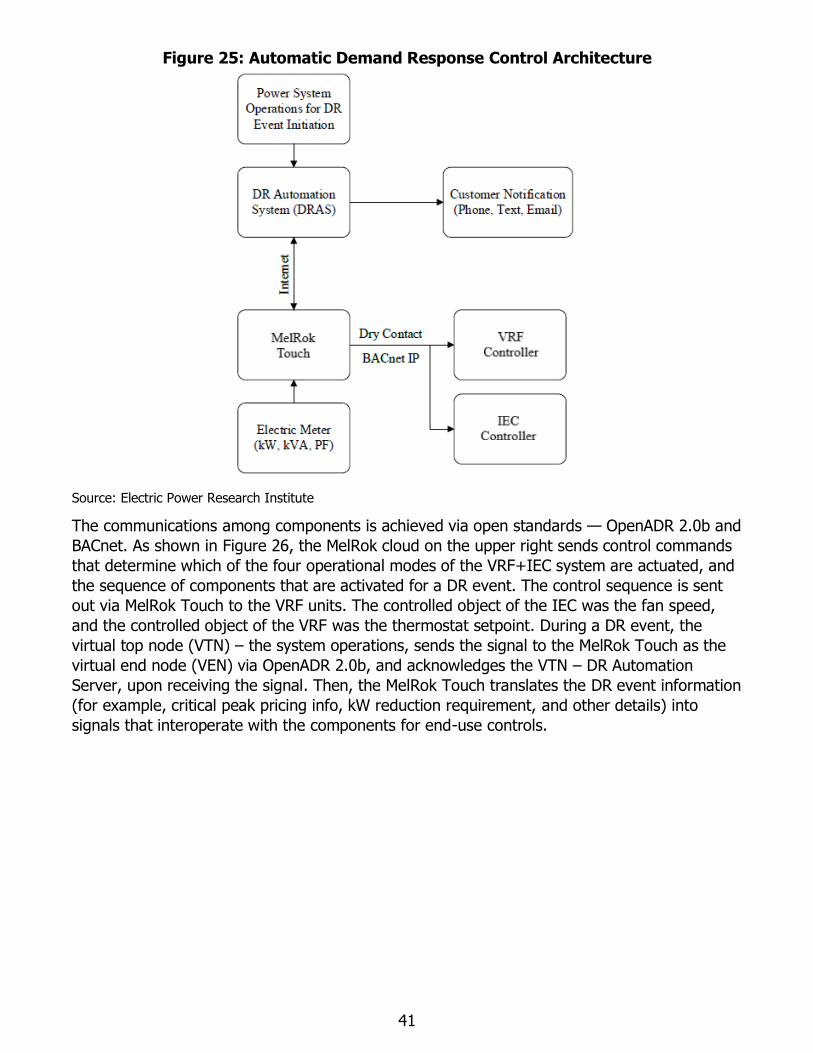
41
Figure 25: Automatic Demand Response Control Architecture
Source: Electric Power Research Institute
The communications among components is achieved via open standards — OpenADR 2.0b and
BACnet. As shown in Figure 26, the MelRok cloud on the upper right sends control commands
that determine which of the four operational modes of the VRF+IEC system are actuated, and
the sequence of components that are activated for a DR event. The control sequence is sent
out via MelRok Touch to the VRF units. The controlled object of the IEC was the fan speed,
and the controlled object of the VRF was the thermostat setpoint. During a DR event, the
virtual top node (VTN) – the system operations, sends the signal to the MelRok Touch as the
virtual end node (VEN) via OpenADR 2.0b, and acknowledges the VTN – DR Automation
Server, upon receiving the signal. Then, the MelRok Touch translates the DR event information
(for example, critical peak pricing info, kW reduction requirement, and other details) into
signals that interoperate with the components for end-use controls.
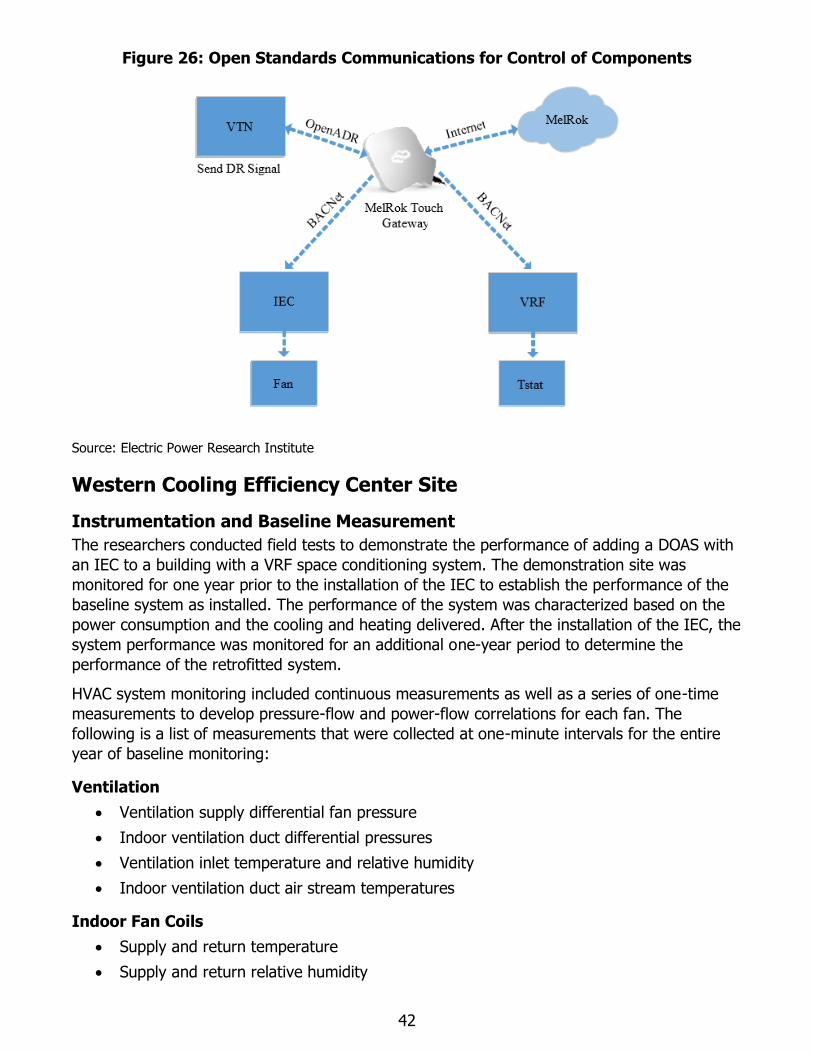
42
Figure 26: Open Standards Communications for Control of Components
Source: Electric Power Research Institute
Western Cooling Efficiency Center Site
Instrumentation and Baseline Measurement
The researchers conducted field tests to demonstrate the performance of adding a DOAS with
an IEC to a building with a VRF space conditioning system. The demonstration site was
monitored for one year prior to the installation of the IEC to establish the performance of the
baseline system as installed. The performance of the system was characterized based on the
power consumption and the cooling and heating delivered. After the installation of the IEC, the
system performance was monitored for an additional one-year period to determine the
performance of the retrofitted system.
HVAC system monitoring included continuous measurements as well as a series of one-time
measurements to develop pressure-flow and power-flow correlations for each fan. The
following is a list of measurements that were collected at one-minute intervals for the entire
year of baseline monitoring:
Ventilation
• Ventilation supply differential fan pressure
• Indoor ventilation duct differential pressures
• Ventilation inlet temperature and relative humidity
• Indoor ventilation duct air stream temperatures
Indoor Fan Coils
• Supply and return temperature
• Supply and return relative humidity
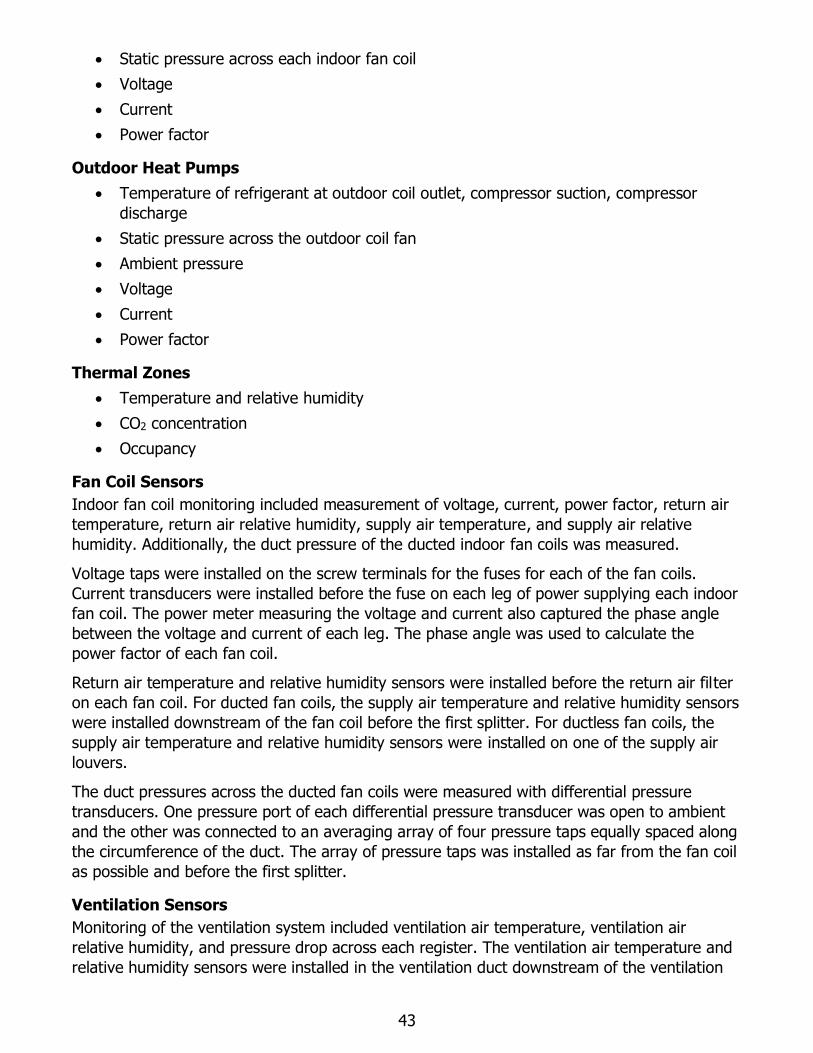
43
• Static pressure across each indoor fan coil
• Voltage
• Current
• Power factor
Outdoor Heat Pumps
• Temperature of refrigerant at outdoor coil outlet, compressor suction, compressor
discharge
• Static pressure across the outdoor coil fan
• Ambient pressure
• Voltage
• Current
• Power factor
Thermal Zones
• Temperature and relative humidity
• CO2 concentration
• Occupancy
Fan Coil Sensors
Indoor fan coil monitoring included measurement of voltage, current, power factor, return air
temperature, return air relative humidity, supply air temperature, and supply air relative
humidity. Additionally, the duct pressure of the ducted indoor fan coils was measured.
Voltage taps were installed on the screw terminals for the fuses for each of the fan coils.
Current transducers were installed before the fuse on each leg of power supplying each indoor
fan coil. The power meter measuring the voltage and current also captured the phase angle
between the voltage and current of each leg. The phase angle was used to calculate the
power factor of each fan coil.
Return air temperature and relative humidity sensors were installed before the return air filter
on each fan coil. For ducted fan coils, the supply air temperature and relative humidity sensors
were installed downstream of the fan coil before the first splitter. For ductless fan coils, the
supply air temperature and relative humidity sensors were installed on one of the supply air
louvers.
The duct pressures across the ducted fan coils were measured with differential pressure
transducers. One pressure port of each differential pressure transducer was open to ambient
and the other was connected to an averaging array of four pressure taps equally spaced along
the circumference of the duct. The array of pressure taps was installed as far from the fan coil
as possible and before the first splitter.
Ventilation Sensors
Monitoring of the ventilation system included ventilation air temperature, ventilation air
relative humidity, and pressure drop across each register. The ventilation air temperature and
relative humidity sensors were installed in the ventilation duct downstream of the ventilation
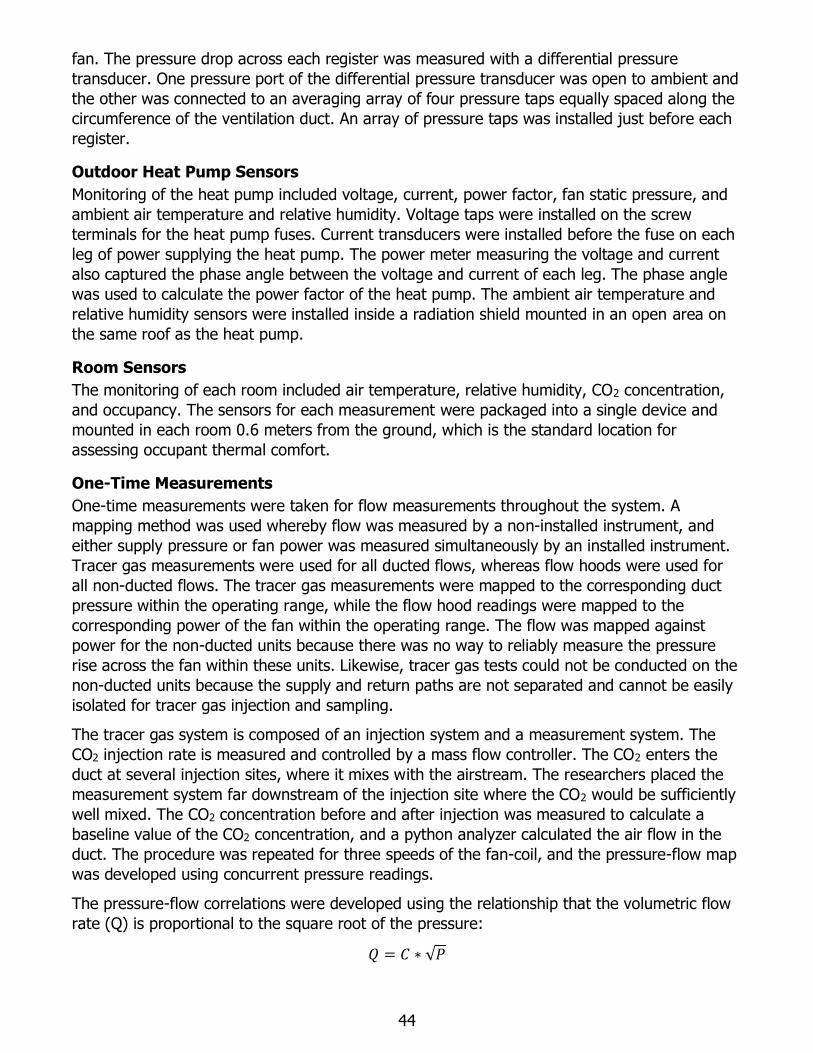
44
fan. The pressure drop across each register was measured with a differential pressure
transducer. One pressure port of the differential pressure transducer was open to ambient and
the other was connected to an averaging array of four pressure taps equally spaced along the
circumference of the ventilation duct. An array of pressure taps was installed just before each
register.
Outdoor Heat Pump Sensors
Monitoring of the heat pump included voltage, current, power factor, fan static pressure, and
ambient air temperature and relative humidity. Voltage taps were installed on the screw
terminals for the heat pump fuses. Current transducers were installed before the fuse on each
leg of power supplying the heat pump. The power meter measuring the voltage and current
also captured the phase angle between the voltage and current of each leg. The phase angle
was used to calculate the power factor of the heat pump. The ambient air temperature and
relative humidity sensors were installed inside a radiation shield mounted in an open area on
the same roof as the heat pump.
Room Sensors
The monitoring of each room included air temperature, relative humidity, CO2 concentration,
and occupancy. The sensors for each measurement were packaged into a single device and
mounted in each room 0.6 meters from the ground, which is the standard location for
assessing occupant thermal comfort.
One-Time Measurements
One-time measurements were taken for flow measurements throughout the system. A
mapping method was used whereby flow was measured by a non-installed instrument, and
either supply pressure or fan power was measured simultaneously by an installed instrument.
Tracer gas measurements were used for all ducted flows, whereas flow hoods were used for
all non-ducted flows. The tracer gas measurements were mapped to the corresponding duct
pressure within the operating range, while the flow hood readings were mapped to the
corresponding power of the fan within the operating range. The flow was mapped against
power for the non-ducted units because there was no way to reliably measure the pressure
rise across the fan within these units. Likewise, tracer gas tests could not be conducted on the
non-ducted units because the supply and return paths are not separated and cannot be easily
isolated for tracer gas injection and sampling.
The tracer gas system is composed of an injection system and a measurement system. The
CO2 injection rate is measured and controlled by a mass flow controller. The CO2 enters the
duct at several injection sites, where it mixes with the airstream. The researchers placed the
measurement system far downstream of the injection site where the CO2 would be sufficiently
well mixed. The CO2 concentration before and after injection was measured to calculate a
baseline value of the CO2 concentration, and a python analyzer calculated the air flow in the
duct. The procedure was repeated for three speeds of the fan-coil, and the pressure-flow map
was developed using concurrent pressure readings.
The pressure-flow correlations were developed using the relationship that the volumetric flow
rate (Q) is proportional to the square root of the pressure:
𝑄 = 𝐶 ∗ √𝑃
45
Because the flow from the tracer gas system was reported in standard cubic feet per minute,
the units of Q are also standard cubic feet per minute. The constant, C, was determined for
each fan coil from the one-time flow measurements and applies over the full range of flows.
Once C was calculated, the error of the correlation was checked and was typically between 1
percent and 5 percent. One fan coil had an error of 6.5 percent at the bottom end of the
correlation.
The powered flow hood system was composed of a calibrated duct blaster fan and controller
and a ducted flow hood. The measurements were taken at the return grille of the non-ducted
units. A DG-700 digital pressure sensor was used to monitor the differential pressure across
the duct blaster fan and the differential pressure between the flow hood and ambient. The
resistance imposed by the ducted flow hood on the fan-coil, which is not present during
normal operation, is overcome by powering the duct blaster fan. The researchers increased
the fan power until the differential pressure between ambient and the inside of the flow hood
was reduced to zero, simulating the typical pressure at the return grille. The flow was
recorded concurrently with power measurements to develop the power-flow correlations.
The power mapping revealed that five of the six non-ducted fan coils had only marginal
change in power with fan speed setting change, had a very poor power-flow correlation, or
had both problems. Because it was difficult to distinguish between the fan speeds based on
the power alone, the flows were averaged over the expected range of operation, and the flow
was calculated based on whether the unit is on or off.
The sixth non-ducted fan coil, which was larger than the others, had a distinguishable trend
between power and flow. Four fan speeds were mapped; however, two of the fan speeds
produced identical results. Because there were effectively only three fan flow rates, the data
was modeled with a linear correlation to allow for calculation of the trend uncertainty. The
correlation 𝑅2 was 0.979, which means the linear model worked well over the observed range.
One-time measurements were also recorded for the ventilation fan power consumption and
the volumetric flow rate. The ventilation system had a single speed fan, so the volumetric flow
rate was also constant. Pressure sensors in the ventilation system were used to determine
when the ventilation fan was on.
Installation and Commissioning Process
The ideal location to install the IEC would have been on the roof, adjacent to the ventilation
chase for convenient connection of IEC ventilation air into the building’s existing ventilation
ducting. However, since project time constraints precluded this option, the IEC was instead
installed inside the lab space on the first floor of the building.
Since the IEC is designed for outside placement — to directly draw air from, and exhaust air
to, the ambient environment — indoor placement required the installation of new ducting to
connect outside air into the unit and supply air from the unit into the ventilation air ducts. To
replicate an outdoor environment, booster fans were installed in each duct, with a
proportional-integral-derivative controller to compensate for the pressure drop imposed by
adding ducting to the IEC’s intake and exhaust. The installation of the IEC is shown in Figure
27, Figure 28, and Figure 29.
46
Figure 27: Indirect Evaporative Cooling Insulated Supply Flex Duct During Construction
Source: Electric Power Research Institute
Figure 28 shows the supply air ducted from the IEC to the indoor ducted air distribution
system and exhaust air ducted to an exhaust loop.
Figure 28: Completed Indirect Evaporative Cooling Supply
and Exhaust Connections
Source: Electric Power Research Institute
The completed IEC inlet was ducted to allow the use of a booster fan to overcome extra
friction due to the flex ducts, as shown in Figure 29.
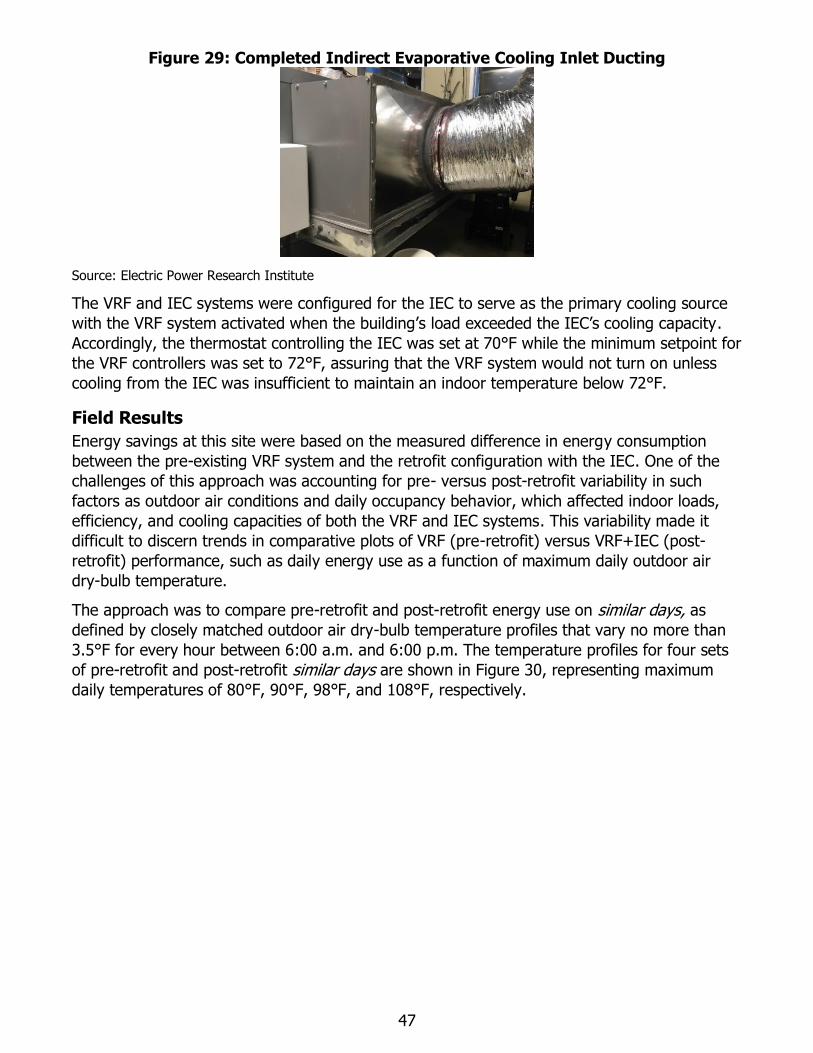
47
Figure 29: Completed Indirect Evaporative Cooling Inlet Ducting
Source: Electric Power Research Institute
The VRF and IEC systems were configured for the IEC to serve as the primary cooling source
with the VRF system activated when the building’s load exceeded the IEC’s cooling capacity.
Accordingly, the thermostat controlling the IEC was set at 70°F while the minimum setpoint for
the VRF controllers was set to 72°F, assuring that the VRF system would not turn on unless
cooling from the IEC was insufficient to maintain an indoor temperature below 72°F.
Field Results
Energy savings at this site were based on the measured difference in energy consumption
between the pre-existing VRF system and the retrofit configuration with the IEC. One of the
challenges of this approach was accounting for pre- versus post-retrofit variability in such
factors as outdoor air conditions and daily occupancy behavior, which affected indoor loads,
efficiency, and cooling capacities of both the VRF and IEC systems. This variability made it
difficult to discern trends in comparative plots of VRF (pre-retrofit) versus VRF+IEC (post-
retrofit) performance, such as daily energy use as a function of maximum daily outdoor air
dry-bulb temperature.
The approach was to compare pre-retrofit and post-retrofit energy use on similar days, as
defined by closely matched outdoor air dry-bulb temperature profiles that vary no more than
3.5°F for every hour between 6:00 a.m. and 6:00 p.m. The temperature profiles for four sets
of pre-retrofit and post-retrofit similar days are shown in Figure 30, representing maximum
daily temperatures of 80°F, 90°F, 98°F, and 108°F, respectively.
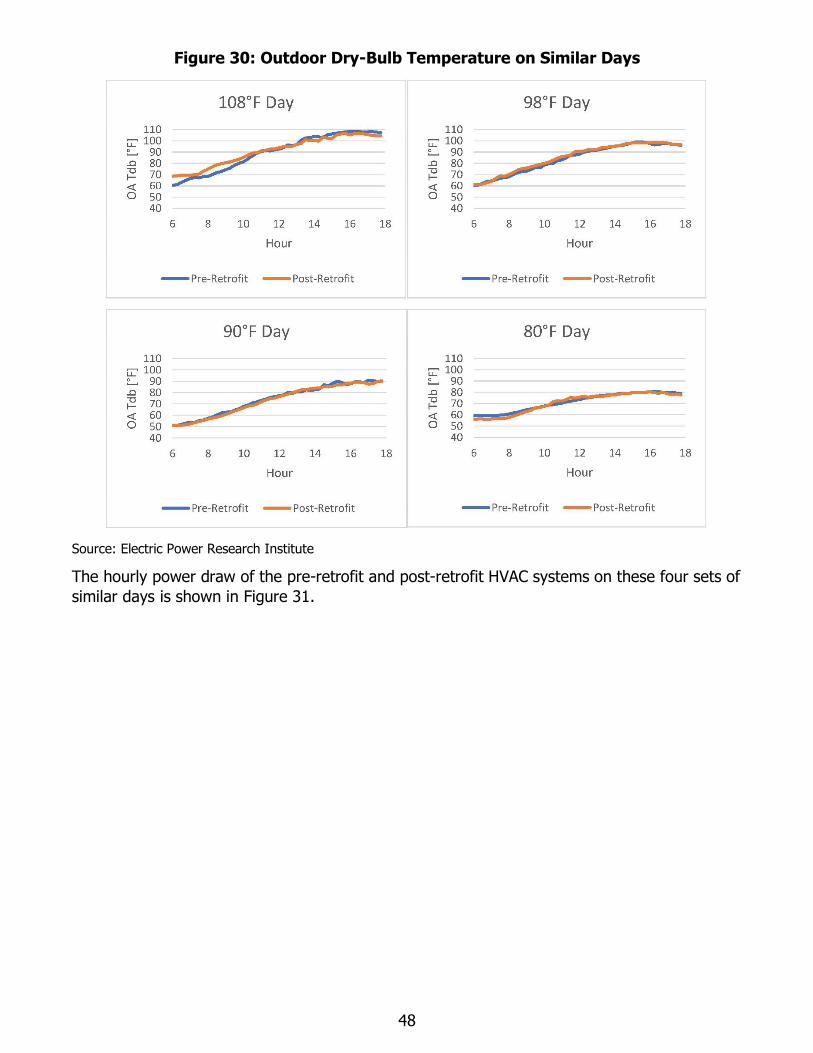
48
Figure 30: Outdoor Dry-Bulb Temperature on Similar Days
Source: Electric Power Research Institute
The hourly power draw of the pre-retrofit and post-retrofit HVAC systems on these four sets of
similar days is shown in Figure 31.
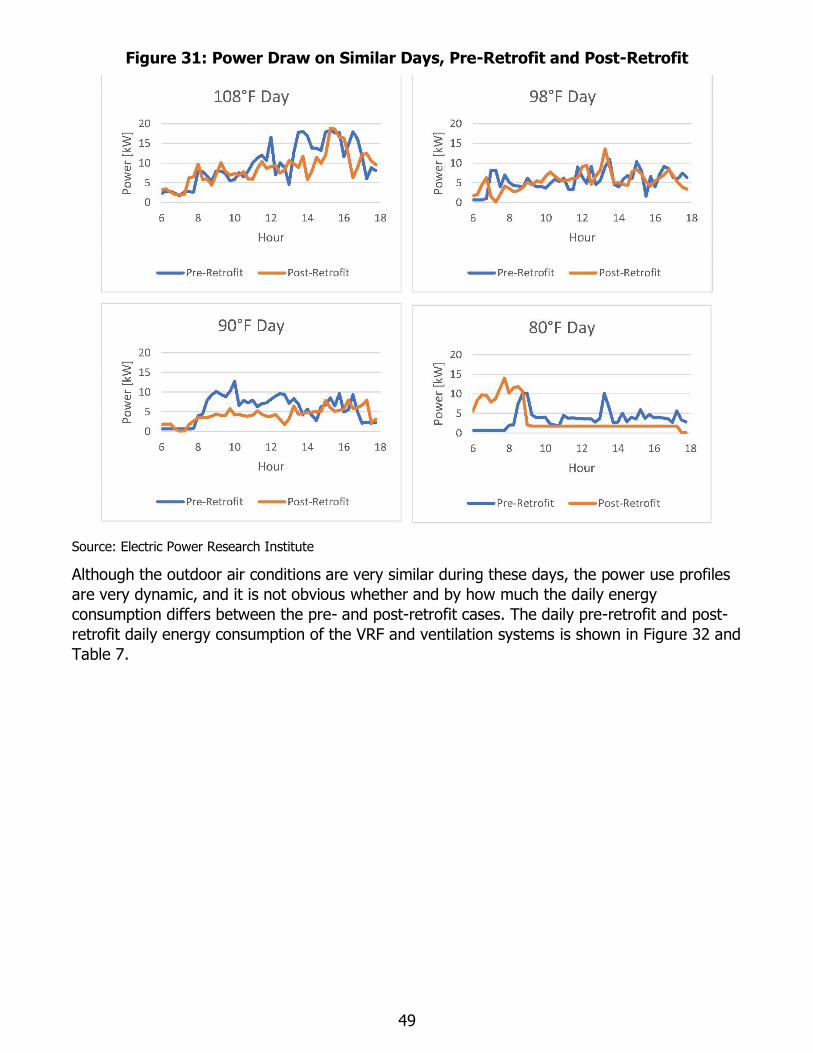
49
Figure 31: Power Draw on Similar Days, Pre-Retrofit and Post-Retrofit
Source: Electric Power Research Institute
Although the outdoor air conditions are very similar during these days, the power use profiles
are very dynamic, and it is not obvious whether and by how much the daily energy
consumption differs between the pre- and post-retrofit cases. The daily pre-retrofit and post-
retrofit daily energy consumption of the VRF and ventilation systems is shown in Figure 32 and
Table 7.
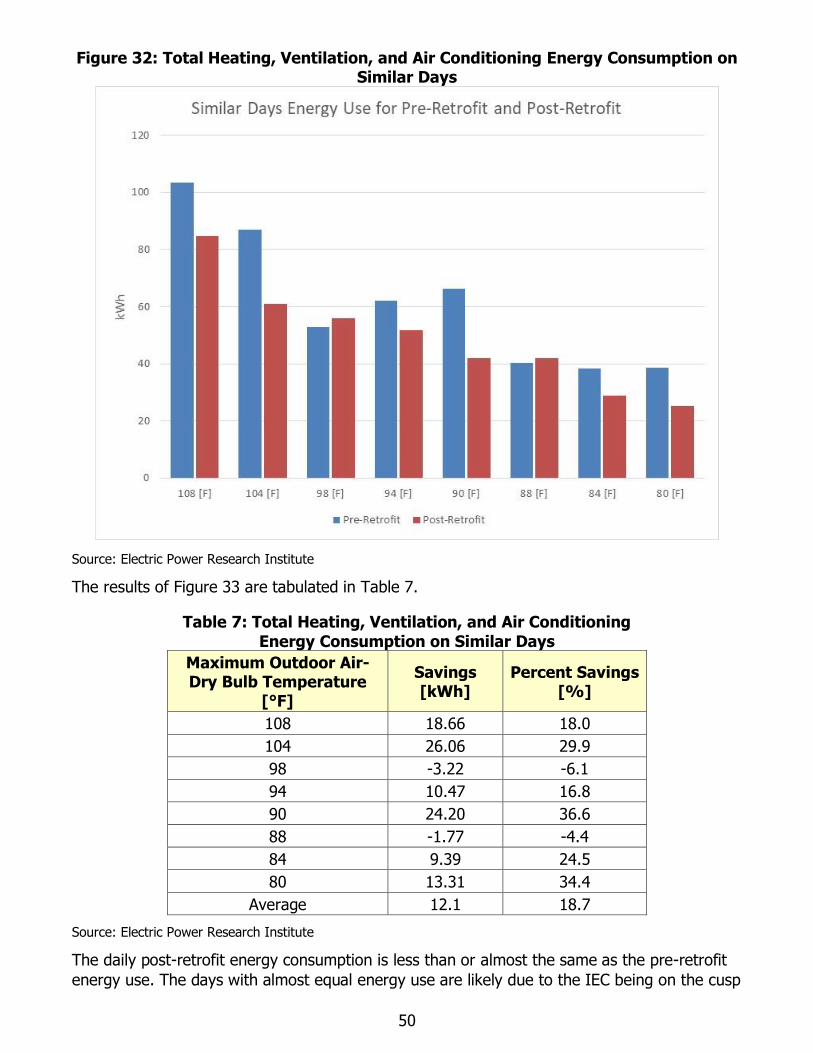
50
Figure 32: Total Heating, Ventilation, and Air Conditioning Energy Consumption on Similar Days
Source: Electric Power Research Institute
The results of Figure 33 are tabulated in Table 7.
Table 7: Total Heating, Ventilation, and Air Conditioning
Energy Consumption on Similar Days
Maximum Outdoor Air-Dry Bulb Temperature
[°F]
Savings [kWh]
Percent Savings [%]
108 18.66 18.0
104 26.06 29.9
98 -3.22 -6.1
94 10.47 16.8
90 24.20 36.6
88 -1.77 -4.4
84 9.39 24.5
80 13.31 34.4
Average 12.1 18.7
Source: Electric Power Research Institute
The daily post-retrofit energy consumption is less than or almost the same as the pre-retrofit
energy use. The days with almost equal energy use are likely due to the IEC being on the cusp
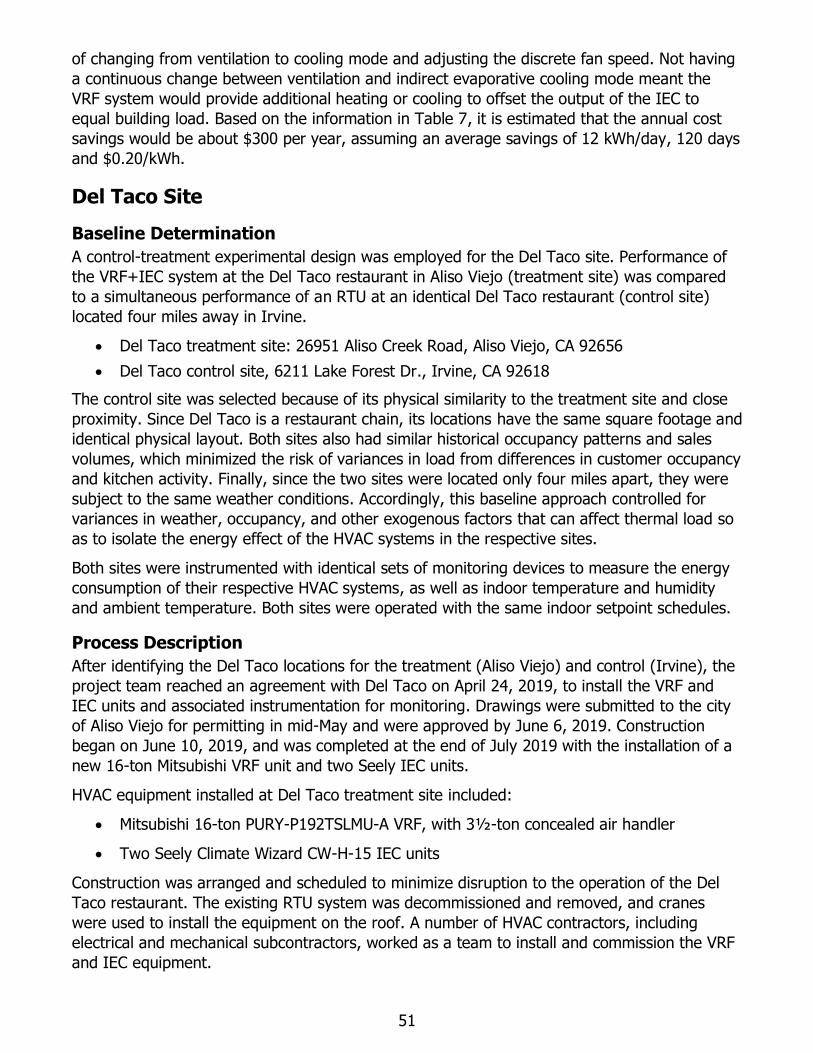
51
of changing from ventilation to cooling mode and adjusting the discrete fan speed. Not having
a continuous change between ventilation and indirect evaporative cooling mode meant the
VRF system would provide additional heating or cooling to offset the output of the IEC to
equal building load. Based on the information in Table 7, it is estimated that the annual cost
savings would be about $300 per year, assuming an average savings of 12 kWh/day, 120 days
and $0.20/kWh.
Del Taco Site
Baseline Determination
A control-treatment experimental design was employed for the Del Taco site. Performance of
the VRF+IEC system at the Del Taco restaurant in Aliso Viejo (treatment site) was compared
to a simultaneous performance of an RTU at an identical Del Taco restaurant (control site)
located four miles away in Irvine.
• Del Taco treatment site: 26951 Aliso Creek Road, Aliso Viejo, CA 92656
• Del Taco control site, 6211 Lake Forest Dr., Irvine, CA 92618
The control site was selected because of its physical similarity to the treatment site and close
proximity. Since Del Taco is a restaurant chain, its locations have the same square footage and
identical physical layout. Both sites also had similar historical occupancy patterns and sales
volumes, which minimized the risk of variances in load from differences in customer occupancy
and kitchen activity. Finally, since the two sites were located only four miles apart, they were
subject to the same weather conditions. Accordingly, this baseline approach controlled for
variances in weather, occupancy, and other exogenous factors that can affect thermal load so
as to isolate the energy effect of the HVAC systems in the respective sites.
Both sites were instrumented with identical sets of monitoring devices to measure the energy
consumption of their respective HVAC systems, as well as indoor temperature and humidity
and ambient temperature. Both sites were operated with the same indoor setpoint schedules.
Process Description
After identifying the Del Taco locations for the treatment (Aliso Viejo) and control (Irvine), the
project team reached an agreement with Del Taco on April 24, 2019, to install the VRF and
IEC units and associated instrumentation for monitoring. Drawings were submitted to the city
of Aliso Viejo for permitting in mid-May and were approved by June 6, 2019. Construction
began on June 10, 2019, and was completed at the end of July 2019 with the installation of a
new 16-ton Mitsubishi VRF unit and two Seely IEC units.
HVAC equipment installed at Del Taco treatment site included:
• Mitsubishi 16-ton PURY-P192TSLMU-A VRF, with 3½-ton concealed air handler
• Two Seely Climate Wizard CW-H-15 IEC units
Construction was arranged and scheduled to minimize disruption to the operation of the Del
Taco restaurant. The existing RTU system was decommissioned and removed, and cranes
were used to install the equipment on the roof. A number of HVAC contractors, including
electrical and mechanical subcontractors, worked as a team to install and commission the VRF
and IEC equipment.
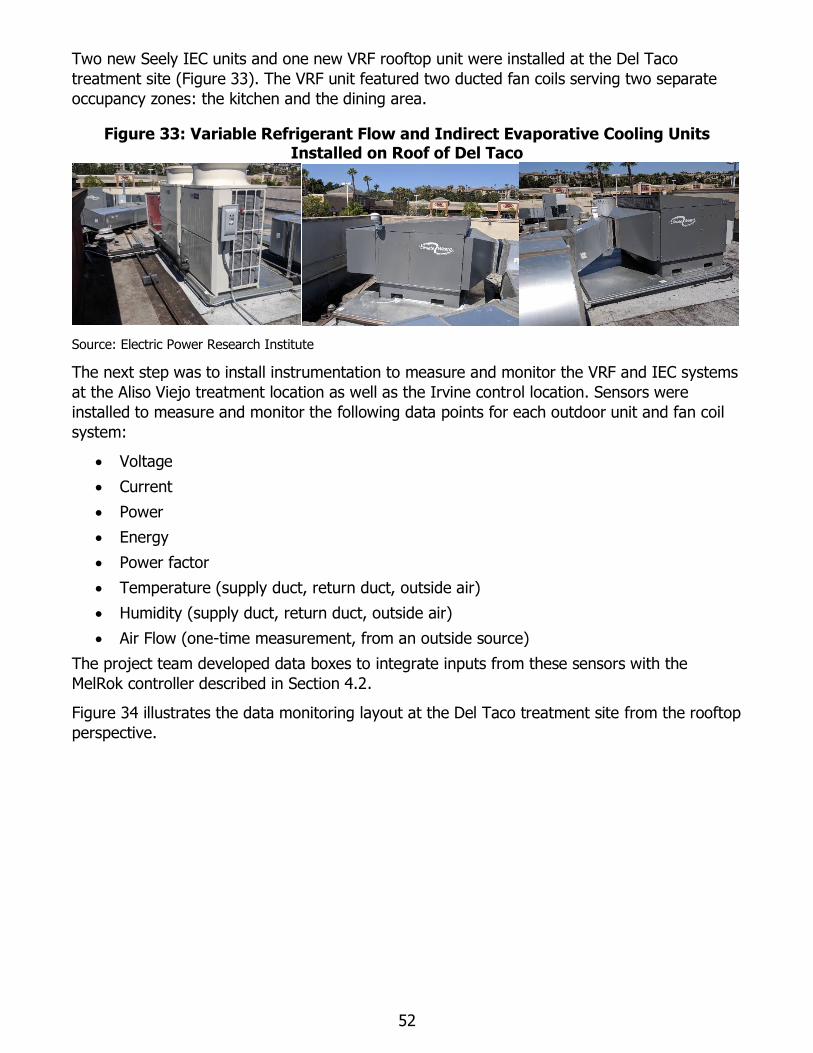
52
Two new Seely IEC units and one new VRF rooftop unit were installed at the Del Taco
treatment site (Figure 33). The VRF unit featured two ducted fan coils serving two separate
occupancy zones: the kitchen and the dining area.
Figure 33: Variable Refrigerant Flow and Indirect Evaporative Cooling Units Installed on Roof of Del Taco
Source: Electric Power Research Institute
The next step was to install instrumentation to measure and monitor the VRF and IEC systems
at the Aliso Viejo treatment location as well as the Irvine control location. Sensors were
installed to measure and monitor the following data points for each outdoor unit and fan coil
system:
• Voltage
• Current
• Power
• Energy
• Power factor
• Temperature (supply duct, return duct, outside air)
• Humidity (supply duct, return duct, outside air)
• Air Flow (one-time measurement, from an outside source)
The project team developed data boxes to integrate inputs from these sensors with the
MelRok controller described in Section 4.2.
Figure 34 illustrates the data monitoring layout at the Del Taco treatment site from the rooftop
perspective.
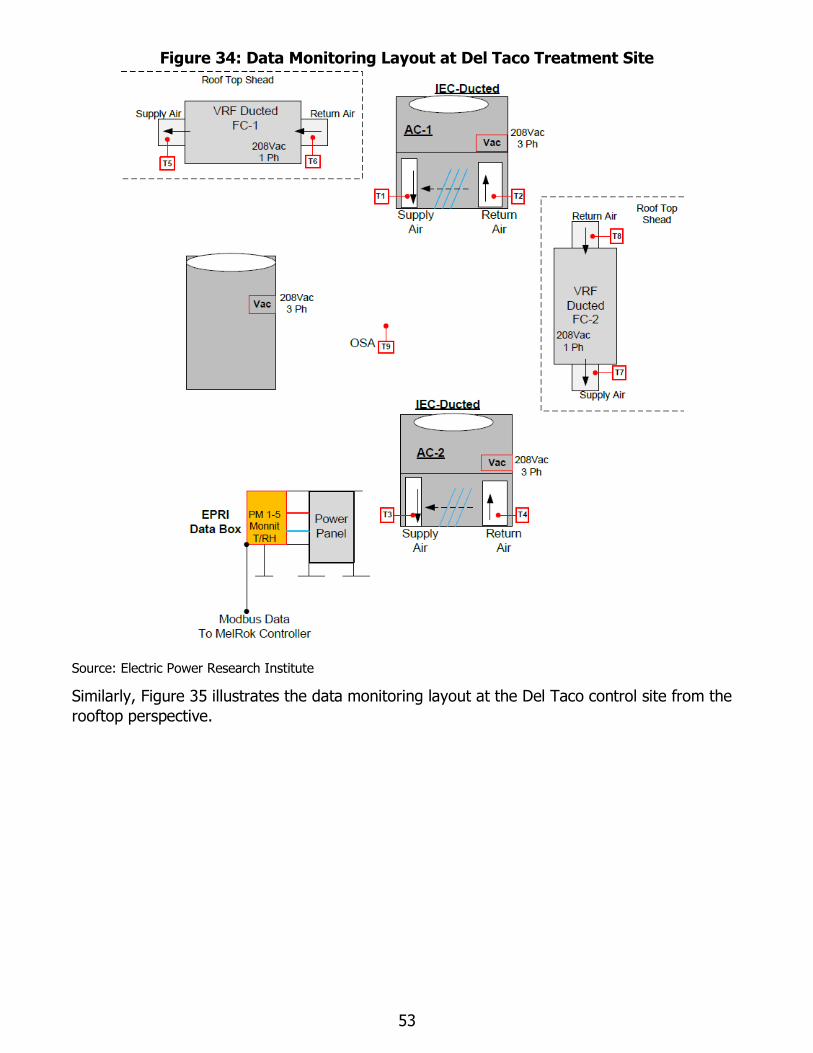
53
Figure 34: Data Monitoring Layout at Del Taco Treatment Site
Source: Electric Power Research Institute
Similarly, Figure 35 illustrates the data monitoring layout at the Del Taco control site from the
rooftop perspective.
54
Figure 35: Data Monitoring Layout at Del Taco Control Site
Source: Electric Power Research Institute
Field Results
A portion of the month of August 2019 was spent commissioning the equipment and installing
the instrumentation. As such, September represented the first month of meaningful data,
capturing the tail of the summer cooling season into the fall and winter through February
2020. Cumulative measured savings per month are show in Table 8.
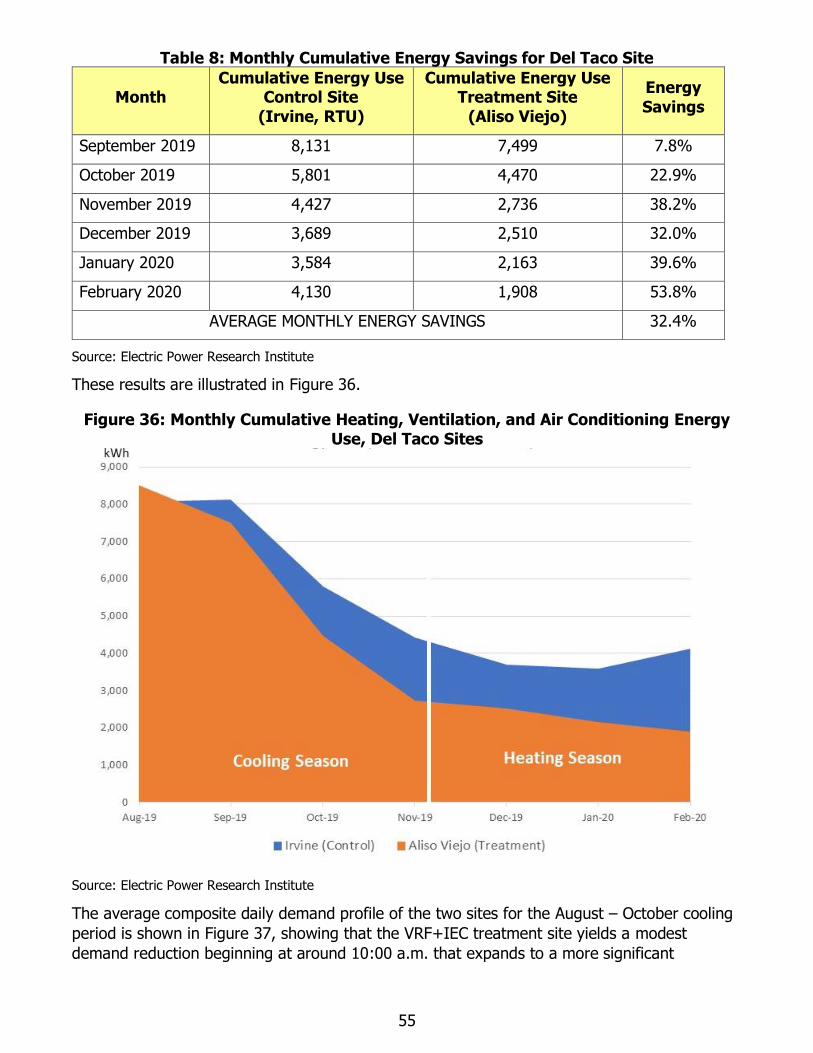
55
Table 8: Monthly Cumulative Energy Savings for Del Taco Site
Month Cumulative Energy Use
Control Site
(Irvine, RTU)
Cumulative Energy Use Treatment Site
(Aliso Viejo)
Energy
Savings
September 2019 8,131 7,499 7.8%
October 2019 5,801 4,470 22.9%
November 2019 4,427 2,736 38.2%
December 2019 3,689 2,510 32.0%
January 2020 3,584 2,163 39.6%
February 2020 4,130 1,908 53.8%
AVERAGE MONTHLY ENERGY SAVINGS 32.4%
Source: Electric Power Research Institute
These results are illustrated in Figure 36.
Figure 36: Monthly Cumulative Heating, Ventilation, and Air Conditioning Energy
Use, Del Taco Sites
Source: Electric Power Research Institute
The average composite daily demand profile of the two sites for the August – October cooling
period is shown in Figure 37, showing that the VRF+IEC treatment site yields a modest
demand reduction beginning at around 10:00 a.m. that expands to a more significant
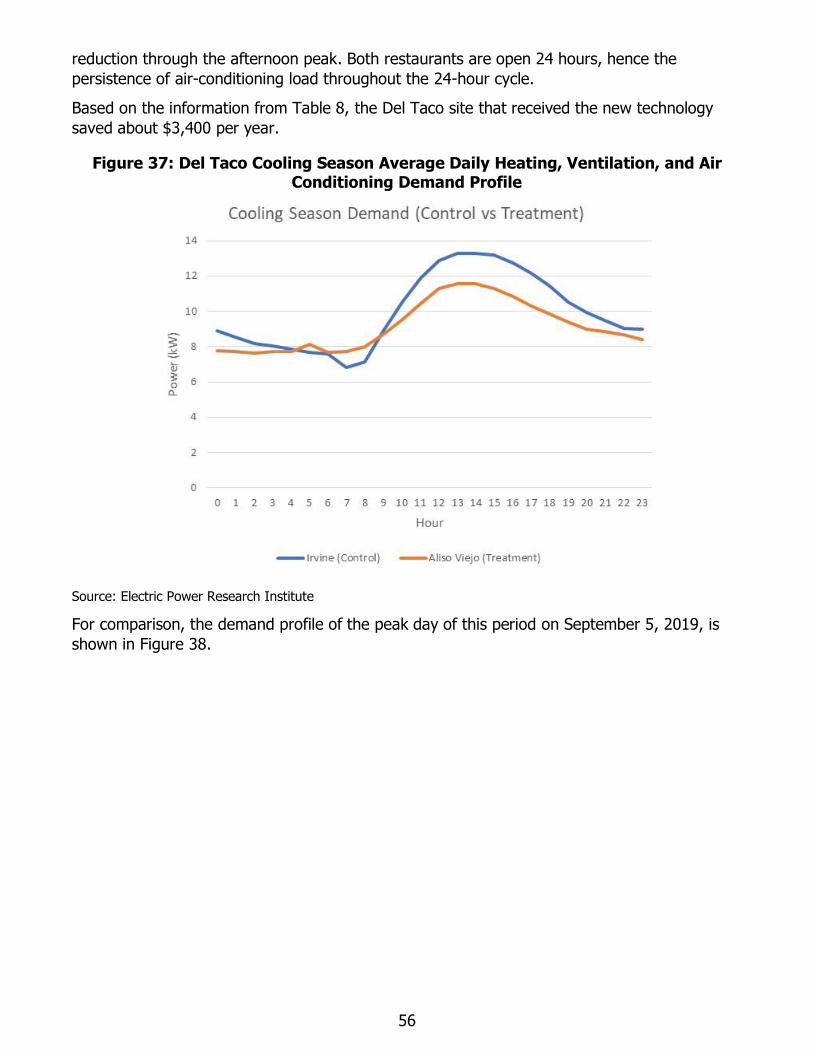
56
reduction through the afternoon peak. Both restaurants are open 24 hours, hence the
persistence of air-conditioning load throughout the 24-hour cycle.
Based on the information from Table 8, the Del Taco site that received the new technology
saved about $3,400 per year.
Figure 37: Del Taco Cooling Season Average Daily Heating, Ventilation, and Air Conditioning Demand Profile
Source: Electric Power Research Institute
For comparison, the demand profile of the peak day of this period on September 5, 2019, is
shown in Figure 38.
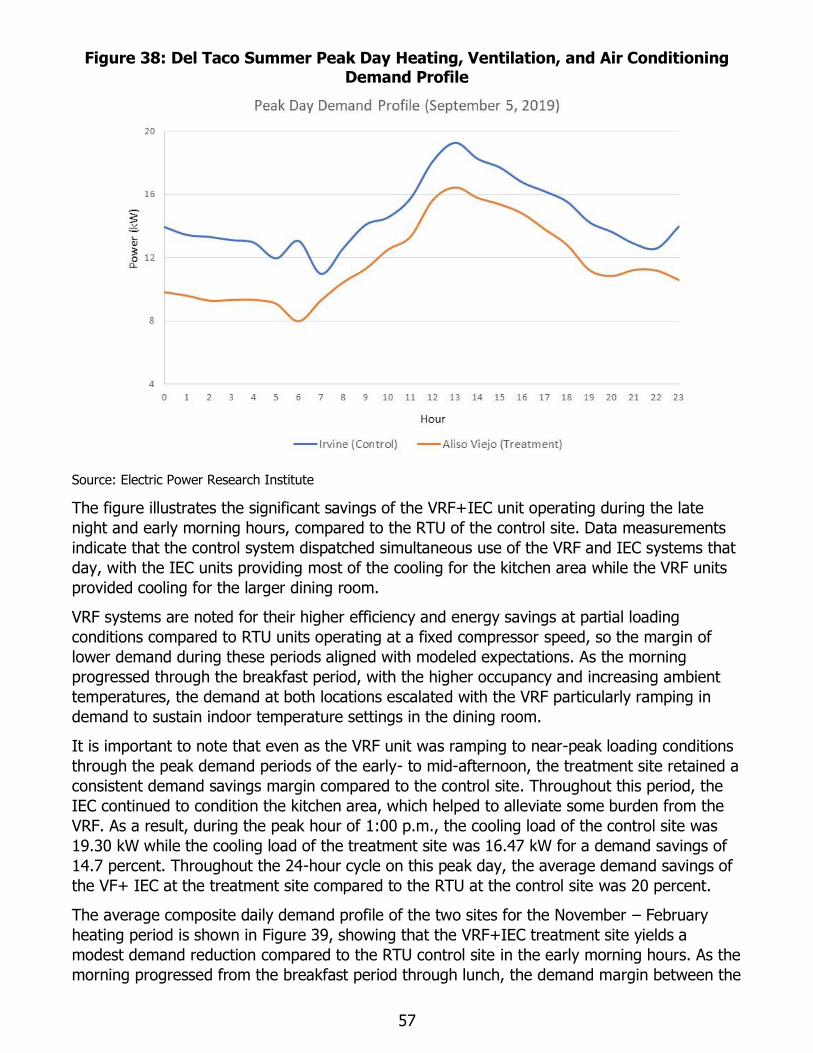
57
Figure 38: Del Taco Summer Peak Day Heating, Ventilation, and Air Conditioning Demand Profile
Source: Electric Power Research Institute
The figure illustrates the significant savings of the VRF+IEC unit operating during the late
night and early morning hours, compared to the RTU of the control site. Data measurements
indicate that the control system dispatched simultaneous use of the VRF and IEC systems that
day, with the IEC units providing most of the cooling for the kitchen area while the VRF units
provided cooling for the larger dining room.
VRF systems are noted for their higher efficiency and energy savings at partial loading
conditions compared to RTU units operating at a fixed compressor speed, so the margin of
lower demand during these periods aligned with modeled expectations. As the morning
progressed through the breakfast period, with the higher occupancy and increasing ambient
temperatures, the demand at both locations escalated with the VRF particularly ramping in
demand to sustain indoor temperature settings in the dining room.
It is important to note that even as the VRF unit was ramping to near-peak loading conditions
through the peak demand periods of the early- to mid-afternoon, the treatment site retained a
consistent demand savings margin compared to the control site. Throughout this period, the
IEC continued to condition the kitchen area, which helped to alleviate some burden from the
VRF. As a result, during the peak hour of 1:00 p.m., the cooling load of the control site was
19.30 kW while the cooling load of the treatment site was 16.47 kW for a demand savings of
14.7 percent. Throughout the 24-hour cycle on this peak day, the average demand savings of
the VF+ IEC at the treatment site compared to the RTU at the control site was 20 percent.
The average composite daily demand profile of the two sites for the November – February
heating period is shown in Figure 39, showing that the VRF+IEC treatment site yields a
modest demand reduction compared to the RTU control site in the early morning hours. As the
morning progressed from the breakfast period through lunch, the demand margin between the
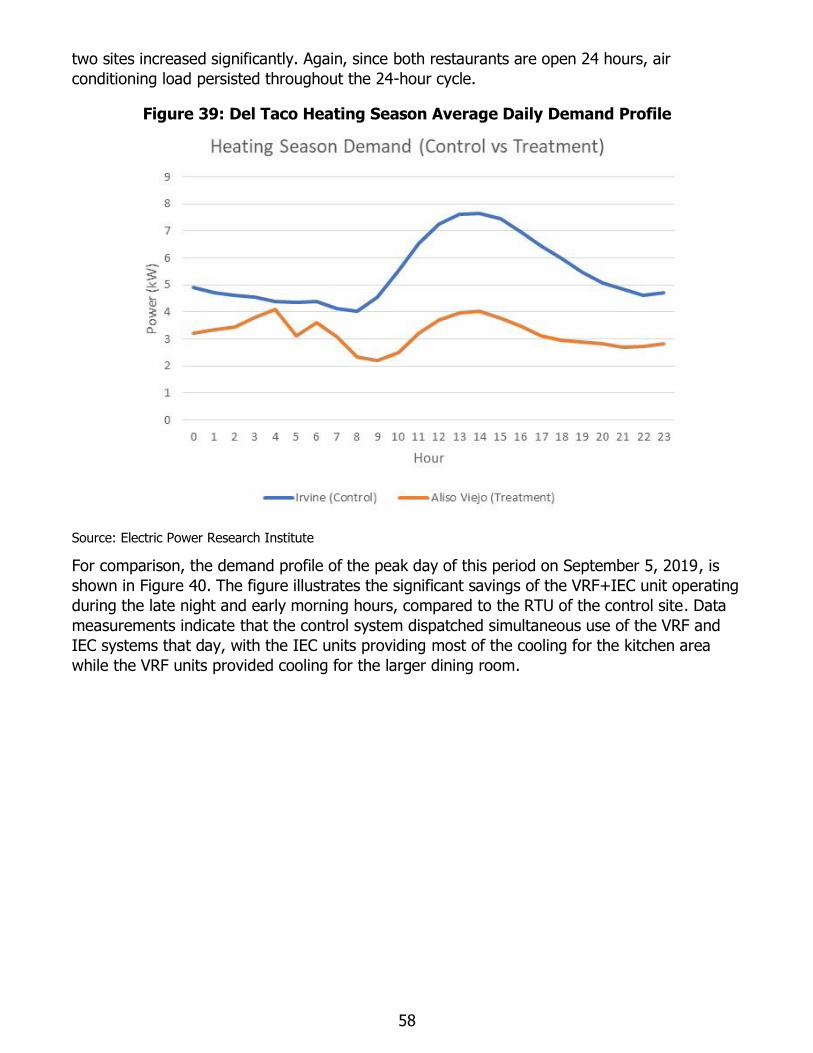
58
two sites increased significantly. Again, since both restaurants are open 24 hours, air
conditioning load persisted throughout the 24-hour cycle.
Figure 39: Del Taco Heating Season Average Daily Demand Profile
Source: Electric Power Research Institute
For comparison, the demand profile of the peak day of this period on September 5, 2019, is
shown in Figure 40. The figure illustrates the significant savings of the VRF+IEC unit operating
during the late night and early morning hours, compared to the RTU of the control site. Data
measurements indicate that the control system dispatched simultaneous use of the VRF and
IEC systems that day, with the IEC units providing most of the cooling for the kitchen area
while the VRF units provided cooling for the larger dining room.
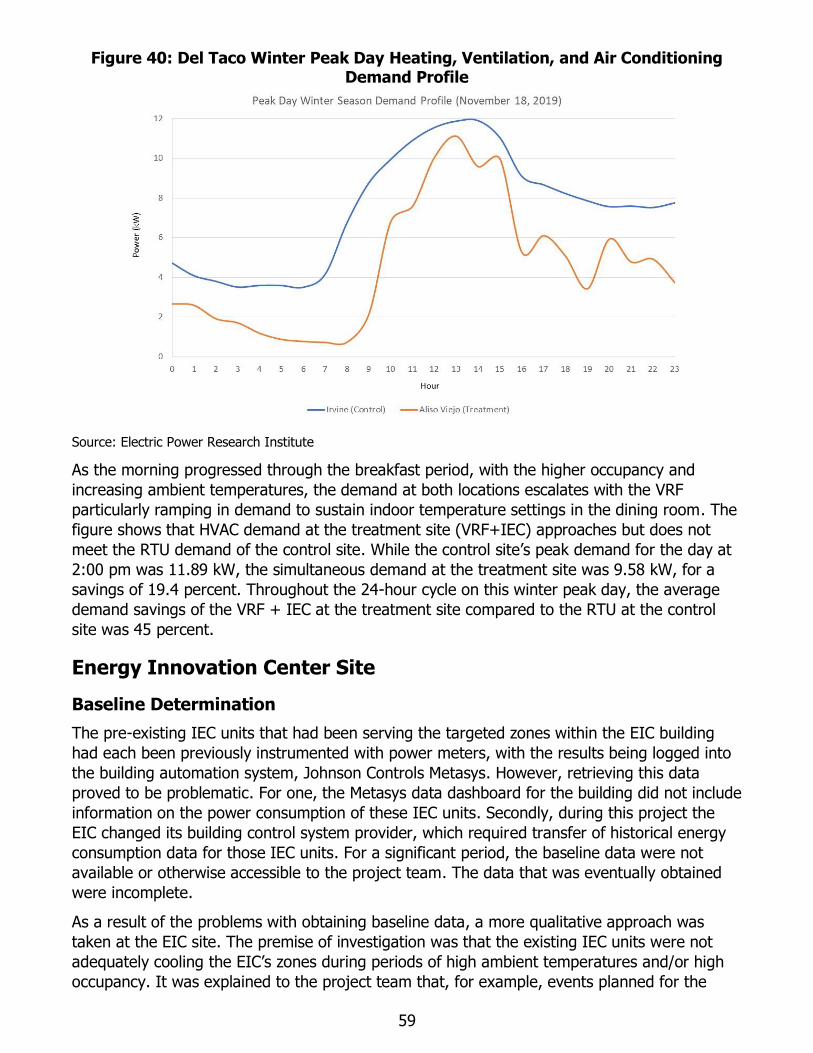
59
Figure 40: Del Taco Winter Peak Day Heating, Ventilation, and Air Conditioning Demand Profile
Source: Electric Power Research Institute
As the morning progressed through the breakfast period, with the higher occupancy and
increasing ambient temperatures, the demand at both locations escalates with the VRF
particularly ramping in demand to sustain indoor temperature settings in the dining room. The
figure shows that HVAC demand at the treatment site (VRF+IEC) approaches but does not
meet the RTU demand of the control site. While the control site’s peak demand for the day at
2:00 pm was 11.89 kW, the simultaneous demand at the treatment site was 9.58 kW, for a
savings of 19.4 percent. Throughout the 24-hour cycle on this winter peak day, the average
demand savings of the VRF + IEC at the treatment site compared to the RTU at the control
site was 45 percent.
Energy Innovation Center Site
Baseline Determination
The pre-existing IEC units that had been serving the targeted zones within the EIC building
had each been previously instrumented with power meters, with the results being logged into
the building automation system, Johnson Controls Metasys. However, retrieving this data
proved to be problematic. For one, the Metasys data dashboard for the building did not include
information on the power consumption of these IEC units. Secondly, during this project the
EIC changed its building control system provider, which required transfer of historical energy
consumption data for those IEC units. For a significant period, the baseline data were not
available or otherwise accessible to the project team. The data that was eventually obtained
were incomplete.
As a result of the problems with obtaining baseline data, a more qualitative approach was
taken at the EIC site. The premise of investigation was that the existing IEC units were not
adequately cooling the EIC’s zones during periods of high ambient temperatures and/or high
occupancy. It was explained to the project team that, for example, events planned for the
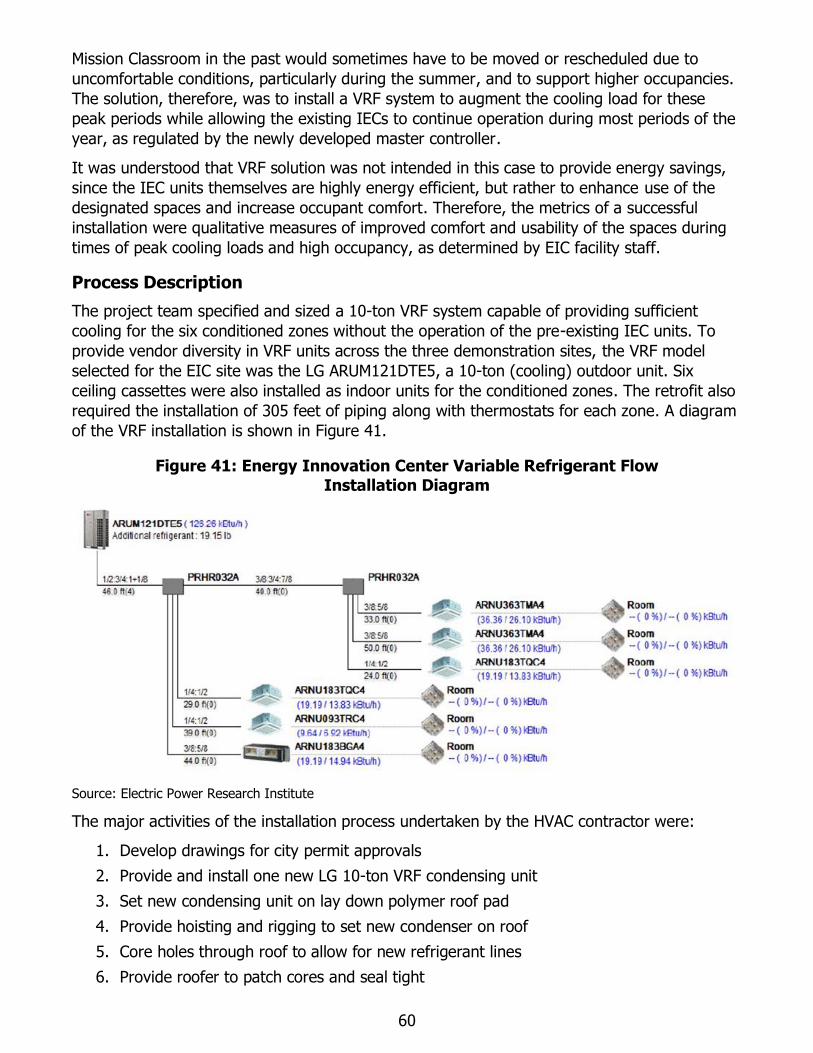
60
Mission Classroom in the past would sometimes have to be moved or rescheduled due to
uncomfortable conditions, particularly during the summer, and to support higher occupancies.
The solution, therefore, was to install a VRF system to augment the cooling load for these
peak periods while allowing the existing IECs to continue operation during most periods of the
year, as regulated by the newly developed master controller.
It was understood that VRF solution was not intended in this case to provide energy savings,
since the IEC units themselves are highly energy efficient, but rather to enhance use of the
designated spaces and increase occupant comfort. Therefore, the metrics of a successful
installation were qualitative measures of improved comfort and usability of the spaces during
times of peak cooling loads and high occupancy, as determined by EIC facility staff.
Process Description
The project team specified and sized a 10-ton VRF system capable of providing sufficient
cooling for the six conditioned zones without the operation of the pre-existing IEC units. To
provide vendor diversity in VRF units across the three demonstration sites, the VRF model
selected for the EIC site was the LG ARUM121DTE5, a 10-ton (cooling) outdoor unit. Six
ceiling cassettes were also installed as indoor units for the conditioned zones. The retrofit also
required the installation of 305 feet of piping along with thermostats for each zone. A diagram
of the VRF installation is shown in Figure 41.
Figure 41: Energy Innovation Center Variable Refrigerant Flow
Installation Diagram
Source: Electric Power Research Institute
The major activities of the installation process undertaken by the HVAC contractor were:
1. Develop drawings for city permit approvals
2. Provide and install one new LG 10-ton VRF condensing unit
3. Set new condensing unit on lay down polymer roof pad
4. Provide hoisting and rigging to set new condenser on roof
5. Core holes through roof to allow for new refrigerant lines
6. Provide roofer to patch cores and seal tight
61
7. Provide unistrut and hangers to mount fan coils
8. Install soft copper refrigerant lines to connect cassettes to condensing unit
9. Install hard copper and fittings to connect condensing unit to branch
10. Install pipe hangers to properly support new piping
11. Insulate new copper refrigerant piping
12. Install pipes and fittings to drain condensate from all fan coils
13. Tie condensate drain into nearest acceptable receptacle
14. Install new thermostats for fan coil units
15. Run new thermostat wire from fan coils to new thermostats
16. Run new thermostat wire from fan coils to condensing unit
17. Provide electrician to run new power to ceiling cassettes and condensing unit
18. Provide startup technician to start and test and commission new units for proper
operation
Field Results
After the VRF retrofit plans were finalized, but prior to VRF installation, the EIC staff and IEC
vendor (Seeley) determined that the insufficient cooling from the incumbent Coolerado IEC
units was due to a sensor malfunction. Those sensors were recalibrated by Seeley and as a
result the cooling capacity improved noticeably to the point that it was deemed sufficient for
most occupancy conditions. Nevertheless, with the installation plans in place, the VRF
installation commenced.
The VRF unit was commissioned and deemed to work satisfactorily, providing sufficient cooling
for all the zones during the test periods. EIC staff indicated that the blast of cool air from the
VRF indoor cassettes was a big difference from what the Coolerado IEC units had been able to
provide previously. The controller was also installed and tested for control of the VRF and pre-
existing Coolerado IEC units. For a brief period, the hybrid VRF+IEC system operated between
alternating modes of exclusive IEC operation and exclusive VRF operation.
However, during a round of LEED re-certification testing, the EIC staff determined that the
operation of the VRF system would invalidate the building’s distinguished LEED Double
Platinum status — a recognition shared by fewer than two dozen facilities around the world —
based on not meeting a minimum ASHRAE fresh air ventilation standard for each zone. To
retain its LEED Double Platinum status, the EIC facilities staff decided to limit the annual
operating hours of the VRF unit. As a result, during the summer season of 2019 there was
insufficient data of operation beyond attestation of the EIC staff that the VRF unit worked well.
During the winter heating season, the VRF is available as a secondary backup heating source
but has rarely been operated in this capacity.
62
CHAPTER 5: Laboratory Testing of Alternative Refrigerants
Background
Another significant California climate policy goal is to reduce the use of refrigerants with high
global warming potential (GWP). Leakage of synthetic refrigerants into the atmosphere,
including chlorofluorocarbons and hydrochlorofluorocarbons widely used in HVAC and
refrigeration systems, are known to have high GWP potential. California Assembly Bill 3232
requires the CEC, in consultation with the California Public Utilities Commission, California Air
Resources Board, and the California Independent System Operator, to assess by January 1,
2021, the potential to reduce GHG emissions in buildings by 40 percent below 1990 levels by
2030. In addition, California Senate Bill 1477 allocates funding for building decarbonization
programs. The USEPA mandates a phase-out of hydrochlorofluorocarbons, including the
common refrigerants R-22 and R-142b, due to their ozone depleting attributes. Although their
production and import are banned starting in 2020, continued use of existing stockpiles can
continue through 2030.5
Conversion to HVAC systems using alternative low-GWP refrigerants is therefore an important
component to achieving these California policy objectives. An added consideration is the use of
natural refrigerants, which do not have to be synthetically manufactured because they exist in
nature. Although some natural refrigerants have been used in niche market applications for
decades, their use is virtually absent in packaged air-conditioning systems, and there is limited
understanding of their potential market and energy effect.
Therefore, conversion requires extensive testing to identify suitable refrigerants based on
GWP, thermodynamic properties that drive energy efficiency performance, compatibility with
existing equipment, and safety issues such as corrosion, toxicity, and flammability. Laboratory
testing of low GWP, natural refrigerant HVAC systems warrants California ratepayer funding to
inform policy makers and HVAC equipment manufacturers and contractors, and thereby
accelerate market adoption and use.
This project provided laboratory testing and system design considerations needed to
understand what refrigerants might provide improved performance for VRF operation in
California climates. It currently appears likely that the most efficient non-HFC non-GWP
refrigerants could be slightly flammable, in which case a pumped secondary heat transfer fluid
loop can isolate potentially hazardous refrigerants from the indoor environment. This research
developed options for technology opportunities to better clarify future needs and challenges.
Collectively, propane, carbon dioxide, and ammonia are the leading natural refrigerant options
based on their low GWP, availability, and favorable thermal properties. Under this project task,
heat pump and chiller systems featuring each of these refrigerants were evaluated and tested
in three different laboratories in California, Illinois, and Tennessee.
5 U.S. Environmental Protection Agency. https://www.epa.gov/ods-phaseout.
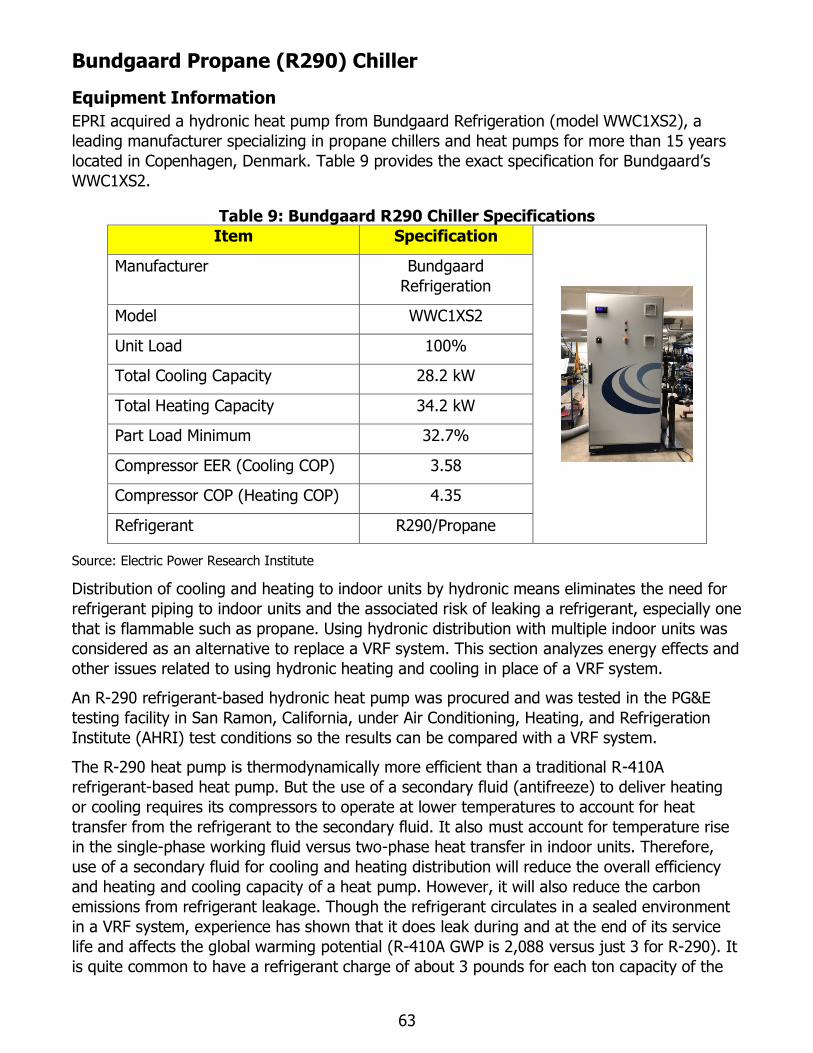
63
Bundgaard Propane (R290) Chiller
Equipment Information
EPRI acquired a hydronic heat pump from Bundgaard Refrigeration (model WWC1XS2), a
leading manufacturer specializing in propane chillers and heat pumps for more than 15 years
located in Copenhagen, Denmark. Table 9 provides the exact specification for Bundgaard’s
WWC1XS2.
Table 9: Bundgaard R290 Chiller Specifications
Item Specification
Manufacturer Bundgaard
Refrigeration
Model WWC1XS2
Unit Load 100%
Total Cooling Capacity 28.2 kW
Total Heating Capacity 34.2 kW
Part Load Minimum 32.7%
Compressor EER (Cooling COP) 3.58
Compressor COP (Heating COP) 4.35
Refrigerant R290/Propane
Source: Electric Power Research Institute
Distribution of cooling and heating to indoor units by hydronic means eliminates the need for
refrigerant piping to indoor units and the associated risk of leaking a refrigerant, especially one
that is flammable such as propane. Using hydronic distribution with multiple indoor units was
considered as an alternative to replace a VRF system. This section analyzes energy effects and
other issues related to using hydronic heating and cooling in place of a VRF system.
An R-290 refrigerant-based hydronic heat pump was procured and was tested in the PG&E
testing facility in San Ramon, California, under Air Conditioning, Heating, and Refrigeration
Institute (AHRI) test conditions so the results can be compared with a VRF system.
The R-290 heat pump is thermodynamically more efficient than a traditional R-410A
refrigerant-based heat pump. But the use of a secondary fluid (antifreeze) to deliver heating
or cooling requires its compressors to operate at lower temperatures to account for heat
transfer from the refrigerant to the secondary fluid. It also must account for temperature rise
in the single-phase working fluid versus two-phase heat transfer in indoor units. Therefore,
use of a secondary fluid for cooling and heating distribution will reduce the overall efficiency
and heating and cooling capacity of a heat pump. However, it will also reduce the carbon
emissions from refrigerant leakage. Though the refrigerant circulates in a sealed environment
in a VRF system, experience has shown that it does leak during and at the end of its service
life and affects the global warming potential (R-410A GWP is 2,088 versus just 3 for R-290). It
is quite common to have a refrigerant charge of about 3 pounds for each ton capacity of the
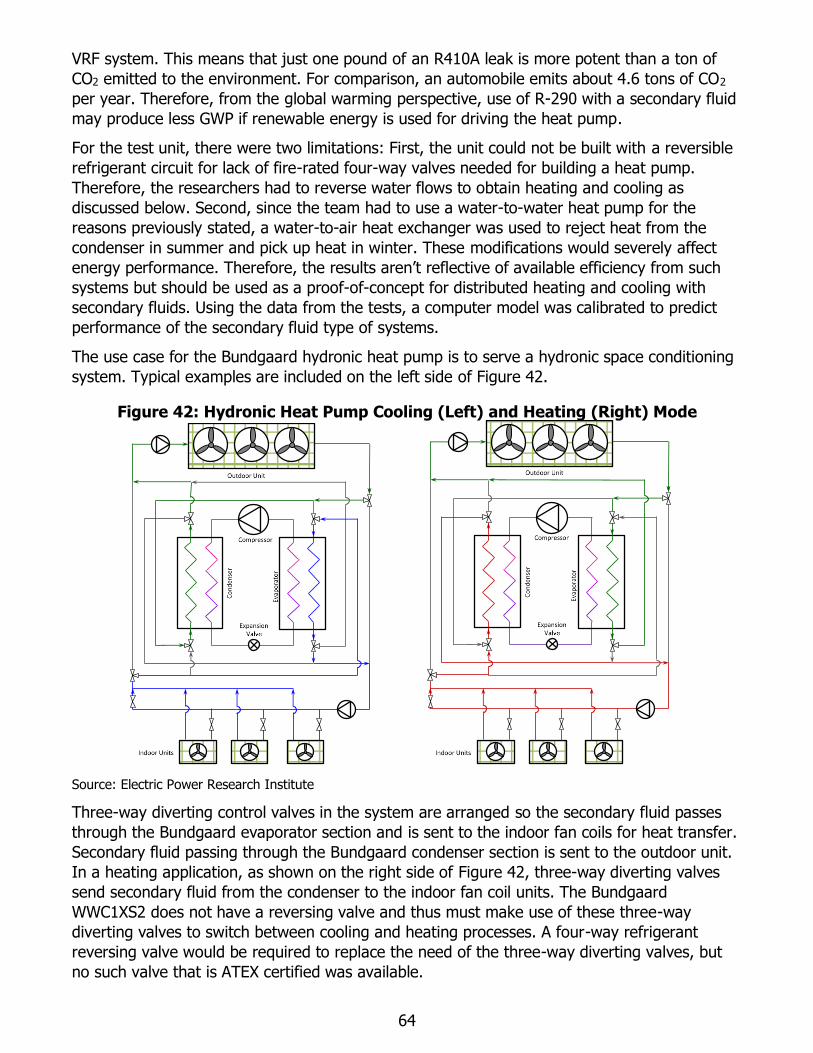
64
VRF system. This means that just one pound of an R410A leak is more potent than a ton of
CO2 emitted to the environment. For comparison, an automobile emits about 4.6 tons of CO2
per year. Therefore, from the global warming perspective, use of R-290 with a secondary fluid
may produce less GWP if renewable energy is used for driving the heat pump.
For the test unit, there were two limitations: First, the unit could not be built with a reversible
refrigerant circuit for lack of fire-rated four-way valves needed for building a heat pump.
Therefore, the researchers had to reverse water flows to obtain heating and cooling as
discussed below. Second, since the team had to use a water-to-water heat pump for the
reasons previously stated, a water-to-air heat exchanger was used to reject heat from the
condenser in summer and pick up heat in winter. These modifications would severely affect
energy performance. Therefore, the results aren’t reflective of available efficiency from such
systems but should be used as a proof-of-concept for distributed heating and cooling with
secondary fluids. Using the data from the tests, a computer model was calibrated to predict
performance of the secondary fluid type of systems.
The use case for the Bundgaard hydronic heat pump is to serve a hydronic space conditioning
system. Typical examples are included on the left side of Figure 42.
Figure 42: Hydronic Heat Pump Cooling (Left) and Heating (Right) Mode
Source: Electric Power Research Institute
Three-way diverting control valves in the system are arranged so the secondary fluid passes
through the Bundgaard evaporator section and is sent to the indoor fan coils for heat transfer.
Secondary fluid passing through the Bundgaard condenser section is sent to the outdoor unit.
In a heating application, as shown on the right side of Figure 42, three-way diverting valves
send secondary fluid from the condenser to the indoor fan coil units. The Bundgaard
WWC1XS2 does not have a reversing valve and thus must make use of these three-way
diverting valves to switch between cooling and heating processes. A four-way refrigerant
reversing valve would be required to replace the need of the three-way diverting valves, but
no such valve that is ATEX certified was available.
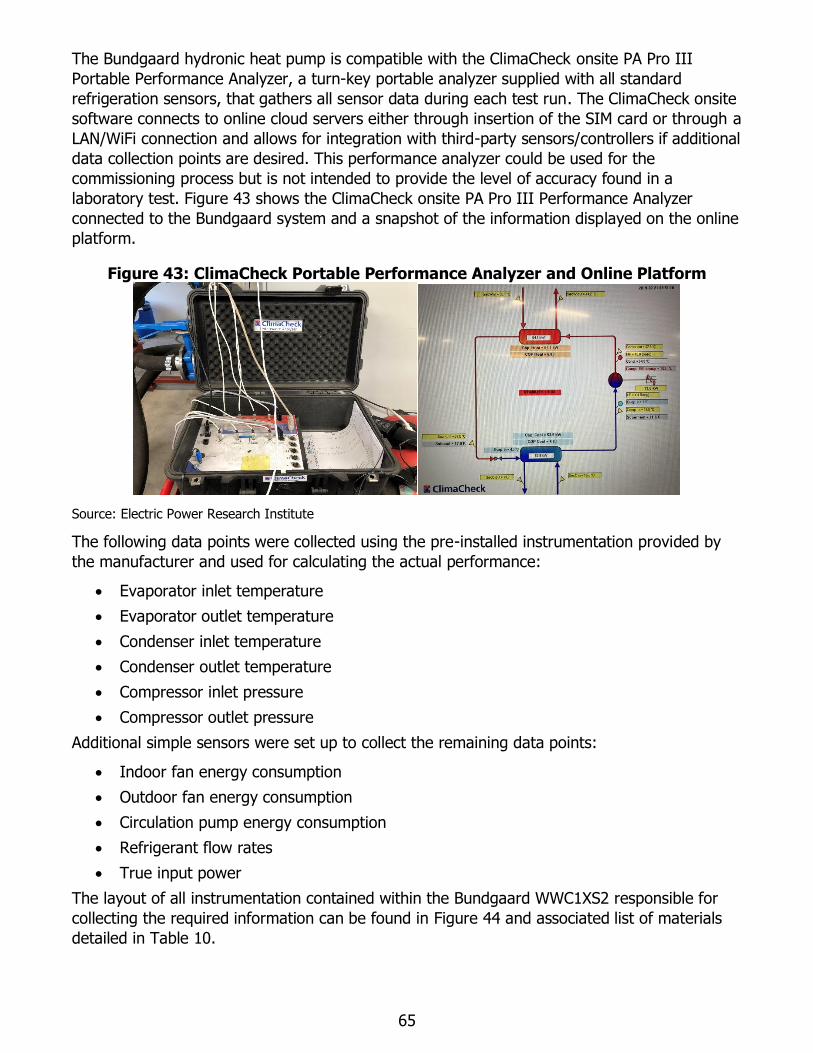
65
The Bundgaard hydronic heat pump is compatible with the ClimaCheck onsite PA Pro III
Portable Performance Analyzer, a turn-key portable analyzer supplied with all standard
refrigeration sensors, that gathers all sensor data during each test run. The ClimaCheck onsite
software connects to online cloud servers either through insertion of the SIM card or through a
LAN/WiFi connection and allows for integration with third-party sensors/controllers if additional
data collection points are desired. This performance analyzer could be used for the
commissioning process but is not intended to provide the level of accuracy found in a
laboratory test. Figure 43 shows the ClimaCheck onsite PA Pro III Performance Analyzer
connected to the Bundgaard system and a snapshot of the information displayed on the online
platform.
Figure 43: ClimaCheck Portable Performance Analyzer and Online Platform
Source: Electric Power Research Institute
The following data points were collected using the pre-installed instrumentation provided by
the manufacturer and used for calculating the actual performance:
• Evaporator inlet temperature
• Evaporator outlet temperature
• Condenser inlet temperature
• Condenser outlet temperature
• Compressor inlet pressure
• Compressor outlet pressure
Additional simple sensors were set up to collect the remaining data points:
• Indoor fan energy consumption
• Outdoor fan energy consumption
• Circulation pump energy consumption
• Refrigerant flow rates
• True input power
The layout of all instrumentation contained within the Bundgaard WWC1XS2 responsible for
collecting the required information can be found in Figure 44 and associated list of materials
detailed in Table 10.
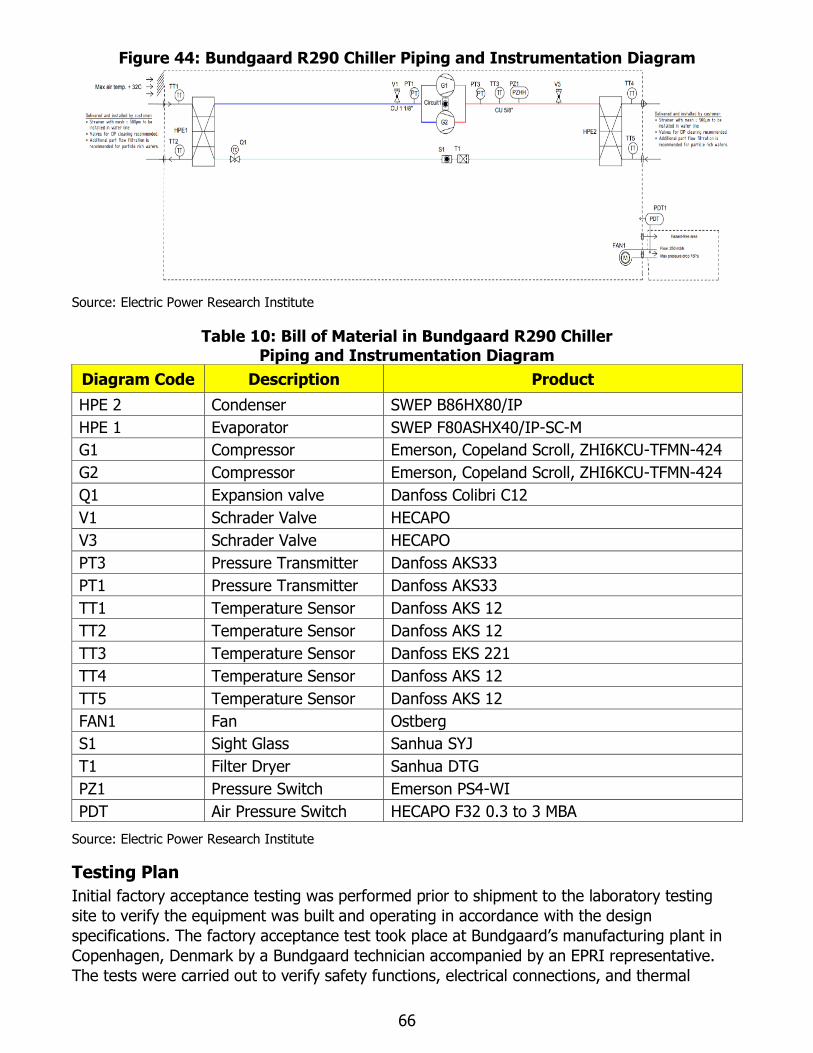
66
Figure 44: Bundgaard R290 Chiller Piping and Instrumentation Diagram
Source: Electric Power Research Institute
Table 10: Bill of Material in Bundgaard R290 Chiller Piping and Instrumentation Diagram
Diagram Code Description Product
HPE 2 Condenser SWEP B86HX80/IP
HPE 1 Evaporator SWEP F80ASHX40/IP-SC-M
G1 Compressor Emerson, Copeland Scroll, ZHI6KCU-TFMN-424
G2 Compressor Emerson, Copeland Scroll, ZHI6KCU-TFMN-424
Q1 Expansion valve Danfoss Colibri C12
V1 Schrader Valve HECAPO
V3 Schrader Valve HECAPO
PT3 Pressure Transmitter Danfoss AKS33
PT1 Pressure Transmitter Danfoss AKS33
TT1 Temperature Sensor Danfoss AKS 12
TT2 Temperature Sensor Danfoss AKS 12
TT3 Temperature Sensor Danfoss EKS 221
TT4 Temperature Sensor Danfoss AKS 12
TT5 Temperature Sensor Danfoss AKS 12
FAN1 Fan Ostberg
S1 Sight Glass Sanhua SYJ
T1 Filter Dryer Sanhua DTG
PZ1 Pressure Switch Emerson PS4-WI
PDT Air Pressure Switch HECAPO F32 0.3 to 3 MBA
Source: Electric Power Research Institute
Testing Plan
Initial factory acceptance testing was performed prior to shipment to the laboratory testing
site to verify the equipment was built and operating in accordance with the design
specifications. The factory acceptance test took place at Bundgaard’s manufacturing plant in
Copenhagen, Denmark by a Bundgaard technician accompanied by an EPRI representative.
The tests were carried out to verify safety functions, electrical connections, and thermal
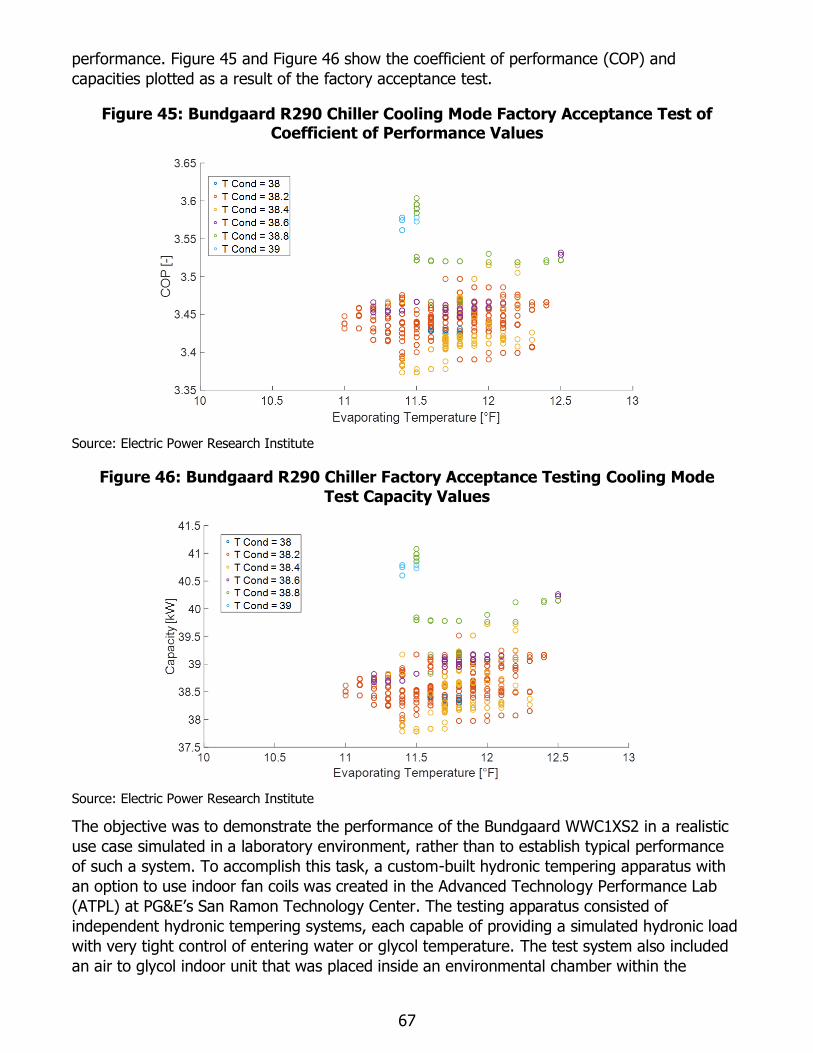
67
performance. Figure 45 and Figure 46 show the coefficient of performance (COP) and
capacities plotted as a result of the factory acceptance test.
Figure 45: Bundgaard R290 Chiller Cooling Mode Factory Acceptance Test of Coefficient of Performance Values
Source: Electric Power Research Institute
Figure 46: Bundgaard R290 Chiller Factory Acceptance Testing Cooling Mode
Test Capacity Values
Source: Electric Power Research Institute
The objective was to demonstrate the performance of the Bundgaard WWC1XS2 in a realistic
use case simulated in a laboratory environment, rather than to establish typical performance
of such a system. To accomplish this task, a custom-built hydronic tempering apparatus with
an option to use indoor fan coils was created in the Advanced Technology Performance Lab
(ATPL) at PG&E’s San Ramon Technology Center. The testing apparatus consisted of
independent hydronic tempering systems, each capable of providing a simulated hydronic load
with very tight control of entering water or glycol temperature. The test system also included
an air to glycol indoor unit that was placed inside an environmental chamber within the
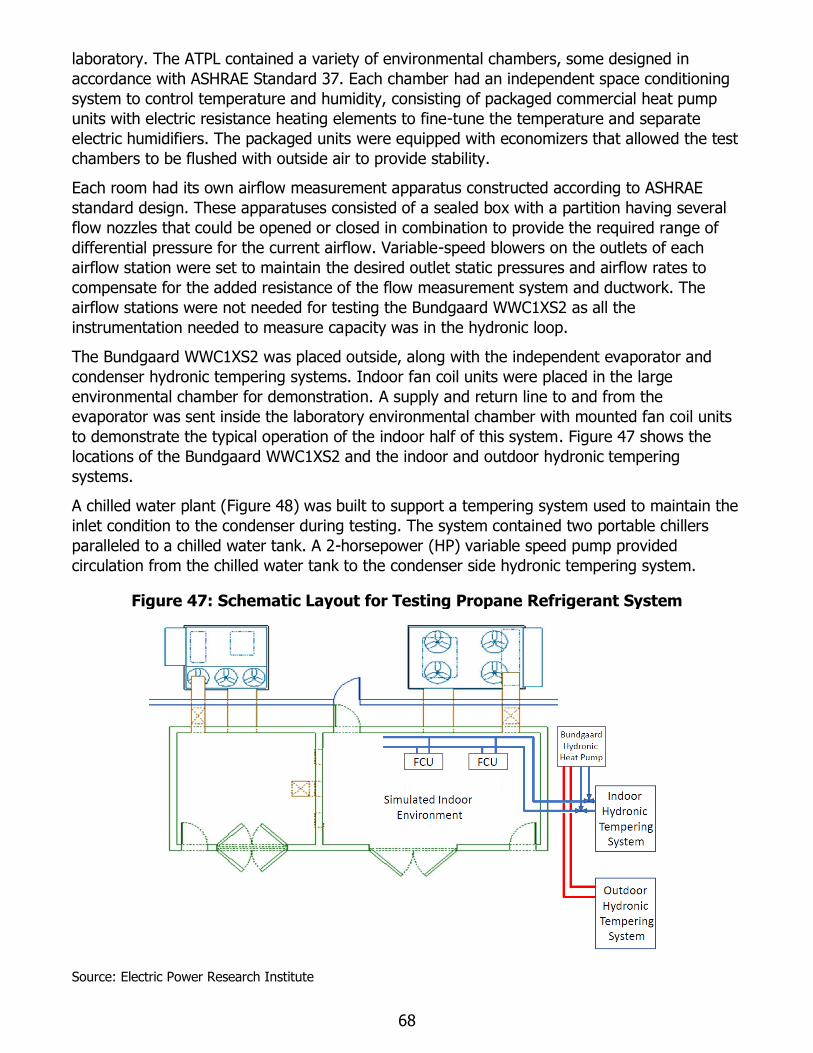
68
laboratory. The ATPL contained a variety of environmental chambers, some designed in
accordance with ASHRAE Standard 37. Each chamber had an independent space conditioning
system to control temperature and humidity, consisting of packaged commercial heat pump
units with electric resistance heating elements to fine-tune the temperature and separate
electric humidifiers. The packaged units were equipped with economizers that allowed the test
chambers to be flushed with outside air to provide stability.
Each room had its own airflow measurement apparatus constructed according to ASHRAE
standard design. These apparatuses consisted of a sealed box with a partition having several
flow nozzles that could be opened or closed in combination to provide the required range of
differential pressure for the current airflow. Variable-speed blowers on the outlets of each
airflow station were set to maintain the desired outlet static pressures and airflow rates to
compensate for the added resistance of the flow measurement system and ductwork. The
airflow stations were not needed for testing the Bundgaard WWC1XS2 as all the
instrumentation needed to measure capacity was in the hydronic loop.
The Bundgaard WWC1XS2 was placed outside, along with the independent evaporator and
condenser hydronic tempering systems. Indoor fan coil units were placed in the large
environmental chamber for demonstration. A supply and return line to and from the
evaporator was sent inside the laboratory environmental chamber with mounted fan coil units
to demonstrate the typical operation of the indoor half of this system. Figure 47 shows the
locations of the Bundgaard WWC1XS2 and the indoor and outdoor hydronic tempering
systems.
A chilled water plant (Figure 48) was built to support a tempering system used to maintain the
inlet condition to the condenser during testing. The system contained two portable chillers
paralleled to a chilled water tank. A 2-horsepower (HP) variable speed pump provided
circulation from the chilled water tank to the condenser side hydronic tempering system.
Figure 47: Schematic Layout for Testing Propane Refrigerant System
Source: Electric Power Research Institute
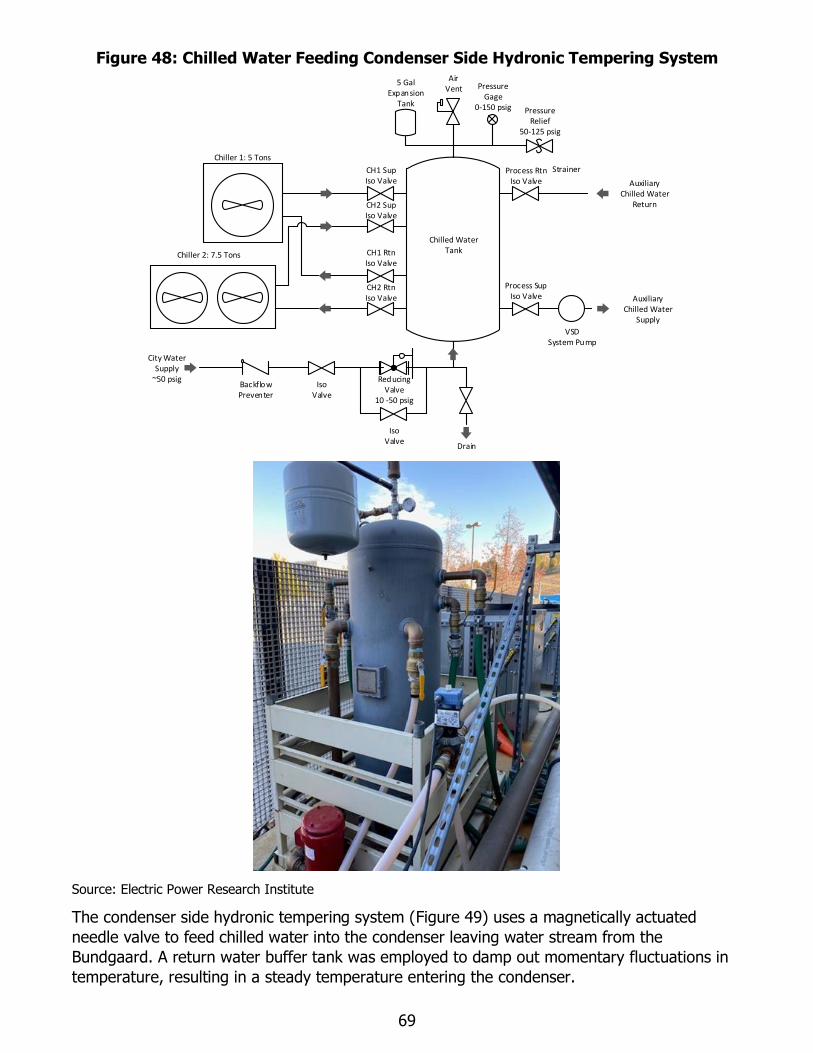
69
Figure 48: Chilled Water Feeding Condenser Side Hydronic Tempering System
Source: Electric Power Research Institute
The condenser side hydronic tempering system (Figure 49) uses a magnetically actuated
needle valve to feed chilled water into the condenser leaving water stream from the
Bundgaard. A return water buffer tank was employed to damp out momentary fluctuations in
temperature, resulting in a steady temperature entering the condenser.
Backflow Preventer
Iso Valve
Reducing Valve
10 -50 psig
Drain
CH1 Sup Iso Valve
CH2 Sup Iso Valve
CH1 Rtn Iso Valve
CH2 Rtn Iso Valve
City Water Supply
~50 psig
5 GalExpansion
Tank
Air Vent
Pressure Relief
50-125 psig
Chilled Water Tank
Process SupIso Valve
Process RtnIso Valve
Chiller 1: 5 Tons
Chiller 2: 7.5 Tons
Iso Valve
Auxiliary Chilled Water
Return
VSD System Pump
Pressure Gage
0-150 psig
Auxiliary Chilled Water
Supply
Strainer
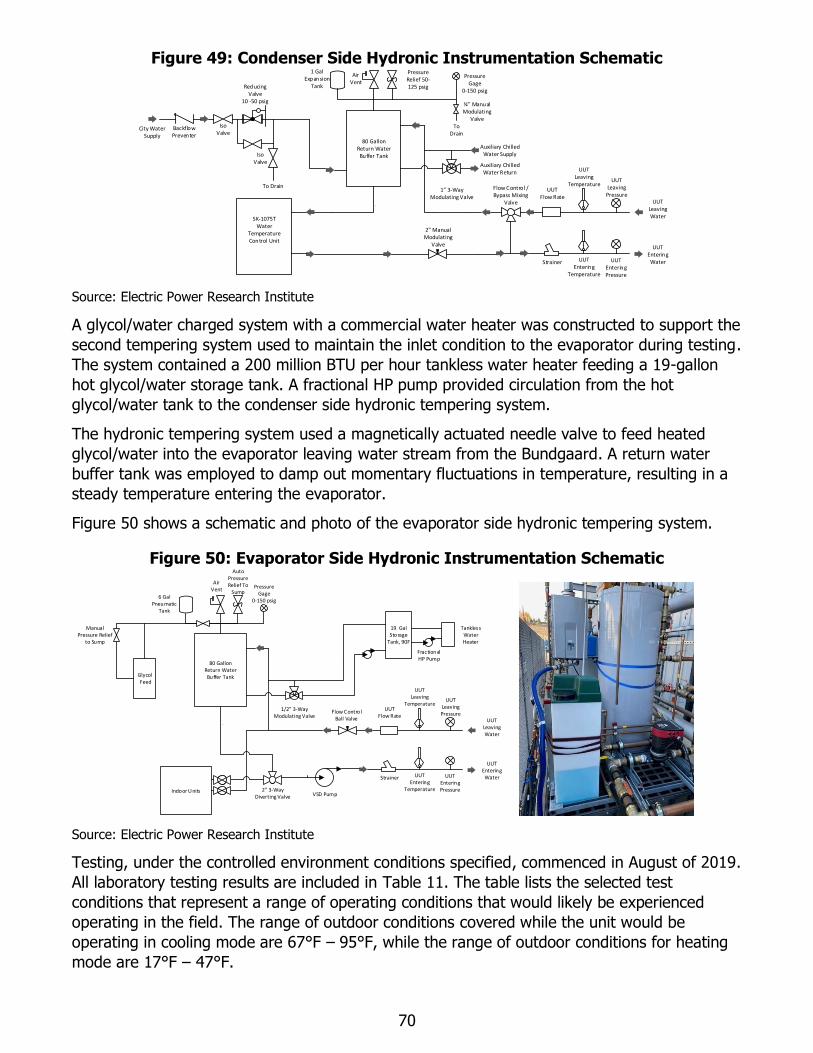
70
Figure 49: Condenser Side Hydronic Instrumentation Schematic
Source: Electric Power Research Institute
A glycol/water charged system with a commercial water heater was constructed to support the
second tempering system used to maintain the inlet condition to the evaporator during testing.
The system contained a 200 million BTU per hour tankless water heater feeding a 19-gallon
hot glycol/water storage tank. A fractional HP pump provided circulation from the hot
glycol/water tank to the condenser side hydronic tempering system.
The hydronic tempering system used a magnetically actuated needle valve to feed heated
glycol/water into the evaporator leaving water stream from the Bundgaard. A return water
buffer tank was employed to damp out momentary fluctuations in temperature, resulting in a
steady temperature entering the evaporator.
Figure 50 shows a schematic and photo of the evaporator side hydronic tempering system.
Figure 50: Evaporator Side Hydronic Instrumentation Schematic
Source: Electric Power Research Institute
Testing, under the controlled environment conditions specified, commenced in August of 2019.
All laboratory testing results are included in Table 11. The table lists the selected test
conditions that represent a range of operating conditions that would likely be experienced
operating in the field. The range of outdoor conditions covered while the unit would be
operating in cooling mode are 67°F – 95°F, while the range of outdoor conditions for heating
mode are 17°F – 47°F.
Auxiliary Chilled Water Return
Auxiliary Chilled Water Supply
1” 3-Way Modulating Valve
SK-1075TWater
Temperature Control Unit
UUTLeaving Water
UUTEntering Water
UUTLeaving
Temperature
UUTEntering
Temperature
UUTEnteringPressure
UUTLeavingPressure
UUTFlow Rate
Flow Control /Bypass Mixing
Valve
2" Manual Modulating
Valve
¾” Manual Modulating
ValveTo
Drain
Air Vent
City WaterSupply
Strainer
Backflow Preventer
Iso Valve
Reducing Valve
10 -50 psig
Iso Valve
Pressure Gage
0-150 psig
1 GalExpansion
Tank
Pressure Relief 50-125 psig
80 Gallon Return WaterBuffer Tank
To Drain
1/2” 3-Way Modulating Valve
UUTLeaving Water
UUTEntering Water
UUTLeaving
Temperature
UUTEntering
Temperature
UUTEnteringPressure
UUTLeavingPressure
UUTFlow Rate
Flow Control Ball Valve
Air Vent
Strainer
Pressure Gage
0-150 psig6 Gal
Pneumatic Tank
Auto Pressure Relief To
Sump
80 Gallon Return WaterBuffer TankGlycol
Feed
2” 3-Way Diverting Valve VSD Pump
Indoor Units
19 Gal Storage
Tank, 90F
Tankless Water Heater
Fractional HP Pump
Manual Pressure Relief
to Sump
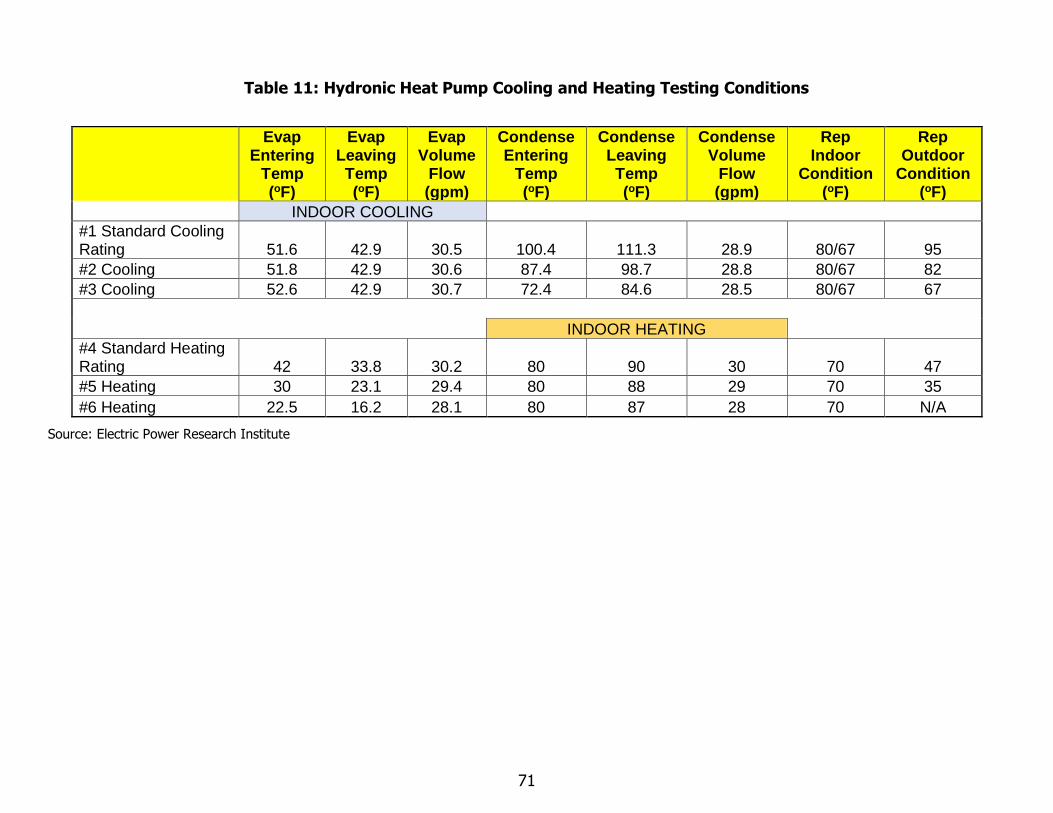
71
Table 11: Hydronic Heat Pump Cooling and Heating Testing Conditions
Evap Entering
Temp (oF)
Evap Leaving Temp (oF)
Evap Volume
Flow (gpm)
Condense Entering
Temp (oF)
Condense Leaving Temp (oF)
Condense Volume
Flow (gpm)
Rep Indoor
Condition (oF)
Rep Outdoor
Condition (oF)
INDOOR COOLING
#1 Standard Cooling Rating 51.6 42.9 30.5 100.4 111.3 28.9 80/67 95
#2 Cooling 51.8 42.9 30.6 87.4 98.7 28.8 80/67 82
#3 Cooling 52.6 42.9 30.7 72.4 84.6 28.5 80/67 67
INDOOR HEATING
#4 Standard Heating Rating 42 33.8 30.2 80 90 30 70 47
#5 Heating 30 23.1 29.4 80 88 29 70 35
#6 Heating 22.5 16.2 28.1 80 87 28 70 N/A
Source: Electric Power Research Institute
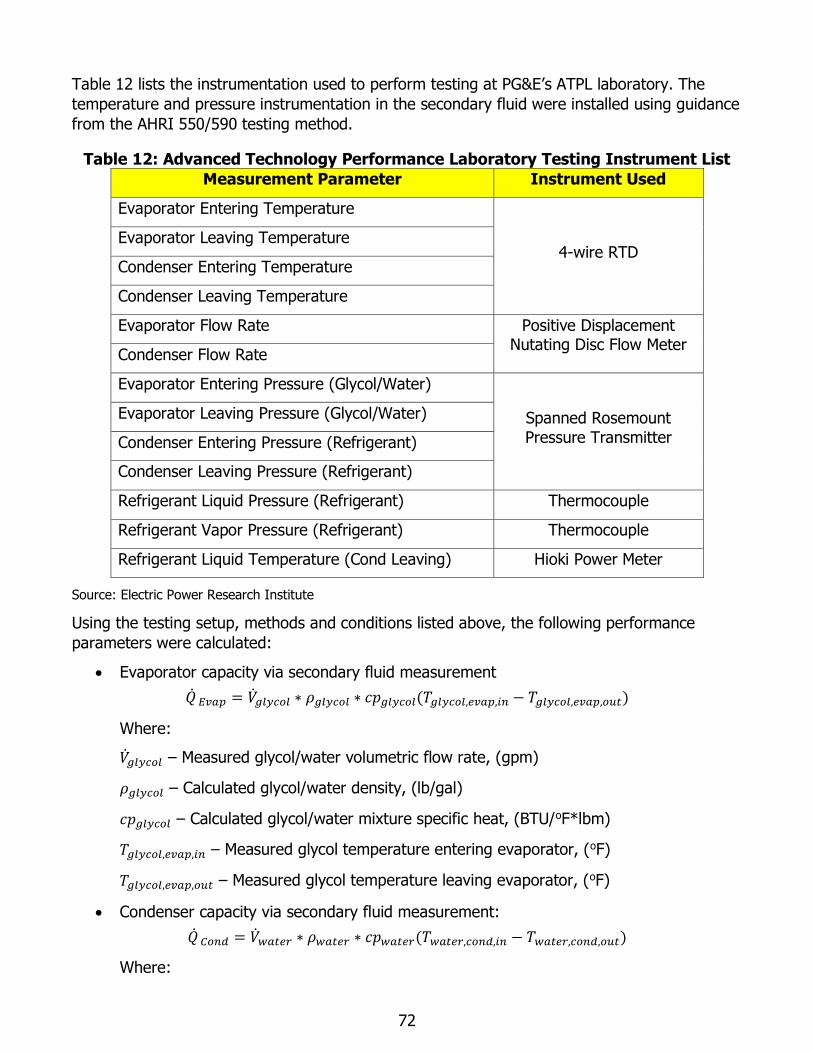
72
Table 12 lists the instrumentation used to perform testing at PG&E’s ATPL laboratory. The
temperature and pressure instrumentation in the secondary fluid were installed using guidance
from the AHRI 550/590 testing method.
Table 12: Advanced Technology Performance Laboratory Testing Instrument List
Measurement Parameter Instrument Used
Evaporator Entering Temperature
4-wire RTD Evaporator Leaving Temperature
Condenser Entering Temperature
Condenser Leaving Temperature
Evaporator Flow Rate Positive Displacement Nutating Disc Flow Meter
Condenser Flow Rate
Evaporator Entering Pressure (Glycol/Water)
Spanned Rosemount
Pressure Transmitter
Evaporator Leaving Pressure (Glycol/Water)
Condenser Entering Pressure (Refrigerant)
Condenser Leaving Pressure (Refrigerant)
Refrigerant Liquid Pressure (Refrigerant) Thermocouple
Refrigerant Vapor Pressure (Refrigerant) Thermocouple
Refrigerant Liquid Temperature (Cond Leaving) Hioki Power Meter
Source: Electric Power Research Institute
Using the testing setup, methods and conditions listed above, the following performance
parameters were calculated:
• Evaporator capacity via secondary fluid measurement
�̇� 𝐸𝑣𝑎𝑝 = �̇�𝑔𝑙𝑦𝑐𝑜𝑙 ∗ 𝜌𝑔𝑙𝑦𝑐𝑜𝑙 ∗ 𝑐𝑝𝑔𝑙𝑦𝑐𝑜𝑙(𝑇𝑔𝑙𝑦𝑐𝑜𝑙,𝑒𝑣𝑎𝑝,𝑖𝑛 − 𝑇𝑔𝑙𝑦𝑐𝑜𝑙,𝑒𝑣𝑎𝑝,𝑜𝑢𝑡)
Where:
�̇�𝑔𝑙𝑦𝑐𝑜𝑙 – Measured glycol/water volumetric flow rate, (gpm)
𝜌𝑔𝑙𝑦𝑐𝑜𝑙 – Calculated glycol/water density, (lb/gal)
𝑐𝑝𝑔𝑙𝑦𝑐𝑜𝑙 – Calculated glycol/water mixture specific heat, (BTU/oF*lbm)
𝑇𝑔𝑙𝑦𝑐𝑜𝑙,𝑒𝑣𝑎𝑝,𝑖𝑛 – Measured glycol temperature entering evaporator, (oF)
𝑇𝑔𝑙𝑦𝑐𝑜𝑙,𝑒𝑣𝑎𝑝,𝑜𝑢𝑡 – Measured glycol temperature leaving evaporator, (oF)
• Condenser capacity via secondary fluid measurement:
�̇� 𝐶𝑜𝑛𝑑 = �̇�𝑤𝑎𝑡𝑒𝑟 ∗ 𝜌𝑤𝑎𝑡𝑒𝑟 ∗ 𝑐𝑝𝑤𝑎𝑡𝑒𝑟(𝑇𝑤𝑎𝑡𝑒𝑟,𝑐𝑜𝑛𝑑,𝑖𝑛 − 𝑇𝑤𝑎𝑡𝑒𝑟,𝑐𝑜𝑛𝑑,𝑜𝑢𝑡)
Where:
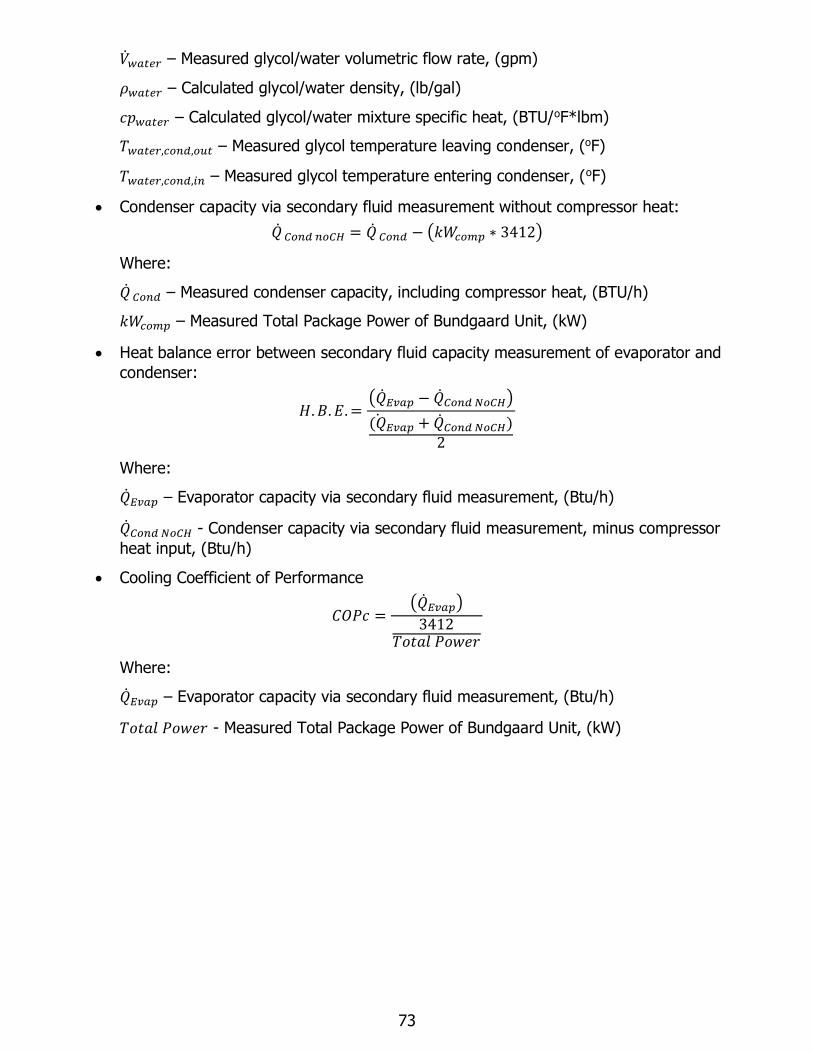
73
�̇�𝑤𝑎𝑡𝑒𝑟 – Measured glycol/water volumetric flow rate, (gpm)
𝜌𝑤𝑎𝑡𝑒𝑟 – Calculated glycol/water density, (lb/gal)
𝑐𝑝𝑤𝑎𝑡𝑒𝑟 – Calculated glycol/water mixture specific heat, (BTU/oF*lbm)
𝑇𝑤𝑎𝑡𝑒𝑟,𝑐𝑜𝑛𝑑,𝑜𝑢𝑡 – Measured glycol temperature leaving condenser, (oF)
𝑇𝑤𝑎𝑡𝑒𝑟,𝑐𝑜𝑛𝑑,𝑖𝑛 – Measured glycol temperature entering condenser, (oF)
• Condenser capacity via secondary fluid measurement without compressor heat:
�̇� 𝐶𝑜𝑛𝑑 𝑛𝑜𝐶𝐻 = �̇� 𝐶𝑜𝑛𝑑 − (𝑘𝑊𝑐𝑜𝑚𝑝 ∗ 3412)
Where:
�̇� 𝐶𝑜𝑛𝑑 – Measured condenser capacity, including compressor heat, (BTU/h)
𝑘𝑊𝑐𝑜𝑚𝑝 – Measured Total Package Power of Bundgaard Unit, (kW)
• Heat balance error between secondary fluid capacity measurement of evaporator and
condenser:
𝐻. 𝐵. 𝐸. =(�̇�𝐸𝑣𝑎𝑝 − �̇�𝐶𝑜𝑛𝑑 𝑁𝑜𝐶𝐻)
(�̇�𝐸𝑣𝑎𝑝 + �̇�𝐶𝑜𝑛𝑑 𝑁𝑜𝐶𝐻)2
Where:
�̇�𝐸𝑣𝑎𝑝 – Evaporator capacity via secondary fluid measurement, (Btu/h)
�̇�𝐶𝑜𝑛𝑑 𝑁𝑜𝐶𝐻 - Condenser capacity via secondary fluid measurement, minus compressor
heat input, (Btu/h)
• Cooling Coefficient of Performance
𝐶𝑂𝑃𝑐 =(�̇�𝐸𝑣𝑎𝑝)
3412𝑇𝑜𝑡𝑎𝑙 𝑃𝑜𝑤𝑒𝑟
Where:
�̇�𝐸𝑣𝑎𝑝 – Evaporator capacity via secondary fluid measurement, (Btu/h)
𝑇𝑜𝑡𝑎𝑙 𝑃𝑜𝑤𝑒𝑟 - Measured Total Package Power of Bundgaard Unit, (kW)
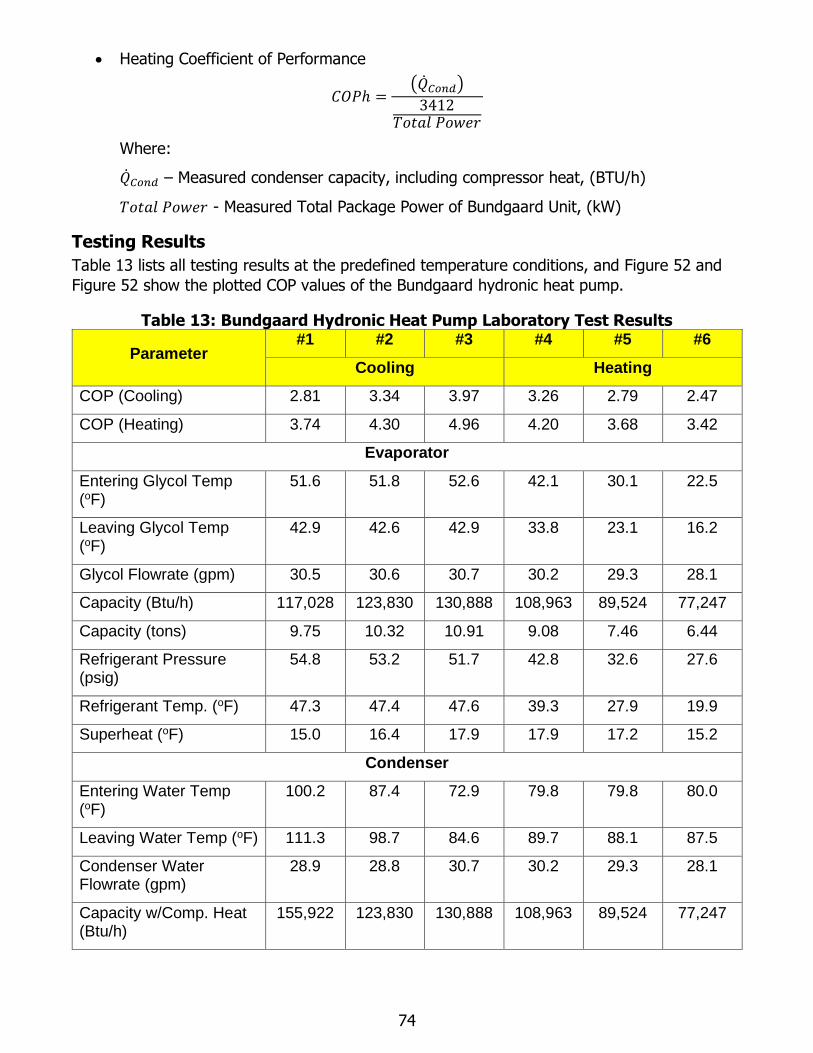
74
• Heating Coefficient of Performance
𝐶𝑂𝑃ℎ =(�̇�𝐶𝑜𝑛𝑑)
3412𝑇𝑜𝑡𝑎𝑙 𝑃𝑜𝑤𝑒𝑟
Where:
�̇�𝐶𝑜𝑛𝑑 – Measured condenser capacity, including compressor heat, (BTU/h)
𝑇𝑜𝑡𝑎𝑙 𝑃𝑜𝑤𝑒𝑟 - Measured Total Package Power of Bundgaard Unit, (kW)
Testing Results
Table 13 lists all testing results at the predefined temperature conditions, and Figure 52 and
Figure 52 show the plotted COP values of the Bundgaard hydronic heat pump.
Table 13: Bundgaard Hydronic Heat Pump Laboratory Test Results
Parameter #1 #2 #3 #4 #5 #6
Cooling Heating
COP (Cooling) 2.81 3.34 3.97 3.26 2.79 2.47
COP (Heating) 3.74 4.30 4.96 4.20 3.68 3.42
Evaporator
Entering Glycol Temp (oF)
51.6 51.8 52.6 42.1 30.1 22.5
Leaving Glycol Temp (oF)
42.9 42.6 42.9 33.8 23.1 16.2
Glycol Flowrate (gpm) 30.5 30.6 30.7 30.2 29.3 28.1
Capacity (Btu/h) 117,028 123,830 130,888 108,963 89,524 77,247
Capacity (tons) 9.75 10.32 10.91 9.08 7.46 6.44
Refrigerant Pressure (psig)
54.8 53.2 51.7 42.8 32.6 27.6
Refrigerant Temp. (oF) 47.3 47.4 47.6 39.3 27.9 19.9
Superheat (oF) 15.0 16.4 17.9 17.9 17.2 15.2
Condenser
Entering Water Temp (oF)
100.2 87.4 72.9 79.8 79.8 80.0
Leaving Water Temp (oF) 111.3 98.7 84.6 89.7 88.1 87.5
Condenser Water Flowrate (gpm)
28.9 28.8 30.7 30.2 29.3 28.1
Capacity w/Comp. Heat (Btu/h)
155,922 123,830 130,888 108,963 89,524 77,247
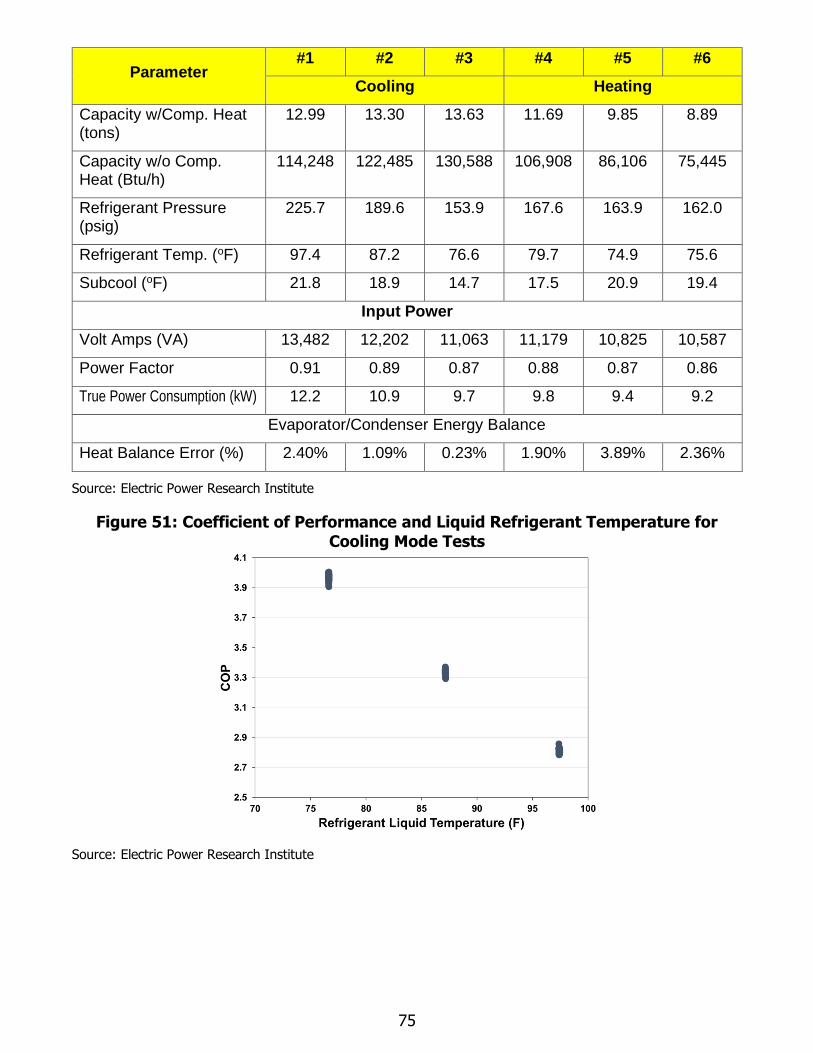
75
Parameter #1 #2 #3 #4 #5 #6
Cooling Heating
Capacity w/Comp. Heat (tons)
12.99 13.30 13.63 11.69 9.85 8.89
Capacity w/o Comp. Heat (Btu/h)
114,248 122,485 130,588 106,908 86,106 75,445
Refrigerant Pressure (psig)
225.7 189.6 153.9 167.6 163.9 162.0
Refrigerant Temp. (oF) 97.4 87.2 76.6 79.7 74.9 75.6
Subcool (oF) 21.8 18.9 14.7 17.5 20.9 19.4
Input Power
Volt Amps (VA) 13,482 12,202 11,063 11,179 10,825 10,587
Power Factor 0.91 0.89 0.87 0.88 0.87 0.86
True Power Consumption (kW) 12.2 10.9 9.7 9.8 9.4 9.2
Evaporator/Condenser Energy Balance
Heat Balance Error (%) 2.40% 1.09% 0.23% 1.90% 3.89% 2.36%
Source: Electric Power Research Institute
Figure 51: Coefficient of Performance and Liquid Refrigerant Temperature for
Cooling Mode Tests
Source: Electric Power Research Institute
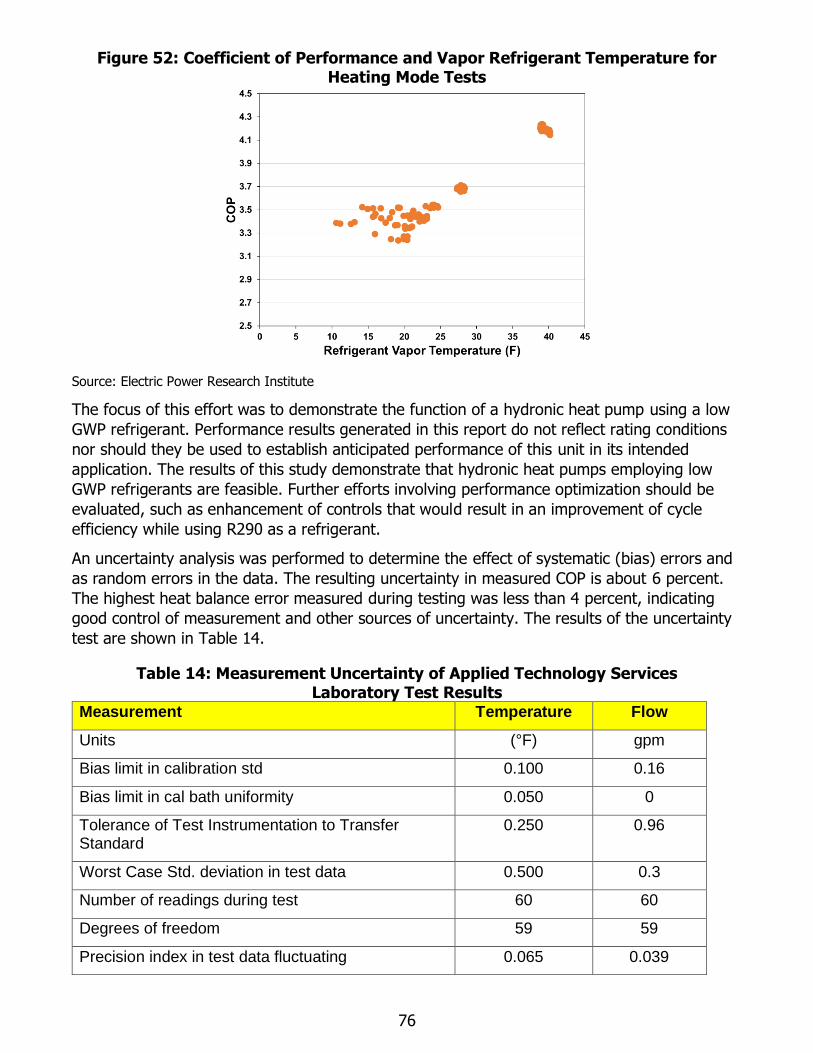
76
Figure 52: Coefficient of Performance and Vapor Refrigerant Temperature for Heating Mode Tests
Source: Electric Power Research Institute
The focus of this effort was to demonstrate the function of a hydronic heat pump using a low
GWP refrigerant. Performance results generated in this report do not reflect rating conditions
nor should they be used to establish anticipated performance of this unit in its intended
application. The results of this study demonstrate that hydronic heat pumps employing low
GWP refrigerants are feasible. Further efforts involving performance optimization should be
evaluated, such as enhancement of controls that would result in an improvement of cycle
efficiency while using R290 as a refrigerant.
An uncertainty analysis was performed to determine the effect of systematic (bias) errors and
as random errors in the data. The resulting uncertainty in measured COP is about 6 percent.
The highest heat balance error measured during testing was less than 4 percent, indicating
good control of measurement and other sources of uncertainty. The results of the uncertainty
test are shown in Table 14.
Table 14: Measurement Uncertainty of Applied Technology Services Laboratory Test Results
Measurement Temperature Flow
Units (°F) gpm
Bias limit in calibration std 0.100 0.16
Bias limit in cal bath uniformity 0.050 0
Tolerance of Test Instrumentation to Transfer Standard
0.250 0.96
Worst Case Std. deviation in test data 0.500 0.3
Number of readings during test 60 60
Degrees of freedom 59 59
Precision index in test data fluctuating 0.065 0.039
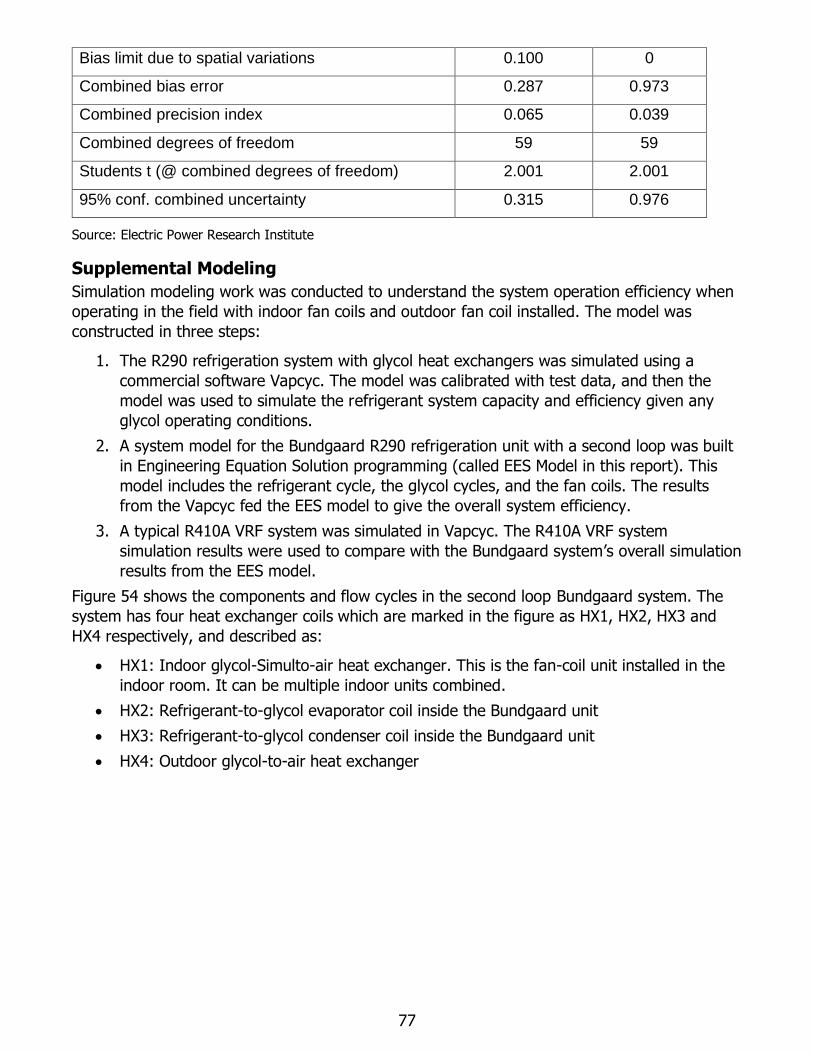
77
Bias limit due to spatial variations 0.100 0
Combined bias error 0.287 0.973
Combined precision index 0.065 0.039
Combined degrees of freedom 59 59
Students t (@ combined degrees of freedom) 2.001 2.001
95% conf. combined uncertainty 0.315 0.976
Source: Electric Power Research Institute
Supplemental Modeling
Simulation modeling work was conducted to understand the system operation efficiency when
operating in the field with indoor fan coils and outdoor fan coil installed. The model was
constructed in three steps:
1. The R290 refrigeration system with glycol heat exchangers was simulated using a
commercial software Vapcyc. The model was calibrated with test data, and then the
model was used to simulate the refrigerant system capacity and efficiency given any
glycol operating conditions.
2. A system model for the Bundgaard R290 refrigeration unit with a second loop was built
in Engineering Equation Solution programming (called EES Model in this report). This
model includes the refrigerant cycle, the glycol cycles, and the fan coils. The results
from the Vapcyc fed the EES model to give the overall system efficiency.
3. A typical R410A VRF system was simulated in Vapcyc. The R410A VRF system
simulation results were used to compare with the Bundgaard system’s overall simulation
results from the EES model.
Figure 54 shows the components and flow cycles in the second loop Bundgaard system. The
system has four heat exchanger coils which are marked in the figure as HX1, HX2, HX3 and
HX4 respectively, and described as:
• HX1: Indoor glycol-Simulto-air heat exchanger. This is the fan-coil unit installed in the
indoor room. It can be multiple indoor units combined.
• HX2: Refrigerant-to-glycol evaporator coil inside the Bundgaard unit
• HX3: Refrigerant-to-glycol condenser coil inside the Bundgaard unit
• HX4: Outdoor glycol-to-air heat exchanger
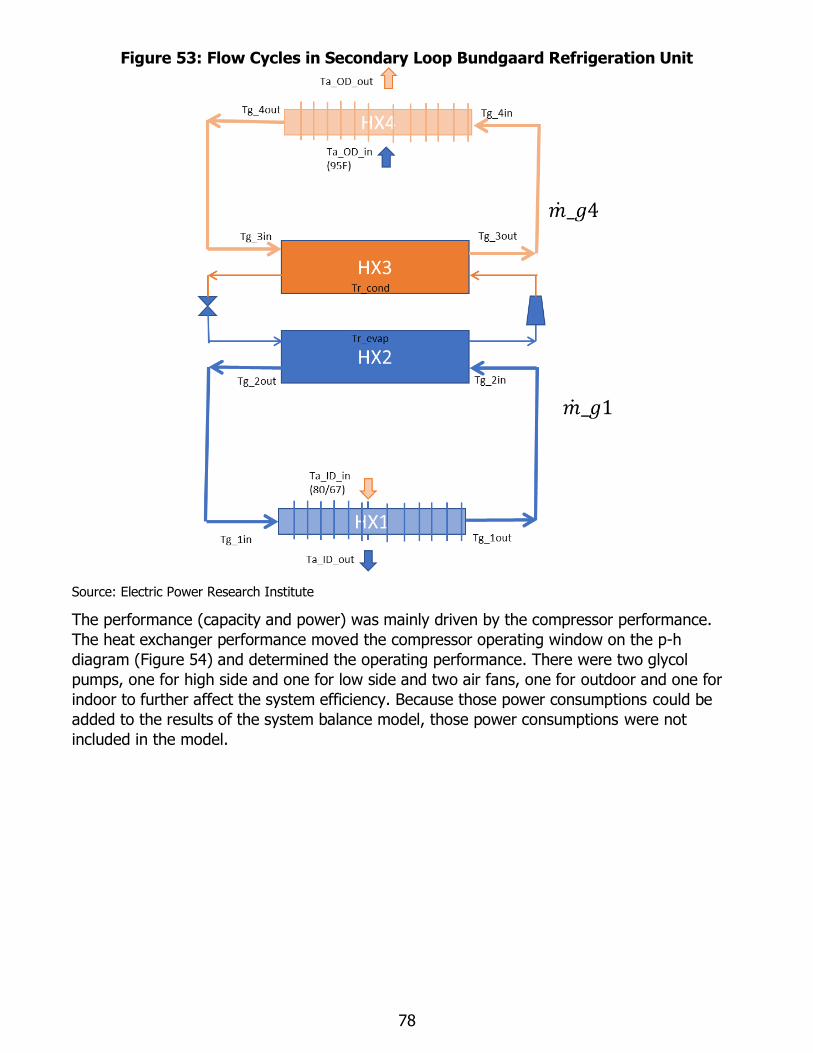
78
Figure 53: Flow Cycles in Secondary Loop Bundgaard Refrigeration Unit
Source: Electric Power Research Institute
The performance (capacity and power) was mainly driven by the compressor performance.
The heat exchanger performance moved the compressor operating window on the p-h
diagram (Figure 54) and determined the operating performance. There were two glycol
pumps, one for high side and one for low side and two air fans, one for outdoor and one for
indoor to further affect the system efficiency. Because those power consumptions could be
added to the results of the system balance model, those power consumptions were not
included in the model.
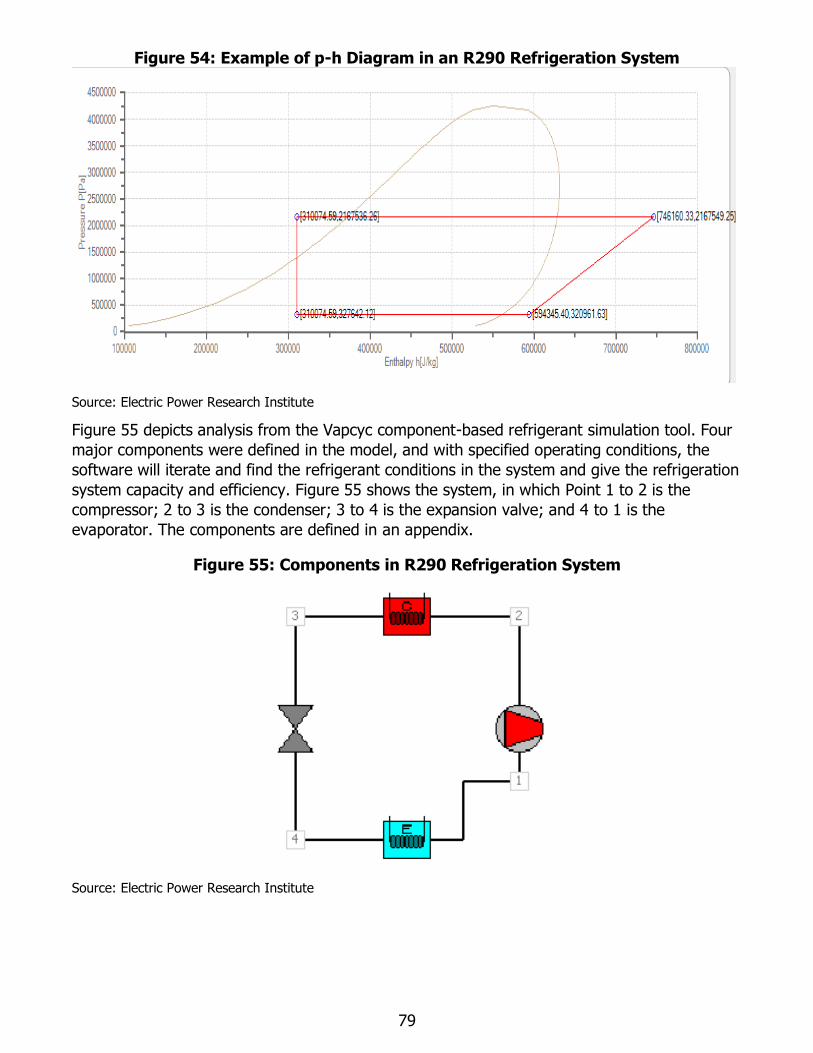
79
Figure 54: Example of p-h Diagram in an R290 Refrigeration System
Source: Electric Power Research Institute
Figure 55 depicts analysis from the Vapcyc component-based refrigerant simulation tool. Four
major components were defined in the model, and with specified operating conditions, the
software will iterate and find the refrigerant conditions in the system and give the refrigeration
system capacity and efficiency. Figure 55 shows the system, in which Point 1 to 2 is the
compressor; 2 to 3 is the condenser; 3 to 4 is the expansion valve; and 4 to 1 is the
evaporator. The components are defined in an appendix.
Figure 55: Components in R290 Refrigeration System
Source: Electric Power Research Institute
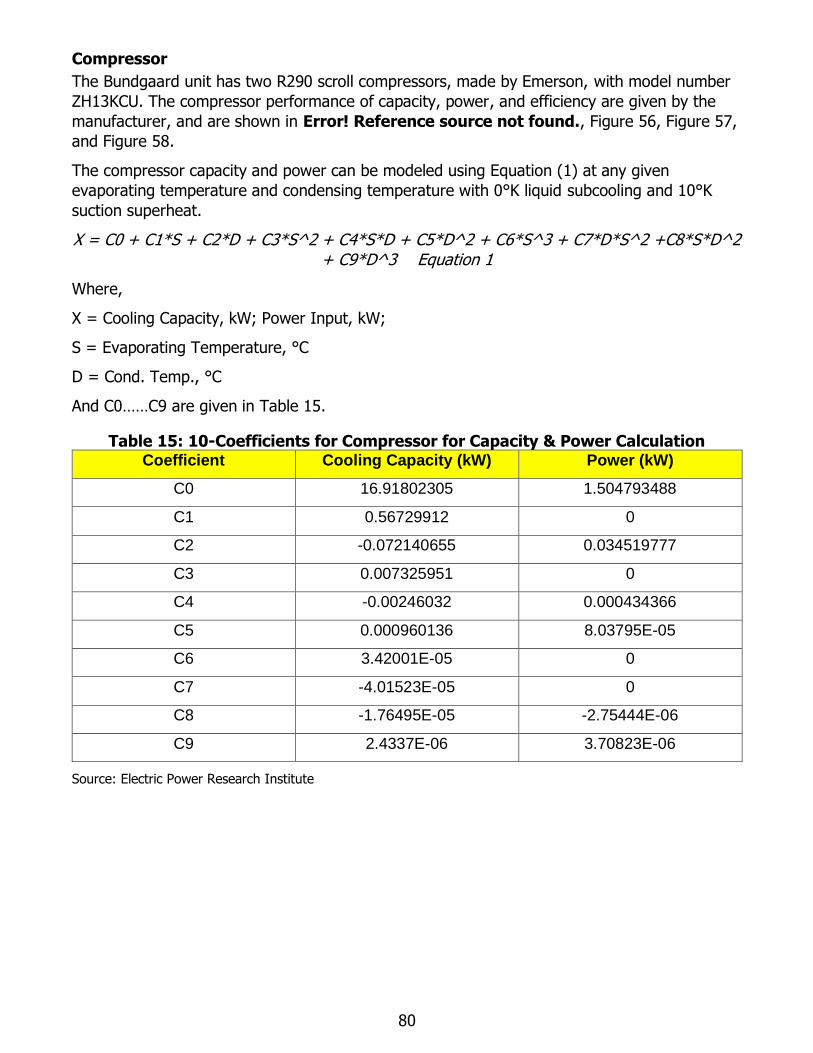
80
Compressor
The Bundgaard unit has two R290 scroll compressors, made by Emerson, with model number
ZH13KCU. The compressor performance of capacity, power, and efficiency are given by the
manufacturer, and are shown in Error! Reference source not found., Figure 56, Figure 57,
and Figure 58.
The compressor capacity and power can be modeled using Equation (1) at any given
evaporating temperature and condensing temperature with 0°K liquid subcooling and 10°K
suction superheat.
X = C0 + C1*S + C2*D + C3*S^2 + C4*S*D + C5*D^2 + C6*S^3 + C7*D*S^2 +C8*S*D^2 + C9*D^3 Equation 1
Where,
X = Cooling Capacity, kW; Power Input, kW;
S = Evaporating Temperature, °C
D = Cond. Temp., °C
And C0……C9 are given in Table 15.
Table 15: 10-Coefficients for Compressor for Capacity & Power Calculation Coefficient Cooling Capacity (kW) Power (kW)
C0 16.91802305 1.504793488
C1 0.56729912 0
C2 -0.072140655 0.034519777
C3 0.007325951 0
C4 -0.00246032 0.000434366
C5 0.000960136 8.03795E-05
C6 3.42001E-05 0
C7 -4.01523E-05 0
C8 -1.76495E-05 -2.75444E-06
C9 2.4337E-06 3.70823E-06
Source: Electric Power Research Institute
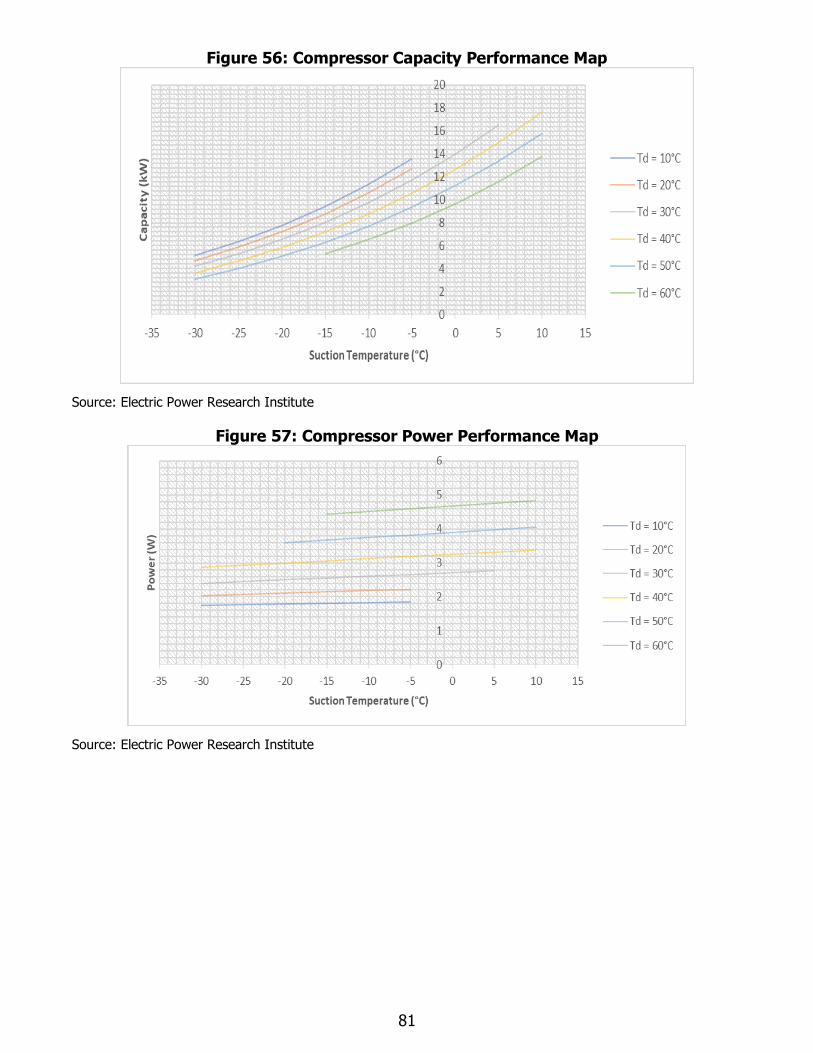
81
Figure 56: Compressor Capacity Performance Map
Source: Electric Power Research Institute
Figure 57: Compressor Power Performance Map
Source: Electric Power Research Institute
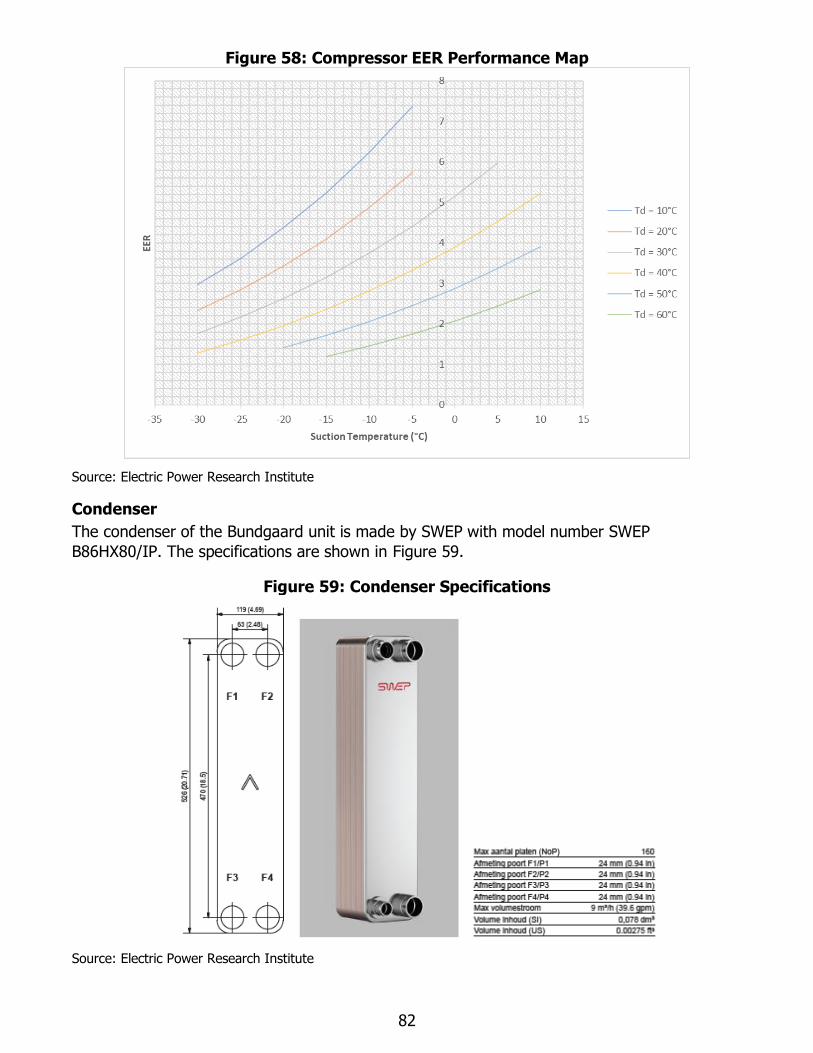
82
Figure 58: Compressor EER Performance Map
Source: Electric Power Research Institute
Condenser
The condenser of the Bundgaard unit is made by SWEP with model number SWEP
B86HX80/IP. The specifications are shown in Figure 59.
Figure 59: Condenser Specifications
Source: Electric Power Research Institute
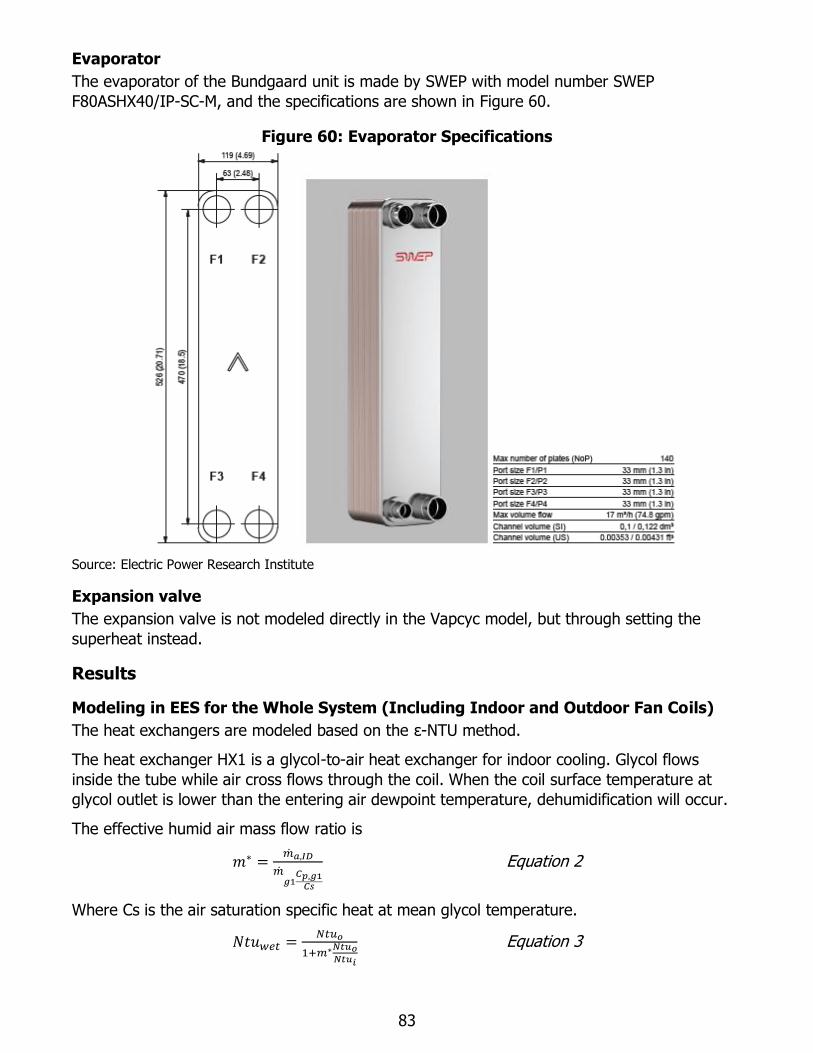
83
Evaporator
The evaporator of the Bundgaard unit is made by SWEP with model number SWEP
F80ASHX40/IP-SC-M, and the specifications are shown in Figure 60.
Figure 60: Evaporator Specifications
Source: Electric Power Research Institute
Expansion valve
The expansion valve is not modeled directly in the Vapcyc model, but through setting the
superheat instead.
Results
Modeling in EES for the Whole System (Including Indoor and Outdoor Fan Coils)
The heat exchangers are modeled based on the ε-NTU method.
The heat exchanger HX1 is a glycol-to-air heat exchanger for indoor cooling. Glycol flows
inside the tube while air cross flows through the coil. When the coil surface temperature at
glycol outlet is lower than the entering air dewpoint temperature, dehumidification will occur.
The effective humid air mass flow ratio is
𝑚∗ =�̇�𝑎,𝐼𝐷
�̇�𝑔1
𝐶𝑝,𝑔1𝐶𝑠
Equation 2
Where Cs is the air saturation specific heat at mean glycol temperature.
𝑁𝑡𝑢𝑤𝑒𝑡 =𝑁𝑡𝑢𝑜
1+𝑚∗𝑁𝑡𝑢𝑜𝑁𝑡𝑢𝑖
Equation 3
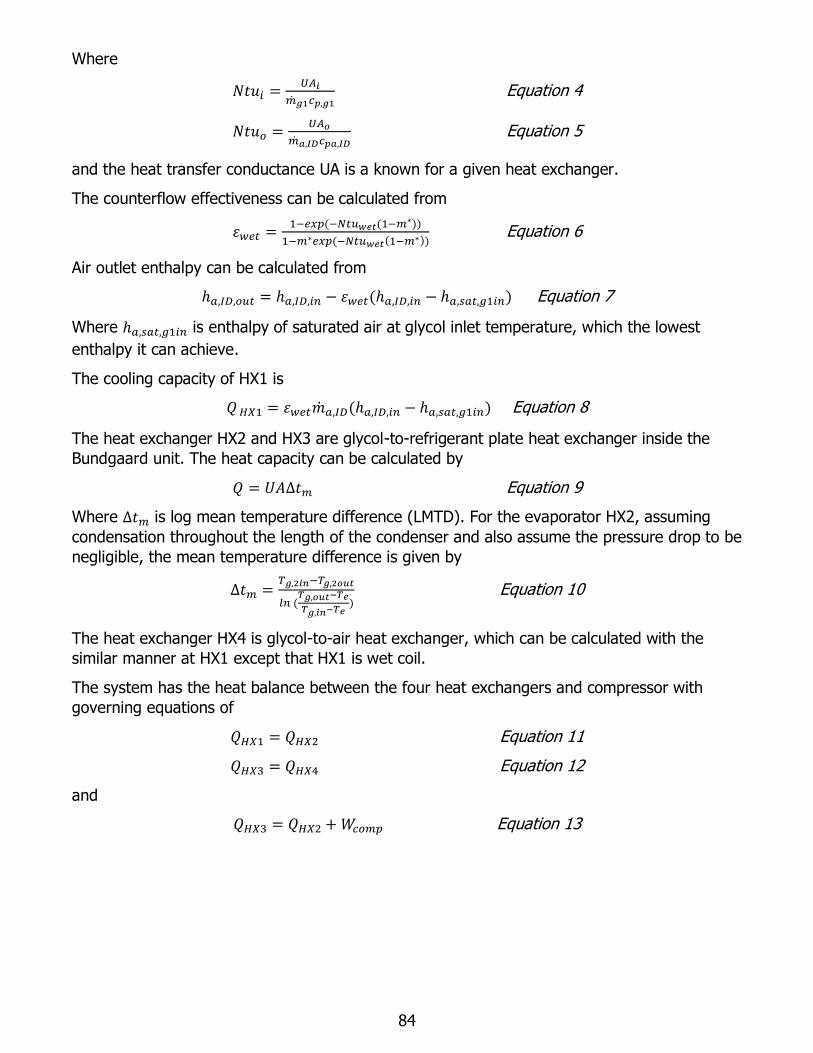
84
Where
𝑁𝑡𝑢𝑖 =𝑈𝐴𝑖
�̇�𝑔1𝑐𝑝,𝑔1 Equation 4
𝑁𝑡𝑢𝑜 =𝑈𝐴𝑜
�̇�𝑎,𝐼𝐷𝑐𝑝𝑎,𝐼𝐷 Equation 5
and the heat transfer conductance UA is a known for a given heat exchanger.
The counterflow effectiveness can be calculated from
𝜀𝑤𝑒𝑡 =1−𝑒𝑥𝑝(−𝑁𝑡𝑢𝑤𝑒𝑡(1−𝑚∗))
1−𝑚∗𝑒𝑥𝑝(−𝑁𝑡𝑢𝑤𝑒𝑡(1−𝑚∗)) Equation 6
Air outlet enthalpy can be calculated from
ℎ𝑎,𝐼𝐷,𝑜𝑢𝑡 = ℎ𝑎,𝐼𝐷,𝑖𝑛 − 𝜀𝑤𝑒𝑡(ℎ𝑎,𝐼𝐷,𝑖𝑛 − ℎ𝑎,𝑠𝑎𝑡,𝑔1𝑖𝑛) Equation 7
Where ℎ𝑎,𝑠𝑎𝑡,𝑔1𝑖𝑛 is enthalpy of saturated air at glycol inlet temperature, which the lowest
enthalpy it can achieve.
The cooling capacity of HX1 is
𝑄 𝐻𝑋1 = 𝜀𝑤𝑒𝑡�̇�𝑎,𝐼𝐷(ℎ𝑎,𝐼𝐷,𝑖𝑛 − ℎ𝑎,𝑠𝑎𝑡,𝑔1𝑖𝑛) Equation 8
The heat exchanger HX2 and HX3 are glycol-to-refrigerant plate heat exchanger inside the
Bundgaard unit. The heat capacity can be calculated by
𝑄 = 𝑈𝐴∆𝑡𝑚 Equation 9
Where ∆𝑡𝑚 is log mean temperature difference (LMTD). For the evaporator HX2, assuming
condensation throughout the length of the condenser and also assume the pressure drop to be
negligible, the mean temperature difference is given by
∆𝑡𝑚 =𝑇𝑔,2𝑖𝑛−𝑇𝑔,2𝑜𝑢𝑡
𝑙𝑛 (𝑇𝑔,𝑜𝑢𝑡−𝑇𝑒
𝑇𝑔,𝑖𝑛−𝑇𝑒) Equation 10
The heat exchanger HX4 is glycol-to-air heat exchanger, which can be calculated with the
similar manner at HX1 except that HX1 is wet coil.
The system has the heat balance between the four heat exchangers and compressor with
governing equations of
𝑄𝐻𝑋1 = 𝑄𝐻𝑋2 Equation 11
𝑄𝐻𝑋3 = 𝑄𝐻𝑋4 Equation 12
and
𝑄𝐻𝑋3 = 𝑄𝐻𝑋2 + 𝑊𝑐𝑜𝑚𝑝 Equation 13
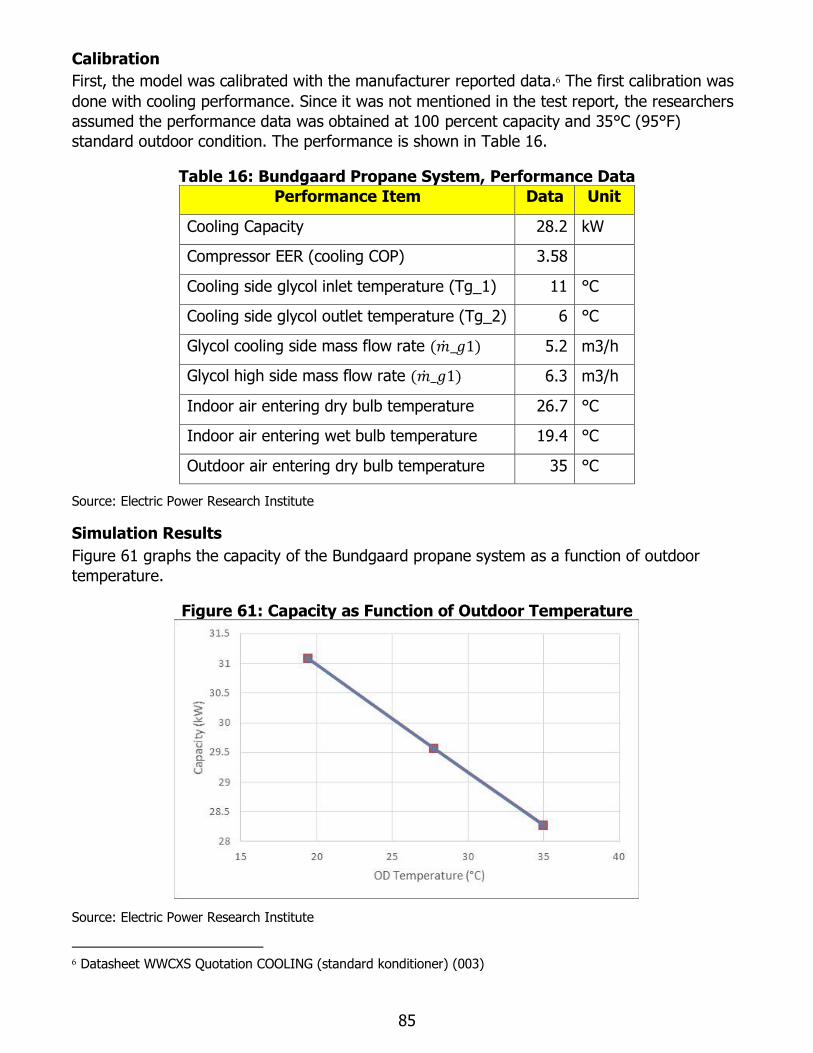
85
Calibration
First, the model was calibrated with the manufacturer reported data.6 The first calibration was
done with cooling performance. Since it was not mentioned in the test report, the researchers
assumed the performance data was obtained at 100 percent capacity and 35°C (95°F)
standard outdoor condition. The performance is shown in Table 16.
Table 16: Bundgaard Propane System, Performance Data
Performance Item Data Unit
Cooling Capacity 28.2 kW
Compressor EER (cooling COP) 3.58
Cooling side glycol inlet temperature (Tg_1) 11 °C
Cooling side glycol outlet temperature (Tg_2) 6 °C
Glycol cooling side mass flow rate (�̇�_𝑔1) 5.2 m3/h
Glycol high side mass flow rate (�̇�_𝑔1) 6.3 m3/h
Indoor air entering dry bulb temperature 26.7 °C
Indoor air entering wet bulb temperature 19.4 °C
Outdoor air entering dry bulb temperature 35 °C
Source: Electric Power Research Institute
Simulation Results
Figure 61 graphs the capacity of the Bundgaard propane system as a function of outdoor
temperature.
Figure 61: Capacity as Function of Outdoor Temperature
Source: Electric Power Research Institute
6 Datasheet WWCXS Quotation COOLING (standard konditioner) (003)
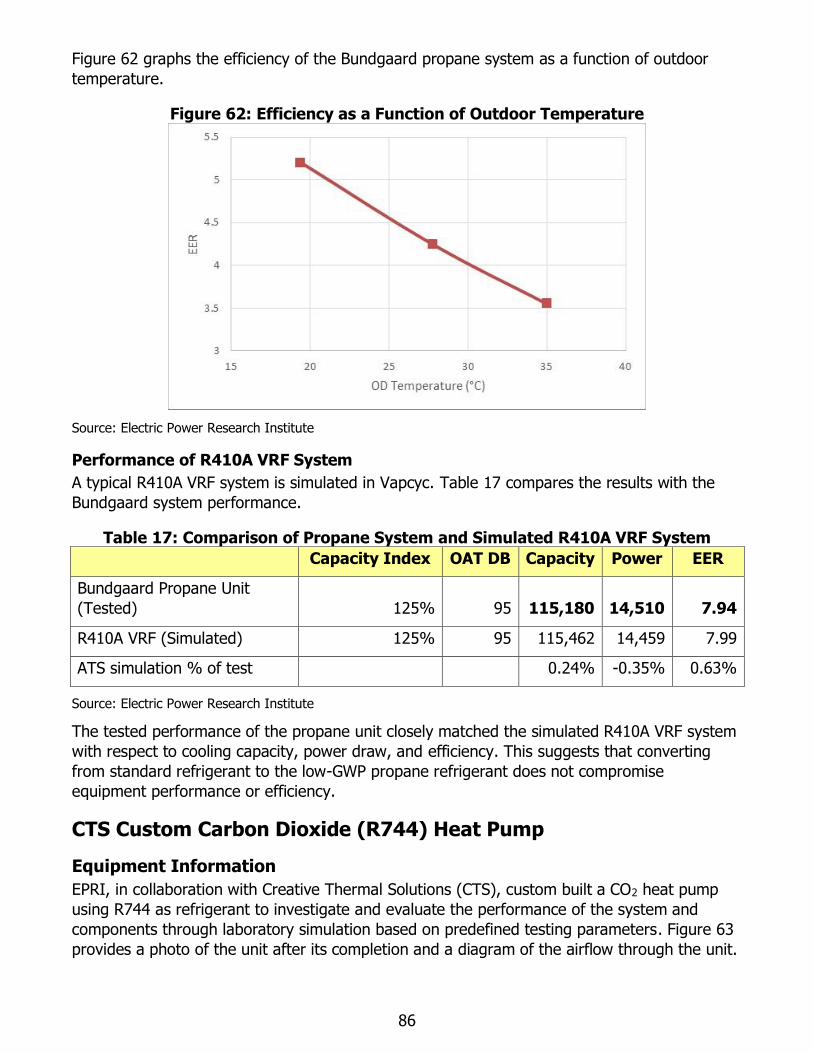
86
Figure 62 graphs the efficiency of the Bundgaard propane system as a function of outdoor
temperature.
Figure 62: Efficiency as a Function of Outdoor Temperature
Source: Electric Power Research Institute
Performance of R410A VRF System
A typical R410A VRF system is simulated in Vapcyc. Table 17 compares the results with the
Bundgaard system performance.
Table 17: Comparison of Propane System and Simulated R410A VRF System Capacity Index OAT DB Capacity Power EER
Bundgaard Propane Unit
(Tested) 125% 95 115,180 14,510 7.94
R410A VRF (Simulated) 125% 95 115,462 14,459 7.99
ATS simulation % of test 0.24% -0.35% 0.63%
Source: Electric Power Research Institute
The tested performance of the propane unit closely matched the simulated R410A VRF system
with respect to cooling capacity, power draw, and efficiency. This suggests that converting
from standard refrigerant to the low-GWP propane refrigerant does not compromise
equipment performance or efficiency.
CTS Custom Carbon Dioxide (R744) Heat Pump
Equipment Information
EPRI, in collaboration with Creative Thermal Solutions (CTS), custom built a CO2 heat pump
using R744 as refrigerant to investigate and evaluate the performance of the system and
components through laboratory simulation based on predefined testing parameters. Figure 63
provides a photo of the unit after its completion and a diagram of the airflow through the unit.
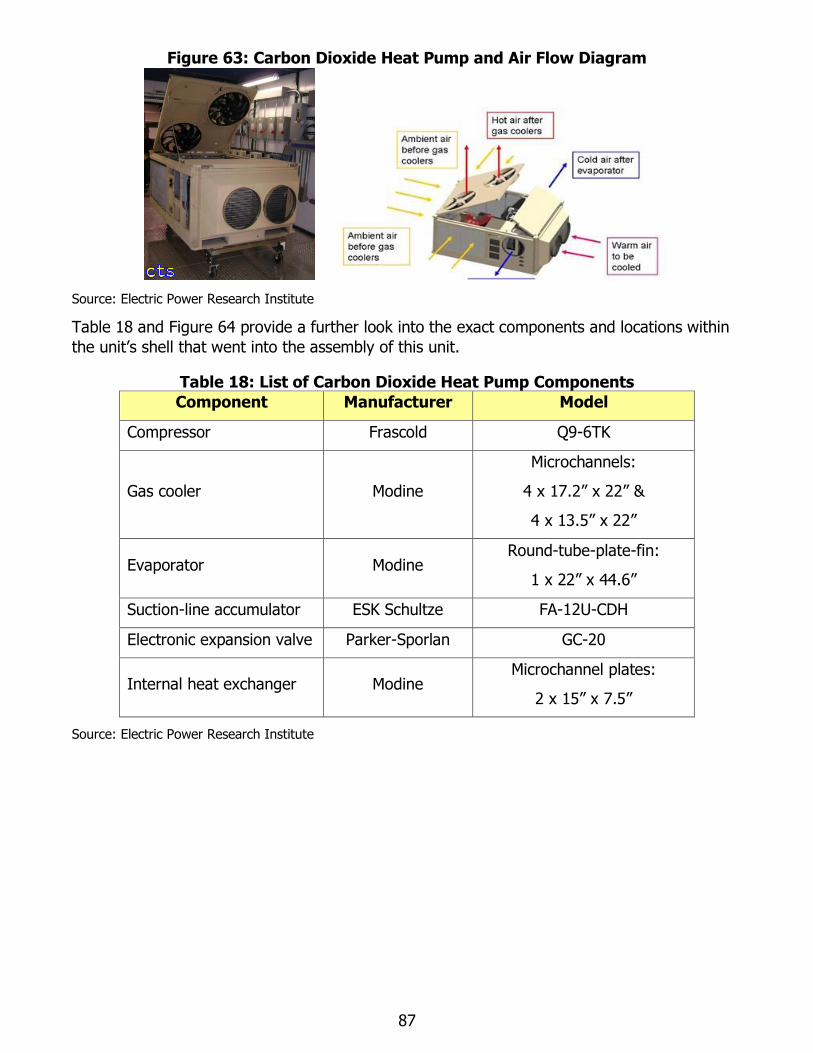
87
Figure 63: Carbon Dioxide Heat Pump and Air Flow Diagram
Source: Electric Power Research Institute
Table 18 and Figure 64 provide a further look into the exact components and locations within
the unit’s shell that went into the assembly of this unit.
Table 18: List of Carbon Dioxide Heat Pump Components
Component Manufacturer Model
Compressor Frascold Q9-6TK
Gas cooler Modine
Microchannels:
4 x 17.2” x 22” &
4 x 13.5” x 22”
Evaporator Modine Round-tube-plate-fin:
1 x 22” x 44.6”
Suction-line accumulator ESK Schultze FA-12U-CDH
Electronic expansion valve Parker-Sporlan GC-20
Internal heat exchanger Modine Microchannel plates:
2 x 15” x 7.5”
Source: Electric Power Research Institute
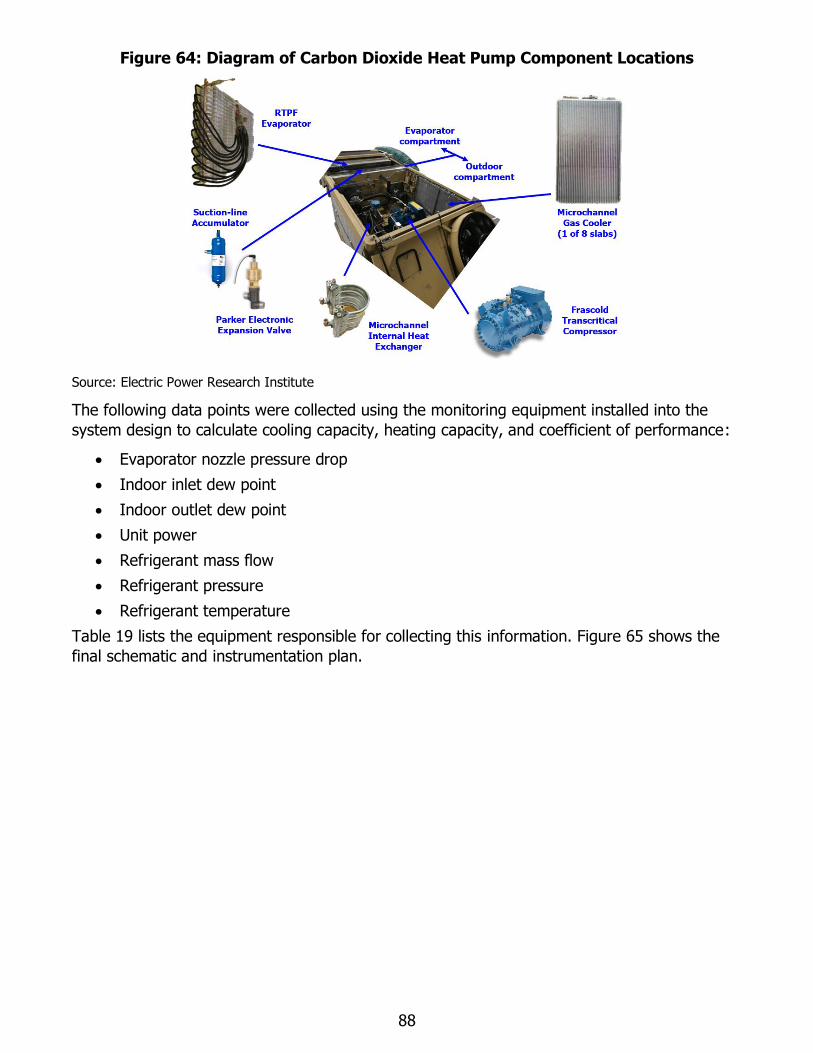
88
Figure 64: Diagram of Carbon Dioxide Heat Pump Component Locations
Source: Electric Power Research Institute
The following data points were collected using the monitoring equipment installed into the
system design to calculate cooling capacity, heating capacity, and coefficient of performance:
• Evaporator nozzle pressure drop
• Indoor inlet dew point
• Indoor outlet dew point
• Unit power
• Refrigerant mass flow
• Refrigerant pressure
• Refrigerant temperature
Table 19 lists the equipment responsible for collecting this information. Figure 65 shows the
final schematic and instrumentation plan.
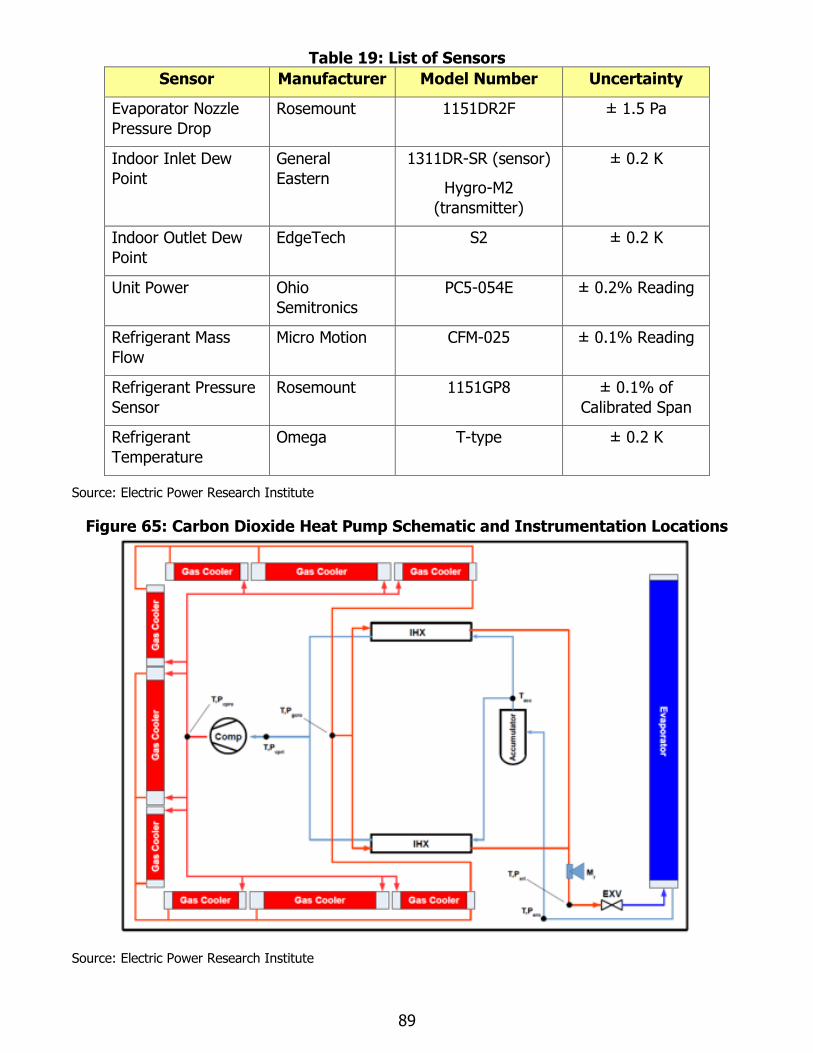
89
Table 19: List of Sensors
Sensor Manufacturer Model Number Uncertainty
Evaporator Nozzle
Pressure Drop
Rosemount 1151DR2F ± 1.5 Pa
Indoor Inlet Dew
Point
General
Eastern
1311DR-SR (sensor)
Hygro-M2
(transmitter)
± 0.2 K
Indoor Outlet Dew
Point
EdgeTech S2 ± 0.2 K
Unit Power Ohio
Semitronics
PC5-054E ± 0.2% Reading
Refrigerant Mass
Flow
Micro Motion CFM-025 ± 0.1% Reading
Refrigerant Pressure
Sensor
Rosemount 1151GP8 ± 0.1% of
Calibrated Span
Refrigerant
Temperature
Omega T-type ± 0.2 K
Source: Electric Power Research Institute
Figure 65: Carbon Dioxide Heat Pump Schematic and Instrumentation Locations
Source: Electric Power Research Institute
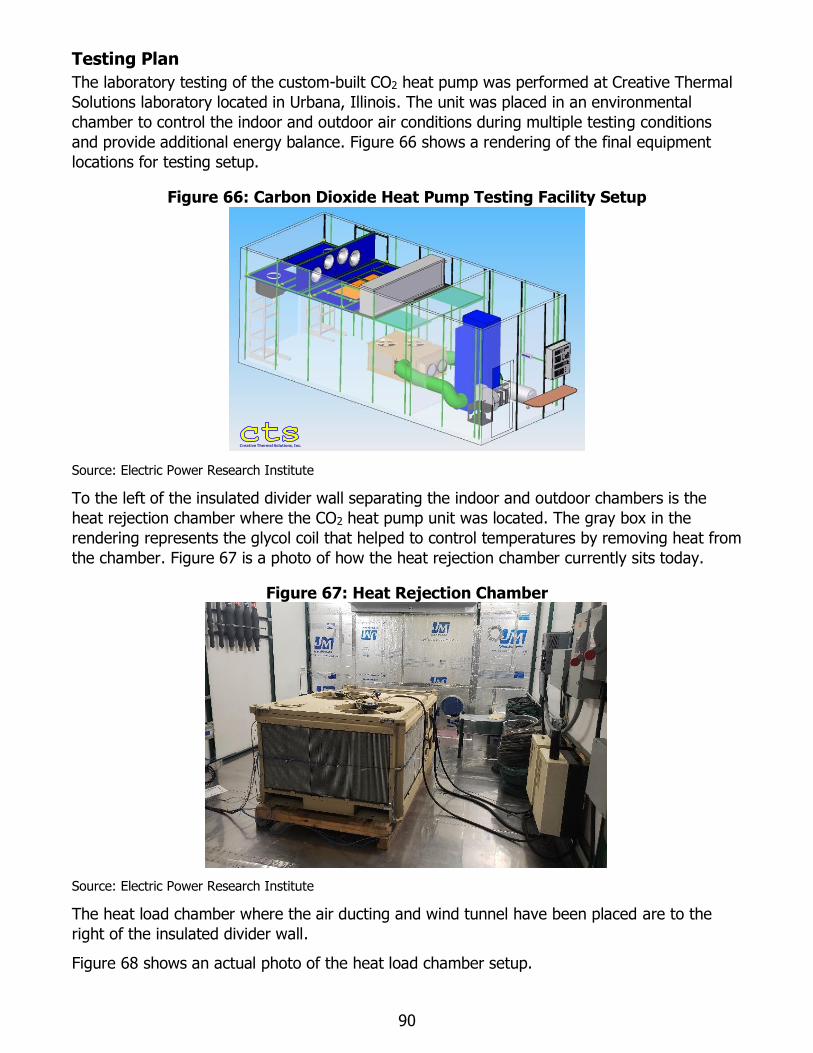
90
Testing Plan
The laboratory testing of the custom-built CO2 heat pump was performed at Creative Thermal
Solutions laboratory located in Urbana, Illinois. The unit was placed in an environmental
chamber to control the indoor and outdoor air conditions during multiple testing conditions
and provide additional energy balance. Figure 66 shows a rendering of the final equipment
locations for testing setup.
Figure 66: Carbon Dioxide Heat Pump Testing Facility Setup
Source: Electric Power Research Institute
To the left of the insulated divider wall separating the indoor and outdoor chambers is the
heat rejection chamber where the CO2 heat pump unit was located. The gray box in the
rendering represents the glycol coil that helped to control temperatures by removing heat from
the chamber. Figure 67 is a photo of how the heat rejection chamber currently sits today.
Figure 67: Heat Rejection Chamber
Source: Electric Power Research Institute
The heat load chamber where the air ducting and wind tunnel have been placed are to the
right of the insulated divider wall.
Figure 68 shows an actual photo of the heat load chamber setup.
Creative Thermal Solutions, Inc.
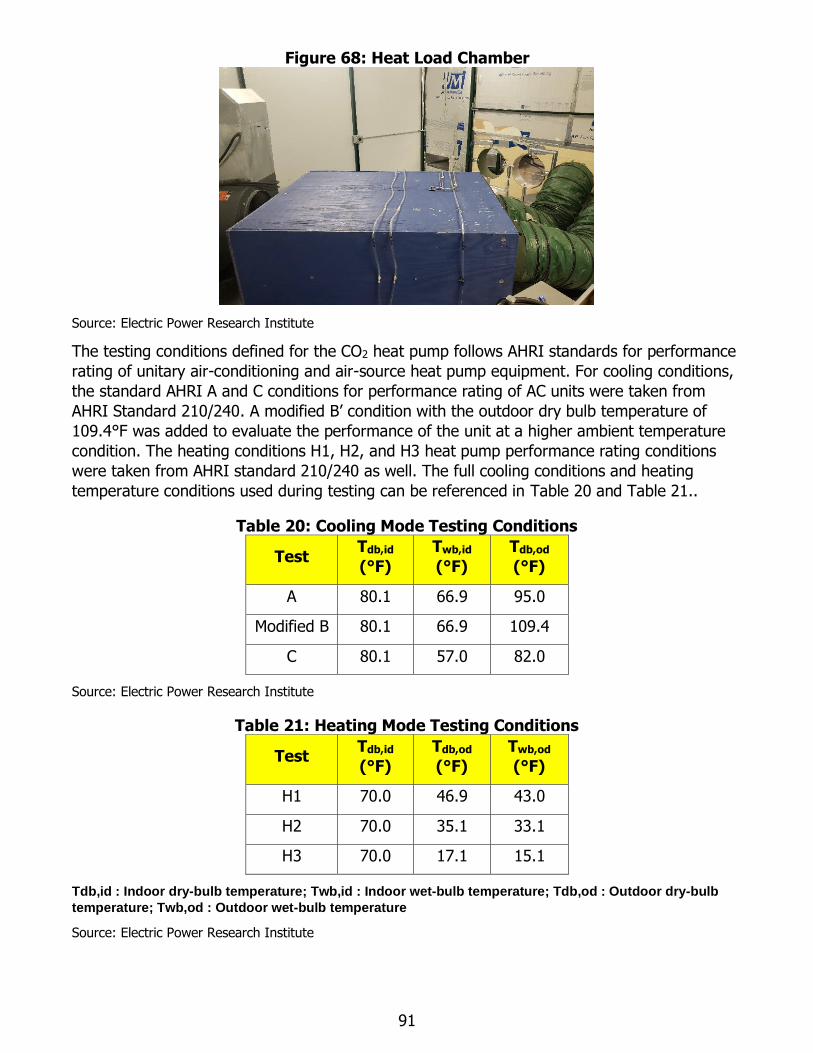
91
Figure 68: Heat Load Chamber
Source: Electric Power Research Institute
The testing conditions defined for the CO2 heat pump follows AHRI standards for performance
rating of unitary air-conditioning and air-source heat pump equipment. For cooling conditions,
the standard AHRI A and C conditions for performance rating of AC units were taken from
AHRI Standard 210/240. A modified B’ condition with the outdoor dry bulb temperature of
109.4°F was added to evaluate the performance of the unit at a higher ambient temperature
condition. The heating conditions H1, H2, and H3 heat pump performance rating conditions
were taken from AHRI standard 210/240 as well. The full cooling conditions and heating
temperature conditions used during testing can be referenced in Table 20 and Table 21..
Table 20: Cooling Mode Testing Conditions
Test Tdb,id
(°F)
Twb,id
(°F)
Tdb,od
(°F)
A 80.1 66.9 95.0
Modified B 80.1 66.9 109.4
C 80.1 57.0 82.0
Source: Electric Power Research Institute
Table 21: Heating Mode Testing Conditions
Test Tdb,id
(°F)
Tdb,od
(°F)
Twb,od
(°F)
H1 70.0 46.9 43.0
H2 70.0 35.1 33.1
H3 70.0 17.1 15.1
Tdb,id : Indoor dry-bulb temperature; Twb,id : Indoor wet-bulb temperature; Tdb,od : Outdoor dry-bulb
temperature; Twb,od : Outdoor wet-bulb temperature
Source: Electric Power Research Institute
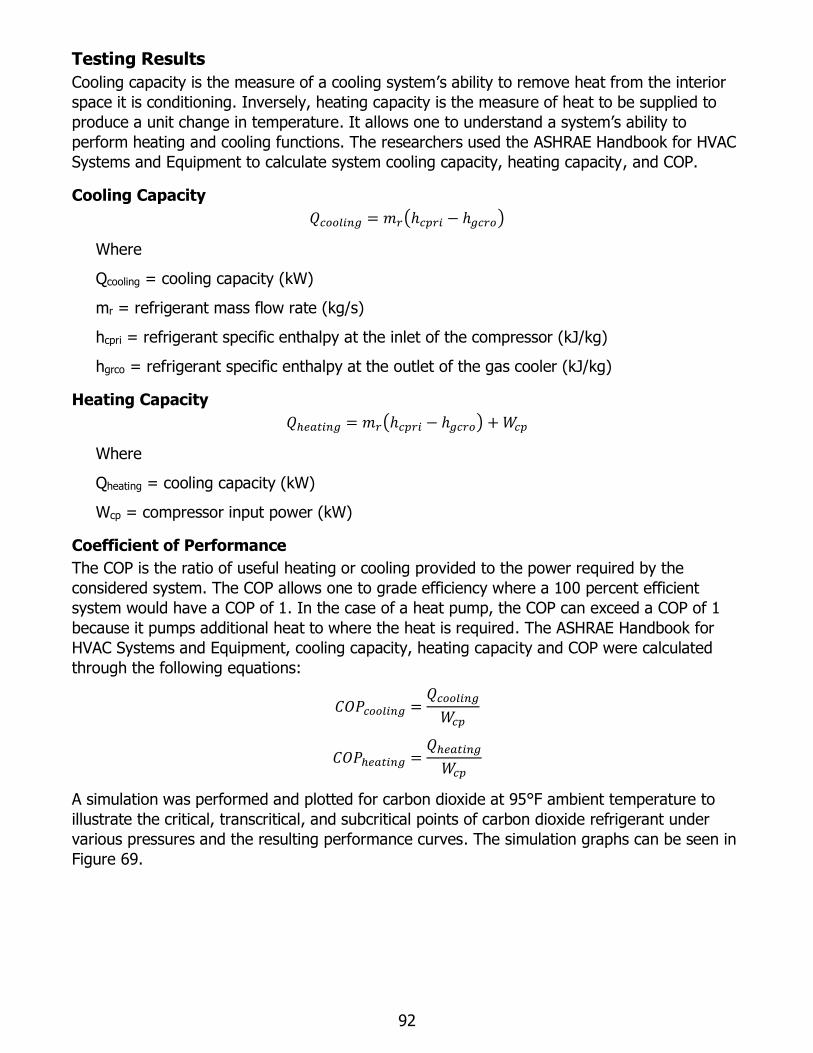
92
Testing Results
Cooling capacity is the measure of a cooling system’s ability to remove heat from the interior
space it is conditioning. Inversely, heating capacity is the measure of heat to be supplied to
produce a unit change in temperature. It allows one to understand a system’s ability to
perform heating and cooling functions. The researchers used the ASHRAE Handbook for HVAC
Systems and Equipment to calculate system cooling capacity, heating capacity, and COP.
Cooling Capacity
𝑄𝑐𝑜𝑜𝑙𝑖𝑛𝑔 = 𝑚𝑟(ℎ𝑐𝑝𝑟𝑖 − ℎ𝑔𝑐𝑟𝑜)
Where
Qcooling = cooling capacity (kW)
mr = refrigerant mass flow rate (kg/s)
hcpri = refrigerant specific enthalpy at the inlet of the compressor (kJ/kg)
hgrco = refrigerant specific enthalpy at the outlet of the gas cooler (kJ/kg)
Heating Capacity
𝑄ℎ𝑒𝑎𝑡𝑖𝑛𝑔 = 𝑚𝑟(ℎ𝑐𝑝𝑟𝑖 − ℎ𝑔𝑐𝑟𝑜) + 𝑊𝑐𝑝
Where
Qheating = cooling capacity (kW)
Wcp = compressor input power (kW)
Coefficient of Performance
The COP is the ratio of useful heating or cooling provided to the power required by the
considered system. The COP allows one to grade efficiency where a 100 percent efficient
system would have a COP of 1. In the case of a heat pump, the COP can exceed a COP of 1
because it pumps additional heat to where the heat is required. The ASHRAE Handbook for
HVAC Systems and Equipment, cooling capacity, heating capacity and COP were calculated
through the following equations:
𝐶𝑂𝑃𝑐𝑜𝑜𝑙𝑖𝑛𝑔 =𝑄𝑐𝑜𝑜𝑙𝑖𝑛𝑔
𝑊𝑐𝑝
𝐶𝑂𝑃ℎ𝑒𝑎𝑡𝑖𝑛𝑔 =𝑄ℎ𝑒𝑎𝑡𝑖𝑛𝑔
𝑊𝑐𝑝
A simulation was performed and plotted for carbon dioxide at 95°F ambient temperature to
illustrate the critical, transcritical, and subcritical points of carbon dioxide refrigerant under
various pressures and the resulting performance curves. The simulation graphs can be seen in
Figure 69.
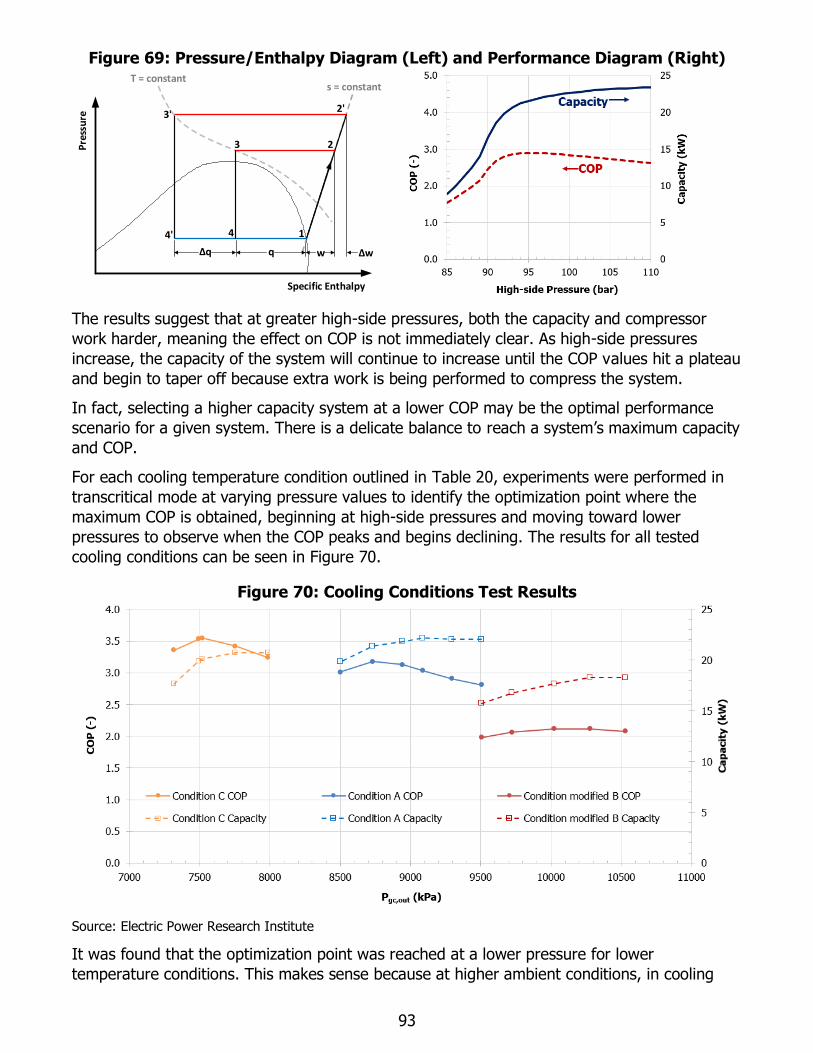
93
Figure 69: Pressure/Enthalpy Diagram (Left) and Performance Diagram (Right)
The results suggest that at greater high-side pressures, both the capacity and compressor
work harder, meaning the effect on COP is not immediately clear. As high-side pressures
increase, the capacity of the system will continue to increase until the COP values hit a plateau
and begin to taper off because extra work is being performed to compress the system.
In fact, selecting a higher capacity system at a lower COP may be the optimal performance
scenario for a given system. There is a delicate balance to reach a system’s maximum capacity
and COP.
For each cooling temperature condition outlined in Table 20, experiments were performed in
transcritical mode at varying pressure values to identify the optimization point where the
maximum COP is obtained, beginning at high-side pressures and moving toward lower
pressures to observe when the COP peaks and begins declining. The results for all tested
cooling conditions can be seen in Figure 70.
Figure 70: Cooling Conditions Test Results
Source: Electric Power Research Institute
It was found that the optimization point was reached at a lower pressure for lower
temperature conditions. This makes sense because at higher ambient conditions, in cooling
1
3'2'
4'
23
4
Specific Enthalpy
Pre
ssu
reT = constant
q
s = constant
Δq w Δw
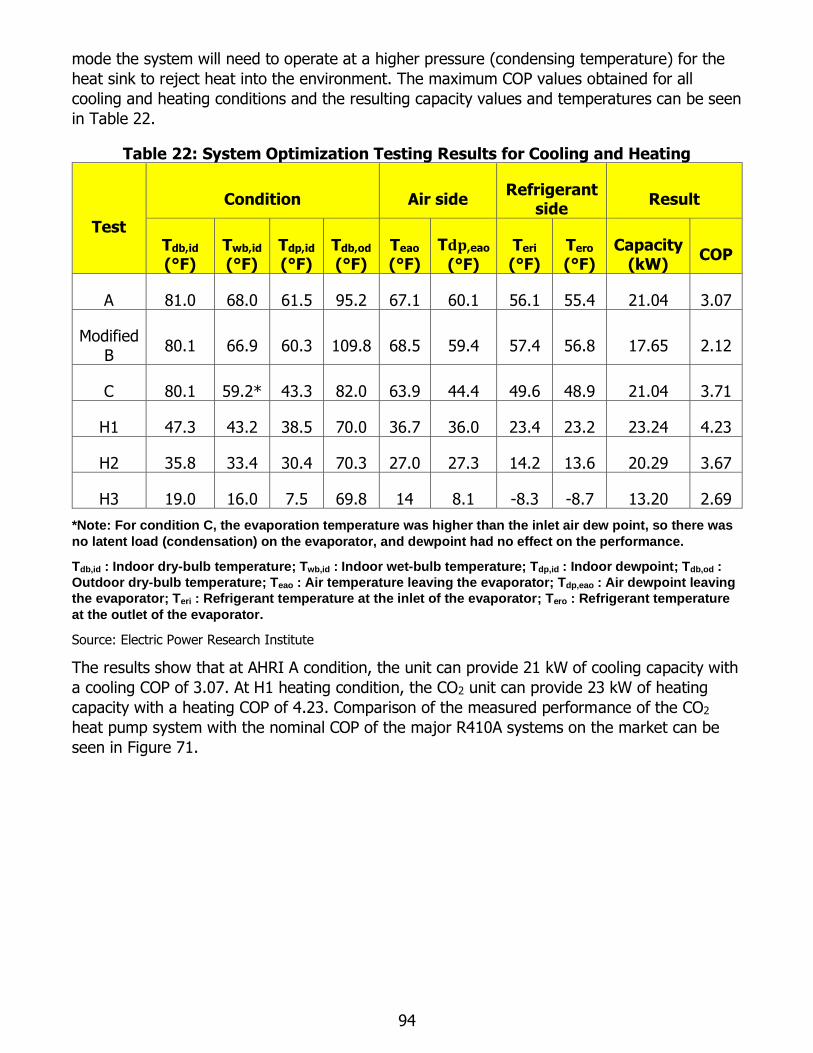
94
mode the system will need to operate at a higher pressure (condensing temperature) for the
heat sink to reject heat into the environment. The maximum COP values obtained for all
cooling and heating conditions and the resulting capacity values and temperatures can be seen
in Table 22.
Table 22: System Optimization Testing Results for Cooling and Heating
Test
Condition Air side Refrigerant
side Result
Tdb,id (°F)
Twb,id (°F)
Tdp,id (°F)
Tdb,od (°F)
Teao (°F)
T𝐝𝐩,eao
(°F)
Teri
(°F) Tero
(°F) Capacity
(kW) COP
A 81.0 68.0 61.5 95.2 67.1 60.1 56.1 55.4 21.04 3.07
Modified
B 80.1 66.9 60.3 109.8 68.5 59.4 57.4 56.8 17.65 2.12
C 80.1 59.2* 43.3 82.0 63.9 44.4 49.6 48.9 21.04 3.71
H1 47.3 43.2 38.5 70.0 36.7 36.0 23.4 23.2 23.24 4.23
H2 35.8 33.4 30.4 70.3 27.0 27.3 14.2 13.6 20.29 3.67
H3 19.0 16.0 7.5 69.8 14 8.1 -8.3 -8.7 13.20 2.69
*Note: For condition C, the evaporation temperature was higher than the inlet air dew point, so there was
no latent load (condensation) on the evaporator, and dewpoint had no effect on the performance.
Tdb,id : Indoor dry-bulb temperature; Twb,id : Indoor wet-bulb temperature; Tdp,id : Indoor dewpoint; Tdb,od :
Outdoor dry-bulb temperature; Teao : Air temperature leaving the evaporator; Tdp,eao : Air dewpoint leaving
the evaporator; Teri : Refrigerant temperature at the inlet of the evaporator; Tero : Refrigerant temperature
at the outlet of the evaporator.
Source: Electric Power Research Institute
The results show that at AHRI A condition, the unit can provide 21 kW of cooling capacity with
a cooling COP of 3.07. At H1 heating condition, the CO2 unit can provide 23 kW of heating
capacity with a heating COP of 4.23. Comparison of the measured performance of the CO2
heat pump system with the nominal COP of the major R410A systems on the market can be
seen in Figure 71.
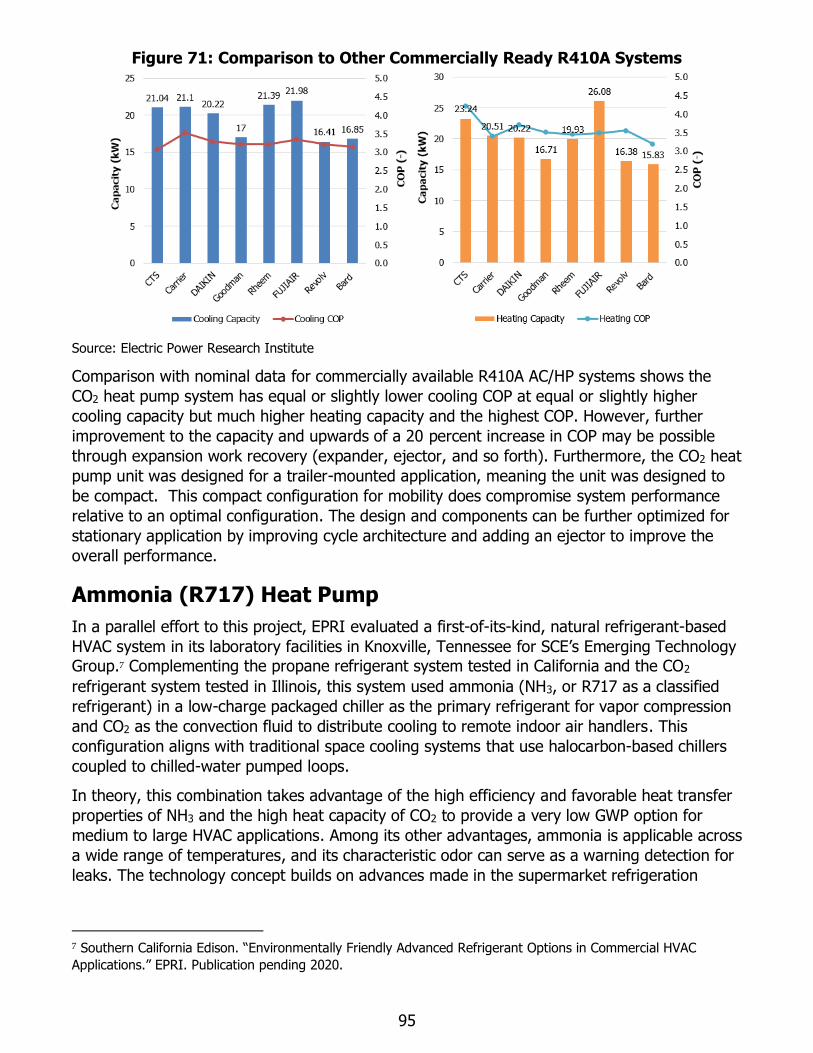
95
Figure 71: Comparison to Other Commercially Ready R410A Systems
Source: Electric Power Research Institute
Comparison with nominal data for commercially available R410A AC/HP systems shows the
CO2 heat pump system has equal or slightly lower cooling COP at equal or slightly higher
cooling capacity but much higher heating capacity and the highest COP. However, further
improvement to the capacity and upwards of a 20 percent increase in COP may be possible
through expansion work recovery (expander, ejector, and so forth). Furthermore, the CO2 heat
pump unit was designed for a trailer-mounted application, meaning the unit was designed to
be compact. This compact configuration for mobility does compromise system performance
relative to an optimal configuration. The design and components can be further optimized for
stationary application by improving cycle architecture and adding an ejector to improve the
overall performance.
Ammonia (R717) Heat Pump
In a parallel effort to this project, EPRI evaluated a first-of-its-kind, natural refrigerant-based
HVAC system in its laboratory facilities in Knoxville, Tennessee for SCE’s Emerging Technology
Group.7 Complementing the propane refrigerant system tested in California and the CO2
refrigerant system tested in Illinois, this system used ammonia (NH3, or R717 as a classified
refrigerant) in a low-charge packaged chiller as the primary refrigerant for vapor compression
and CO2 as the convection fluid to distribute cooling to remote indoor air handlers. This
configuration aligns with traditional space cooling systems that use halocarbon-based chillers
coupled to chilled-water pumped loops.
In theory, this combination takes advantage of the high efficiency and favorable heat transfer
properties of NH3 and the high heat capacity of CO2 to provide a very low GWP option for
medium to large HVAC applications. Among its other advantages, ammonia is applicable across
a wide range of temperatures, and its characteristic odor can serve as a warning detection for
leaks. The technology concept builds on advances made in the supermarket refrigeration
7 Southern California Edison. “Environmentally Friendly Advanced Refrigerant Options in Commercial HVAC
Applications.” EPRI. Publication pending 2020.
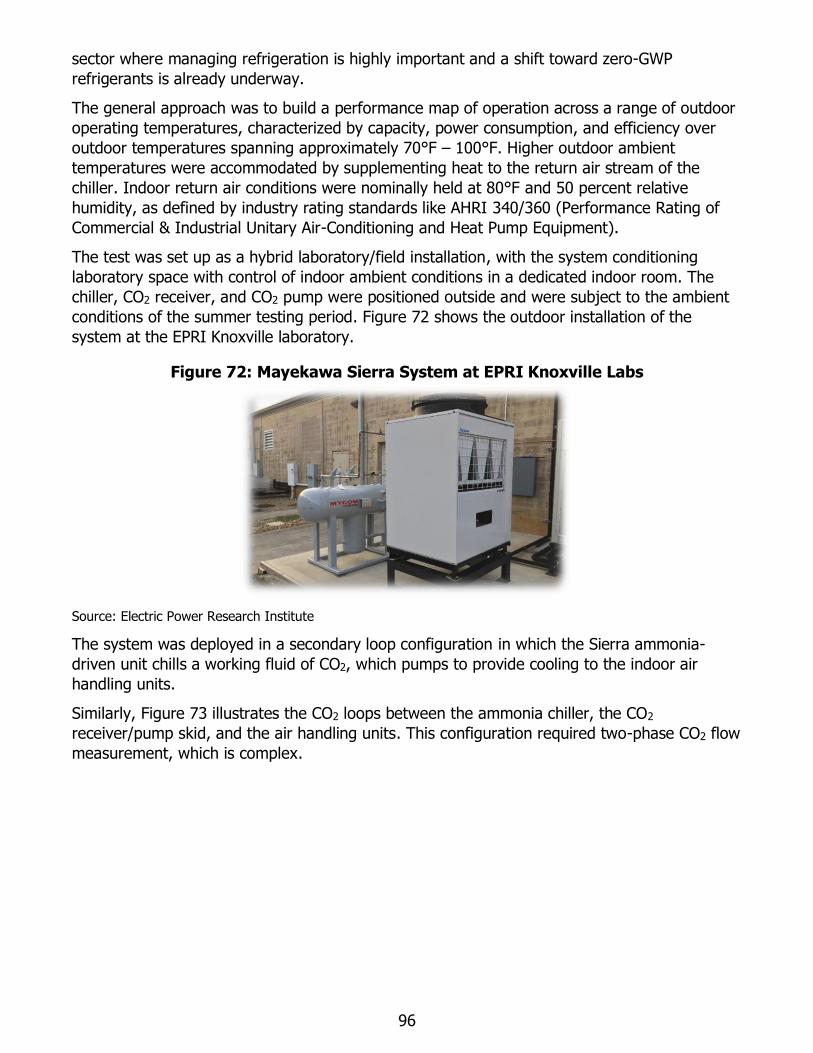
96
sector where managing refrigeration is highly important and a shift toward zero-GWP
refrigerants is already underway.
The general approach was to build a performance map of operation across a range of outdoor
operating temperatures, characterized by capacity, power consumption, and efficiency over
outdoor temperatures spanning approximately 70°F – 100°F. Higher outdoor ambient
temperatures were accommodated by supplementing heat to the return air stream of the
chiller. Indoor return air conditions were nominally held at 80°F and 50 percent relative
humidity, as defined by industry rating standards like AHRI 340/360 (Performance Rating of
Commercial & Industrial Unitary Air-Conditioning and Heat Pump Equipment).
The test was set up as a hybrid laboratory/field installation, with the system conditioning
laboratory space with control of indoor ambient conditions in a dedicated indoor room. The
chiller, CO2 receiver, and CO2 pump were positioned outside and were subject to the ambient
conditions of the summer testing period. Figure 72 shows the outdoor installation of the
system at the EPRI Knoxville laboratory.
Figure 72: Mayekawa Sierra System at EPRI Knoxville Labs
Source: Electric Power Research Institute
The system was deployed in a secondary loop configuration in which the Sierra ammonia-
driven unit chills a working fluid of CO2, which pumps to provide cooling to the indoor air
handling units.
Similarly, Figure 73 illustrates the CO2 loops between the ammonia chiller, the CO2
receiver/pump skid, and the air handling units. This configuration required two-phase CO2 flow
measurement, which is complex.
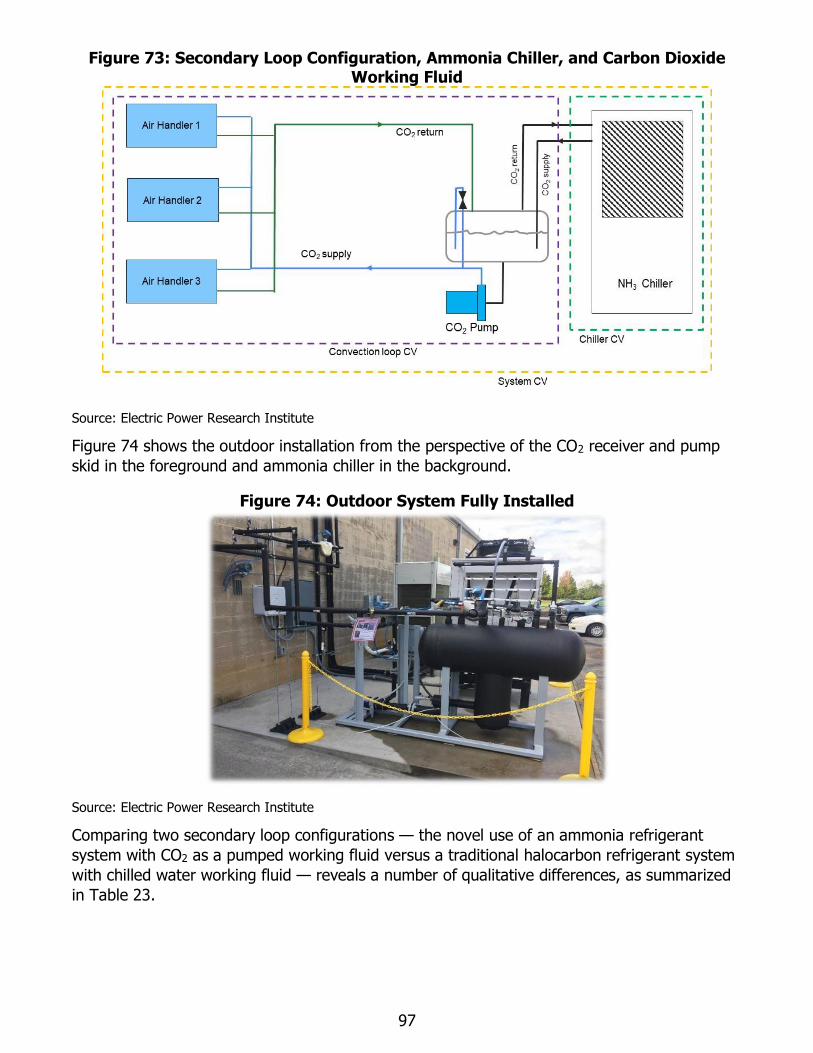
97
Figure 73: Secondary Loop Configuration, Ammonia Chiller, and Carbon Dioxide Working Fluid
Source: Electric Power Research Institute
Figure 74 shows the outdoor installation from the perspective of the CO2 receiver and pump
skid in the foreground and ammonia chiller in the background.
Figure 74: Outdoor System Fully Installed
Source: Electric Power Research Institute
Comparing two secondary loop configurations — the novel use of an ammonia refrigerant
system with CO2 as a pumped working fluid versus a traditional halocarbon refrigerant system
with chilled water working fluid — reveals a number of qualitative differences, as summarized
in Table 23.
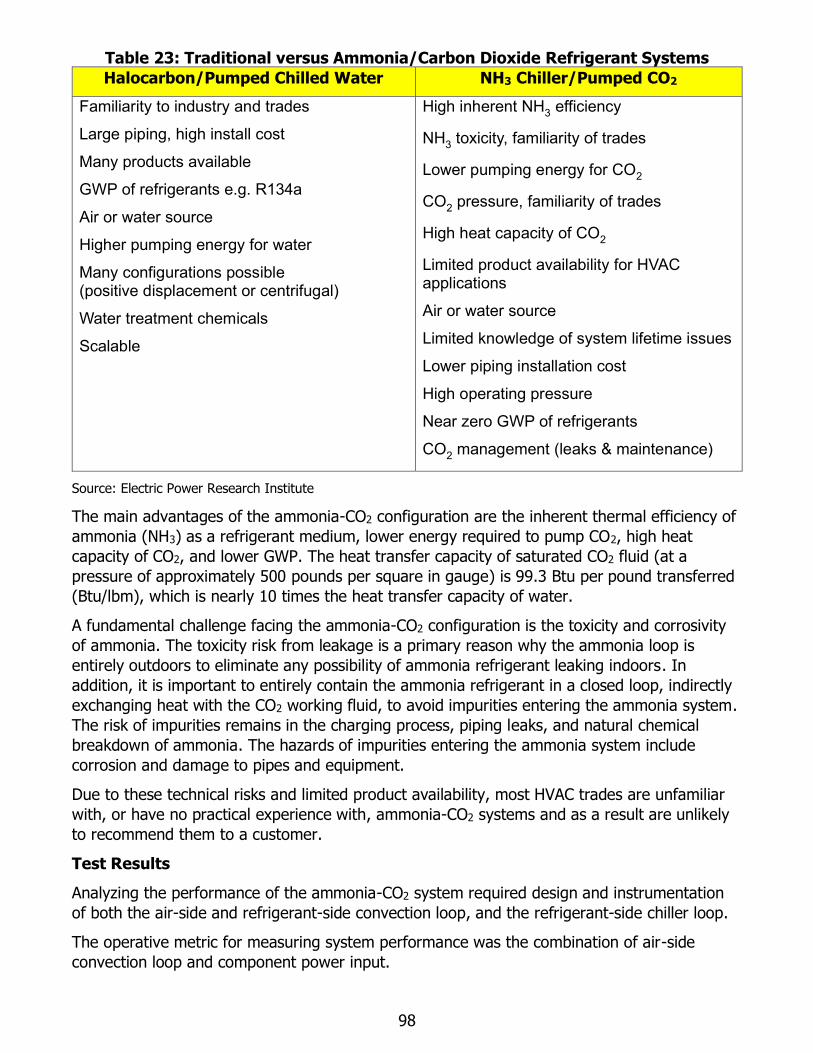
98
Table 23: Traditional versus Ammonia/Carbon Dioxide Refrigerant Systems
Halocarbon/Pumped Chilled Water NH3 Chiller/Pumped CO2
Familiarity to industry and trades
Large piping, high install cost
Many products available
GWP of refrigerants e.g. R134a
Air or water source
Higher pumping energy for water
Many configurations possible (positive displacement or centrifugal)
Water treatment chemicals
Scalable
High inherent NH3 efficiency
NH3 toxicity, familiarity of trades
Lower pumping energy for CO2
CO2 pressure, familiarity of trades
High heat capacity of CO2
Limited product availability for HVAC applications
Air or water source
Limited knowledge of system lifetime issues
Lower piping installation cost
High operating pressure
Near zero GWP of refrigerants
CO2 management (leaks & maintenance)
Source: Electric Power Research Institute
The main advantages of the ammonia-CO2 configuration are the inherent thermal efficiency of
ammonia (NH3) as a refrigerant medium, lower energy required to pump CO2, high heat
capacity of CO2, and lower GWP. The heat transfer capacity of saturated CO2 fluid (at a
pressure of approximately 500 pounds per square in gauge) is 99.3 Btu per pound transferred
(Btu/lbm), which is nearly 10 times the heat transfer capacity of water.
A fundamental challenge facing the ammonia-CO2 configuration is the toxicity and corrosivity
of ammonia. The toxicity risk from leakage is a primary reason why the ammonia loop is
entirely outdoors to eliminate any possibility of ammonia refrigerant leaking indoors. In
addition, it is important to entirely contain the ammonia refrigerant in a closed loop, indirectly
exchanging heat with the CO2 working fluid, to avoid impurities entering the ammonia system.
The risk of impurities remains in the charging process, piping leaks, and natural chemical
breakdown of ammonia. The hazards of impurities entering the ammonia system include
corrosion and damage to pipes and equipment.
Due to these technical risks and limited product availability, most HVAC trades are unfamiliar
with, or have no practical experience with, ammonia-CO2 systems and as a result are unlikely
to recommend them to a customer.
Test Results
Analyzing the performance of the ammonia-CO2 system required design and instrumentation
of both the air-side and refrigerant-side convection loop, and the refrigerant-side chiller loop.
The operative metric for measuring system performance was the combination of air-side
convection loop and component power input.
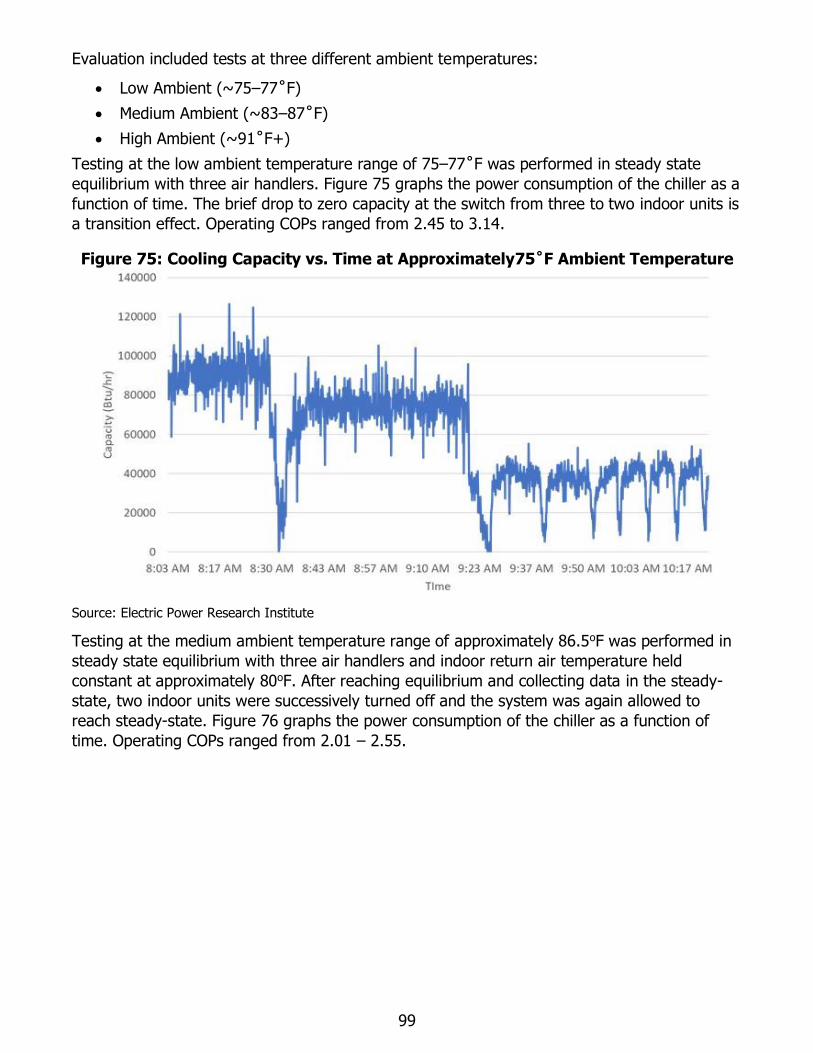
99
Evaluation included tests at three different ambient temperatures:
• Low Ambient (~75–77˚F)
• Medium Ambient (~83–87˚F)
• High Ambient (~91˚F+)
Testing at the low ambient temperature range of 75–77˚F was performed in steady state
equilibrium with three air handlers. Figure 75 graphs the power consumption of the chiller as a
function of time. The brief drop to zero capacity at the switch from three to two indoor units is
a transition effect. Operating COPs ranged from 2.45 to 3.14.
Figure 75: Cooling Capacity vs. Time at Approximately75˚F Ambient Temperature
Source: Electric Power Research Institute
Testing at the medium ambient temperature range of approximately 86.5oF was performed in
steady state equilibrium with three air handlers and indoor return air temperature held
constant at approximately 80oF. After reaching equilibrium and collecting data in the steady-
state, two indoor units were successively turned off and the system was again allowed to
reach steady-state. Figure 76 graphs the power consumption of the chiller as a function of
time. Operating COPs ranged from 2.01 – 2.55.
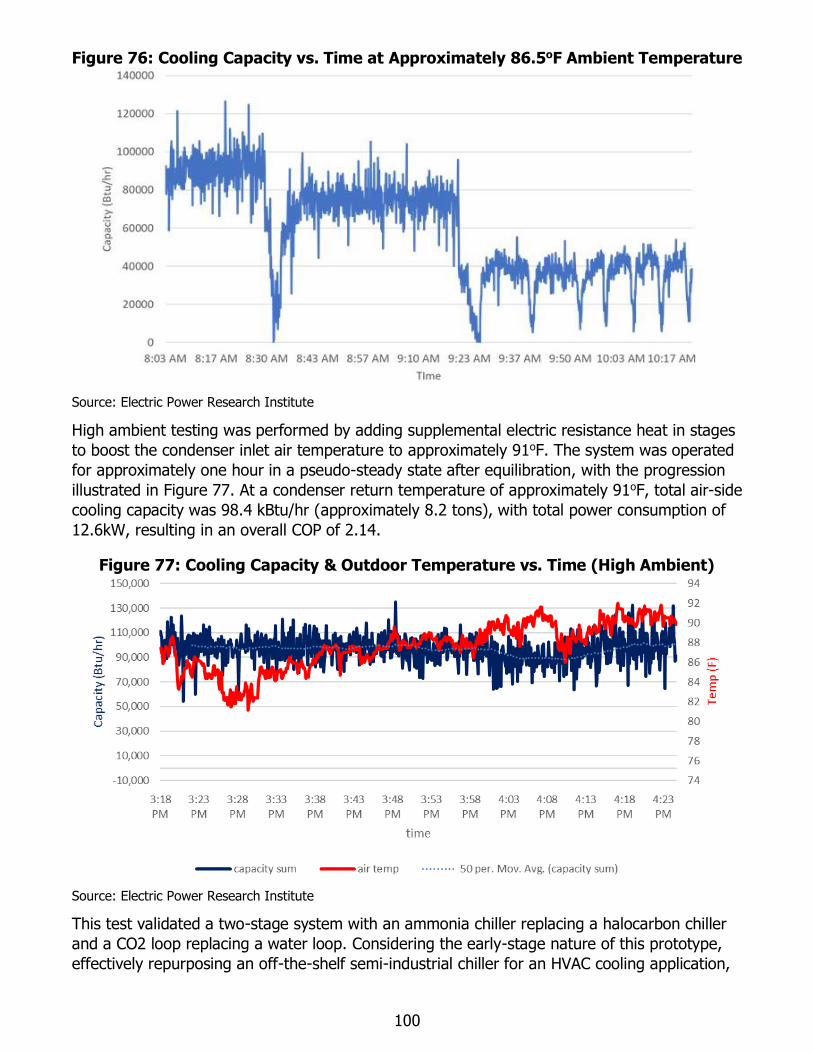
100
Figure 76: Cooling Capacity vs. Time at Approximately 86.5oF Ambient Temperature
Source: Electric Power Research Institute
High ambient testing was performed by adding supplemental electric resistance heat in stages
to boost the condenser inlet air temperature to approximately 91oF. The system was operated
for approximately one hour in a pseudo-steady state after equilibration, with the progression
illustrated in Figure 77. At a condenser return temperature of approximately 91oF, total air-side
cooling capacity was 98.4 kBtu/hr (approximately 8.2 tons), with total power consumption of
12.6kW, resulting in an overall COP of 2.14.
Figure 77: Cooling Capacity & Outdoor Temperature vs. Time (High Ambient)
Source: Electric Power Research Institute
This test validated a two-stage system with an ammonia chiller replacing a halocarbon chiller
and a CO2 loop replacing a water loop. Considering the early-stage nature of this prototype,
effectively repurposing an off-the-shelf semi-industrial chiller for an HVAC cooling application,
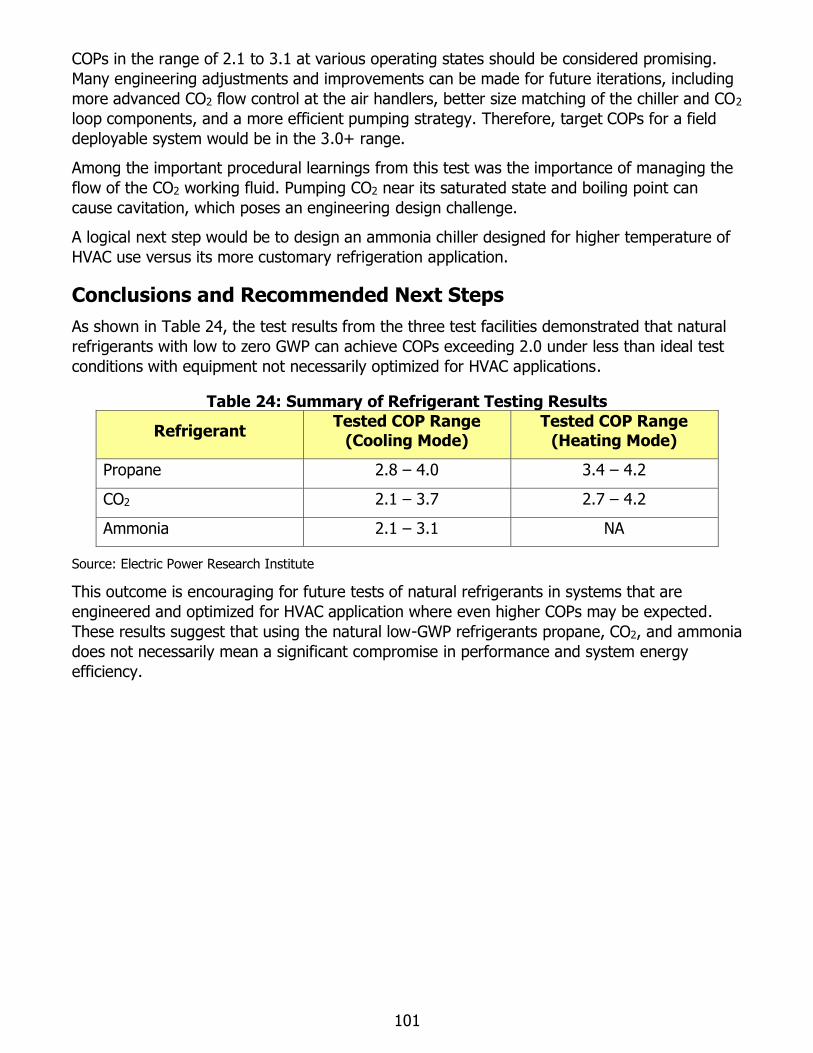
101
COPs in the range of 2.1 to 3.1 at various operating states should be considered promising.
Many engineering adjustments and improvements can be made for future iterations, including
more advanced CO2 flow control at the air handlers, better size matching of the chiller and CO2
loop components, and a more efficient pumping strategy. Therefore, target COPs for a field
deployable system would be in the 3.0+ range.
Among the important procedural learnings from this test was the importance of managing the
flow of the CO2 working fluid. Pumping CO2 near its saturated state and boiling point can
cause cavitation, which poses an engineering design challenge.
A logical next step would be to design an ammonia chiller designed for higher temperature of
HVAC use versus its more customary refrigeration application.
Conclusions and Recommended Next Steps
As shown in Table 24, the test results from the three test facilities demonstrated that natural
refrigerants with low to zero GWP can achieve COPs exceeding 2.0 under less than ideal test
conditions with equipment not necessarily optimized for HVAC applications.
Table 24: Summary of Refrigerant Testing Results
Refrigerant Tested COP Range
(Cooling Mode)
Tested COP Range
(Heating Mode)
Propane 2.8 – 4.0 3.4 – 4.2
CO2 2.1 – 3.7 2.7 – 4.2
Ammonia 2.1 – 3.1 NA
Source: Electric Power Research Institute
This outcome is encouraging for future tests of natural refrigerants in systems that are
engineered and optimized for HVAC application where even higher COPs may be expected.
These results suggest that using the natural low-GWP refrigerants propane, CO2, and ammonia
does not necessarily mean a significant compromise in performance and system energy
efficiency.
102
CHAPTER 6: Knowledge Transfer Activities
Variable Refrigerant Flow + Indirect Evaporative Cooling Demonstration The demonstration sites selected for the project represent commercial buildings that are
inherently appropriate candidates for the VRF+IEC hybrid system, insofar as they are small-
and medium-sized offices and restaurants, typically served by incumbent packaged rooftop
units, with high occupancy and therefore high ventilation requirements commensurate with an
IEC system operating as a dedicated outside air system. The addressable market of small- and
medium-sized commercial office buildings and restaurants in California served by rooftop units
is vast and represents an opportunity for energy savings and peak load reduction through
conversion to VRF+IEC systems.
By selecting a quick-serve chain restaurant, Del Taco, as one of the demonstration sites, the
results are directly replicable and scalable to the other 580-plus Del Taco restaurants in
California, given their similarities in size, configuration, operating hours, and occupancy
patterns. This represents an immediate and sizable “warm market” for this technology, given
the company’s experience with using the technology and experiencing its benefits. Corporate
facility managers from different regions can review the performance data from the
demonstration site and obtain first accounts from store management on the installation
process and experience of staff and customers.
By extension, other quick-serve restaurant chains represent an additional addressable market.
Outreach to industry trade organizations such as the California Restaurant Association can help
transfer the knowledge and experience of the VRF+IEC systems. Moreover, the HVAC
installation contractors that worked on this project can apply these skills and experiences to
other customers. One of the aims of this project is to enable scaled field applications and
programmatic incentive programs for the VRF+IEC combination. There are nearly 90,000
restaurants in California, with approximately one-third in the fast food or quick-serve
segment.8
With respect to modeling, this project developed enhancements to the EnergyPlus building
energy simulation tool, including updated modules for VRF, IEC, and VRF+IEC. These
enhancements have been communicated to the United States Department of Energy, which
funds the development of EnergyPlus through its Building Technologies Office and releases
major updates each year.
The results from this project will be widely shared following the release of this report through
presentations and papers at such industry outreach events as the American Council for an
Energy-Efficient Economy (ACEEE) Building Summer Study, Emerging Technologies Summit,
California Emerging Technology Coordination Council, Utility Energy Forum, and meetings of
8 Ibis World. “Restaurants in California – Market Research Report. February 2020.
https://www.ibisworld.com/industry-trends/market-research-reports/california/accommodation-food-
services/restaurants-in-california.html

103
the California Institute for Energy and Environment, Western Cooling and Efficiency Center,
and New Buildings Institute. EPRI plans to conduct similar demonstration projects in California
with a greater variety of appropriate commercial buildings in different climate zones, in
conjunction with utilities and other partners. Finally, EPRI intends to work with utility partners
to replicate this type of technology demonstration around the country.
Natural Refrigerant Testing The results and learnings from the laboratory testing of natural refrigerant systems will be
shared in research papers and articles submitted for conferences convened in the HVAC
industry, including ASHRAE and ACEEE. In addition, EPRI intends to conduct follow-up
research and field demonstrations with its utility clients to build upon and advance the work
pioneered through this project.
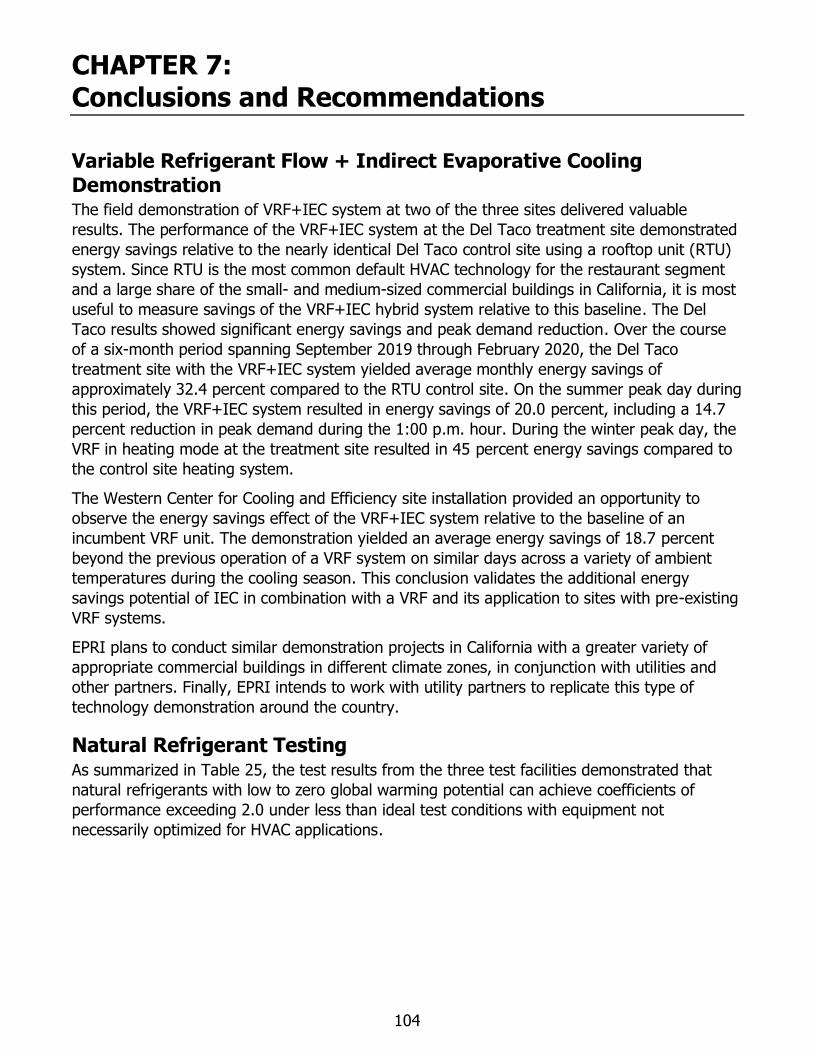
104
CHAPTER 7: Conclusions and Recommendations
Variable Refrigerant Flow + Indirect Evaporative Cooling Demonstration The field demonstration of VRF+IEC system at two of the three sites delivered valuable
results. The performance of the VRF+IEC system at the Del Taco treatment site demonstrated
energy savings relative to the nearly identical Del Taco control site using a rooftop unit (RTU)
system. Since RTU is the most common default HVAC technology for the restaurant segment
and a large share of the small- and medium-sized commercial buildings in California, it is most
useful to measure savings of the VRF+IEC hybrid system relative to this baseline. The Del
Taco results showed significant energy savings and peak demand reduction. Over the course
of a six-month period spanning September 2019 through February 2020, the Del Taco
treatment site with the VRF+IEC system yielded average monthly energy savings of
approximately 32.4 percent compared to the RTU control site. On the summer peak day during
this period, the VRF+IEC system resulted in energy savings of 20.0 percent, including a 14.7
percent reduction in peak demand during the 1:00 p.m. hour. During the winter peak day, the
VRF in heating mode at the treatment site resulted in 45 percent energy savings compared to
the control site heating system.
The Western Center for Cooling and Efficiency site installation provided an opportunity to
observe the energy savings effect of the VRF+IEC system relative to the baseline of an
incumbent VRF unit. The demonstration yielded an average energy savings of 18.7 percent
beyond the previous operation of a VRF system on similar days across a variety of ambient
temperatures during the cooling season. This conclusion validates the additional energy
savings potential of IEC in combination with a VRF and its application to sites with pre-existing
VRF systems.
EPRI plans to conduct similar demonstration projects in California with a greater variety of
appropriate commercial buildings in different climate zones, in conjunction with utilities and
other partners. Finally, EPRI intends to work with utility partners to replicate this type of
technology demonstration around the country.
Natural Refrigerant Testing As summarized in Table 25, the test results from the three test facilities demonstrated that
natural refrigerants with low to zero global warming potential can achieve coefficients of
performance exceeding 2.0 under less than ideal test conditions with equipment not
necessarily optimized for HVAC applications.
105
Table 25: Summary of Refrigerant Testing Results
Refrigerant Tested COP Range
(Cooling Mode) Tested COP Range
(Heating Mode)
Propane 2.8 – 4.0 3.4 – 4.2
CO2 2.1 – 3.7 2.7 – 4.2
Ammonia 2.1 – 3.1 NA
Source: Electric Power Research Institute
This outcome is encouraging for future tests of natural refrigerants in systems that are
engineered and optimized for HVAC application where even higher coefficients of performance
may be expected. These results suggest that using the natural low global warming potential
refrigerants propane, CO2, and ammonia does not necessarily mean a significant compromise
in performance and system energy efficiency.
EPRI intends to conduct follow-up research and field demonstrations with its utility clients to
build upon and advance the work pioneered through this project.
106
CHAPTER 8: Benefits to California Ratepayers
This research offers direct benefits to California ratepayers because it validated the energy
savings and peak demand reduction performance of a novel HVAC configuration — a hybrid
combining VRF and IEC — that has the potential to reduce energy consumption in small- and
medium-sized commercial buildings by 20 – 32 percent as a replacement for the ubiquitous
packaged rooftop units currently servicing this market. The project demonstrated that hybrid
systems that combine IEC and vapor compression can reduce peak demand on a peak
summer hour by 15 percent compared to traditional rooftop unit systems. Overall system cost
can be cost competitive to rooftop replacement when the two systems are right sized using
optimized economizer operation.
Greater energy efficiency and peak load reduction may obviate or defer investment in power
delivery infrastructure and/or procurement of additional generation, which can avoid
associated rate increases for California ratepayers.
Moreover, improved occupant comfort has been shown to enhance the productivity of workers9
in office or retail buildings and the satisfaction of customers patronizing retail or restaurant
establishments.
Greater energy savings also reduces emissions of carbon as well as other pollutants, which
improves the carbon footprint of the state and enhances air quality goals.
The project also enhanced modeling tools and developed controls to combine VRF systems
with IEC as a DOAS. The research leveraged the strengths of each technology using internet-
connected controls to optimize operation of the two systems and to address the technical
barriers that challenge these technologies when applied separately, resulting in more efficient
operation.
The public ratepayer funding applied to this project provided a unique research and
demonstration opportunity to bridge disjointed silos within the building industry. Market
players focus on their particular products, design engineers focus on mitigating risk, and
installers and contractors are drawn to familiar technologies. These varied interests inhibit
holistic building solutions, especially for small and medium commercial buildings. VRF
manufacturers are advancing technology that promises significant annual energy savings
compared to conventional HVAC systems, but which only provides minor peak demand
savings. IEC manufacturers are advancing technology that provides outstanding energy
savings at both peak and partial loading conditions but does not provide adequate cooling
capacity. While the market casts these as competing technologies, this project intended to
demonstrate their complementary operation and integration to their mutual advantage.
Finally, laboratory testing results of the three natural refrigerants (propane, carbon dioxide,
and ammonia) demonstrated that equipment operating on low-global warming potential
natural refrigerants exhibits performance and efficiency commensurate with traditional
9 Hedge, Alan. “Linking Environmental Conditions to Productivity”. Cornell University. 2004.
107
synthetic refrigerants. Efficiencies in cooling mode, expressed in terms of coefficients of
performance, ranged from 2.1 to 4.0 across a wide variety of ambient temperatures. This
suggests that converting to low-GWP refrigerants does not compromise energy efficiency and
performance efficacy. This is a significant finding to encourage further tests and scaled
deployments of natural refrigerant systems to help meet California’s greenhouse gas reduction
goals.
The research can benefit numerous other stakeholders who are most likely California
ratepayers. Energy policy makers and regulators in California can better understand the
potential role of this hybrid system in achieving climate goal objectives. Utilities can inform
similar demonstrations, scaled field deployments, and customer incentive programs to help
attain prescribed energy efficiency goals. And the results can also bolster the confidence of
HVAC contractors to offer these solutions to customers.
108
LIST OF ACRONYMS
Term/Acronym Definition
AHRI Air Conditioning, Heating, and Refrigeration Institute
ATPL Advanced Technology Performance Lab (at PG&E’s San Ramon Technology Center)
BACnet BACnet is a communication protocol for Building Automation and
Control (BAC) networks
BTU British Thermal Unit
CEC California Energy Commission
CO2 Carbon dioxide
DOAS Dedicated outside air system
EES Engineering equation solution (programming method)
ε-NTU
Effectiveness – Number of Transfer Units. An equation that defines the
heat transfer rate between fluids 1 and 2 in terms of an effectiveness parameter ε
GW Gigawatts
GWh Gigawatt hours
GWP Global warming potential (as applied to refrigerants)
HP Horsepower
HVAC Heating, ventilation and air conditioning
IDU Indoor unit
IEC Indirect Evaporative Cooling
MBH Thousand British thermal units per hour
NH3 Ammonia
ODU Outdoor Unit
R290 Propane refrigerant
R717 Ammonia (NH3) refrigerant
R744 Carbon Dioxide (CO2) refrigerant
RTU Rooftop Unit
USDOE United States Department of Energy
USEPA United States Environmental Protection Agency
VRF Variable Refrigerant Flow


