CLEAN POWER PLAN
Reducing Carbon Pollution From Existing Power Plants
Proposal Announced on June 2, 2014

This Proposal Deals With the Largest Source of GHG Emissions in the U.S.
2
This proposal will: •Reduce carbon pollution from existing power plants, for which there are currently no national limits.•Maintain an affordable, reliable energy system.•By 2030, reduce nationwide carbon dioxide (CO2) emissions, from the power sector by approximately 30% from 2005 levels.
• Significant reductions begin by 2020. •Cut hundreds of thousands of tons of harmful particle pollution, sulfur dioxide and nitrogen oxides as a co-benefit. •Provide important health protections to the most vulnerable, such as children and older Americans. •Lead to health and climate benefits worth an estimated $55 billion to $93 billion in 2030. •From soot and smog reductions alone, for every dollar invested through the Clean Power Plan – American families will see up to $7 in health benefits.
3
Summary

• Build on actions states, cities and businesses across the country are already taking to address the risks of climate change.
• Spur investment in cleaner and more efficient technologies, creating jobs and driving innovation.
• Require a reasonable emission reduction glidepath starting in 2020.
• Provide a flexible timeline—up to 15 years from guideline issuance—for all emission reduction measures to be fully implemented in 2030.
• Recognizing that investments in infrastructure can take time to put in place and
• Avoiding stranded assets.
• Provide an array of tools states can use to formulate approvable plans.
Summary (Cont’d)
4
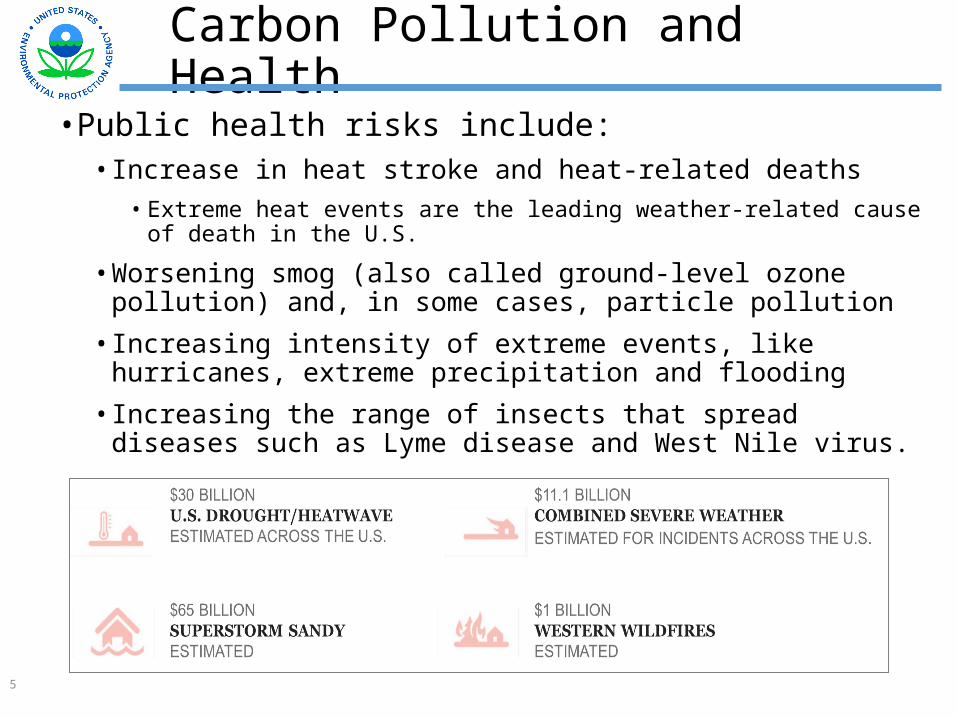
Carbon Pollution and Health• Public health risks include:
• Increase in heat stroke and heat-related deaths• Extreme heat events are the leading weather-related cause of death in the U.S.
• Worsening smog (also called ground-level ozone pollution) and, in some cases, particle pollution
• Increasing intensity of extreme events, like hurricanes, extreme precipitation and flooding
• Increasing the range of insects that spread diseases such as Lyme disease and West Nile virus.
5

Reducing Carbon Pollution From Power Plants
6
Background: Clean Air Act Section 111(d)Best System of Emission Reduction
7
• Previous EPA rules under this section of the Clean Air Act have considered “add-on” control technologies – like scrubbers -- that are technically feasible to deploy at virtually any facility.
• In contrast, there are a wide variety of ways to reduce carbon pollution that are commercially available, technically feasible, and cost effective.
• The opportunities vary from state to state, depending on how electricity is generated, energy infrastructure, and other factors.
• In this proposal, EPA took an approach that viewed the Clean Air Act factors in determining Best System of Emission Reduction in light of the interconnected nature of power generation.
• BSER factors• Costs • Size of reductions • Technology• Feasibility

• EPA conducted a robust pre-proposal stakeholder engagement process.
• Participated in meetings with over 300 utility, consumer, labor and environmental groups since June 2013.
• Held 11 public listening sessions around the country.
• 3,300 people attended.• More than 1,600 people offered oral
statements.• Reached out to all 50 states.
• Some states noted their programs to address carbon evolved because of:
• The need to address carbon pollution;• Electric system that is dynamic, and in the
midst of market changes; and• Modernizing the power sector is good for the
economy.• Common themes included reliability, flexibility,
affordability, time for plans and implementation.
8
Early Outreach Informed This Proposal

EPA Establishes a Goal for Every State• EPA analyzed the practical and affordable strategies that states and utilities are
already using to lower carbon pollution from the power sector.
• Proposed goals are based on a consistent national formula, calculated with state and regional specific information.
• The result of the equation is the state goal. • Each state goal is a rate – a statewide number for the future carbon intensity of
covered existing fossil-fuel-fired power plants in a state.• Encompasses the dynamic variables that ultimately determine how much carbon pollution is
emitted by fossil fuel power plants.
• Accommodates the fact that CO2 emissions from fossil fuel-fired power plants are influenced by how efficiently they operate and by how much they operate.
• The state goal rate is calculated to account for the mix of power sources in each state and the application of the “building blocks” that make up the best system of emission reduction.
• States will need to meet an interim goal and a final goal.
9
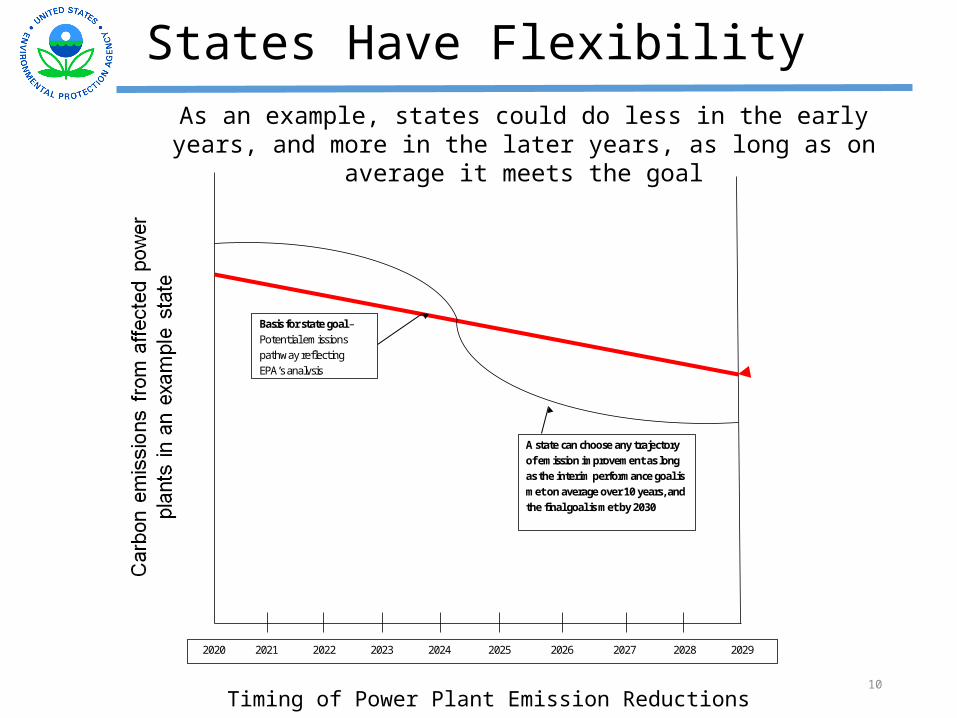
States Have Flexibility
Basis for state goal – Potential emissions pathway reflecting EPA’s analysis
2020 2021 2022 2023 2024 2025 2026 2027 2028 2029
A state can choose any trajectory of emission improvement as long as the interim performance goal is met on average over 10 years, and the final goal is met by 2030
10
As an example, states could do less in the early years, and more in the later years, as long as on average it meets the goal
Timing of Power Plant Emission Reductions
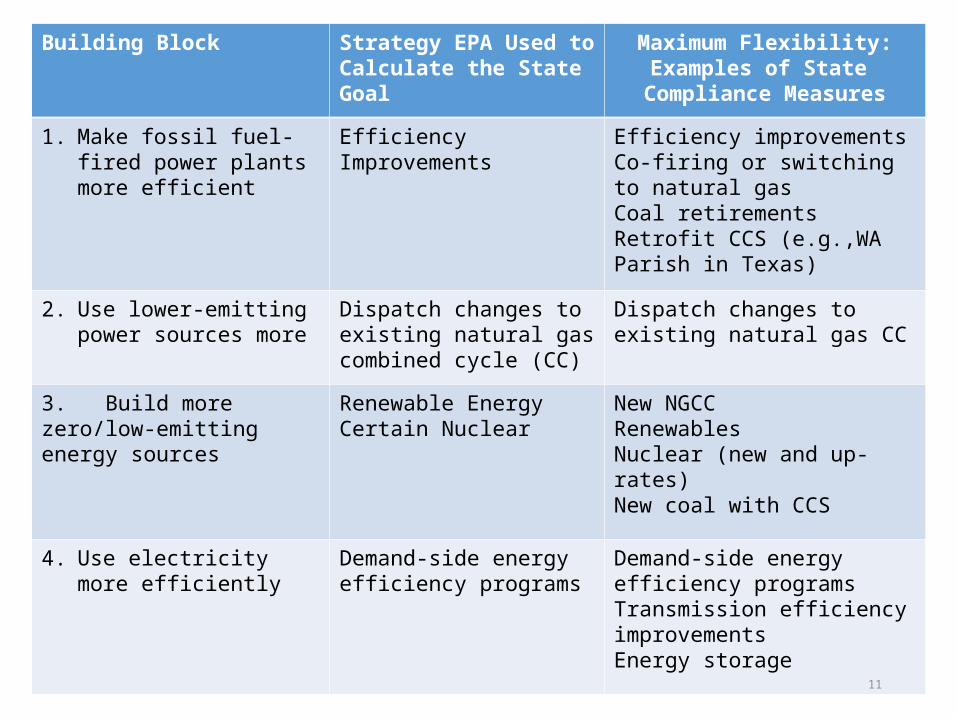
Building Block Strategy EPA Used to Calculate the State Goal
Maximum Flexibility:Examples of State
Compliance Measures
1. Make fossil fuel-fired power plants more efficient
Efficiency Improvements Efficiency improvementsCo-firing or switching to natural gasCoal retirementsRetrofit CCS (e.g.,WA Parish in Texas)
2. Use lower-emitting power sources more
Dispatch changes to existing natural gas combined cycle (CC)
Dispatch changes to existing natural gas CC
3. Build more zero/low-emitting energy sources
Renewable EnergyCertain Nuclear
New NGCCRenewablesNuclear (new and up-rates)New coal with CCS
4. Use electricity more efficiently
Demand-side energy efficiency programs
Demand-side energy efficiency programsTransmission efficiency improvementsEnergy storage
11

When States Plan, They Can:
• Look broadly across the power sector for strategies that get reductions. • Choose to rely to varying degrees on measures that EPA used to
calculate the goal, or on other measures that were not part of the state goal-setting analysis.
• Invest in existing energy efficiency programs or create new ones.• Consider market trends toward improved energy efficiency and a
greater reliance on lower carbon energy. • Tap into investments already being made to upgrade aging
infrastructure.• Expand renewable energy capacity.• Integrate their plans into existing power sector planning processes.• Design plans that use innovative, cost-effective regulatory strategies.• Develop a state-only plan or collaborate with each other to develop
plans on a multi-state basis.• Decide how to treat plants nearing the end of their useful life and how
to help plants avoid “stranded investments.”
12

Flexibilities Available To States
• Timing: • Up to 15-year window in which
to plan for and achieve reductions in carbon pollution.
• Up to two or three years to submit final plans.
• Form of goal: States can use either a rate-based or mass-based goal.
• Single or multi-state plans: States can collaborate and develop plans on a multi-state basis.
• Selection of measures: • States will choose how to meet
the goal through whatever collection of measures reflects its particular circumstances and policy objectives.
• State measures may impact and, in fact may be explicitly designed to reduce, CO2 emissions from utilities on a regional basis.
• EPA would support building off existing reduction programs.
13
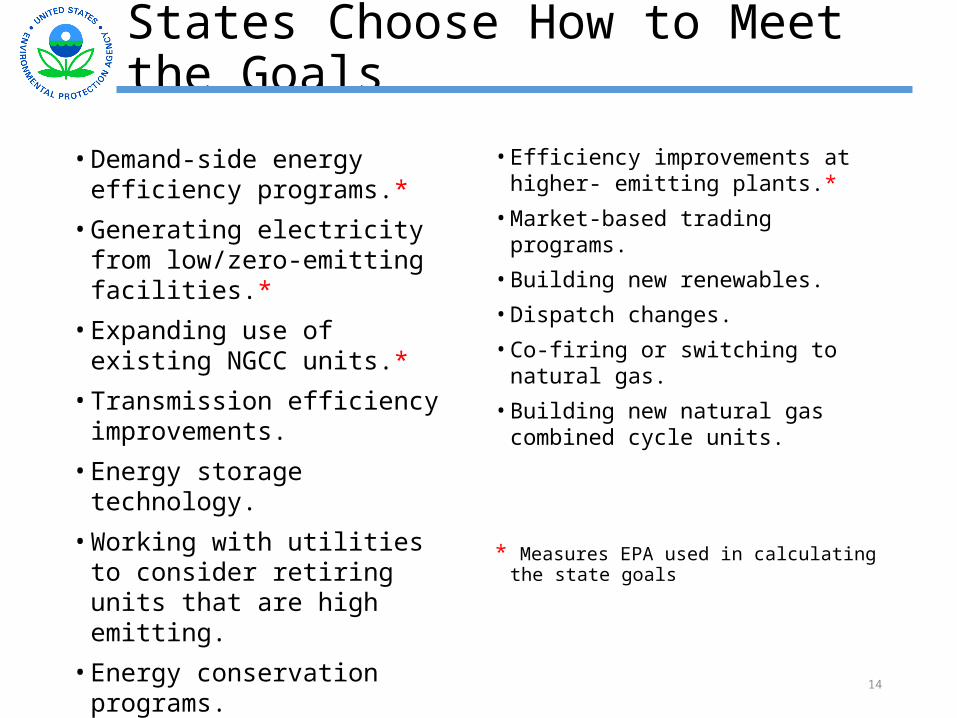
States Choose How to Meet the Goals
• Demand-side energy efficiency programs.*
• Generating electricity from low/zero-emitting facilities.*
• Expanding use of existing NGCC units.*
• Transmission efficiency improvements.
• Energy storage technology.
• Working with utilities to consider retiring units that are high emitting.
• Energy conservation programs.
• Retrofitting units with partial CCS.
• Use of certain biomass.
• Efficiency improvements at higher- emitting plants.*
• Market-based trading programs.
• Building new renewables.
• Dispatch changes.
• Co-firing or switching to natural gas.
• Building new natural gas combined cycle units.
* Measures EPA used in calculating the state goals
14

Benefits and Costs
• Nationwide, by 2030, this rule would help reduce CO2 emissions from the power sector by approximately 30% from 2005 levels.
• Also by 2030, reduce by over 25% pollutants that contribute to the soot and smog that make people sick.
• These reductions will lead to public health and climate benefits worth an estimated $55 billion to $93 billion in 2030.
• Proposal will avoid an estimated 2,700 to 6,600 premature deaths and 140,000 to 150,000 asthma attacks in 2030.
• Health and climate benefits far outweigh the estimated annual costs of meeting the standards.
• Estimated at $7.3 billion to $8.8 billion in 2030. • Proposal protects children and other vulnerable Americans from the
health threats posed by a range of pollutants.• Move us toward a cleaner, more stable environment for future
generations. • Ensures an ongoing supply of the reliable, affordable power needed for
economic growth.
15

After Proposal, Coal & Natural Gas Remain Leading Sources of Electricity Generation
16
Each more than 30% of projected generation in 2030

17
For More State-By-State Information
http://www.epa.gov/cleanpowerplan
Next Steps
• The proposed rule, as well as information about how to comment and supporting technical information, are available online at: http://www.epa.gov/cleanpowerplan
• EPA held 4 public hearings during the week of July 28th in Denver, Atlanta, Pittsburgh and Washington, D.C. Over 2700 individuals attended the public hearings, with 1322 making oral comments for the record.
• There will be a 120-day public comment period on the proposal. Submit comments by October 16, 2014.
• Comments on the proposal should be identified by Docket ID No. EPA-HQ-OAR-2013-0602.
18
19
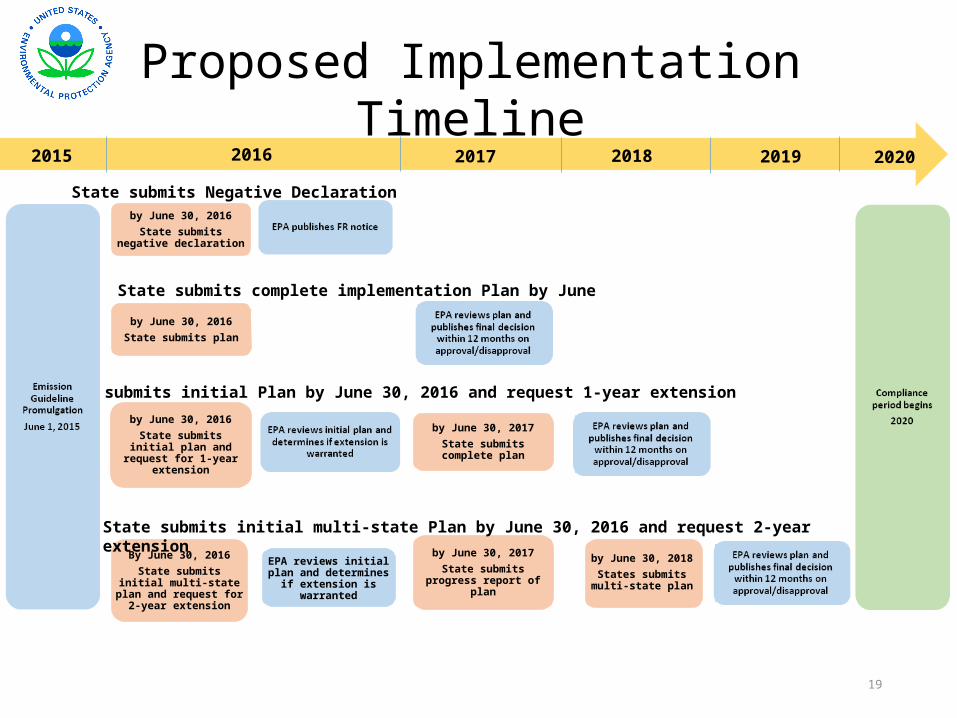
By June 30, 2016State submits initial multi-
state plan and request for 2-year extension
EPA reviews initial plan and determines if extension is
warranted
by June 30, 2017State submits progress report
of plan
by June 30, 2018States submits multi-
state plan
State submits Negative Declaration
State submits complete implementation Plan by June 30, 2016
State submits initial Plan by June 30, 2016 and request 1-year extension
State submits initial multi-state Plan by June 30, 2016 and request 2-year extension
by June 30, 2016State submits negative
declaration
by June 30, 2016State submits plan
by June 30, 2016State submits initial plan and request for 1-year extension
by June 30, 2017State submits complete plan
2015 2019
Proposed Implementation Timeline
20202016 2017 2018
Questions? Kristen Bremer
111(d) EPA HQ, Office of Air and Radiation Contact for Region 6
(919) 541-9424
20
Rob Lawrence111(d) EPA Region 6 Outreach
Coordinator
(214) 665-6580
Terry Johnson111(d) R6 Liaison for Texas,
Arkansas & Louisiana
(214) 665-2154
Clovis Steib111(d) R6 Liaison for Oklahoma &
New Mexico
(214) 665-7566
Josh Olszewski111(d) Regional Counsel
(214) 665-2178
Carrie Thomas111(d) Regional Counsel
(214) 665-7121
Austin Vela111(d) Office of External Affairs
(214) 665-9792
Air
Pro
gram
s
Lega
l
Pre
ss,
Inte
rgo
vern
men
tal
Aff
air
s &
Ou
trea
ch


