Download - Class 4 PowerPoint

Japan in the 21st Century
Robert CrokerJapanese Society II: Contemporary Japan
Center for Japanese StudiesNanzan University

Contents1. demographic change:
demography is destiny
2. economic change: macroeconomic blues
3. socioeconomic change: (not) sharing the pie

1. Demographic Change: demography is destiny

birth and death rates

Japan’s population

birth rates

death rates
life expectancy at birthGINI Country Report Japan
Page 59
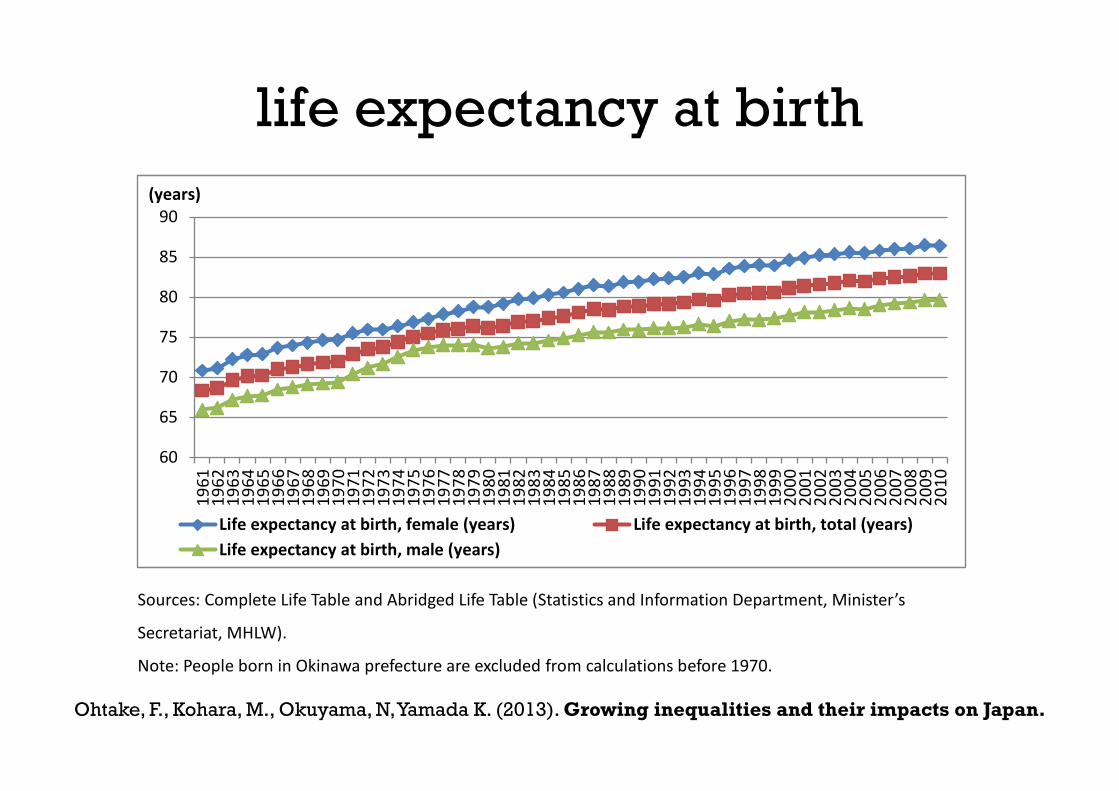
Figure 3.15: Life expectancy at birth by gender
Sources: Complete Life Table and Abridged Life Table (Statistics and Information Department, Minister’s
Secretariat, MHLW).
Note: People born in Okinawa prefecture are excluded from calculations before 1970.
Health is not only measured by life expectancy. Living actively is another important measure of health.
Comprehensive Survey on Living Conditions (MHLW) enquires about “self-reported state of health”
and “frequency of visits to a doctor.” The report states that about 8% of respondents had some health
problems and went to clinics or hospitals in 2010. The report also shows that the number of
unhealthy people increased between 1998 and 2007, and subsequently decreased. Considered that
Japan’s economy was in a fairly severe state between 1998 and 2001, relatively good state between
2001 and 2007, and subsequently in a little worse state, the state of health of people seems not to
move simply in accordance with economic conditions, although the increase in the number of
unhealthy people may be partly due to population aging.
Comprehensive Survey on Living Conditions also asks respondents about their health consciousness
and subjective health conditions. Figure 3.16 shows differences in subjective health between those
with different educational attainments. People with low educational levels report an unhealthy state,
60
65
70
75
80
85
9019
6119
6219
6319
6419
6519
6619
6719
6819
6919
7019
7119
7219
7319
7419
7519
7619
7719
7819
7919
8019
8119
8219
8319
8419
8519
8619
8719
8819
8919
9019
9119
9219
9319
9419
9519
9619
9719
9819
9920
0020
0120
0220
0320
0420
0520
0620
0720
0820
0920
10
(years)
Life expectancy at birth, female (years) Life expectancy at birth, total (years)Life expectancy at birth, male (years)
Ohtake, F., Kohara, M., Okuyama, N, Yamada K. (2013). Growing inequalities and their impacts on Japan.

ageing Japan
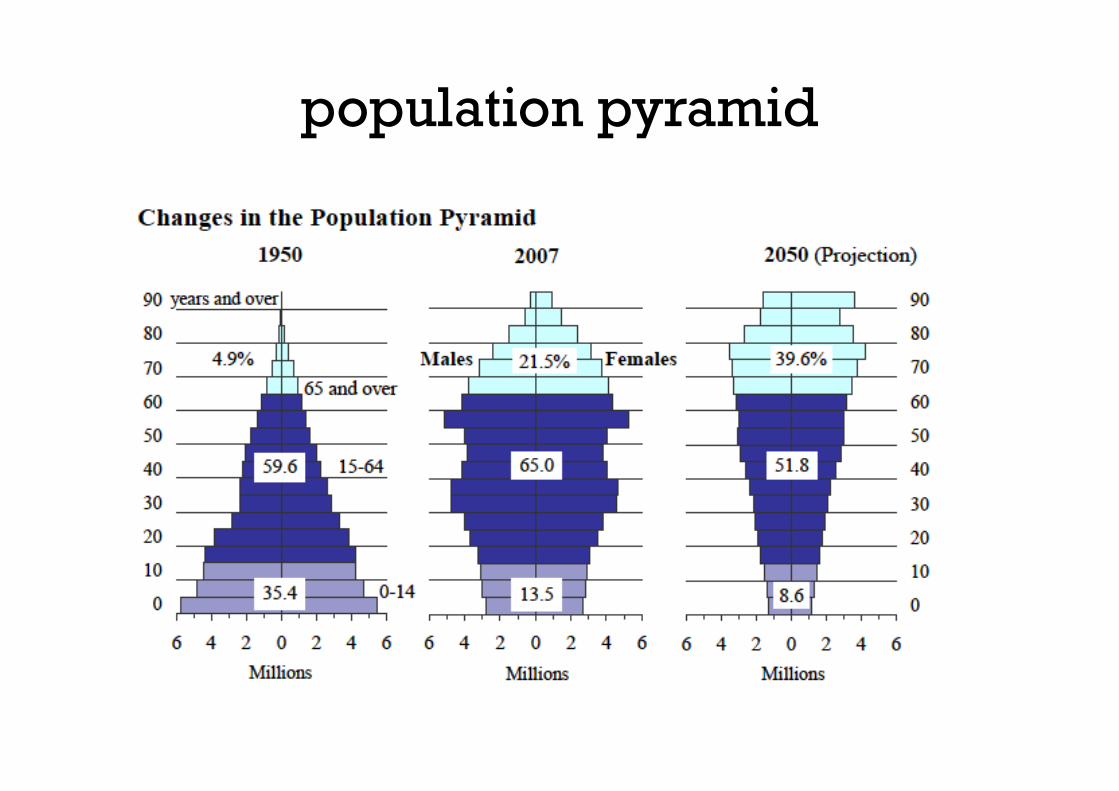
population pyramid
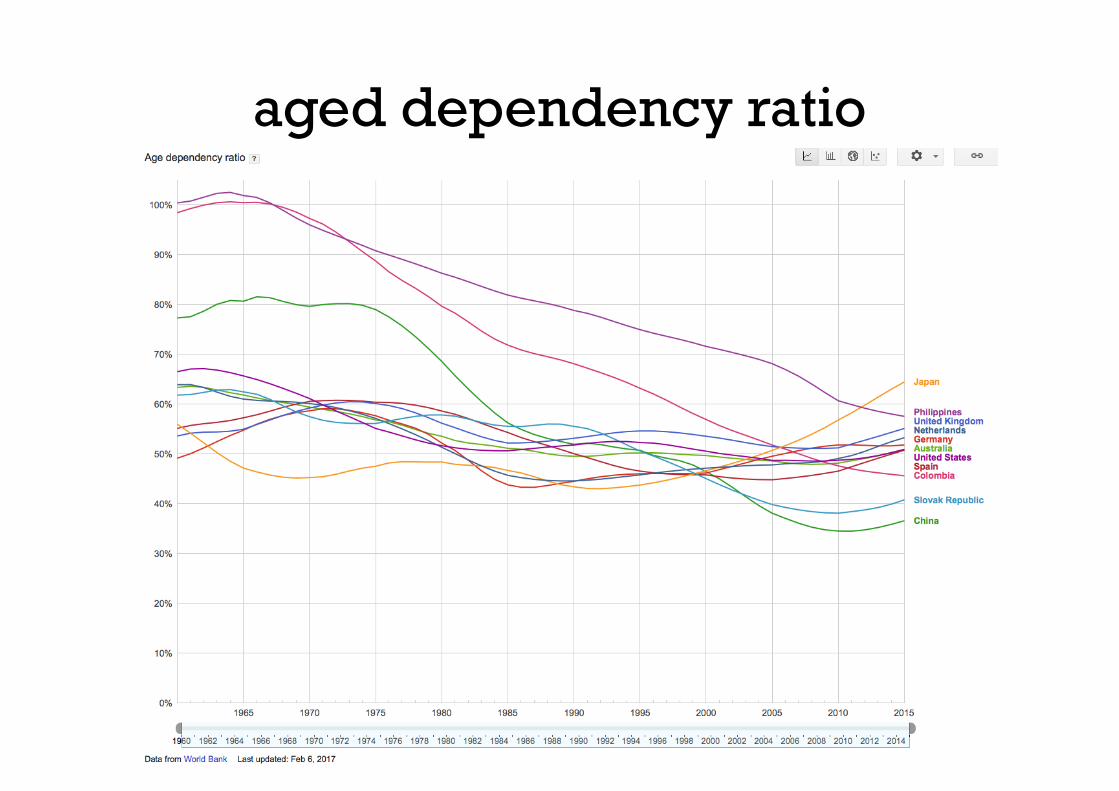
aged dependency ratio

population density map

2. Economic Change: macroeconomic blues

Ohtake, F., Kohara, M., Okuyama, N, Yamada K. (2013). Growing inequalities and their impacts on Japan.
nominal GDP: North America, China, Japan
Ohtake, F., Kohara, M., Okuyama, N, Yamada K. (2013). Growing inequalities and their impacts on Japan.
GINI Country Report Japan
Page 84
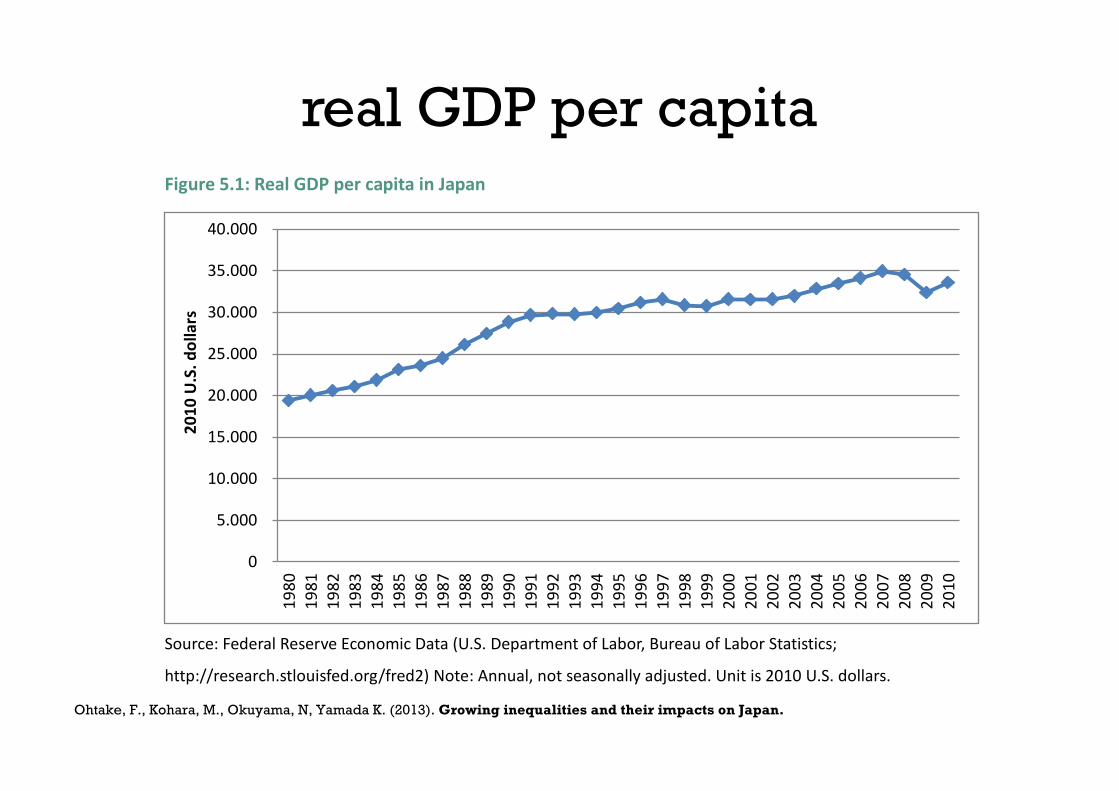
Figure 5.1: Real GDP per capita in Japan
Source: Federal Reserve Economic Data (U.S. Department of Labor, Bureau of Labor Statistics;
http://research.stlouisfed.org/fred2) Note: Annual, not seasonally adjusted. Unit is 2010 U.S. dollars.
Figure 5.2: Consumer Price Index for all items (index 2005=100)
Source: Main Economic Indicators (Organization for Economic Co-operation and Development)
0
5.000
10.000
15.000
20.000
25.000
30.000
35.000
40.000
1980
1981
1982
1983
1984
1985
1986
1987
1988
1989
1990
1991
1992
1993
1994
1995
1996
1997
1998
1999
2000
2001
2002
2003
2004
2005
2006
2007
2008
2009
2010
2010
U.S
. dol
lars
0
20
40
60
80
100
120
1970
-01-
0119
71-0
8-01
1973
-03-
0119
74-1
0-01
1976
-05-
0119
77-1
2-01
1979
-07-
0119
81-0
2-01
1982
-09-
0119
84-0
4-01
1985
-11-
0119
87-0
6-01
1989
-01-
0119
90-0
8-01
1992
-03-
0119
93-1
0-01
1995
-05-
0119
96-1
2-01
1998
-07-
0120
00-0
2-01
2001
-09-
0120
03-0
4-01
2004
-11-
0120
06-0
6-01
2008
-01-
0120
09-0
8-01
2011
-03-
01
real GDP per capita
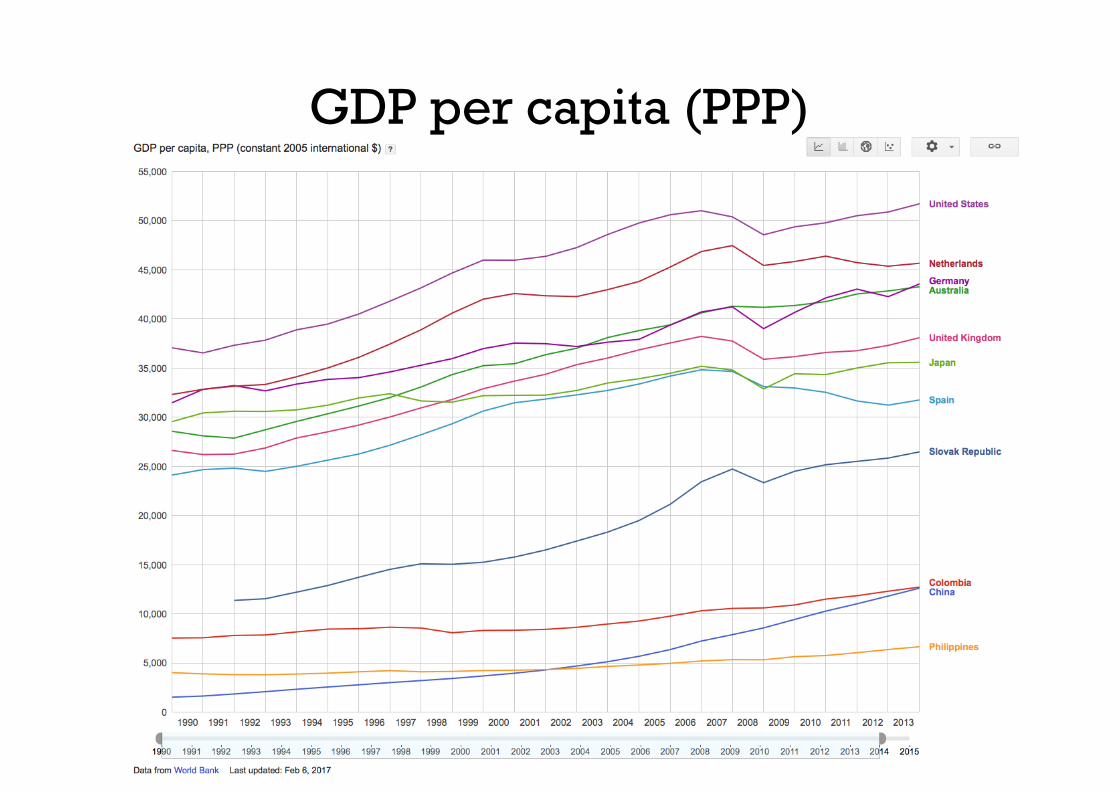
GDP per capita (PPP)

Ohtake, F., Kohara, M., Okuyama, N, Yamada K. (2013). Growing inequalities and their impacts on Japan.
government debt as % of GDPGINI Country Report Japan
Page 85
Figure 5.3: Government Debt as a % of GDP
Source: World Economic Outlook (International Monetary Fund)
Note. Gross debt consists of all liabilities that require payment or payments of interest and/or principal by the
debtor to the creditor at a date or dates in the future. This includes debt liabilities in the form of Special
Drawing Rights (SDRs), currency and deposits, debt securities, loans, insurance, pensions and standardized
guarantee schemes, and other accounts payable. Debt can be valued at current market, nominal, or face values.
http://research.stlouisfed.org/fred2/series/GGGDTPJPA188N.
5.2 Minimum Wage
The following sections summarize government policies related to inequality. Figure 5.4 shows that
the minimum wage has increased since 1997, stayed at the same level from 2001 to 2005, but
increased again from 2007. However, the relative level of the minimum wage to average wage in the
country—the Kaitz index—has not changed tremendously. Figure 5.5 shows the Kaitz index for males
and females, respectively. For males, the minimum wage level unchanged during 1980s, decreased
between 1990 and 1993, and then slightly increased after that. For females, it unchanged during
1980s, decreased largely between 1990 and 1993, stayed at the same level until 2004, and increased
after that. That is, through the entire period from 1980 till 2009, the relative level of minimum wage
is rather constant. The increase in the minimum wage is thought to have only small effects on
alleviating existing levels of income inequality (Kawaguchi and Mori, 2009).
0
50
100
150
200
250
1980
1981
1982
1983
1984
1985
1986
1987
1988
1989
1990
1991
1992
1993
1994
1995
1996
1997
1998
1999
2000
2001
2002
2003
2004
2005
2006
2007
2008
2009
2010

3. Socio-economic Change: (not) sharing the pie

Ohtake, F., Kohara, M., Okuyama, N, Yamada K. (2013). Growing inequalities and their impacts on Japan.
unemployment rate: males
GINI Country Report Japan
Page 23
Figure 2.12: Unemployment rate
Source: Labor Force Survey (Ministry of Internal Affairs and Communications (2010)).
Figure 2.13: Unemployment rate by age group and gender
Panel A. Male
0,0
1,0
2,0
3,0
4,0
5,0
6,0
1953
1955
1957
1959
1961
1963
1965
1967
1969
1971
1973
1975
1977
1979
1981
1983
1985
1987
1989
1991
1993
1995
1997
1999
2001
2003
2005
2007
2009
2011
(%)
Total Male Female
0
2
4
6
8
10
12
14
1989
1990
1991
1992
1993
1994
1995
1996
1997
1998
1999
2000
2001
2002
2003
2004
2005
2006
2007
2008
2009
(%)
Age 15-24 Age 25-34 Age 35-44 Age 45-54 Age 55-64
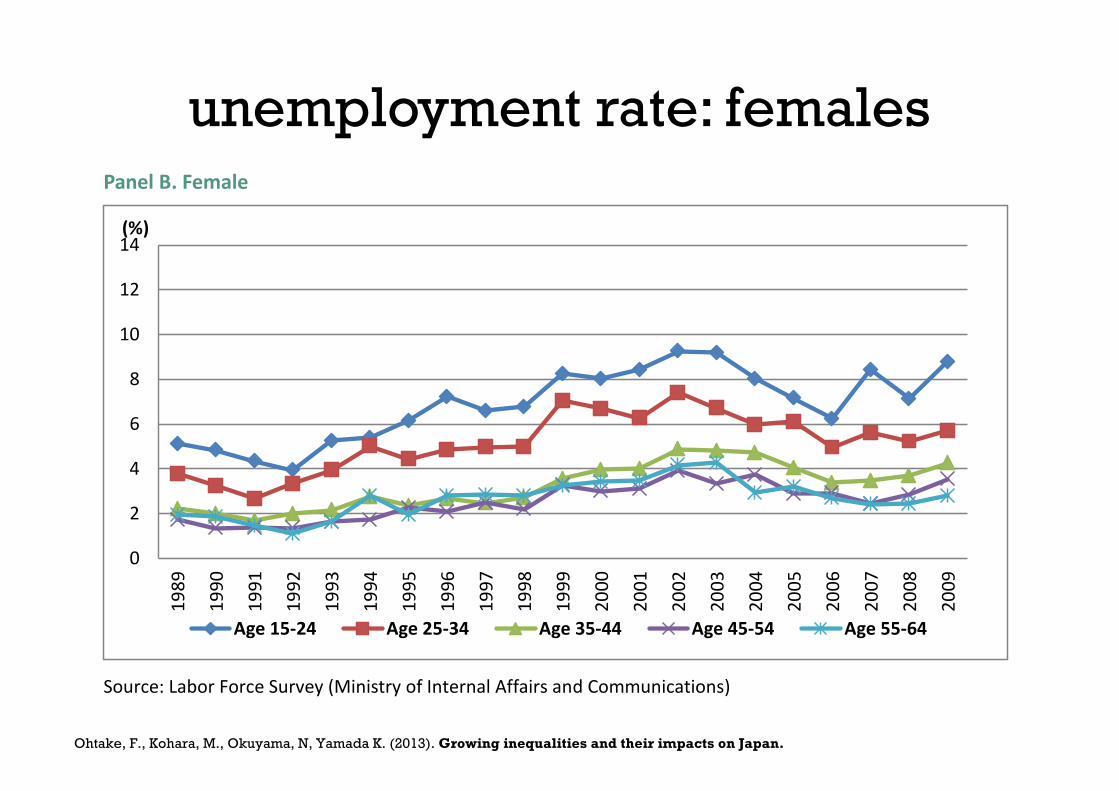
Ohtake, F., Kohara, M., Okuyama, N, Yamada K. (2013). Growing inequalities and their impacts on Japan.
unemployment rate: females GINI Country Report Japan
Page 24
Panel B. Female
Source: Labor Force Survey (Ministry of Internal Affairs and Communications)
Note: The listed unemployment rates are based on official data for every February from 1989 to 2009.
Table 2.2 summarizes the trend of the employment rate. The total employment rate decreased by
about 1% between 1983 and 1988, and increased by about 2.5% between 1989 and 1992. It then
started decreasing steadily after the economic bubble burst: decreased by about 5% between 1993
and 2004. It has remained at around 58% since 2007.
Figure 2.14 shows the trend of the employment rate for males (Panel A) and females (Panel B)
separately by age group. The male employment rate in the working-age population decreased in the
late 1990s. Especially for those aged 25-34, it was about 95% in the early 1990s, but declined to less
than 90% in the 2000s. For females, the employment rate increased for all age groups, but it is not at
a high level yet: Japan’s employment rate for those aged 15-64 was 60.1% in 2010 (Labour market
statistics, OECD Employment and Labour Market Statistics), which is lower than in North European
countries (70-80%), the United States (62.4%), the United Kingdom (65.3%), and Germany (66.1%),
but is at the same level as France (59.7%).
0
2
4
6
8
10
12
14
19
89
19
90
19
91
19
92
19
93
19
94
19
95
19
96
19
97
19
98
19
99
20
00
20
01
20
02
20
03
20
04
20
05
20
06
20
07
20
08
20
09
(%)
Age 15-24 Age 25-34 Age 35-44 Age 45-54 Age 55-64

percent of workforce unionized
Ohtake, F., Kohara, M., Okuyama, N, Yamada K. (2013). Growing inequalities and their impacts on Japan.
GINI Country Report Japan
Page 72
4.3. Unionized Workforce
The labor unionization rate has declined significantly, especially since the late 1970s (Figure 4.4).
Behind this downward trend is a change in Japan’s employment conditions. As seen in Chapter 2,
regular full-time workers have decreased and non-standard part-time workers have increased since
the late 1990s.
Figure 4.3: Percentage of workforce unionized
Source: The number of union employees is from Basic Survey on Labour Unions (MHLW), and the number of
employees is from Labour Force Survey (Statistic Bureau).
Note: The figure shows the ratio of the number of employees in labor unions relative to the total number of
employees in Japan.
A decline in the rate of union participation is also observed in the following figure. Figure 4.4 shows
the kinds of voluntary organizations and activities in which Japanese people participate, and changes
in the 1990s. The big changes between 1990 and 2000 are a decrease in labor unions and an increase
in religious groups. An increase in religious groups may reflect an increase in social and economic
instability or uncertainty, which might be related to an increase in Inequality.
0,0
10,0
20,0
30,0
40,0
50,0
60,0
1947
1949
1951
1953
1955
1957
1959
1961
1963
1965
1967
1969
1971
1973
1975
1977
1979
1981
1983
1985
1987
1989
1991
1993
1995
1997
1999
2001
2003
2005
2007
2009
(%)

GINI Country Report Japan
Page 28
Figure 2.15: Proportion of non-standard workers among all employees
Source: The Special Survey of the Labour Force Survey (1984–2001), and Labour Force Survey (2002–present)
(both by Ministry of Health, Labour, and Welfare).
Note: The figure shows the ratio of non-standard workers to employees, excluding executives of companies or
corporations. Non-standard workers include part-time workers, contract employees, and casualized workers.
When discussing Japan’s labor market inequality, close attention needs to be paid to the wage gap
between part-time employees and full-time employees. Figure 2.16 shows the income inequality
between the two. During the period from 1980 to 2002, the hourly wage rate received by part-time
employees declined continually compared to that of full-time employees. In the 2000s, part-time
hourly wages appeared to increase slightly, but male (female) part-time employees are paid only half
(60%) as much as full-time employees. This slight increase has not mitigated large increases in the
share of non-standard workers either of men or women.
0
10
20
30
40
50
60
1984
1985
1986
1987
1988
1989
1990
1991
1992
1993
1994
1995
1996
1997
1998
1999
2000
2001
2002
2003
2004
2005
2006
2007
2008
2009
2010
2011
2012
(%)
Total Male Female
number of ‘non-standard’ workers
Ohtake, F., Kohara, M., Okuyama, N, Yamada K. (2013). Growing inequalities and their impacts on Japan.

poverty rates by age
Ohtake, F., Kohara, M., Okuyama, N, Yamada K. (2013). Growing inequalities and their impacts on Japan.
GINI Country Report Japan
Page 36
Figure 2.23: Poverty rates calculated by disposable income
Source: Authors’ calculations using micro data taken from the NSFIE.
Note: The figure shows the ratio of the number of people whose income is less than or equal to half of the
national median income. For calculation, household income and consumption is divided by square root of the
number of household members.
0,00
0,02
0,04
0,06
0,08
0,10
0,12
0,14
0,16
0-4
5-9
10-1
4
15-1
9
20-2
4
25-2
9
30-3
4
35-3
9
40-4
4
45-4
9
50-5
4
55-5
9
60-6
4
65-6
9
70-7
4
75-
Pove
rty
Rate
1984 1994 2004
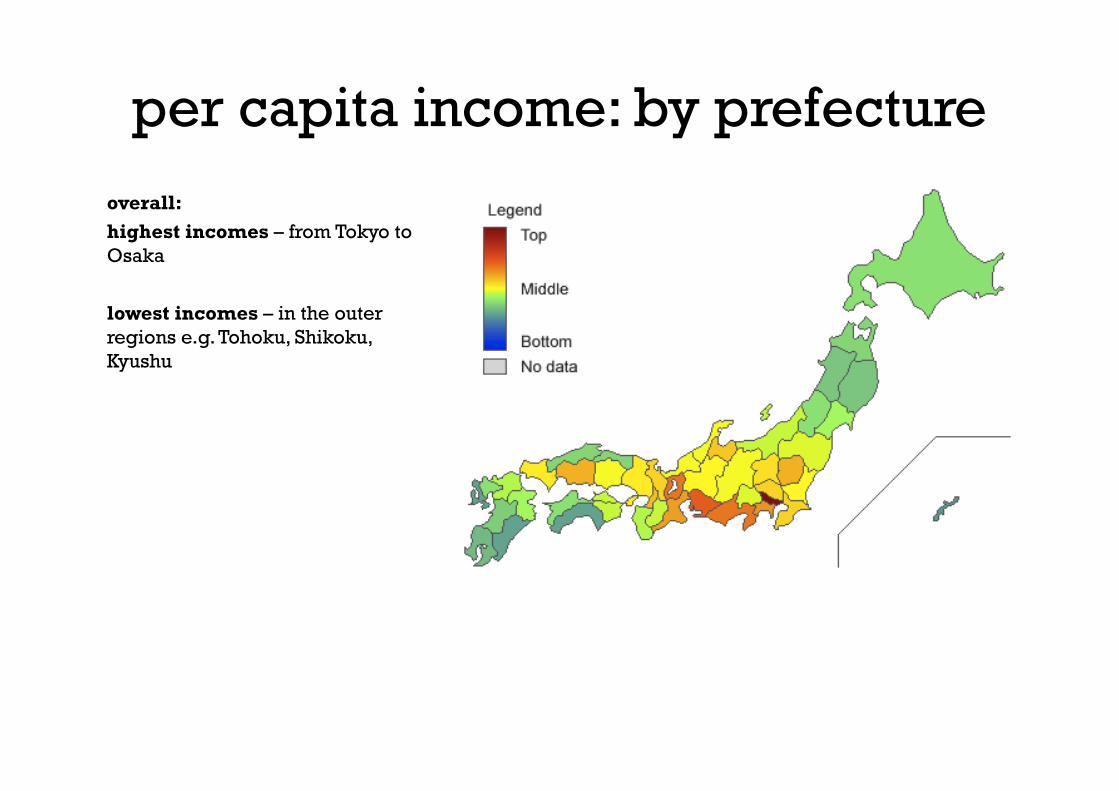
overall: highest incomes – from Tokyo to Osaka
lowest incomes – in the outer regions e.g. Tohoku, Shikoku, Kyushu
per capita income: by prefecture
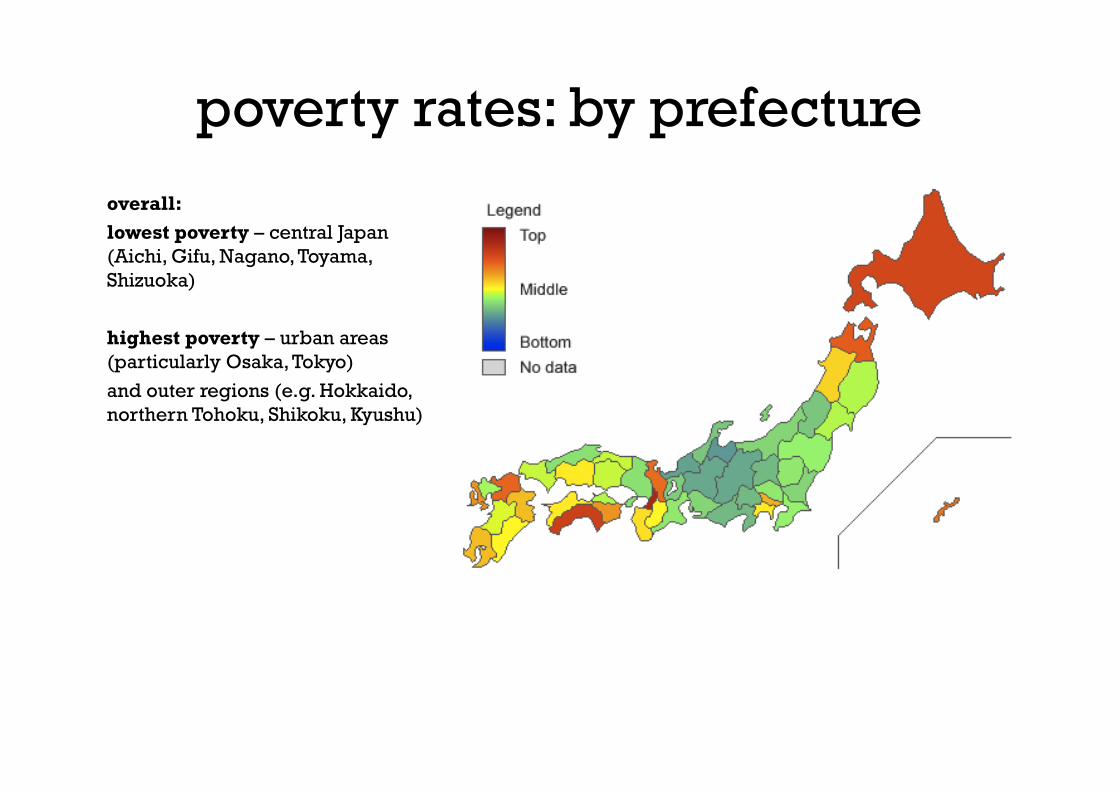
overall: lowest poverty – central Japan (Aichi, Gifu, Nagano, Toyama, Shizuoka)
highest poverty – urban areas (particularly Osaka, Tokyo) and outer regions (e.g. Hokkaido, northern Tohoku, Shikoku, Kyushu)
poverty rates: by prefecture
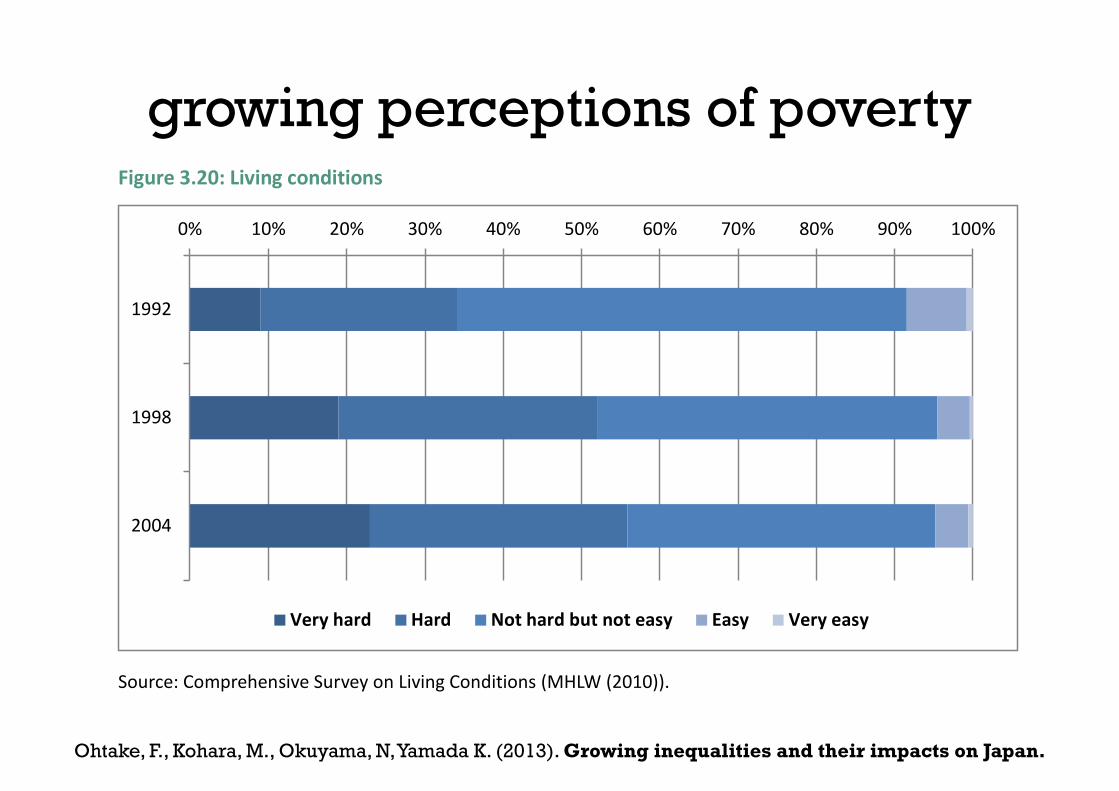
growing perceptions of poverty
Ohtake, F., Kohara, M., Okuyama, N, Yamada K. (2013). Growing inequalities and their impacts on Japan.
GINI Country Report Japan
Page 65
Figure 3.20: Living conditions
Source: Comprehensive Survey on Living Conditions (MHLW (2010)).
Figure 3.21: Living conditions by income quintiles
Source: Comprehensive Survey on Living Conditions (MHLW (2010)).
0% 10% 20% 30% 40% 50% 60% 70% 80% 90% 100%
1992
1998
2004
Very hard Hard Not hard but not easy Easy Very easy
0% 10% 20% 30% 40% 50% 60% 70% 80% 90% 100%
199219982004199219982004199219982004199219982004
III
IIIIV
Very hard Hard Not hard but not easy Easy Very easy

growing perceptions of inequality
Ohtake, F., Kohara, M., Okuyama, N, Yamada K. (2013). Growing inequalities and their impacts on Japan.
GINI Country Report Japan
Page 79
redistribution policies.
Figure 4.10: Percentage of people who agree that “inequalities are too large in the country”
Source: International Social Survey Programme (1999, 2009)
http://zacat.gesis.org/webview/index.jsp?object=http://zacat.gesis.org/obj/fStudy/ZA3430
http://zacat.gesis.org/webview/index.jsp?object=http://zacat.gesis.org/obj/fStudy/ZA5400
Note: The figure summarizes answers to the question “How much do you agree or disagree ‘Differences in
income in Japan are too large’?”
Figure 4.11: Percentage of people who agree that the “poor are lazy”
Source: World Values Survey (2000, 2005) Note. The figure summarizes answers to the question “Do you agree
or disagree with the following statements?: People who don’t work become lazy.”
Figure 4.12: Percentage of people who agree that the “government should redistribute
0% 10% 20% 30% 40% 50% 60% 70% 80% 90% 100%
1999
2009
Strongly agree Agree Neither agree nor disagree
Disagree Strongly disagree Cant choose
0% 10% 20% 30% 40% 50% 60% 70% 80% 90% 100%
2000
2005
Strongly agree Agree Neither agree Disagree Strongly disagree
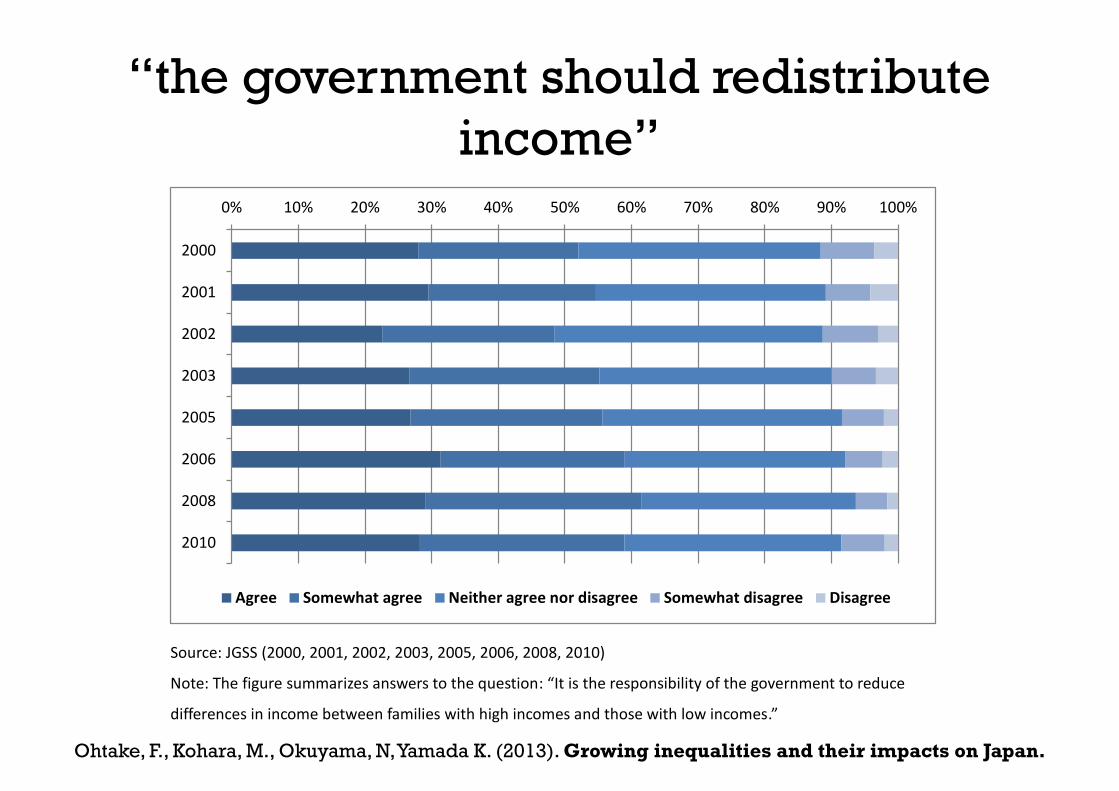
“the government should redistribute income”
Ohtake, F., Kohara, M., Okuyama, N, Yamada K. (2013). Growing inequalities and their impacts on Japan.
GINI Country Report Japan
Page 80
wealth/income”
Source: JGSS (2000, 2001, 2002, 2003, 2005, 2006, 2008, 2010)
Note: The figure summarizes answers to the question: “It is the responsibility of the government to reduce
differences in income between families with high incomes and those with low incomes.”
4.7. Chapter Conclusion: Appraisal of the Interdependence and the National Story
of Inequality Drivers and their Cultural and Political Impacts
In this chapter, we showed how individuals connect to society in Japan. First, we looked at voting
behavior. The voting rate is about 67% in Japan (this is also about the average among OECD countries)
and has gradually decreased over three decades. There is no difference in voting rate by educational
level, while the voting rate is significantly higher among older people than among younger people.
Second, we found that the labor unionization rate has steadily decreased over time. This reflects a
weakening of the traditional seniority system and increase in non-standard employees in Japanese
companies. Third, we found that the level of trust in others is about average in OECD countries and
increased between 1998 and 2007. Fourth, regarding political positions, about 30% of Japanese
position themselves as conservative and about 20% as progressive. The share of people with
0% 10% 20% 30% 40% 50% 60% 70% 80% 90% 100%
2000
2001
2002
2003
2005
2006
2008
2010
Agree Somewhat agree Neither agree nor disagree Somewhat disagree Disagree

definition: poverty rates before taxes and transfers … and after taxes and transfers
OECD overall: before tax – highafter tax – much lower
Japan overall: before tax – lowafter tax - higher
over time:increasing inequality,
before tax and after tax
reducing the poverty rate

number of households on welfare
Ohtake, F., Kohara, M., Okuyama, N, Yamada K. (2013). Growing inequalities and their impacts on Japan.
GINI Country Report Japan
Page 17
Figure 2.6: Changes in the number of households living on welfare
Source: Care Reports of Welfare Administration (Ministry of Health, Labour and Welfare (2010)).
Note: The bars show the number of people living on welfare support, which is measured on the right axis. The
line shows their percentage (number relative to 1,000 persons), which is measured on the left axis.
2.1.5. Educational Inequality
Table 2.1 shows the average years of education for various countries. Japan is ranked in the higher
group. Figure 2.7 shows that the Gini coefficient for years of education becomes smaller as age
decreases for groups aged between 60 and 85. The Gini coefficient becomes gradually higher as age
decreases for groups aged between 35 and 39, and it becomes clearly higher as age decreases for
groups aged between 20 and 34. Because Japanese people rarely go back to school once they started
working, this trend means that the inequality in years of education fell in the 1960s, started
increasing in the early 1970s, and increased gradually for three decades, expanding further from the
early 2000s.
Table 1.1: Mean years of education
Country Mean Education Years
500 000
1 000 000
1 500 000
2 000 000
2 500 000
0
0,005
0,01
0,015
0,02
0,02519
5519
6119
6319
6519
6719
6919
7119
7319
7519
7719
7919
8119
8319
8519
8719
8919
9119
9319
9519
9719
9920
0120
0320
0520
0720
09
(people) (% )

types of families on welfare
Ohtake, F., Kohara, M., Okuyama, N, Yamada K. (2013). Growing inequalities and their impacts on Japan.
GINI Country Report Japan
Page 39
Figure 2.26: Welfare recipients by family type (monthly average)
Source: Care Reports of Welfare Administration (MHLW (2010)).
Note: The number of individuals is measured on the vertical axis.
Figure 2.27: Welfare recipients by age group
Source: National Survey of Public Assistance Recipients (MHLW (2010)).
Note: The number of individuals is measured on the vertical axis.
0 200 000 400 000 600 000 800 000
1 000 0001 200 0001 400 0001 600 000
1980
1981
1982
1983
1984
1985
1986
1987
1988
1989
1990
1991
1992
1993
1994
1995
1996
1997
1998
1999
2000
2001
2002
2003
2004
2005
2006
2007
2008
2009
2010
Total Households of the agedHouseholds of the disabled/invalid Households of mother and child(ren)Other Households
0
200.000
400.000
600.000
800.000
1.000.000
1.200.000
1.400.000
1.600.000
1.800.000
2000 2001 2002 2003 2004 2005 2006 2007 2008 2009
0-19 20-39 40-59 60-

poverty rates by age
Ohtake, F., Kohara, M., Okuyama, N, Yamada K. (2013). Growing inequalities and their impacts on Japan.
GINI Country Report Japan
Page 36
Figure 2.23: Poverty rates calculated by disposable income
Source: Authors’ calculations using micro data taken from the NSFIE.
Note: The figure shows the ratio of the number of people whose income is less than or equal to half of the
national median income. For calculation, household income and consumption is divided by square root of the
number of household members.
0,00
0,02
0,04
0,06
0,08
0,10
0,12
0,14
0,16
0-4
5-9
10-1
4
15-1
9
20-2
4
25-2
9
30-3
4
35-3
9
40-4
4
45-4
9
50-5
4
55-5
9
60-6
4
65-6
9
70-7
4
75-
Pove
rty
Rate
1984 1994 2004

definition: overview of reading, mathematical and scientific literacy
Japan: very low – 0.4%#1 lowest in the OECD
United States: low – 2.2%#5 lowest in the OECD
Dimension 1 Mater ia l wel l -being
more than a certain degree, from the average standard of living of the society in which one lives.
The European Union offered its definition of poverty in 1984: “the poor are those whose resources (material, cultural, and social) are so limited as to exclude them from the minimum acceptable way of life in the Member States in which they live”. For practical and statistical purposes, this has usually meant drawing national poverty lines at a certain percentage of national median income.
Figure 1.1 shows the percentage of children growing up in relative poverty – defined as living in a household where the equivalent income is less than 50% of the national median – for 24 OECD countries.3
Critics have argued that relative poverty is not ‘real’ poverty, pointing out that many of those who fall below relative poverty lines enjoy a standard of living higher than at any time in the past or than most of the world’s children in the present. But this fails to acknowledge that in today’s OECD nations the cutting edge of poverty is the contrast, daily perceived, between the lives of the poor and the lives of those around them.
Nonetheless an international comparison based on a poverty line drawn at 50% of the median national income presents only a partial picture in that it makes no allowance for differences in national wealth. It shows, for example, that the child poverty rate in the United States is higher than in Hungary, but fails to show that 50% of median income (for a couple with two children) is approximately $7,000 in Hungary and $24,000 in the United States. The fact that a smaller percentage of children are growing up poor in the Czech
Figure 1.1 Relative income poverty: Percentage of children (0-17 years) in households with equivalent income less than 50% of the median.
0 5 10 15 20 25
Date: 2000,1999 (Australia, Austria and Greece), 2001 (Germany, New Zealand and Switzerland).
United States
New Zealand
United Kingdom
Italy
Ireland
Spain
Portugal
Poland
Japan
Canada
Austria
Hungary
Greece
Australia
Germany
Netherlands
France
Czech Republic
Switzerland
Belgium
Sweden
Norway
Finland
Denmark
OECD Nations
Figure 1.2 Percentage of working-age households with children without an employed parent
Date: 2000, 1999 (Japan and Canada), 1998 (Switzerland), 2001 (Spain, the Netherlands, and Germany), 2002 (Austria, Norway and Poland). Non-OECD, 2004 (Israel).
0 2 4 6 8 10 12
Israel
Hungary
Australia
Poland
Germany
United Kingdom
Czech Republic
New Zealand
Ireland
France
Netherlands
Norway
Spain
Denmark
Belgium
Italy
Finland
Canada
Sweden
Greece
United States
Austria
Switzerland
Portugal
Japan
OECD Nations
Non-OECD Nations
6 I N N O C E N T I R E P O R T C A R D 7
children without employed parent
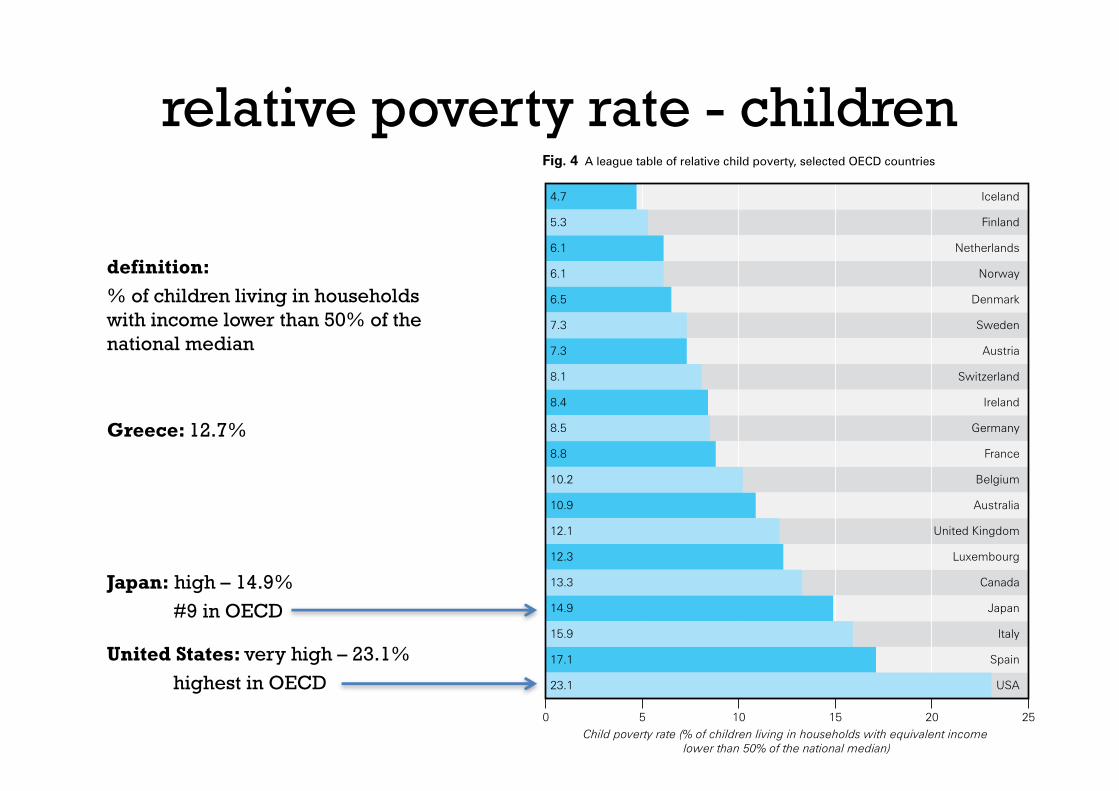
definition: % of children living in households with income lower than 50% of the national median
Greece: 12.7%
Japan: high – 14.9%#9 in OECD
United States: very high – 23.1%highest in OECD USA
Spain
Italy
Japan
Canada
Luxembourg
United Kingdom
Australia
Belgium
France
Germany
Ireland
Switzerland
Austria
Sweden
Denmark
Norway
Netherlands
Finland
Iceland
23.1
17.1
15.9
14.9
13.3
12.3
12.1
10.9
10.2
8.8
8.5
8.4
8.1
7.3
7.3
6.5
6.1
6.1
5.3
4.7
0 5 10 15 20 25Child poverty rate (% of children living in households with equivalent income
lower than 50% of the national median)
(see Box 8: The public view). Life at 50% of median income in poorer countries like Bulgaria and Romania may not signify the same level of difference, or imply the same degree of social exclusion, as it does in Denmark or Norway. That said, it should also be noted that at very low levels of income even small differences can make a significant difference to opportunities and living standards.
Since the enlargement of the European Union to 25 countries in 2004 and then to 27 countries in 2007, this problem of ‘the meaning of the median’ has become more pressing. Cross-national comparisons in the European Union must now span a group of countries whose annual per capita incomes range from less than
$14,000 to around $85,000. A relative income poverty line based on 50% of median incomes will inevitably struggle to reflect this new diversity.
Figure 3 illustrates the problem. This shows, for example, that the 10 richest countries have poverty lines that are higher than the median incomes of the 10 poorest countries. This means that children who are below the relative poverty line in France or Germany may be significantly better off in actual living standards than children who are living at the median income level in Poland or Portugal.v Or to take another example, a child living at the relative poverty line in the Netherlands has double the income of a child living at the median income level in a country like Hungary (Figure 3).
Finally there is the worry that comparing relative child poverty rates on the basis of household incomes cannot take into account significant differences between countries in the cost of living and especially in the costs of essential goods and services such as health and child care. An income of $30,000 in country A, where such services are free or heavily subsidized, may imply a very different standard of living from the same income in country B where such items must be paid for at market rates.
In sum, a relative poverty line drawn at 50% of median income is an attempt to define a concept of poverty on which there is widespread agreement in principle – a concept which says that the poor are those who do not have access to the possessions, amenities, activities and opportunities that are considered normal by most people in the society in which they live (see Boxes 6, 8 and 9). But when using this yardstick to make comparisons between countries, it is probably better to restrict the comparison to those generally wealthier countries where living on incomes below 50% of median implies a similar level of risk of social exclusion. Figure 4, for example, restricts the comparison of relative child poverty rates to the 20 OECD countries with annual per capita incomes of more than $31,000.
Deprivation doubts These concerns and problems have led to increasing pressure for the relative income measure to be supplemented by a more direct measure of child poverty.
Within individual economically advanced countries, direct measures of child deprivation are sometimes available. They have been deployed, for example, in Finland, Germany, Greece, Ireland, the Netherlands, Sweden, and the United Kingdom.vi Internationally, the Child Deprivation Index presented in Figure 1a is the first attempt to meet this need. As already noted, it is made
Note: Data refer to children aged 0 to 17.Sources: Calculations based on EU-SILC 2009, HILDA 2009, SLID 2009, SHP 2009, PSID 2007. Results for Japan are from Cabinet Office, Gender Equality Bureau (2011).
Fig. 4 A league table of relative child poverty, selected OECD countries
I N N O C E N T I R E P O R T C A R D 1 0 1 1
relative poverty rate - children
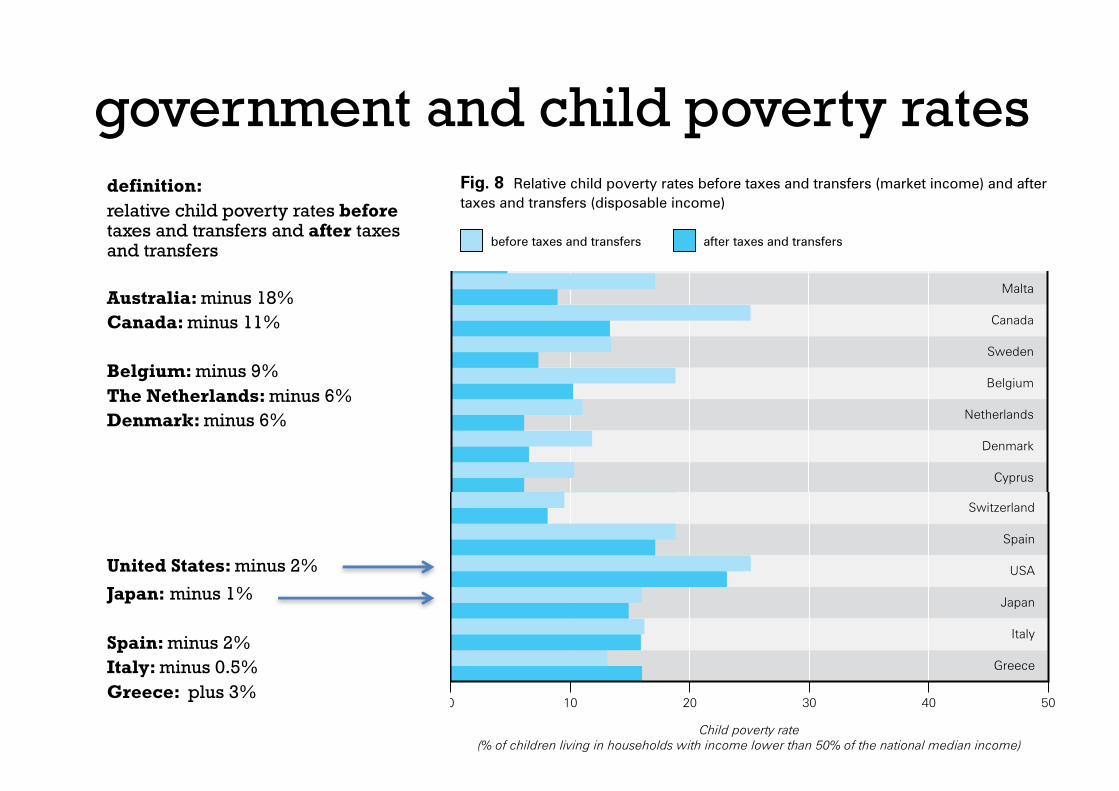
definition: relative child poverty rates beforetaxes and transfers and after taxes and transfers
Australia: minus 18%Canada: minus 11%
Belgium: minus 9%The Netherlands: minus 6%Denmark: minus 6%
United States: minus 2%
Japan: minus 1%
Spain: minus 2%Italy: minus 0.5%Greece: plus 3%
Greece
Italy
Japan
USA
Spain
Switzerland
Latvia
Romania
Poland
Bulgaria
Portugal
Estonia
Lithuania
Slovakia
Cyprus
Denmark
Netherlands
Belgium
Sweden
Canada
Malta
Iceland
Luxembourg
Germany
Slovenia
France
Norway
Czech Republic
Austria
New Zealand
Australia
Finland
United Kingdom
Hungary
Ireland
Child poverty rate(% of children living in households with income lower than 50% of the national median income)
0 10 20 30 40 50
large part the result of global economic trends. But that does not mean that it is inevitable. It is within the power of every government in the OECD to set realistic targets for reducing relative child poverty and to put in place the policies and the monitoring systems required to meet those targets.xii Figure 1b shows that a realistic target for the countries with relative child poverty rates below 10% would be to renew the struggle to reduce the rate to 5% or lower. Similarly, the 12 countries with rates between 10% and 15% should aim at lowering relative child poverty below 10%. The 8 countries currently with rates of 15% to 25% have the capacity to bring the rate below the 15% level as an essential first step.
Announcing such targets is of course not enough. It is now more than 20 years, for example, since the Government of Canada announced that it would “seek to eliminate child poverty by the year 2000.” Yet Canada’s child poverty rate is higher today than when that target was first announced.xiii In part this is because the commitment was not backed by a compelling political and public consensus or by any firm agreement on how child poverty should be defined and monitored. Targets can only be a first step.
In the past, the European Commission has done much to help EU countries to develop common indicators for the measurement of child poverty and to develop plans for its reduction (see Box 7: The European Union: 2020 vision). But since the economic crisis began, child poverty appears to have slipped down the Commission’s agenda. Children barely feature, for example, in the Europe 2020 strategy. In particular, the Commission appears reluctant to publish cross-national data on falling government expenditures for children and families. Later this year (2012), the Commission is due to make proposals to member states on child well-being. Those proposals should include targets for specific reductions in child poverty by the end of this decade.
Fig. 8 Relative child poverty rates before taxes and transfers (market income) and after taxes and transfers (disposable income)
Notes: For each country and for both income definitions, poverty calculations are based on a poverty line set at 50% of the national median disposable income. Countries are ordered by decreasing percentage of poverty reduction achieved. ‘Taxes and transfers’ takes into account all income taxes paid by households and all benefits that directly affect household incomes (i.e. not including in-kind or near-cash benefits).Sources: Calculations based on EU-SILC 2009, HILDA 2009, SLID 2009, SHP 2009 and PSID 2007. Results for New Zealand are from Perry (2011) and refer to 2010. Results for Japan are from Cabinet Office, Gender Equality Bureau (2011).
before taxes and transfers after taxes and transfers
1 8 I N N O C E N T I R E P O R T C A R D 1 0
government and child poverty rates

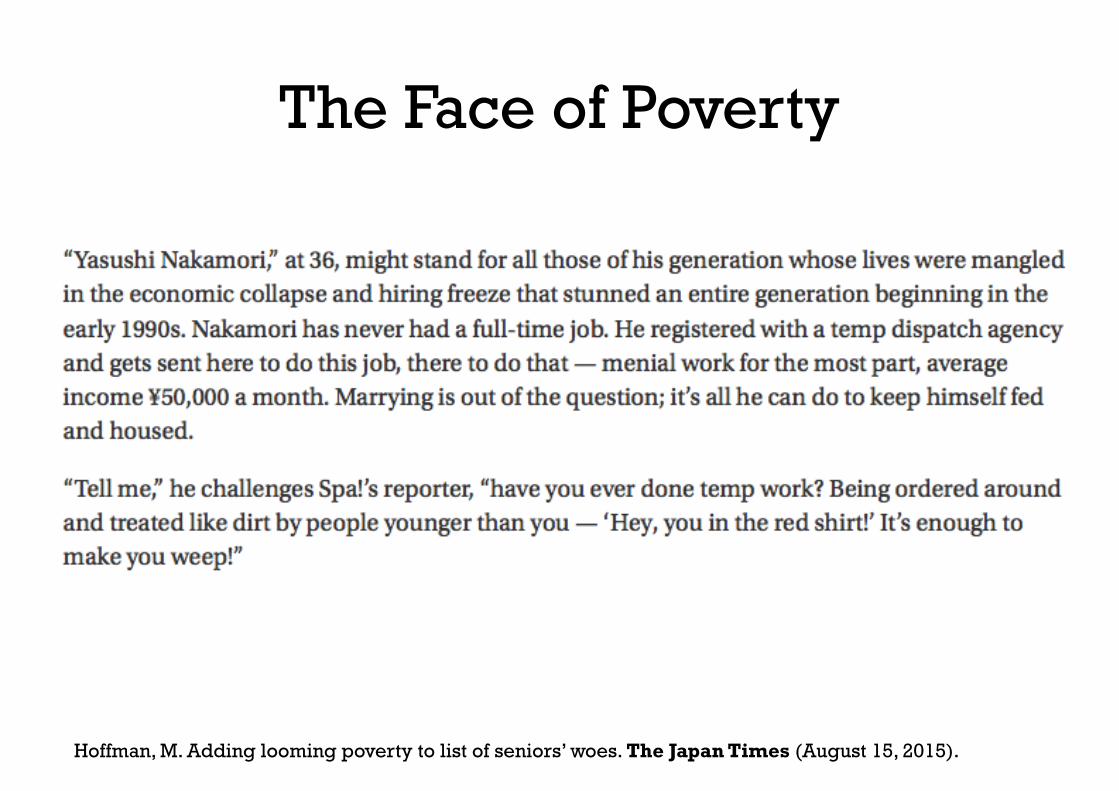
The Face of Poverty
Relative poverty rate:
single-parent households = 54.6%(mostly headed by mothers)
average family income = 2.43 million yen(= US$ 20 000)
families with both parents = 6.73 million yen( = US$ 57 000)
Food relief groups plan nationwide network to address growing poverty. The Japan Times (November 12, 2015).

Education
High school attendance:general population = 98.4%children living in poverty = 90%
University attendance:general population = 51%children living in poverty = 20%
Hoffman, M. Adding looming poverty to list of seniors’ woes. The Japan Times (August 15, 2015).

Crime
Number of crimes in Japan falls to postwar low in 2015. The Japan Times (January 14, 2016).
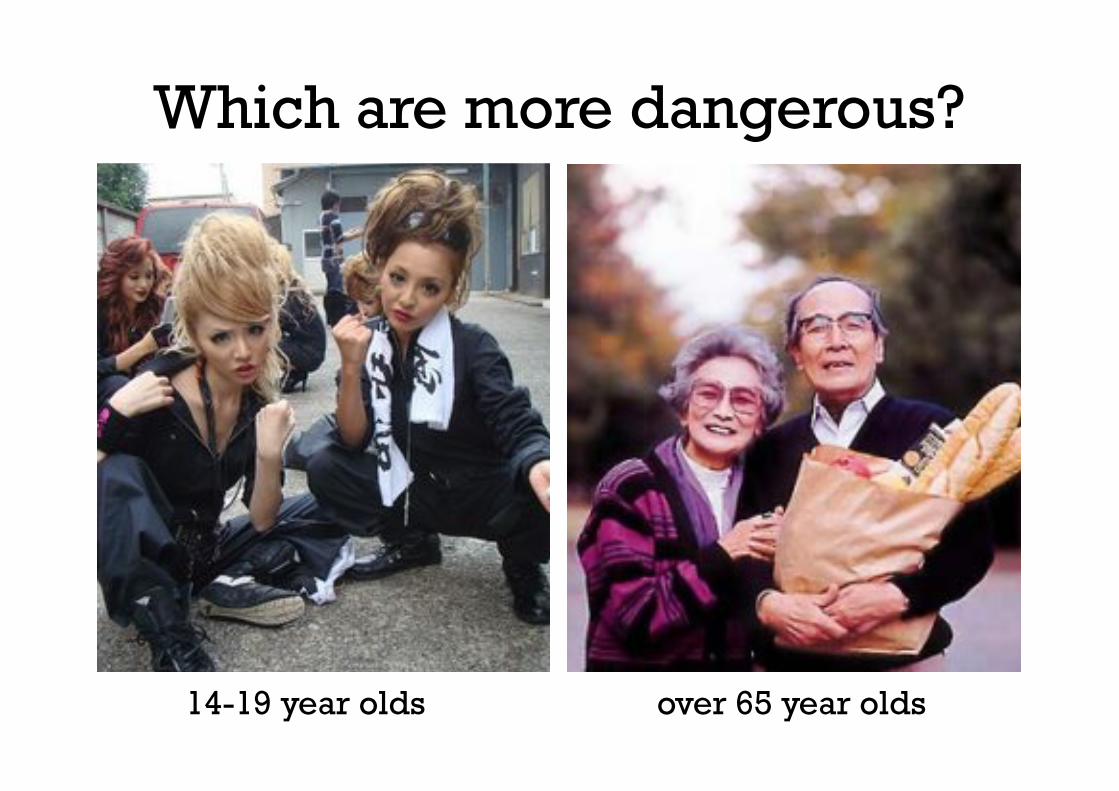
Which are more dangerous?
14-19 year olds over 65 year olds

Which are more dangerous?
39, 501 crimes (2015) 47, 643 crimes (2015)Hoffman, M. Adding looming poverty to list of seniors’ woes. The Japan Times (August 15, 2015).
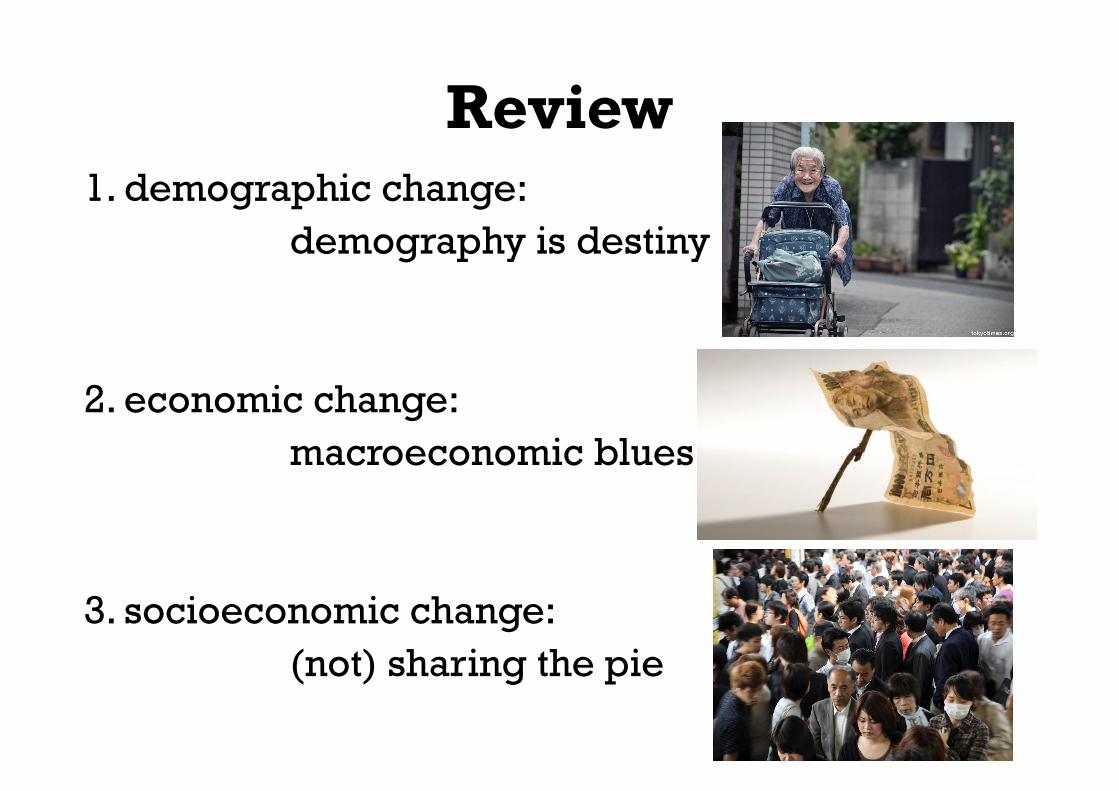
Review1. demographic change:
demography is destiny
2. economic change: macroeconomic blues
3. socioeconomic change: (not) sharing the pie

Review1. demographic change:
demography is destiny
population is fallingvery low birth rateageing populationinverted population pyramid

Review2. economic change:
macroeconomic blues
little real growth in the economylong-term deflationlittle growth in real wagesgrowing government debt – but not effectively
used to ameliorate poverty
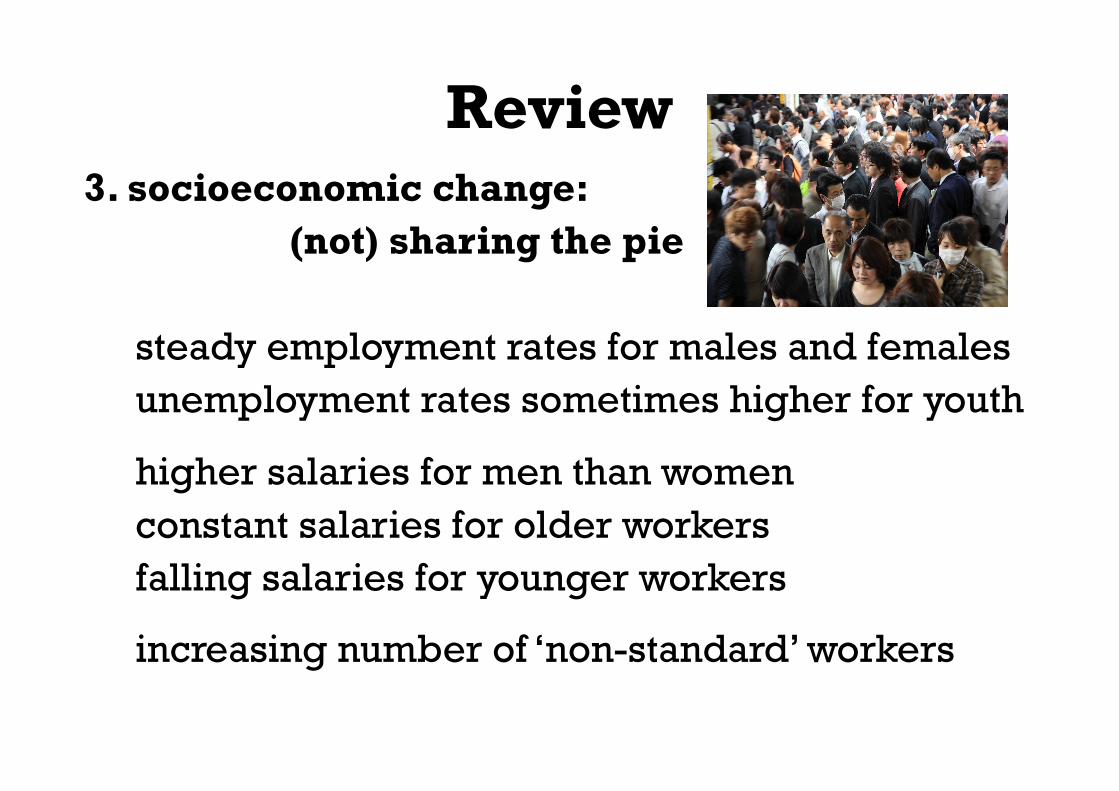
Review3. socioeconomic change:
(not) sharing the pie
steady employment rates for males and femalesunemployment rates sometimes higher for youth
higher salaries for men than womenconstant salaries for older workers falling salaries for younger workers
increasing number of ‘non-standard’ workers

Review3. socioeconomic change:
(not) sharing the pie
increasing poverty in 20s to mid-40sfalling poverty for older, retired workers
higher salaries and lower poverty in central Japan
growing perceptions of inequalitymore people on welfare, but mostly older peoplegovernment policies do not reduce young
povertyhigh relative poverty for children
The Face of Poverty
Hoffman, M. Adding looming poverty to list of seniors’ woes. The Japan Times (August 15, 2015).

growing perceptions of poverty
Editorial: Poverty and the right to live. Mainichi Japan (May 5, 2015).

Education
Hagiwara, Y., & Reynolds, S. One in six Japanese children live in poverty, threatening their education, Future. The Japan Times (September 10, 2015).

Education
Hagiwara, Y., & Reynolds, S. One in six Japanese children live in poverty, threatening their education, Future. The Japan Times (September 10, 2015).

Education
Hoffman, M. Adding looming poverty to list of seniors’ woes. The Japan Times (August 15, 2015).


