
Christina Lake Regional Project 2012/2013 Performance Presentation Commercial Scheme Approval No. 10773 JUNE 2013

Disclaimer Certain statements contained in this presentation constitute forward-looking information within the meaning of applicable securities laws. The use of any of the words "anticipate", "plan", "contemplate", "continue", "estimate", "expect", "intend", "propose", "might", "may", "will", "shall", "project", "should", "could", "would", "believe", "predict", "forecast", "pursue", "potential" and "capable" and similar expressions are intended to identify forward-looking information. In particular, this presentation may contain forward-looking information pertaining to the following: the reserve and resource potential of MEG's assets; the bitumen production and production capacity of MEG's assets; MEG's growth strategy and opportunities; the timing for construction of MEG’s projects; the planned construction of and enhancements to MEG's facilities; MEG's drilling plans; MEG's plans for, and results of, exploration and development activities and recent initiatives such as the co-injection of non-condensable gas; the expected application timeframe for MEG’s projects; and the timing associated with the application for and the receipt of various regulatory approvals.
The forward-looking information in this presentation is based on a number of factors, expectations and assumptions which may prove to be incorrect. In particular, assumptions have been made regarding future crude oil, bitumen blend, natural gas, condensate and other diluent prices; MEG's ability to obtain qualified staff and equipment in a timely and cost-efficient manner; the regulatory framework governing royalties, taxes and environmental matters in the jurisdictions in which MEG conducts and will conduct its business; MEG's ability to market production of bitumen blend successfully to customers; MEG’s ability to export power to the electric transmission grid; MEG's future production levels; the applicability of technologies for the recovery and production of MEG's reserves and resources; the recoverability of MEG's reserves and resources; operating costs; future capital expenditures to be made by MEG; future sources of funding for MEG's capital programs; MEG's future debt levels; geological and engineering estimates in respect of MEG's reserves and resources; the geography of the areas in which MEG is conducting exploration and development activities; the impact of increasing competition on MEG; and MEG's ability to obtain financing on acceptable terms.
No assurance can be given that such forward-looking information or the underlying assumptions will prove to be correct so the reader is cautioned not to unduly rely upon such information. Such forward-looking information also involves known and unknown risks, uncertainties and other factors that may cause actual results or events to differ materially from those anticipated by such forward-looking information. Further details regarding the assumptions and risks inherent in such forward-looking information can be found in MEG’s annual information form dated February 27, 2013, which is available at www.sedar.com.
The forward-looking information included in this presentation is expressly qualified by this cautionary statement and is made as of the date of this presentation. MEG does not undertake any obligation to publicly update or revise any forward-looking information except as required by applicable securities laws.
2

• Overview Simon Geoghegan
• Geosciences Andrew Fox
• Reservoir Jeremy Gizen/Kejia Xi
• Operations Ted Lamb
• Water Scott Rayner
• Compliance & Environment Simon Geoghegan
• Future Plans Simon Geoghegan
Outline
3

MEG Energy Corp. MEG Energy Corp. (MEG) is a public Calgary-based energy company focused on the development and recovery of bitumen and the generation of power in northeast Alberta.
4

5
Christina Lake Regional Project (CLRP)

6
The SAGD Process

7
Phase 1 • Approved in February 2005 for bitumen production of 477 m3/d (3,000 bpd)
• Sustained steaming commenced March 2008
Phase 2 • Approved in March 2007 for total production of 3,975 m3/d or 25,000 bpd
(incremental 3,523 m3/d or 22,000 bpd)
• Mechanical completion in August 2009
• Reached design name plate in April 2010
Phase 2B • Plant expansion to 9,540 m3/d or 60,000 bpd (incremental 5,540 m3/d or
35,000 bpd) • ERCB approval granted April 21, 2009 • Commissioning underway, first steam expected Q3/Q4 2013
Phase 3 • ERCB approval granted January 2012 • Construction commenced in Q1 2013
CLRP Project History

8
Christina Lake Regional Project (CLRP)
Phase 2 Development
Area
CPF
Proposed CPF
Phase 3 Development
Area
Access Pipeline
Proposed CPF
Christina Lake

9
MEG Energy – Christina Lake Regional Project • Currently operating Phase 2 (includes Phase 1) of Christina Lake
Regional Project (CLRP) about 150 km south of Fort McMurray • Designed capacity of 3,975 m3/d (25,000 bpd) and SOR of 2.8
• 2012 bitumen production averaged 28,773 bpd
• Q1 2013 bitumen production of 32,531 bpd and SOR of 2.5
• Phase 2B currently in commissioning phase, first steam expected
Q3, with first oil commencing in Q4
• Phase 3 of CLRP approved January 2012 (scheme expansion to 33,390 m3/d or 210,000 bpd). Site clearing and construction commenced in Q1 2013

10
CLRP Active Development Area (ADA) MEG OSL
Phase 2 Development Area
Approved Development Areas
Access Pipeline
Emulsion Pipeline
Water Disposal Pipeline
Water Pipeline
Plant
Water Disposal Wells
Pattern A
Pattern V
Pattern M
Pattern N
Pattern T
T77
R5W4 R6
Phase 2
Patterns A, B, C, D, E, F and V are producing

Geosciences
11

12
CLRP Geoscience Review • Well and Seismic Data
• Stratigraphic Framework
• Reservoir and Pay Parameters
• Active Development Area Bitumen Pay
• Phase 1 SAGD Pattern A
• Phase 2 SAGD Patterns
• Phase 2B Drilled SAGD Patterns
• Phase 3 Development
• McMurray Water Resources
• Cap Rock Geology
• Active Development Area Associated Gas Resources
• Thermal Compatibility

13
Christina Lake Regional Project (CLRP)
Plant
Approved Project Area
Approved Development Areas
Phase 2 Development
Access Pipeline

14
CLRP Wabiskaw / McMurray Cores
Approved Project Area
Wabiskaw / McMurray Core
• 745 cored wells • 85% of all wells are cored

15
CLRP 2013 Delineation, Water Source and Water Disposal Wells
CLRP Project Area
2013* Delineation Well
2013* WSW
2013* WDW
* Includes wells drilled in Dec. 2012
115 of 135 Wells Cored (85%)

16
CLRP 3D Seismic
CLRP Project Area
3D Seismic
No seismic recorded in 2013

17
CLRP Active Development Area (ADA) MEG OSL
Phase 2 Development Area
Approved Development Areas
Access Pipeline
Emulsion Pipeline (operating)
Water Disposal Pipeline
Water Pipeline
Patterns A, B, C, D, E, F and V are producing
Plant
Water Disposal Wells
Pattern A
Pattern V
Pattern M
Pattern N
Pattern T
T77
R5W4 R6
Phase 2

CLRP: Wabiskaw/McMurray Stratigraphy 1AA/13-18-77-05W4 1AC/10-07-77-05W4
Beaverhill Lake
Wabiskaw Marker
Wabiskaw C Sand
McMurray A1
Wabiskaw D Shale
Clearwater C mud
upper Wabiskaw mud
Clearwater C mud
McMurray Formation
Stratigraphic Unit Facies Associationlower Clearwater C offshore mudupper Wabiskaw offshore / lower shoreface mudWabiskaw C shoreface sandWabiskaw D Shale bay mudWabiskaw D Valley bay sand and mudMcMurray A1 shoreface sand / coalupper McMurray Channel tidal flat / creek sand and mudlower McMurray Channel fluvial / estuarine channel sand and mudBeaverhill Lake carbonate mudstone
McMurray Channel
Wabiskaw Valley
McMurray Channel
McMurray stratigraphy after ERCB RGS 2003
18

19
CLRP: Wabiskaw / McMurray Type Well
SAGD Interval
McMurray SAGDh (m) 47.6 30.3
avg Φ 0.311 0.314avg So 0.770 0.794
BMO(calc) 0.114 0.120
McMurray Pay ≥ 6 wt% BMO
Caprock
1AE/06-18-77-05W4
Caprock
20
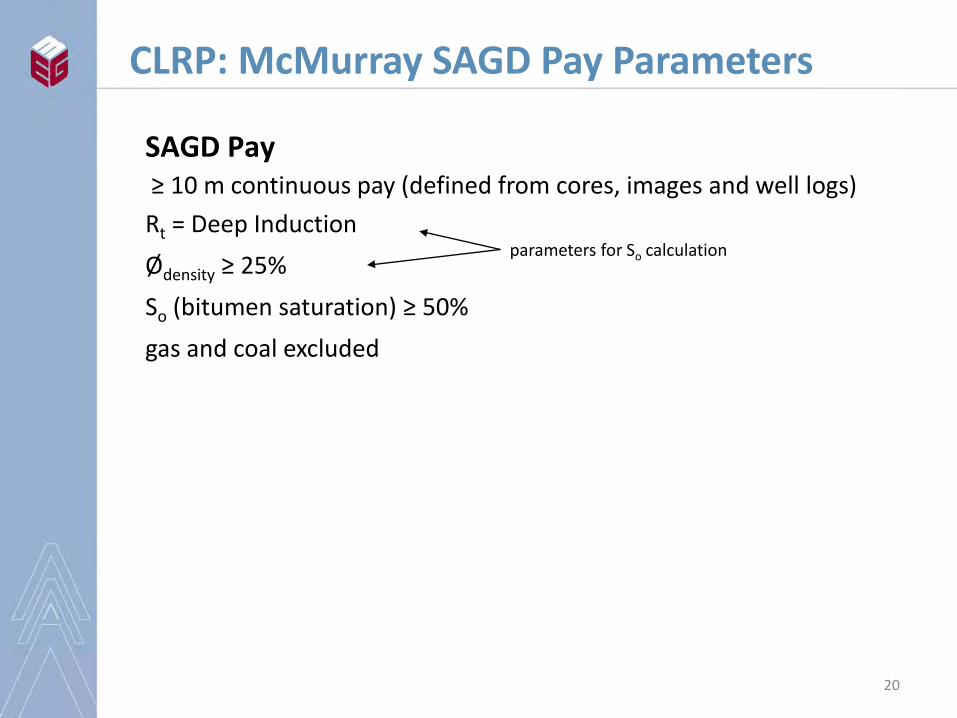
CLRP: McMurray SAGD Pay Parameters
SAGD Pay ≥ 10 m continuous pay (defined from cores, images and well logs) Rt = Deep Induction Ødensity ≥ 25% So (bitumen saturation) ≥ 50% gas and coal excluded
parameters for So calculation
21
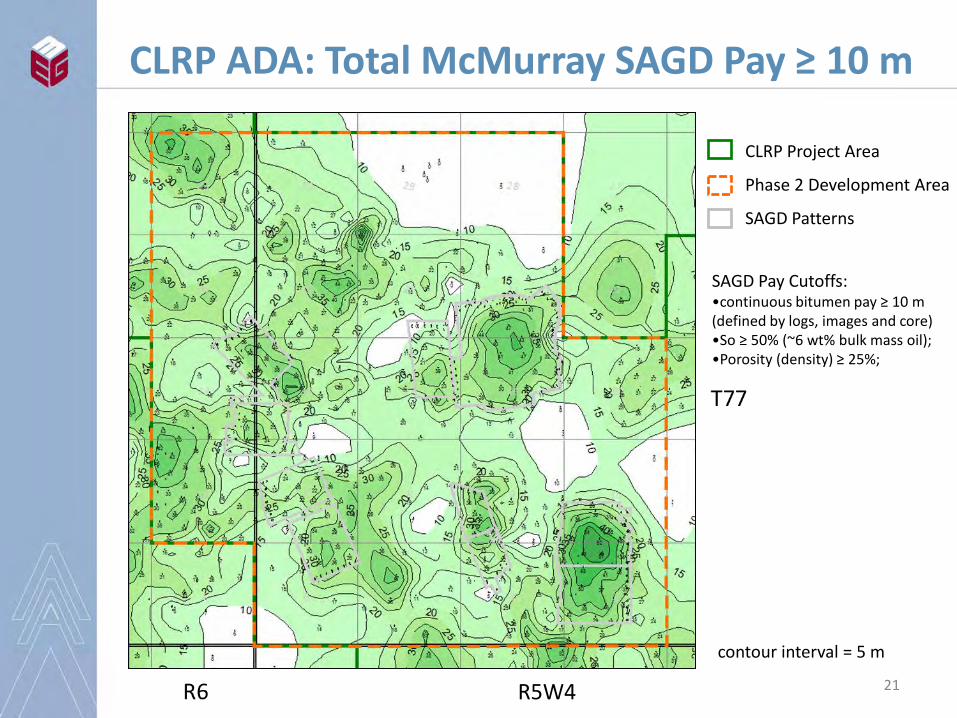
CLRP ADA: Total McMurray SAGD Pay ≥ 10 m
R5W4
CLRP Project Area
Phase 2 Development Area
SAGD Patterns
SAGD Pay Cutoffs: •continuous bitumen pay ≥ 10 m (defined by logs, images and core) •So ≥ 50% (~6 wt% bulk mass oil); •Porosity (density) ≥ 25%;
contour interval = 5 m

22
400 m R5W4M R6
OB Well (pressure and temperature) Intermediate Casing Point (ICP)
SAGD Pattern A Map View
23
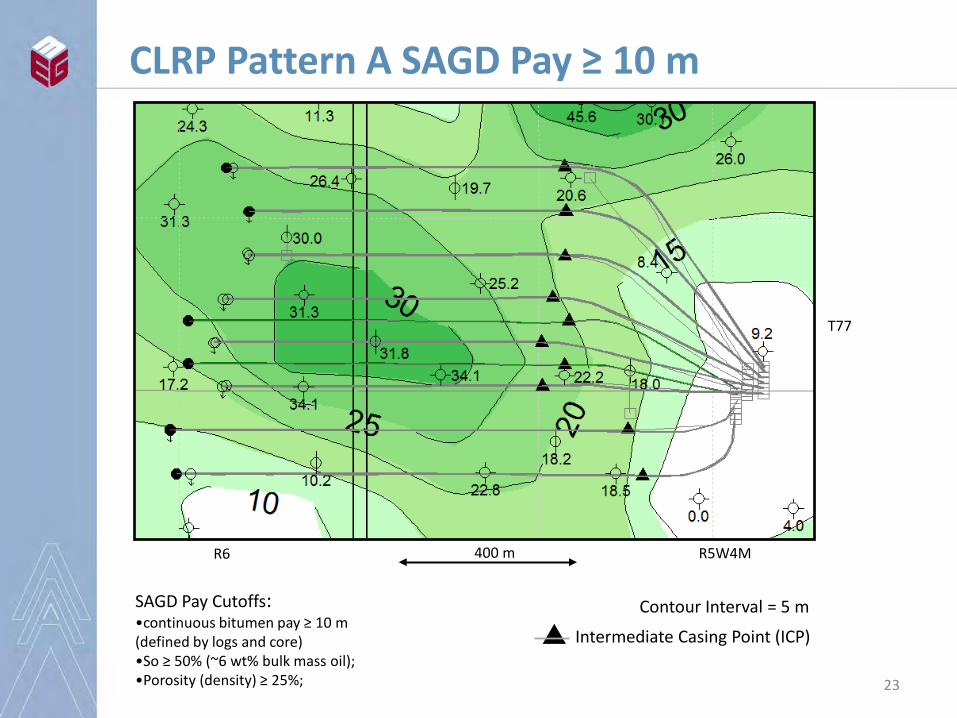
CLRP Pattern A SAGD Pay ≥ 10 m
Contour Interval = 5 m SAGD Pay Cutoffs: •continuous bitumen pay ≥ 10 m (defined by logs and core) •So ≥ 50% (~6 wt% bulk mass oil); •Porosity (density) ≥ 25%;
Intermediate Casing Point (ICP)
400 m R5W4M R6
T77

24
CLRP Pattern A Base SAGD Pay Structure
R5W4M R6 400 m
Contour Interval = 5 m Posted values above sea level Intermediate Casing Point (ICP)
T77

25
CLRP Pattern A Top SAGD Pay Structure
400 m R5W4M R6
Contour Interval = 5 m Posted values above sea level Intermediate Casing Point (ICP)
T77

CLRP Pattern A SAGD (A1 well pair) 1AB/04-18-77-05W4 1AA/03-18-77-05W4 1AC/01-13-77-06W4
Wabiskaw D valley fill
Wabiskaw Marker
Wabiskaw C Sand
SAGD pay
mud
limestone
Top McMurray
Injector
Producer
non-reservoir lithofacies
Beaverhill Lake
Wabiskaw Member
Cap Rock
Cap Rock
McM
urra
y Fo
rmat
ion
Wab
iska
w
Clearwater C
1AB/04-18-77-05W4 1AC/01-13-77-06W4
26

CLRP Phase 2 SAGD Well Pairs Map View
27
MEG OSL Boundary
SAGD Patterns
OB Well (pressure and temperature)
SAGD Producer ICP
F1
D6 D7
T77
R5W4
WSW
WSW
WDW
OBE1
OB9
OBC1
OB10CLR
OBV1
Pattern SAGD PairsB 2
BB 6C 6
C Expansion1 2D 5E2 7F 5V 6
Total 391. well pairs drilled from surface Pad D2. E Pattern includes F1 well pair
F1
D6 D7
WSW
WSW
WDW
OBE1
OB9
OBC1
OB10CLR
OBV1

28
CLRP Phase 2 SAGD and Infill Wells Map View
MEG OSL Boundary
SAGD Patterns
Infill Wells
OB Well (pressure and temperature)
SAGD Producer ICP
F1
D6 D7
T77
R5W4
WSW
WSW
WDW
OBE1
OB9
OBC1
OB10CLR
OBV1
F1
D6 D7
WSW
WSW
WDW
OBE1
OB9
OBC1
OB10CLR
OBV1
MEG OSL Pattern SAGD Pairs Infill Wells
B 2 3BB 6 6C 6 7
C Expansion1 2 0D 5 5E2 7 6F 5 4V 6 0
Total 39 311. well pairs drilled from surface Pad D2. E Pattern includes F1 well pair

CLRP Phase 2: Stacked SAGD Pay
29
100/14-16-77-05W4 OBB1 100/02-21-77-05W4 OBD1
Devonian
Water Sand
SAGD Pay
SAGD Pay SAGD
Pay
SAGD Pay
Non-Reservoir Lithofacies Non-Reservoir Lithofacies
Water Sand
Non-Reservoir Lithofacies
Cap Rock Wabiskaw C
McMurray
Single Pattern Development (Single Pay Interval)
Stacked Pattern Development (Multiple Pay Intervals)
Gas
Piezometers
Clearwater C
Bitumen / Water Contact

30
Phase 2 Area Lower SAGD Pay ≥ 10 m
Contour Interval = 5 m
SAGD Pay Cutoffs: •continuous bitumen pay ≥ 10 m (defined by logs and core) •So ≥ 50% (~6 wt% BMO) •Porosity (density) ≥ 25%;
CLRP Project Area SAGD Patterns
R5W4 400 m
T77

31
Phase 2 Area Lower SAGD Pay ≥ 10 m
CLRP Project Area SAGD Patterns
SAGD Pay Cutoffs: •continuous bitumen pay ≥ 10 m (defined by logs and core) •So ≥ 50% (~6 wt% BMO) •Porosity (density) ≥ 25%;
Contour Interval = 5 m
R5W4 400 m
C
D
B
F
E
D6/D7
V
Cross Section
T77

1AA/06-21-77-05W4 100/14-16-77-05W4 OBB1
SAGD Pay
Devonian
Non-Reservoir Lithofacies
Cap Rock
Wabiskaw C
Clearwater C
McM
urra
y
Water Sand
Water Sand
Bitumen / Water Contact
SAGD Pay
Non-Reservoir Lithofacies
Gas
Piezometers
Phase 2 Lower SAGD Development (Pattern B)
32

1AB/12-16-77-05W4 1AA/12-16-77-05W4
SAGD Pay
Devonian
Cap Rock
Wabiskaw C
Clearwater C
McM
urra
y
Water Sand
Water Sand
Bitumen / Water Contact
SAGD Pay
Non-Reservoir Lithofacies
Non-Reservoir Lithofacies
Gas
Phase 2 Lower SAGD Development (Pattern C)
33

1AB/07-21-77-05W4 100/02-21-77-05W4 OBD1
SAGD Pay
Devonian
Cap Rock
Wabiskaw C
Clearwater C
McM
urra
y
Water Sand
Water Sand
Bitumen / Water Contact
SAGD Pay
Non-Reservoir Lithofacies
Non-Reservoir Lithofacies
“Tiger Stripes” = interbedded water sand and bitumen sand
SAGD Pay
Piezometers
Gas
Phase 2 Lower SAGD Development (Pattern D)
34
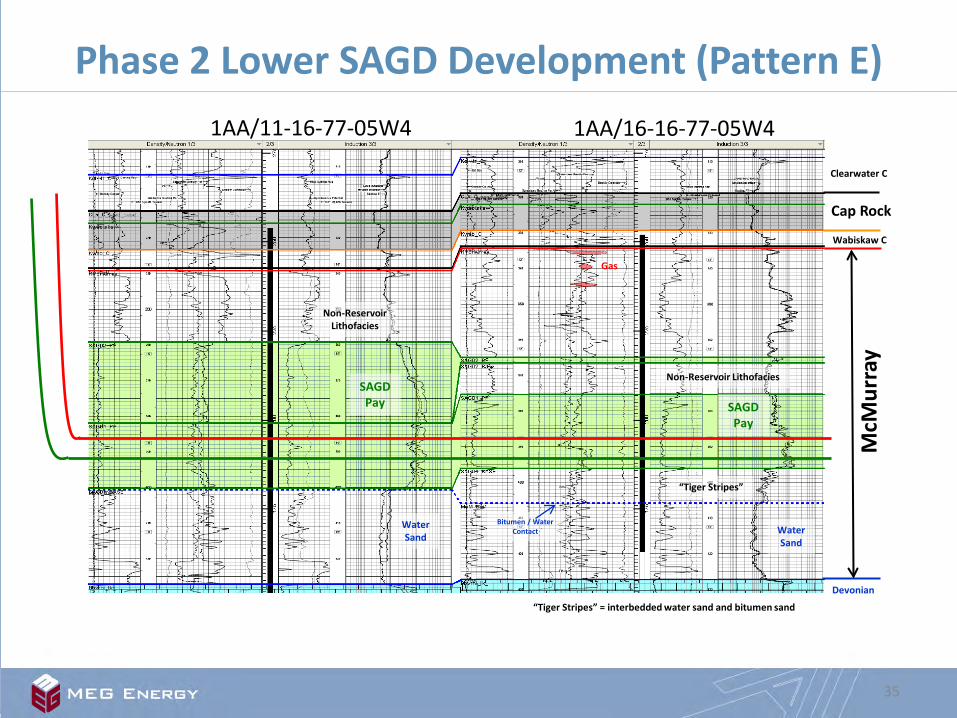
1AA/11-16-77-05W4 1AA/16-16-77-05W4
SAGD Pay
Devonian
Cap Rock
Wabiskaw C
Clearwater C
McM
urra
y
Water Sand
Water Sand
Bitumen / Water Contact
SAGD Pay
Non-Reservoir Lithofacies
Non-Reservoir Lithofacies
“Tiger Stripes”
“Tiger Stripes” = interbedded water sand and bitumen sand
Gas
Phase 2 Lower SAGD Development (Pattern E)
35
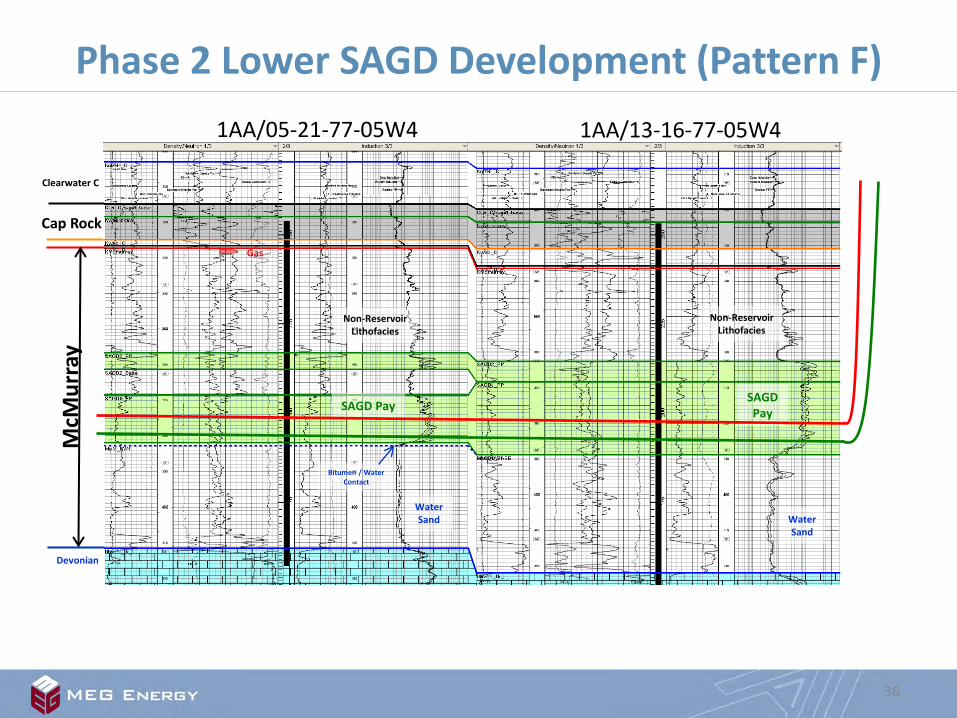
Phase 2 Lower SAGD Development (Pattern F)
36
1AA/05-21-77-05W4 1AA/13-16-77-05W4
SAGD Pay
Devonian
Cap Rock
Clearwater C
McM
urra
y
Water Sand
Water Sand
Bitumen / Water Contact
SAGD Pay
Non-Reservoir Lithofacies
Non-Reservoir Lithofacies
Gas
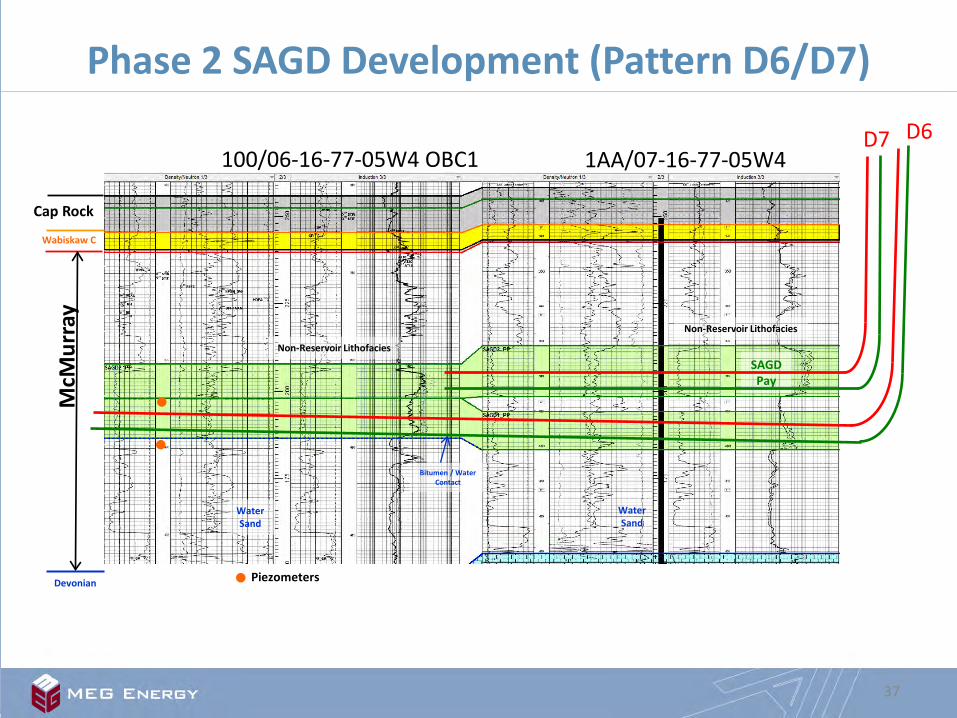
100/06-16-77-05W4 OBC1 1AA/07-16-77-05W4
Devonian
Cap Rock
McM
urra
y
Water Sand
Water Sand
Bitumen / Water Contact
SAGD Pay
Non-Reservoir Lithofacies
Non-Reservoir Lithofacies
Wabiskaw C
Piezometers
D7 D6
Phase 2 SAGD Development (Pattern D6/D7)
37
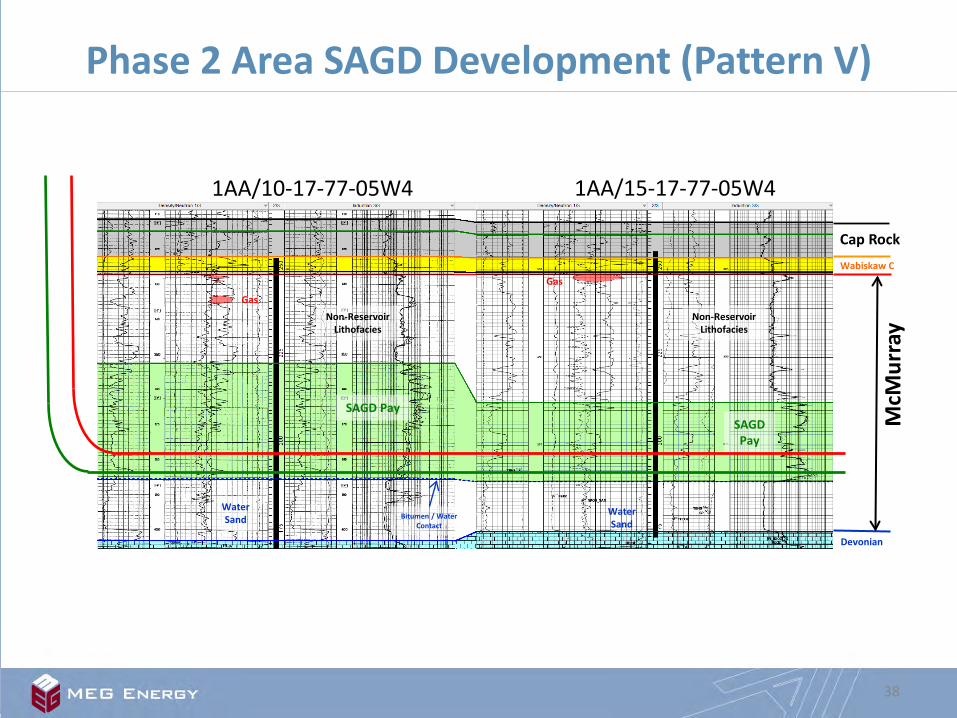
1AA/10-17-77-05W4 1AA/15-17-77-05W4
SAGD Pay
Devonian
Cap Rock
McM
urra
y
Water Sand
Water Sand Bitumen / Water
Contact
SAGD Pay
Non-Reservoir Lithofacies
Non-Reservoir Lithofacies
Wabiskaw C
Gas
Gas
Phase 2 Area SAGD Development (Pattern V)
38
39
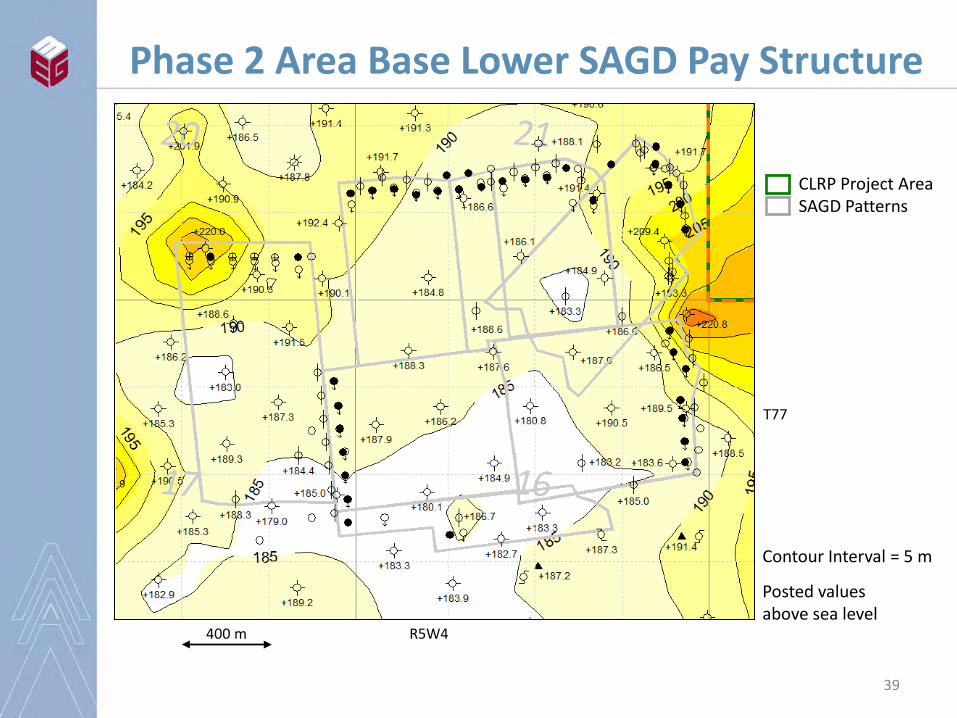
Phase 2 Area Base Lower SAGD Pay Structure
R5W4 400 m
T77
CLRP Project Area SAGD Patterns
Contour Interval = 5 m
Posted values above sea level

40
Phase 2 Area Top Lower SAGD Pay Structure
Contour Interval = 5 m
Posted values above sea level
R5W4 400 m
T77
CLRP Project Area SAGD Patterns

41
Phase 2 Area Upper SAGD Pay ≥ 10 m
R5W4 400 m
T77
Contour Interval = 5 m
CLRP Project Area SAGD Patterns
SAGD Pay Cutoffs: •continuous bitumen pay ≥ 10 m (defined by logs and core) •So ≥ 50% (~6 wt% BMO) •Porosity (density) ≥ 25%;

42
Contour Interval = 5 m
Phase 2 Area Upper SAGD Pay ≥ 10 m
R5W4 400 m
T77
SAGD Pay Cutoffs: •continuous bitumen pay ≥ 10 m (defined by logs and core) •So ≥ 50% (~6 wt% BMO) •Porosity (density) ≥ 25%;
CLRP Project Area SAGD Patterns Cross Section

100/02-21-77-05W4 OBD1 1AB/01-21-77-05W4
SAGD Pay
SAGD Pay
Gas
Piezometers
Devonian
Non-Reservoir Lithofacies
Non-Reservoir Lithofacies
Cap Rock
Wabiskaw C
Clearwater C
McM
urra
y
Water Sand Water
Sand
Bitumen / Water Contact
SAGD Pay
Phase 2 Upper SAGD Development (Pattern BB)
43

T77
R5W4 400 m
44
Phase 2 Area Base Upper SAGD Pay Structure
CLRP Project Area SAGD Patterns
Contour Interval = 5 m
Posted values above sea level

45
Phase 2 Area Top Upper SAGD Pay Structure
CLRP Project Area SAGD Patterns
Contour Interval = 5 m
Posted values above sea level
R5W4 400 m
T77

T77
R5W4 R6
Pattern V
Pattern M
Pattern G
Pattern H
Pattern N
Pattern P
Pattern T
Pattern U Pattern T
Pattern V
Pattern J
Pattern K
Plant
Phase 2
Pattern A
Pattern V
Pattern M
Pattern N
Pattern T
CLRP ADA Additional Drilled SAGD Patterns
46
CLRP Project Area
Approved IDA
Drilled, producing patterns
Drilled, non-producing patterns
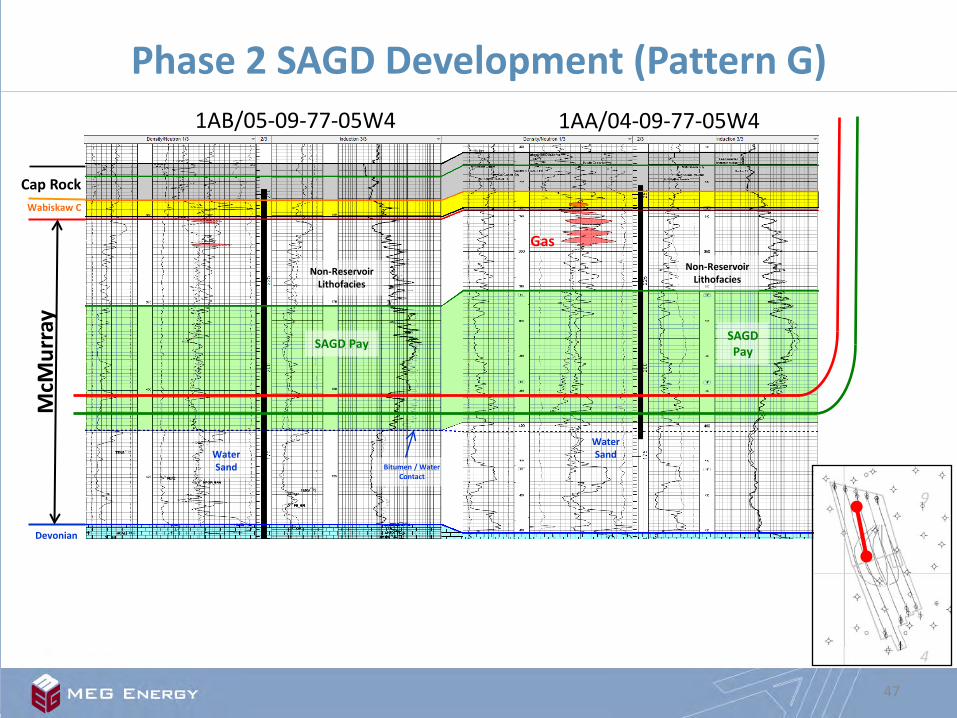
1AB/05-09-77-05W4 1AA/04-09-77-05W4
SAGD Pay
Devonian
Cap Rock
McM
urra
y
Water Sand Water
Sand Bitumen / Water Contact
SAGD Pay
Non-Reservoir Lithofacies
Non-Reservoir Lithofacies
Wabiskaw C
Gas
Phase 2 SAGD Development (Pattern G)
47

Phase 2 SAGD Development (Pattern H)
48
1AA/13-04-77-05W4 1AB/13-04-77-05W4
SAGD Pay
Devonian
Cap Rock
McM
urra
y
Water Sand Water
Sand Bitumen / Water
Contact
SAGD Pay
Non-Reservoir Lithofacies
Non-Reservoir Lithofacies
Wabiskaw C
Gas Gas

Wabiskaw C
1AA/02-07-77-05W4 1AA/16-06-77-05W4
SAGD Pay
Devonian
Cap Rock
McMurray
Water Sand Bitumen / Water
Contact
SAGD Pay
Non-Reservoir Lithofacies Non-Reservoir
Lithofacies
Gas
Phase 2 SAGD Development (Pattern J)
49
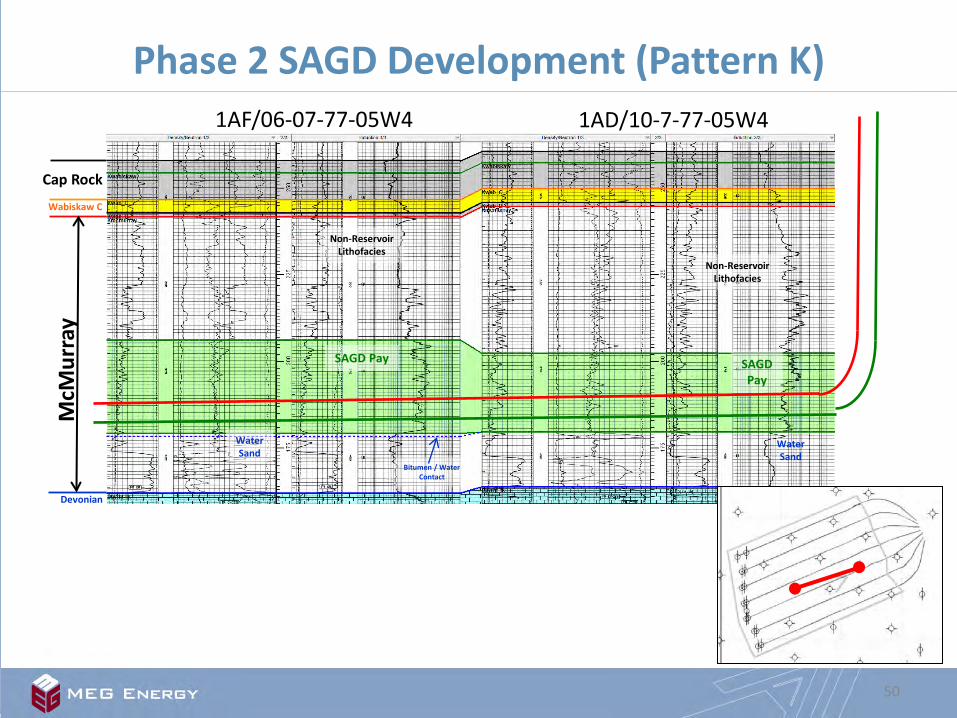
Wabiskaw C
1AF/06-07-77-05W4 1AD/10-7-77-05W4
SAGD Pay
Devonian
Cap Rock
McM
urra
y
Water Sand
Water Sand
Bitumen / Water Contact
SAGD Pay
Non-Reservoir Lithofacies
Non-Reservoir Lithofacies
Phase 2 SAGD Development (Pattern K)
50

1AA/04-10-77-05W4 1AA/03-10-77-05W4
SAGD Pay
Devonian
Cap Rock
McM
urra
y
Water Sand Water
Sand
Bitumen / Water Contact
SAGD Pay
Non-Reservoir Lithofacies
Wabiskaw C
Gas
Phase 2 SAGD Development (Pattern M)
51

1AA/12-03-77-05W4 1AC/10-03-77-05W4
SAGD Pay
Devonian
Cap Rock
McM
urra
y
Water Sand
Bitumen / Water Contact
SAGD Pay
Wabiskaw C
Pattern N not tied in
Gas
SAGD Pay
Gas
Gas
SAGD Pay
Phase 2B SAGD Development (Pattern N)
52

Wabiskaw C
1AC/13-18-77-05W4 1AA/12-18-77-05W4
SAGD Pay
Devonian
Cap Rock
McM
urra
y
Water Sand
Water Sand
Bitumen / Water Contact
SAGD Pay
Non-Reservoir Lithofacies
Lower sands to be developed at a later date Pattern T not currently producing
Gas Non-Reservoir
Lithofacies Wabiskaw D
Phase 2 SAGD Development (Pattern T)
53

Contour Interval = 5 m
CLRP Project Area
Phase 2 Project Area
Drilled SAGD Patterns
CLRP ADA Basal McMurray Net Water Isopach
54
Christina Lake
T77
R5W4 R6

T77
R5W4 R6 54
Low gas cap pressure due to legacy gas production; MEG has approval to repressure gas cap
Small gas cap; no repressuring
required
Local gas cap contact with SAGD interval;
~20% depletion from original pressure;
no repressuring required
Depleted gas cap not in direct contact with SAGD interval
Note: Not all SAGD intervals in the pool wells are directly connected to associated gas
MEG OSL
Phase 2 Development Area
Drilled SAGD Patterns
Proposed SAGD Patterns Gas Pool in direct and indirect contact with SAGD interval
CLRP ADA Associated Gas Pools
55

Lower Clearwater Cap Rock = 10.9 m thick
Beaverhill Lake
Clearwater C
Lower Clearwater Cap Rock
McMurray
SAGD Pay
WBSK Mkr mud
mud WBSK C
WBSK D WBSK D Shale
non-reservoir lithofacies
Water Sand
Bitumen / Water Contact
1AE/06-18-77-05W4
CLRP Lower Clearwater Cap Rock
56

T77
R5W4 R6
CLRP Project Area
Phase 2 Project Area
Drilled SAGD Patterns
Thickness in Metres
Phase 2 Development Area Average Caprock Thickness = 10.8 m Minimum Thickness = 8.5 m Maximum Thickness = 12.1 m
CLRP ADA Lower Clearwater Cap Rock
57

• The measured minimum in situ principal stress gradient in the Clearwater cap rock is approximately 20 kPa/m. This gradient coincides with the weight of the overburden as derived from density logs indicating the minimum principal stress is in the vertical direction, i.e., if fracturing were to occur, it is likely in the horizontal direction.
• For a typical cap rock depth of 320 m in the CLRP area, the minimum principal stress is 6,400 kPa. This is more than twice the anticipated steady state SAGD operating pressure.
• The measured minimum in situ principal stress gradient in the McMurray oil sands is slightly lower at approximately 18 kPa/m. This indicates the minimum principal stress is likely in the horizontal direction, i.e., if fracturing were to occur, it is likely in the vertical direction.
• Quote from BitCan Geosciences & Engineering Inc.: – “…if a vertical fracture inadvertently propagated out of the payzone into the cap
rock, it would eventually turn horizontal. This is due to the in-situ stress regime in the caprock favoring horizontal fractures. Therefore, the vertical fracture extending upwards from the payzone is arrested in the caprock and does not propagate further upwards, i.e., it cannot form the hydraulic conduit connecting the payzone and aquifers.”
• MEG’s measurements are consistent with other operators’ mini-frac results in the Christina Lake area.
CLRP Cap Rock Testing
58

XX.X Measured in situ minimum principal stress gradient (kPa/m)
• CVE Christina Lake data : 2010 CVE Christina Lake ERCB Annual Update, June 2010
• CVE Narrows Lake data : CVE Narrows Lake Application to ERCB, Appendix 1-VII (Cap Rock Study), June 2010
• KNOC BlackGold data: Application for Approval of the BlackGold Expansion Project, Volume 1, December 2009
• Devon Jackfish data: 2011 Devon Jackfish ERCB Annual Update, October 2011
MEG OSL MEG Mini-Frac Test CVE Mini-Frac Test KNOC Mini-Frac Test Devon Mini-Frac Test
MEG Christina Lake
CVE Christina Lake
Devon Jackfish
20.3
20.2
20.9
19.6
CVE Narrows Lake
20.6
KNOC BlackGold
18.6
20.3
20.2
Regional Cap Rock Mini-Frac Test Results
59

MEG OSL
Existing SAGD patterns
Proposed SAGD patterns
Type 1B wells (D&A)
Type 2B wells (D&C, DC&A)
Type 1B: D&A with non-thermal cement Type 2B: D&C with non-thermal cement
CLRP Legacy Wells
60

• Thermal compatibility addressed on a pad by pad basis in conjunction with IDA amendment applications
• Specific D-20 abandonment applications have been filed and approved for requisite wells within the ADA
• A general thermal compatibility program has been drafted by MEG and reviewed by ERCB staff. Final submission planned for Q3 2013. The program includes:
– A detailed assessment of compatibility of existing all wellbores within the CLRP project area
– General abandonment approach – Monitoring plans
61
Legacy Well Thermal Compatibility
61

Reservoir
62

63
• Wells ─ Schematics ─ Work overs
• Current Performance - Field performance - Pattern performance - eMSAGP update - OB well cased-hole logging
• Associated gas cap re-pressuring
• Future production enhancement plans
CLRP Reservoir Review

Wells
64

13 3/8” Surface Casing
9 5/8” Intermediate Casing
4.5” Tubing
Liner Hanger 7” Slotted Liner 3.5” Tubing
7” Tubing
• Steam injected into both long tubing and short tubing
• Blanket gas on annulus
Well Completions – SAGD Injector
65

13 3/8” Surface Casing
9 5/8” Intermediate Casing
4.5” Tubing
Liner Hanger 7” Slotted Liner 3.5” Tubing
1.25” Gas Lift & Instrument String
• Thermocouples are inside the instrument string to provide temperature measurements at selected locations
7” Tubing
Well Completions – SAGD Producer (Gas Lift)
66
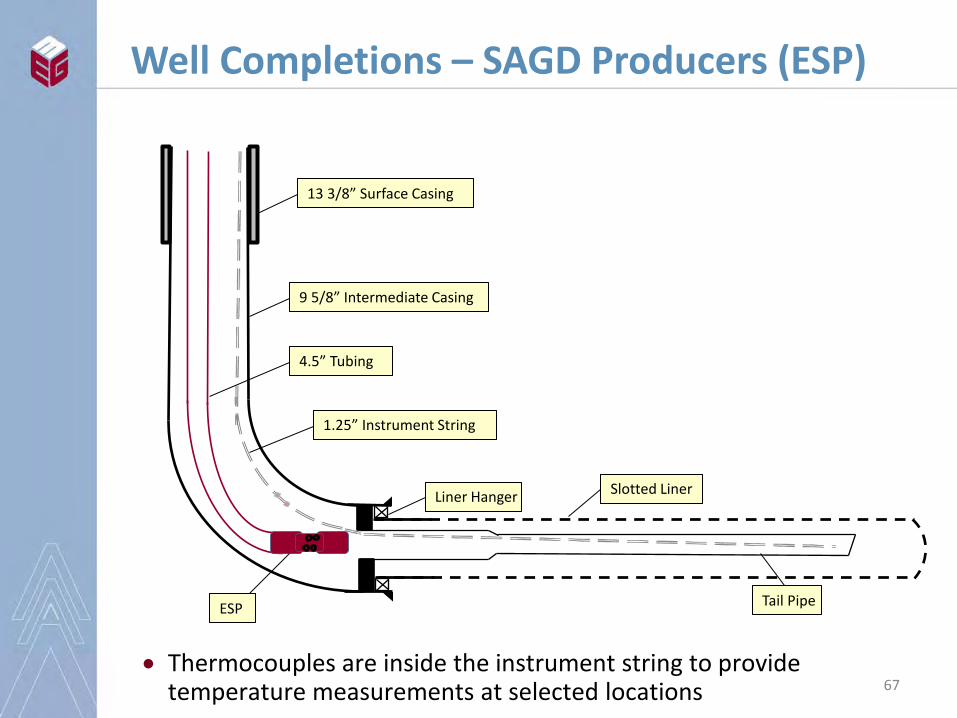
13 3/8” Surface Casing
9 5/8” Intermediate Casing
4.5” Tubing
Liner Hanger Slotted Liner
Tail Pipe
1.25” Instrument String
ESP
• Thermocouples are inside the instrument string to provide temperature measurements at selected locations
Well Completions – SAGD Producers (ESP)
67

13 3/8” Surface Casing
9 5/8” Intermediate Casing
5.5” Tubing
Liner Hanger Slotted Liner
Tail Pipe
1.25” Instrument String
Reciprocating Pump
• Thermocouples are inside the instrument string to provide temperature measurements at selected locations
Rod String
Well Completions – Infill Producers
68

8 5/8” Surface Casing
Thermocouple Bundle
Piezometers
• Thermocouples are landed over expected steam zone
• Piezometers are placed in areas of geological interest (gas, bitumen, water zones and potential pay breaks)
Temperature / Pressure Observation Cased Observation
Observation Wells
4 1/2” Production Casing
69

13 3/8” Surface Casing
8 5/8” Production Casing
4 1/2” Production lubing
ESP
5 1/2” Wire Wrap Screen
Water Source Wells
70

13 3/8” Surface Casing
9 5/8” Production Casing
7” Production Tubing
Isolation Packer
Water Disposal Wells
71

Issue • Liner Impairment on V3P • Identified while running the tail pipe for ESP Conversion February 2013
Implications • The circulation tubing was pulled successfully but could not run in past the
failure with the production tail pipe • Identified impairment approximately at the halfway point of the horizontal • Unable to run tail pipe to desired landing depth in horizontal
Actions • Run compression block and camera log to confirm the break is impassable • Pulled approximately 100m of liner to re-drill the horizontal section from the
existing intermediate casing • The intermediate section has been suspended with a wire line retrievable plug.
The idle injector well has been confirmed in tact via tubing movement and has been purged with sweet dry fuel gas
• Planning the re-drill of a new horizontal from the existing intermediate section
CLRP Well Workovers
72
• All MEG SAGD well pairs are initially completed with gas lift capabilities • 44 Electric submersible pumps (ESP) in operation
─ Approximately 75% ESPs rated to 220oC and 25% rated to 250oC ─ Operating pressures range from 2,100-3,000kPag ─ Design fluid rates 200-1200m3/d ─ Mean run-time between pulls is 675 days
• Four reciprocating pumps installed in the infill wells
─ Three rod insert and one tubing pump ─ Operating pressures range from 2,000-2,500kPag ─ Design fluid rates 100-500m3/d
CLRP Artificial Lift
73
Scheme Performance
74
Plant
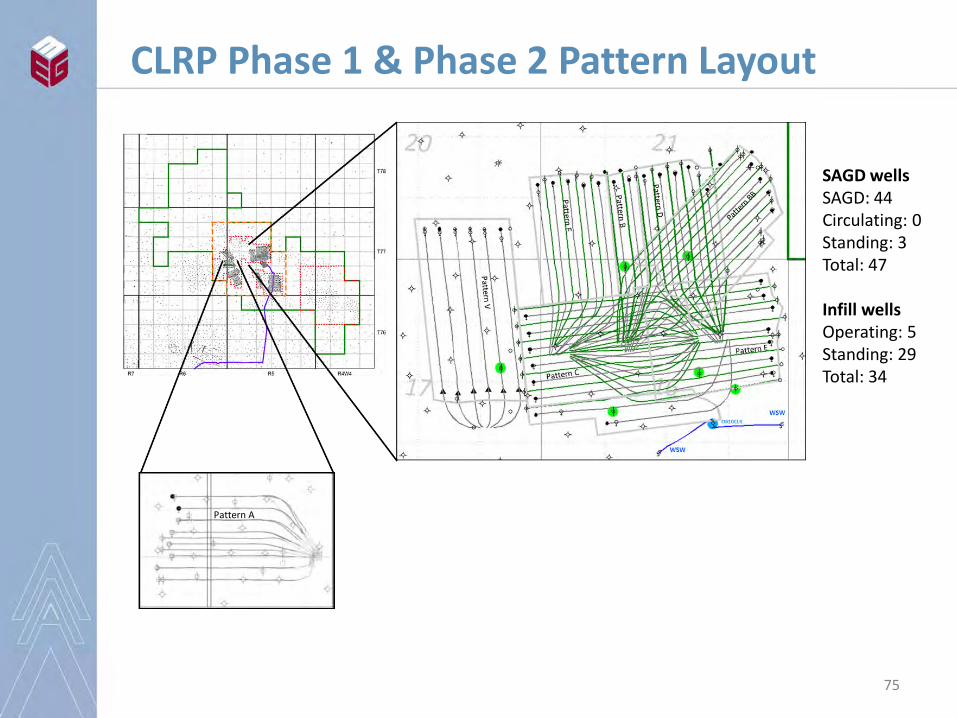
SAGD wells SAGD: 44 Circulating: 0 Standing: 3 Total: 47 Infill wells Operating: 5 Standing: 29 Total: 34
74
Pattern A
CLRP Phase 1 & Phase 2 Pattern Layout
75

• First steam into A1, A2 & A3 wells effectively occurred in March 2008
• First steam into Phase 2 wells occurred in August 2009
• Wells were started up in stages, dictated by steam availability
• Typical preheat time was between 1 to 2 months due to the presence of bottom water, allowing rapid heating of the reservoir
• Current reservoir operating pressure is between 2,100 and 3,000 kPag. The steam chamber pressure is similar to the basal water zone (~2,000 to 2,200 kPag) where SAGD wellpairs are underlain by bottom water
• Phase 2 Production ramp-up was ahead of schedule ─ The combined bitumen production of Phase 1 and Phase 2 reached
the design capacity of 3,975 m3/d (25,000 bpd) on an intermittent basis by late April 2010 – eight months after first steam
• Bitumen production rates have been consistently above the design capacity since June 2010 with exceptions during planned outages
CLRP Reservoir Performance
76

• The SOR has averaged 2.4 over the last 12 months and has ranged from 2.3 to 2.6
• The improved SOR relative to the design level of 2.8, has allowed MEG to bring more well pairs onto production fully utilizing the excess steam: ─ A8 well pair ─ D7 well pair ─ Pattern V, 5 well pairs ─ Wells on production in April 2013 included 44 SAGD well pairs and
5 infill wells
• The eMSAGP pilot in Phase 1 wells was initiated in December 2011. This project has demonstrated very encouraging results. Phase 2 eMSAGP expansion was started with the Pattern B wells in February 2013
• In the first quarter of 2013, MEG achieved record quarterly production of 32,500 barrels per day, a 14% increase for the same period in 2012. Current production is on a growing trend
CLRP Reservoir Performance (continued)
77

0
2,000
4,000
6,000
8,000
10,000
12,000
14,000
1/1/08 12/31/08 12/31/09 12/31/10 12/31/11 12/31/12 12/31/13
Rate
(m3 /
day)
Steam Injection Water Bitumen
Design Capacity
Scheduled Plant Turnaround
77
CLRP Production Performance
78

78
0
1
2
3
4
5
6
7
8
1/1/08 12/31/08 12/31/09 12/31/10 12/31/11 12/31/12 12/31/13
ISO
R
Combined A B BB C D E F V
CLRP Performance – Pattern SOR
79

0250500750
1,0001,2501,5001,7502,0002,2502,500
1/1/08 12/31/08 12/31/09 12/31/10 12/31/11 12/31/12 12/31/13
Rate
(m3 /
day)
Steam Bitumen Water
A1 to A3 will be discussed under eMSAGP update
79
eMSAGP Pilot Start in the Pattern
CLRP Performance – Pattern A
80

CLRP Performance – Pattern B
0100200300400500600700800900
1,000
1/1/09 1/1/10 1/1/11 1/1/12 12/31/12 12/31/13
Rate
(m3 /
day)
Steam Water Bitumen
Pad down due to OH&S incident
eMSAGP start in the pattern
81

CLRP Performance – Pattern BB
0200400600800
1,0001,2001,4001,6001,8002,000
1/1/09 1/1/10 1/1/11 1/1/12 12/31/12 12/31/13
Rate
(m3 /
day)
Steam Water Bitumen
Pad down due to OH&S incident
eMSAGP start in the pattern
82
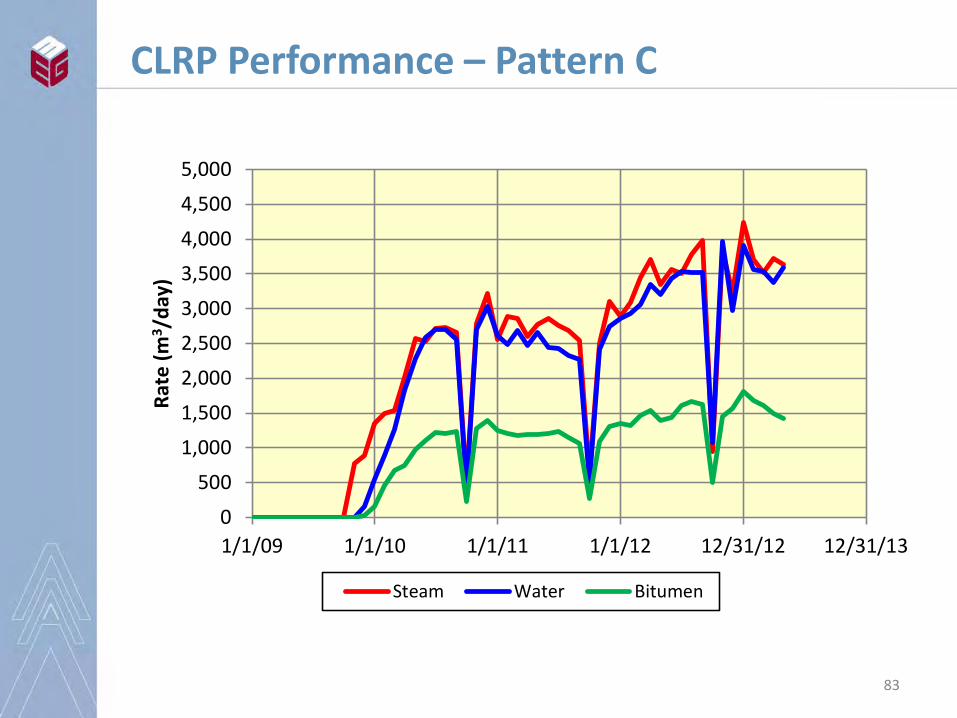
0500
1,0001,5002,0002,5003,0003,5004,0004,5005,000
1/1/09 1/1/10 1/1/11 1/1/12 12/31/12 12/31/13
Rate
(m3 /
day)
Steam Water Bitumen
CLRP Performance – Pattern C
83

0200400600800
1,0001,2001,4001,6001,8002,000
1/1/09 1/1/10 1/1/11 1/1/12 12/31/12 12/31/13
Rate
(m3 /
day)
Steam Water Bitumen
Higher water production was a result of bottom water incursion and lower steam quality to the D5 well pair
New high pressure steam separator reducing condensate carry over to end well
Steam reduction for pad pressure adjustment
CLRP Performance – Pattern D
84

0250500750
1,0001,2501,5001,7502,0002,2502,500
1/1/09 1/1/10 1/1/11 1/1/12 12/31/12 12/31/13
Rate
(m3 /
day)
Steam Water Bitumen
CLRP Performance – Pattern E
85

0200400600800
1,0001,2001,4001,6001,8002,000
1/1/09 1/1/10 1/1/11 1/1/12 12/31/12 12/31/13
Rate
(m3 /
day)
Steam Water Bitumen
CLRP Performance – Pattern F
86

0
200
400
600
800
1,000
1,200
1,400
1,600
1,800
2,000
1/1/12 12/31/12 12/31/13
Rate
(m3 /
day)
Steam Water Bitumen
Production ramp up of 5 SAGD well pairs
CLRP Performance – Pattern V
87
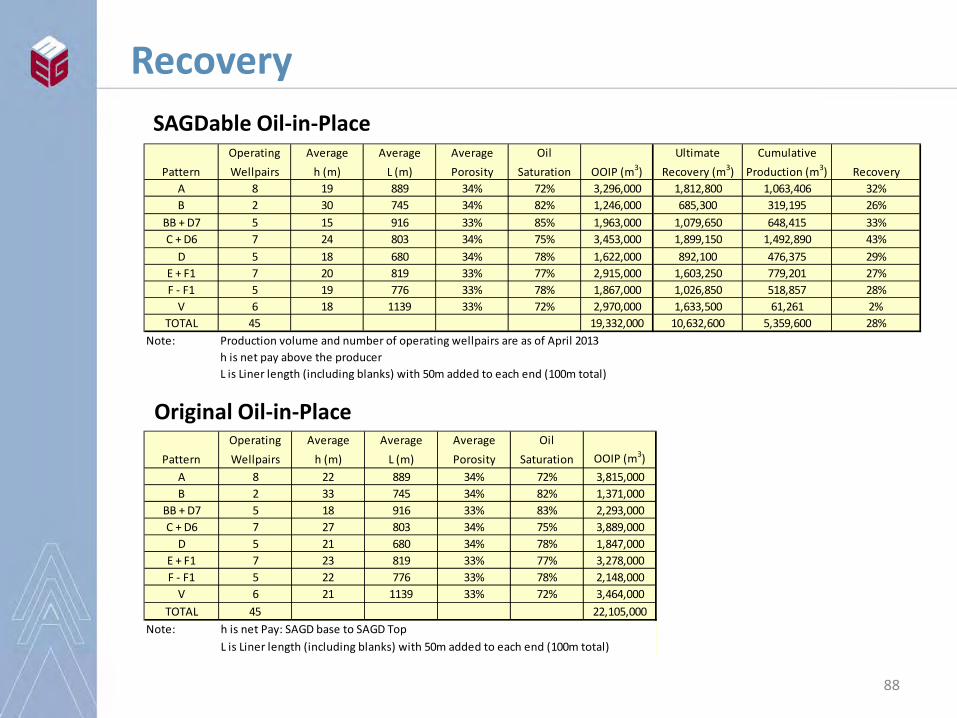
SAGDable Oil-in-Place
Original Oil-in-Place Operating Average Average Average Oil
Pattern Wellpairs h (m) L (m) Porosity Saturation OOIP (m3)A 8 22 889 34% 72% 3,815,000B 2 33 745 34% 82% 1,371,000
BB + D7 5 18 916 33% 83% 2,293,000C + D6 7 27 803 34% 75% 3,889,000
D 5 21 680 34% 78% 1,847,000E + F1 7 23 819 33% 77% 3,278,000F - F1 5 22 776 33% 78% 2,148,000
V 6 21 1139 33% 72% 3,464,000TOTAL 45 22,105,000
Note: h is net Pay: SAGD base to SAGD TopL is Liner length (including blanks) with 50m added to each end (100m total)
Operating Average Average Average Oil Ultimate CumulativePattern Wellpairs h (m) L (m) Porosity Saturation OOIP (m3) Recovery (m3) Production (m3) Recovery
A 8 19 889 34% 72% 3,296,000 1,812,800 1,063,406 32%B 2 30 745 34% 82% 1,246,000 685,300 319,195 26%
BB + D7 5 15 916 33% 85% 1,963,000 1,079,650 648,415 33%C + D6 7 24 803 34% 75% 3,453,000 1,899,150 1,492,890 43%
D 5 18 680 34% 78% 1,622,000 892,100 476,375 29%E + F1 7 20 819 33% 77% 2,915,000 1,603,250 779,201 27%F - F1 5 19 776 33% 78% 1,867,000 1,026,850 518,857 28%
V 6 18 1139 33% 72% 2,970,000 1,633,500 61,261 2%TOTAL 45 19,332,000 10,632,600 5,359,600 28%
Note: Production volume and number of operating wellpairs are as of April 2013h is net pay above the producerL is Liner length (including blanks) with 50m added to each end (100m total)
Recovery
88

Update on enhanced Modified Steam and Gas Push (eMSAGP)
89

Pattern A
Infill wells
NCG /steam co-injection
eMSAGP Pilot Wells
90

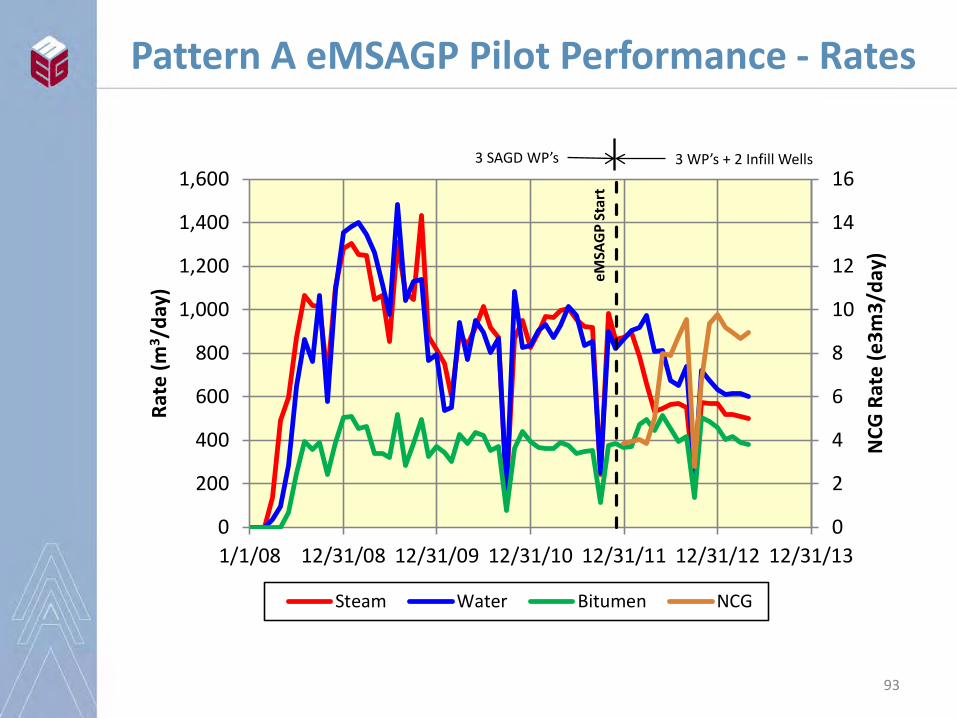
• eMSAGP involves 3 SAGD well pairs (A1, A2 and A3) and 2 infill wells (A1N and A2N). Non-condensable gas (NCG) and steam are injected into SAGD injectors; production are through all 5 wells
• Before NCG co-injection, steam chamber pressures were reduced to near original reservoir pressure to minimize gas leak-off
• Co-injection commenced in December 2011. The infill wells were brought on production in January 2012 after steam stimulation
• Over ~1.5 years, steam injection has been reduced by about 50% ─ NCG injection reduces steam requirement while maintaining steam
chamber pressure ─ Combined bitumen production is consistently better than that
expected from SAGD alone ─ SOR has dropped from ~2.5 to ~1.3, resulting in more wells being
brought on and less emissions and water usage
• To-date, pilot performance is very encouraging
90
A Summary of eMSAGP Pilot in Pattern A
91

92
Pattern A: Casing Wellhead Pressures
1,000
1,500
2,000
2,500
3,000
3,500
4,000
01/01/08 12/31/08 12/31/09 12/31/10 12/31/11 12/31/12 12/31/13
Pres
sure
(kPa
g)
OB06 Piezo 2 A1I A2I A3I A4I A5I A6I
0
2
4
6
8
10
12
14
16
0
200
400
600
800
1,000
1,200
1,400
1,600
1/1/08 12/31/08 12/31/09 12/31/10 12/31/11 12/31/12 12/31/13
NCG
Rat
e (e
3m3/
day)
Rate
(m3 /
day)
Steam Water Bitumen NCGeM
SAG
P St
art
3 SAGD WP’s 3 WP’s + 2 Infill Wells
Pattern A eMSAGP Pilot Performance - Rates
93

0
50
100
150
200
250
300
0 1 2 3 4 5 6 7 8 9 10
Rate
m3/
d
Years
SAGD Simulation
Average A1-A3
Average A1-A3 + Average Infill
Same recovery as SAGD
A1
A2N
A3
A1N
A2
Repeatable pattern
)2,1()3,2,1(2
212 NANAAvgAAAAvgNANAA +≈+
+
eMSAGP Pilot Pattern Performance
94

0.00.51.01.52.02.53.03.54.04.55.0
1/1/08 12/31/08 12/31/09 12/31/10 12/31/11 12/31/12 12/31/13
SOR
3 SAGD Wells 3 SAGD Wells + 2 Infill Wells
eMSA
GP
Star
t
Pattern A eMSAGP Pilot Performance - ISOR
95

• MEG is implementing eMSAGP in 3 more patterns as approved by the ERCB
• Pattern B and BB ─ 3 SAGD well pairs have started NCG co-injection. The pressures in 2
SAGD chambers are being reduced to get ready for NCG co-injection ─ 3 infill wells are on production after steam stimulation. Production
rates are between 300 to 500 bpd similar to Pattern A infill wells
• Pattern C ─ 7 infill wells are being tied in ─ NCG co-injection may commence in June 2013
• Pattern D ─ 5 infill wells have been drilled, awaiting tie in
Status of eMSAGP Development
96

Christina Lake
T77
R5W4 R6
MEG OSL
Phase 2 Project Area
Drilled SAGD Patterns
OB Well McMurray
OB Well Clearwater
Cased well
OB wells have pressure and temperature instrumentation
CLRP ADA OB and Cased Wells
97
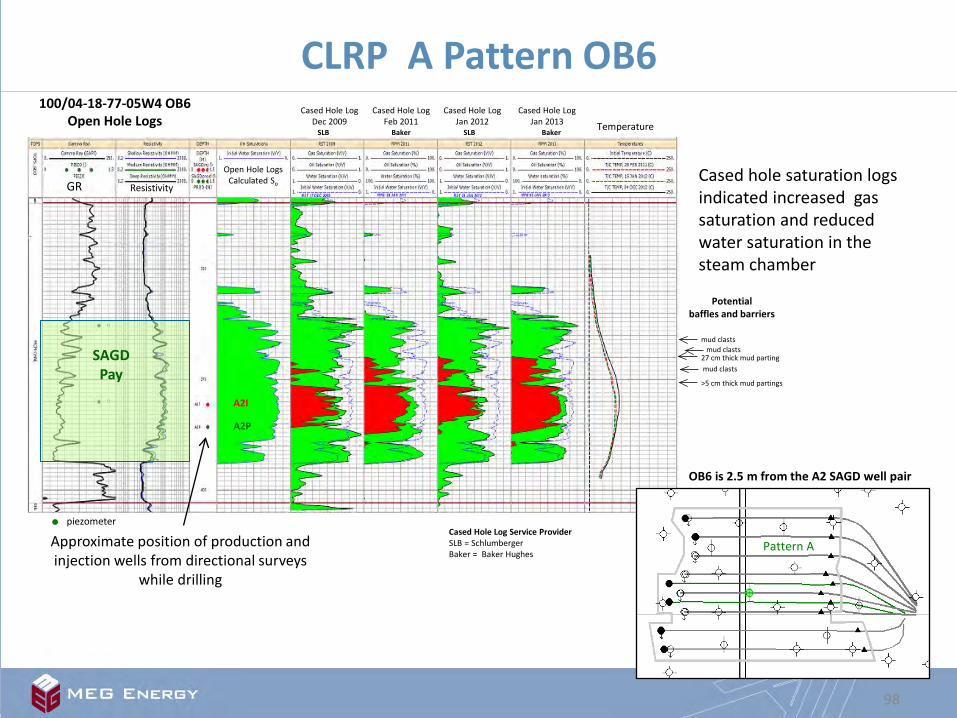
SAGD Pay
GR Resistivity
Open Hole Logs Calculated So
100/04-18-77-05W4 OB6 Open Hole Logs
Cased Hole Log Dec 2009
Cased Hole Log Feb 2011
Cased Hole Log Jan 2012 Temperature
A2P
A2I
Pattern A
OB6 is 2.5 m from the A2 SAGD well pair
piezometer
SLB SLB Baker
Cased Hole Log Service Provider SLB = Schlumberger Baker = Baker Hughes
>5 cm thick mud partings
mud clasts 27 cm thick mud parting
mud clasts
Potential baffles and barriers
mud clasts
Cased hole saturation logs indicated increased gas saturation and reduced water saturation in the steam chamber
Cased Hole Log Jan 2013
Baker
CLRP A Pattern OB6
98
Approximate position of production and injection wells from directional surveys
while drilling

SAGD Pay
GR Resistivity
Open Hole Logs Calculated So
100/14-16-77-05W4 OBB1 Open Hole Logs Cased Hole Log
Dec 2009 Cased Hole Log
Feb 2011 Cased Hole Log
Jan 2012 Temperature
Approximate position of production and injection wells from directional surveys
while drilling
Cased hole saturation logs and temperature surveys indicate bitumen production was mainly from the lower SAGD pay to date
B1P
B1I
OBB1 is 1 m from B1
piezometer
SLB SLB Baker
Cased Hole Log Service Provider SLB = Schlumberger Baker = Baker Hughes
Cased Hole Log Dec 2012
Baker
CLRP B Pattern OBB1
99

SAGD Pay D3P
D3I
GR Resistivity
Open Hole Logs Calculated So
100/02-21-77-05W4 OBD1 Open Hole Logs
Cased Hole Log Dec 2009
Cased Hole Log Feb 2011
Cased Hole Log Jan 2012 Temperature
Approximate position of production and injection wells from directional surveys
while drilling
Cased hole saturation logs and temperature surveys indicate steam chamber development in both upper and lower reservoirs
B4P
B4I SAGD Pay
OBD1 is 11 m from B4 and 17.5 m from D3
piezometer
SLB SLB Baker
Cased Hole Log Service Provider SLB = Schlumberger Baker = Baker Hughes
non-reservoir mud dominant lithofacies
Cased Hole Log Nov 2012
Baker
Baker
CLRP B and D Patterns OBD1
100

SAGD Pay
E2P
E2I
GR Resistivity Open Hole Logs
Calculated So
100/10-16-77-05W4 OB9 Open Hole Logs
OB9 is approximately 30 m from the E2 SAGD well pair
Cased Hole Log Dec 2009
Cased Hole Log Feb 2011
Cased Hole Log Jan 2012 Temperature
Approximate position of production and injection wells from directional surveys while drilling
Cased hole saturation logs and temperature surveys indicate lateral steam chamber development and an increase of bitumen saturation in the water zone that requires further study
piezometer
SLB SLB Baker
Cased Hole Log Service Provider SLB = Schlumberger Baker = Baker Hughes
Cased Hole Log Dec 2012
Baker
CLRP E Pattern OB9
101
CLRP Gas Cap Re-pressuring
102

• The ERCB approval granted in November 2012
• 5 wells have been completed as initial natural gas injection wells
• Anticipated commissioning / start-up is expected to be mid June as facilities work is being completed
• Planned initial injection rate is expected to be up to 708 e3m3 (25 MMSCF) per day into a 600 kPa gas pool
• Total required gas volume to restore reservoir pressure is estimated to be about 339,600 e3m3 (12 BCF). This volume can be smaller dependent on reservoir compartmentalization.
• Initial focus will be on Pattern M and Pattern N where part of the bitumen pay is underlain by bottom water
• Pressure monitoring will rely on observation wells and fall off tests if necessary. Current plan can be adjusted based on pressure response.
Status of the Gas Cap Re-pressure Project
103

T77
R5W4
Gas injection wells
Gas injection wells (future)
Gas pipeline
Gas pipeline (future) McMurray Channel Gas Pool in direct and indirect contact with SAGD interval
103
Note: Not all SAGD intervals in the pool wells are directly connected to associated gas T76
CLRP Gas Cap Repressure Scheme (Patterns M, N, & P)
104
Future Production
105

T77
R5W4 R6
Plant
Water Disposal Wells
Phase 2
Pattern A
Pattern V
Pattern M
Patterns A, B, C, D, E, F & V are producing Patterns G, H, J, K, M, N & T to be brought on
Pattern N
Pattern T
MEG OSL
Phase 2 Development Area
Approved Development Areas
Access Pipeline
Emulsion Pipeline
Water Disposal Pipeline
Water Pipeline
CLRP Active Development Area (ADA)
106

Christina Lake
T77
R5W4 R6
MEG OSL
Approved Development Area
Drilled, producing patterns
Drilled, non-producing patterns
Approved SAGD Patterns
L
AH AG
AF
AQ
AP
AN J
T
U
P
T
V’
CLRP ADA Future Development
107
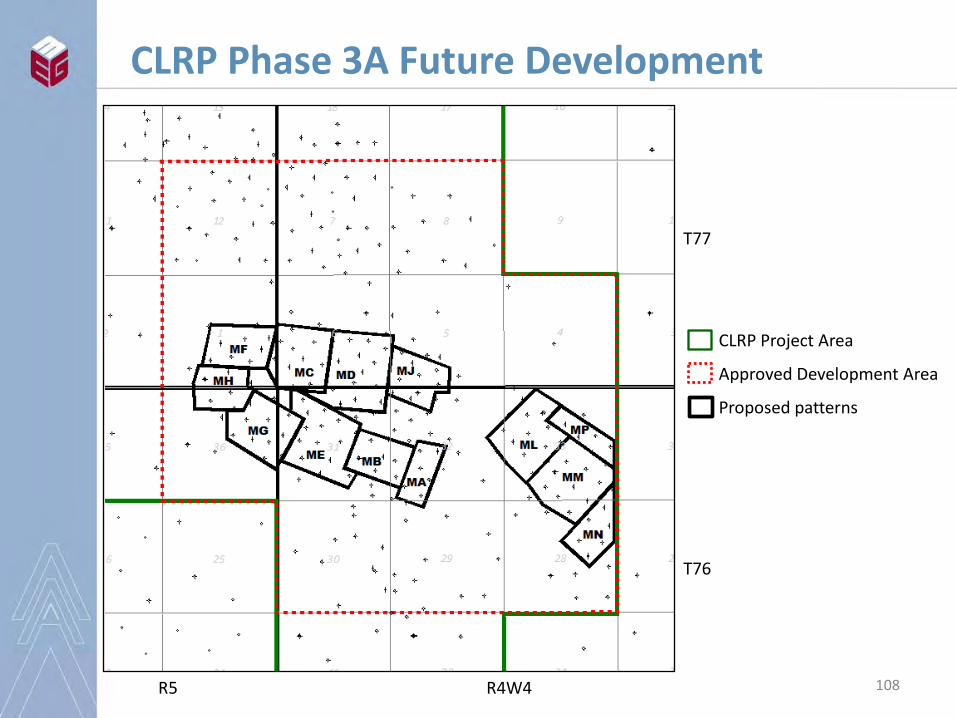
CLRP Project Area
Approved Development Area
Proposed patterns
T77
R4W4 R5
T76
CLRP Phase 3A Future Development
108
Operations
109

• Operation Overview
• Bitumen Treatment
• Vapour Recovery
• Water Treatment
• Steam Generation
• Power Generation
• Measurement and Reporting
• Future Activities
Operations Overview
110
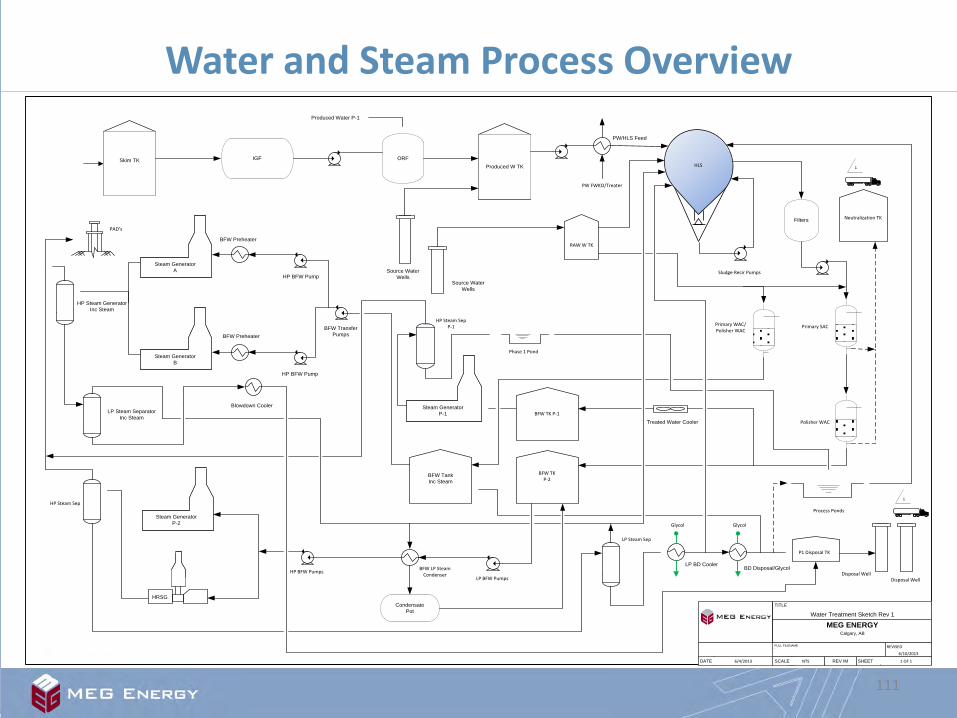
MEG ENERGYCalgary, AB
NTS REV IM 1 OF 1SHEETSCALE
TITLE
Water Treatment Sketch Rev 1
FULL FILENAME REVISED6/10/2013
DATE 6/4/2013
Skim TK IGF ORF
Steam Generator P-1
Steam Generator B
Steam Generator A
Steam Generator P-2
Filters
Produced W TK
BD Disposal/Glycol
PW/HLS Feed
RAW W TK
Neutralization TK
BFW TKP-2
P1 Disposal TK
Condensate Pot
BFW Tank Inc Steam
Process Ponds
BFW Transfer PumpsBFW Preheater
BFW Preheater
Blowdown Cooler
1
1
HRSG
HP BFW Pumps BFW LP Steam Condenser
LP BFW Pumps
LP Steam Sep
Disposal WellDisposal Well
Primary SACPrimary WAC/Polisher WAC
Polisher WAC
Sludge Recir Pumps
HLS
Source Water Wells
Produced Water P-1
Source Water Wells
Phase 1 Pond
BFW TK P-1
Treated Water Cooler
HP Steam SepP-1
HP BFW Pump
HP BFW Pump
PAD’s
HP Steam Generator Inc Steam
HP Steam Sep
LP Steam Separator Inc Steam
PW FWKO/Treater
Glycol
LP BD Cooler
Glycol
Water and Steam Process Overview
111

Inlet Separator P-1
Free Water Knockout/TreaterP-1
Free Water KnockoutP-2 Inlet Separator
Treater A
Treater B
Diluent Tank
Produced Water Tank
Skim Tank Induced Gas FlotationORF
Skim Tank Induced Gas Flotation
Glycol Exchanger
Glycol
Diluent Pump P-2
Diluent Pump P-1
Sales Oil Tank A/B
Sales Oil Transfer Pumps
MEG ENERGYCalgary, AB
NTS REV IM 1 OF 1SHEETSCALE
TITLE
Deoiling Sketch Rev 1
FULL FILENAMEW:\OPERATION\ERCB PRESENTATION\WATER TREATMENT AND
DEOILING SKETCH REV 2.VSD
REVISED6/4/2013
DATE 6/4/2013
PAD’s
Emulsion Exchangers A/B/C/D
Emulsion Exchanger
Sales Oil Exchanger
Slop Oil Tank
Off Spec Tank
Emulsion Exchangers
Disposal Water WellsA/B/C
Glycol
Produced Water Exchanger
Glycol
Sales Oil Exchangers
Glycol
Produced Water Exchanger A/B/C
Glycol
Oil Treatment Overview
112

• MEG’s commercial operation continues to exceed
expectations • Key accomplishments
─ Consistently producing over the design name plate capacity ─ Successful major turn around in 2012 ─ December 2012 was a 1st for MEG, producing over 1 Million bbls
for the Month ─ Reservoir Optimization initiatives allowing MEG to show
continuous production growth
Operational Summary
113

Successes • Oil processing on spec > 99% for the last year • Zero BS&W excursions on the sales pipeline for the last year • Plant capacity testing completed to identify bottlenecks • De-bottlenecking work started in 1st Quarter 2013 • Consistently exceeding the design name plate • Optimization initiatives have improved process and de-oiling
efficiency
Issues • Exchangers fouling • Glycol cooling system is limited during summer months
Facility Operations: Bitumen Treatment
114

0.00
0.50
1.00
1.50
2.00
2.50
3.00
Apr-12 May-12 Jul-12 Aug-12 Oct-12 Dec-12 Jan-13 Mar-13
Produced Water/Bitumen (m3/m3) Make Up Water/Bitumen (m3/m3) Disposal Water/Bitumen (m3/m3)
Monthly Water/Bitumen Ratio Apr. 2012 – Apr. 2013
115

• Vapour recovery compressor maintained a 97% availability • Reported produced gas rate variability in November and March is due to
new wells starting up on Pad V
Issues • Communication failures between vapor recovery compressor and plant
control system • Control of the VRU suction header • Aerial cooler tube failure in December resulted in extended outage of VRU
Implications • Difficulty in trending VRU operating data and status • Instability of vapor recovery compressor and minor flaring events especially
during summer months
Actions • Upgrades to communication link between vapor recovery compressor and
plant control system • Modifications to VRU suction piping and compressor suction pressure control
have stabilized the vapor recovery header
Facility Operations: Vapour Recovery
116

VRU Availability
117
75.00%
80.00%
85.00%
90.00%
95.00%
100.00%
Cooling tube failure

118
Gas Conservation
Plant turnaround Production slow down due to Enbridge pipeline capacity restriction

Successes • Water treatment plant operating at 90% (April 1, 2012 – May 1, 2013) or 96.1%
(Nov 1 – May 1) of current name plate • Boiler feedwater on spec 99.7% (yearly average) • 2013 YTD actual disposal 7.15% (Limit = 8.91%) • Continue recycling high blowdown volumes (steam and liquid) >60% • Completed the tie-in between Phase 1 and Phase 2 process ponds • Continue managing 100% produced water in water treatment plant • New oxygen analyzer in BFW showing reliable results • New polymer make down system • New coagulant tank (no totes at site for coag in water treatment) • Plant trial of brackish water
Issues • Process ponds liner – west pond complete, east pond liner repair in progress
which will reduce storage capacity and may have short term impacts on disposal volumes
• WAC vessel down for 35 days due to internal repairs • Dry chemicals (lime and magox) feeding issues
Facility Operations: Water Treatment
119

Implications • Plant instability/control
Actions • New high efficiency WAC resin installed in one vessel • Trial scheduled for online HLS sludge dewatering • Pond liner repair underway
Facility Operations: Water Treatment (continued)
120

Note: Reporting period average (Apr 2012- Apr 2013)
Water Treatment – Quality Parameters
121
Clearwater Well
Brackish Water
Produced Water
Boiler Feed
Water
TDS (as mg/l) 2,010 13,000 1,525 4,850
SiO2 (as mg/l) 8.9 12 210 28
Cl (as mg/l) 910 6,900 1,493 2,390
Na (as mg/l) 830 4,720 534 1,850
K (as mg/l) 3 34 19 52
Ca (as mg/l CaCO3) 3 75 4 0.2
Total Alkalinity (as mg/l CaCO3)
634 1,100 325 776
pH 8.6 7.9 7.4 10.0
Fe (as mg/l) 0.5 2 0.1 0.05
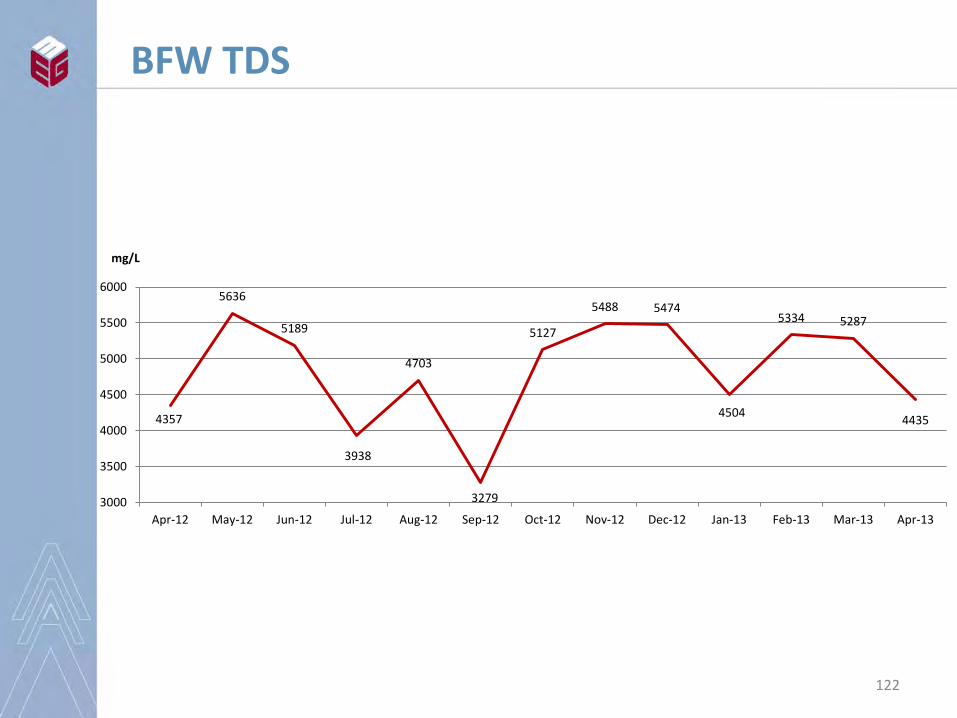
4357
5636
5189
3938
4703
3279
5127
5488 5474
4504
5334 5287
4435
3000
3500
4000
4500
5000
5500
6000
Apr-12 May-12 Jun-12 Jul-12 Aug-12 Sep-12 Oct-12 Nov-12 Dec-12 Jan-13 Feb-13 Mar-13 Apr-13
mg/L
BFW TDS
122

0.00%
20.00%
40.00%
60.00%
80.00%
100.00%
Apr-2012 May-2012 Jul-2012 Sep-2012 Oct-2012 Dec-2012 Feb-2013 Mar-2013
%
Month-year
Phase2 HRSG
Phase2 OTSG
Phase1 OTSG
Incremental Steam 1
Incremental Steam 2
Boiler Availability
123

0
50,000
100,000
150,000
200,000
250,000
300,000
350,000
400,000
450,000
Apr-12 May-12 Jul-12 Aug-12 Oct-12 Dec-12 Jan-13 Mar-13
Injected Steam (t)
Monthly Steam Injection
124

Successes • Consistent GT operation (availability >98.5%) • Generator protection system upgrade in 2012 • High efficiency HEPA inlet filtration added to reduce performance loss
between blade washing • Islanding functionality commissioned to allow facility operation when
disconnected AESO grid • HRSG firing rate increase with corresponding thermal and power
output improvements • 25% reduction in overall boiler and GT unit trips, 2011-2012 • Facility fire & gas voting head project completed. Eliminated random
facility trips caused by false readings.
Facility Operations: Power Generation
125

Issues • Instability during grid isolation
Implications • Potential Impact on availability
Actions • Regular preventative maintenance • Inspection planned during scheduled and unscheduled outages • Continued improvement of steam safety system related trips
Facility Operations: Power Generation (continued)
126

-
10,000.0
20,000.0
30,000.0
40,000.0
50,000.0
60,000.0
70,000.0
80,000.0
Apr-12 May-12 Jun-12 Jul-12 Aug-12 Sep-12 Oct-12 Nov-12 Dec-12 Jan-13 Feb-13 Mar-13
Power Sold (MWh's) Power Purchased (MWh) Power Generation (MWhr's) Power Used (MWh's)
* Generation and usage are estimates based on MEG metering
Power Generation, Sales and Usage (MW-h)
127

• Excludes fuel usage for power generation
Energy Intensity
128

80
85
90
95
100
Jun-12 Jul-12 Aug-12 Sep-12 Oct-12 Nov-12 Dec-12 Jan-13 Feb-13 Mar-13 Apr-13
GTG Availability (168 h/w) HRSG Availability (168 h/w)
CoGen GTG/HRSG
129

Successes • High temperature blowdown exchanger replaced with steam
condenser • Gas usage intensities are within design
Issues • No major issues
Implications • Plant heat balance inefficiencies
Actions • Plant heat optimization ongoing
Facility Operations: Gas Usage
130

Successes • Received approval of 2013 MARP update • The smaller produced gas meters have been working very well in
the test separators • The four well pads online water cut analyzers are working well with
the existing SAGD wells • New Coriolis meters installed in the four test separators are
working well • Two new ultrasonic steam meters have been commissioned and
are providing very repeatable readings on the high pressure steam flows
• The new procedure to measure flare gas is working well • Phase 2 HP Steam Separator is installed and the balance of BFW
and blow down improved significantly • 2012 EPAP was completed in December 2012 and submitted • Source well gas testing conducted December 2012
Facility Operations: Measurement and Reporting
131

Issues • Water group source meter occasionally have higher than expected
variability and well tests didn’t indicate excessive dissolved gas • Deposits from steam injection and condensate carry over are
creating build-up on the injection well steam vortex meters • Use of a clamp-on ultrasonic gas meter allows us to start baseline
comparison of existing gas meters
Implications • Continuing to investigate source well gas production and pump
performance • Errors with steam allocation from well pad steam injection meters • The gas clamp-on meter will allow us to compare performance of
the in-line meters w/o a shutdown or bypass
Facility Operations: Measurement and Reporting (continued)
132
Future Actions • The ORF discharge to produced water tank meter will allow us to
accurately calculate the make-up water. This project is in design.
• Evaluating replacing the wellhead vortex steam meters
• Planning to perform visual inspection of all the well steam meters
133
Facility Operations: Measurement and Reporting (continued)
0.6
0.7
0.8
0.9
1
1.1
1.2
Apr-12 May-12 Jun-12 Jul-12 Aug-12 Sep-12 Oct-12 Nov-12 Dec-12 Jan-13 Feb-13 Mar-13 Apr-13
Pror
atio
n Fa
ctor
BitumenWater
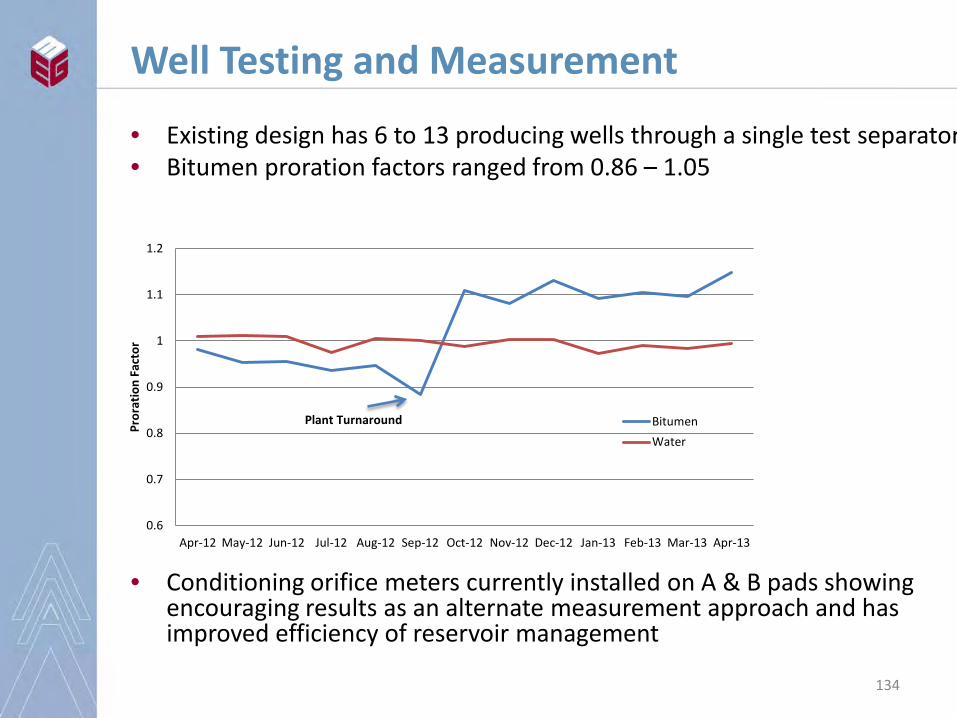
• Existing design has 6 to 13 producing wells through a single test separator • Bitumen proration factors ranged from 0.86 – 1.05
• Conditioning orifice meters currently installed on A & B pads showing encouraging results as an alternate measurement approach and has improved efficiency of reservoir management
Well Testing and Measurement
134
Plant Turnaround

• Ongoing plant de-bottleneck projects • HLS sludge dewatering solution (centrifuges) • Implementing and evaluating projects to further improve the
water recycle rate • Phase 2B ramp-up • Phase 2B secondary steam measurement
Future Activities
135

Water Management
136

• Water Source
• Water Disposal
• Water Use & Volumes
• Water Recycle
• Water Use Optimization
Water Management
137

4-29-77-4W4 CLWA/McM Source Pad 1F1/03-29-077-04W4/00 (McM Saline Source Well; Active) 1F1/14-20-077-04W4/00 (CLWA Source Well; Future) 1F1/06-29-077-04W4/00 (CLWA Source Well; Future)
1-14-77-5W4 CLWA Source Pad 1F1/02-14-077-05W4/00 (CLWA Source Well; Future) 1F1/01-14-077-05W4/00 (CLWA Source Well; Future) 1F1/08-14-077-05W4/00 (CLWA Source Well; Future)
7-16-77-5W4 CLWA Source Pad 1F1/08-16-077-05W4/00 (CLWA Source Well; Active) 1F1/03-16-077-05W4/00 (CLWA Source Well; Active)
8-4-77-5W4 CLWA Source Pad 1F1/05-03-077-05W4/00 (CLWA Source Well; Active) 1F1/12-03-077-05W4/00 (CLWA Source Well; Active) 1F2/05-03-077-05W4/00 (CLWA Source Well; Future)
8-30-76-4W4 CLWA Source Pad 1F1/01-30-076-04W4/00 (CLWA Source Well; Future) 1F1/09-30-076-04W4/00 (CLWA Source Well; Future)
CLRP Source Water Well Locations
138

• Under licensed volume limits • Average daily withdrawals range from 0 – 4700 m3 /day
CLRP Clearwater Production
139
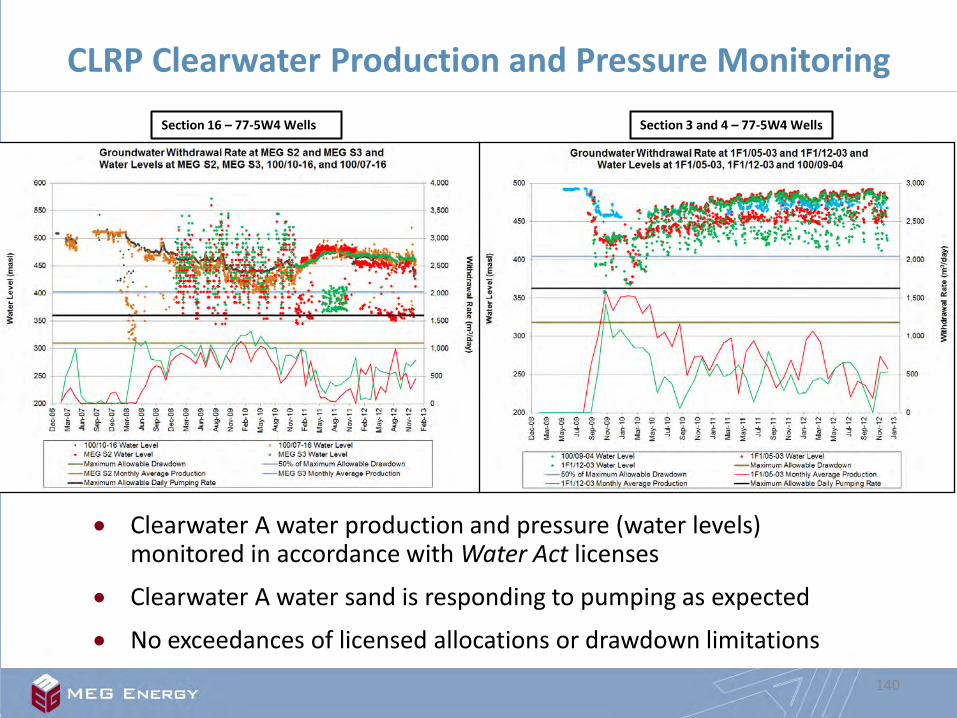
Section 3 and 4 – 77-5W4 Wells Section 16 – 77-5W4 Wells
• Clearwater A water production and pressure (water levels) monitored in accordance with Water Act licenses
• Clearwater A water sand is responding to pumping as expected
• No exceedances of licensed allocations or drawdown limitations
CLRP Clearwater Production and Pressure Monitoring
140

Disposal pipelines
100/09-29-077-05W4M (Active) 102/10-29-077-05W4M (Active) 103/10-29-077-05W4M (Active) (blowdown)
100/07-16-077-05W4M (regeneration)
ERCB Approval No. 10659 Maximum WHIP 4,230 kPag
100/11-29-077-05W4M (D65 Application Submitted)
CLRP McMurray Disposal Wells
141

344,863 m3 in 2012/2013 reporting year
Disposal Well: 102/10-29-77-05W4
142
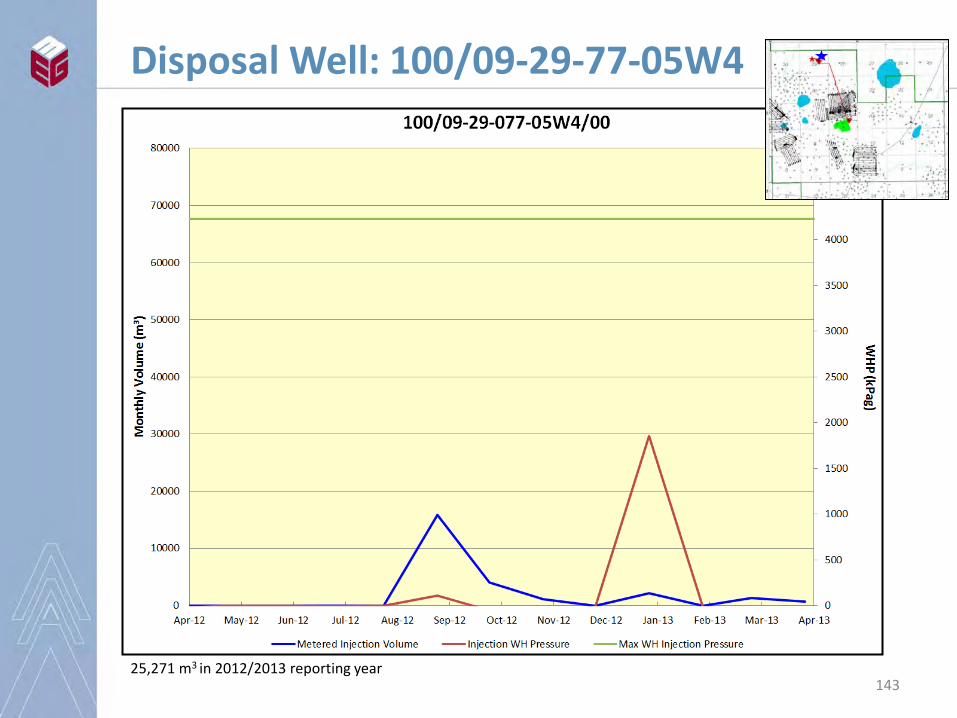
25,271 m3 in 2012/2013 reporting year
Disposal Well: 100/09-29-77-05W4
143

2.5 m3 in 2012/2013 reporting year
Disposal Well: 103/10-29-77-05W4
144

Disposal Well: 100/07-16-77-05W4
*well on vacuum during disposal 1,180 m3 in 2012/2013 reporting year 145

Basal McMurray Water Sand Pressure Monitoring
146
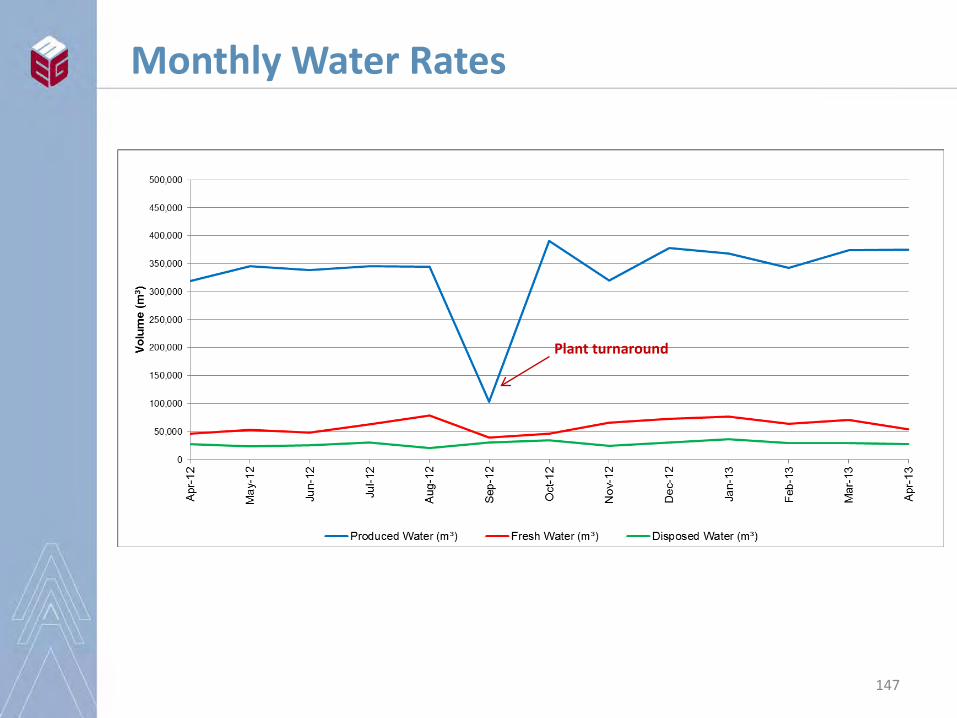
Monthly Water Rates
Plant turnaround
147
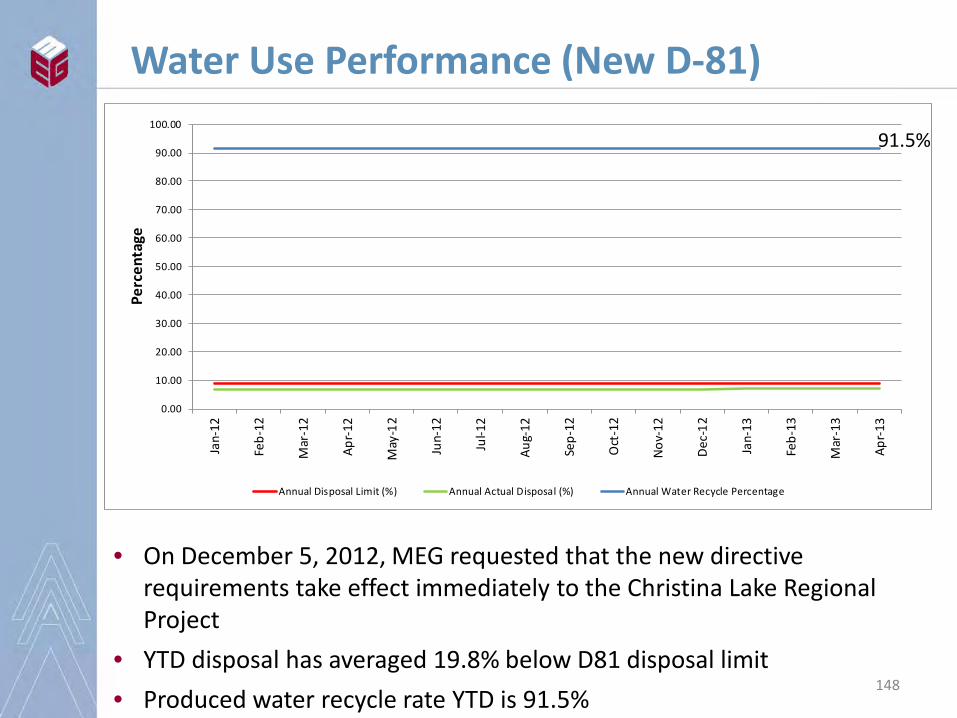
• On December 5, 2012, MEG requested that the new directive requirements take effect immediately to the Christina Lake Regional Project
• YTD disposal has averaged 19.8% below D81 disposal limit • Produced water recycle rate YTD is 91.5%
0.00
10.00
20.00
30.00
40.00
50.00
60.00
70.00
80.00
90.00
100.00
Jan-
12
Feb-
12
Mar
-12
Apr-1
2
May
-12
Jun-
12
Jul-1
2
Aug-
12
Sep-
12
Oct
-12
Nov-
12
Dec-
12
Jan-
13
Feb-
13
Mar
-13
Apr-1
3
Perc
enta
ge
Annual Disposal Limit (%) Annual Actual Disposal (%) Annual Water Recycle Percentage
91.5%
Water Use Performance (New D-81)
148

• 2012 WSR = 93% • YTD WSR = 95%
82%
84%
86%
88%
90%
92%
94%
96%
98%
100%
102%
Apr-1
2
May
-12
Jun-
12
Jul-1
2
Aug-
12
Sep-
12
Oct-1
2
Nov-
12
Dec-
12
Jan-
13
Feb-
13
Mar
-13
Apr-1
3
Perc
enta
ge
Produced Water to Steam Ratio (WSR) WSR Annual Average
Produced Water to Steam Injected Ratio
149

Water Use Optimization
• MEG continues to optimize blowdown recycle (exceeding design and adjusting to operational limitations) >60%
• Modification made to the pilot CPF in 2013 to reduce disposal ─ Installation of line to transfer pilot process pond water to Phase 2
process ponds
• Conducted testing of saline water (McMurray) in Q3, 2012. Saline water use planned for Phase 2B operation within next reporting year
• Ongoing trial of incremental steam generators (2 x 50 MMBTU/h) utilizing blowdown make-up stream
• MEG expects challenges with disposal (D81) limits in 2013, related to Phase 2B facility commissioning and start-up
• MEG planning installation of a blowdown evaporator planned for 2015 to further improve water recycle capabilities
150

Compliance and Environment
151

• Flaring/Gas Conservation
• Sulphur Production and Emissions
• Greenhouse Gas Management
• Compliance
Compliance & Environment
152

Shutdown
Plant turnaround
• Overall gas conservation >99%
• April 2013 replacement of Phase 1 HP Flare expected to further reduce flaring events
Monthly Flare Volumes
153

• MEG is conducting active monitoring of produced gas H2S concentrations on a weekly basis
• EPEA SO2 emissions limit for CLRP is 2.0 t/d, daily SO2 emissions have averaged 0.370 t/d (April 1, 2012 to April 30, 2013)
• Peak SO2 emissions to date is 0.746 t/d (occurred during a Jan 2013 plant trip and HP flare event)
• No significant changes in sulphur production have been observed over past year of production
• Sulphur capture currently planned for Phase 2B, using a liquid scavenger process
Sulphur Production and Emissions
154

0.00
0.50
1.00
1.50
2.00
2.50
Apr-12 May-12 Jun-12 Jul-12 Aug-12 Sep-12 Oct-12 Nov-12 Dec-12 Jan-13 Feb-13 Mar-13 Apr-13 May-13
Tonn
es/d
ay
Monthly Average Monthly Peak Approval Limit (2 t/d) Rolling 3-month Average
• SO2 production remains stable and well below limits
Quarterly Average (t/d)
0.39 0.27 0.32 0.48 0.47
SO2 Emissions
155
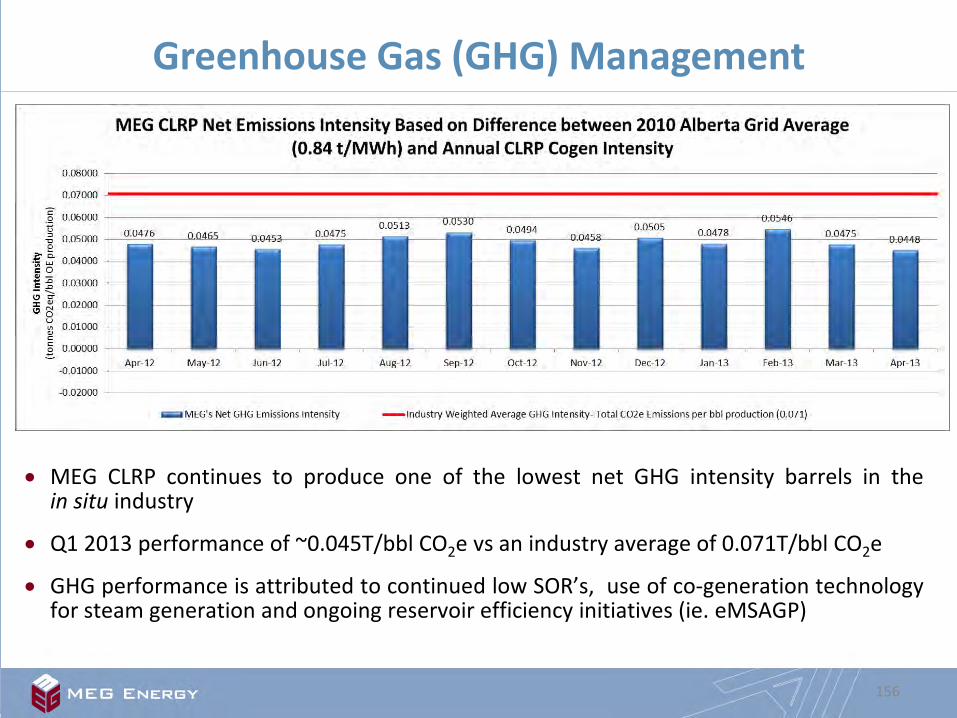
• MEG CLRP continues to produce one of the lowest net GHG intensity barrels in the in situ industry
• Q1 2013 performance of ~0.045T/bbl CO2e vs an industry average of 0.071T/bbl CO2e
• GHG performance is attributed to continued low SOR’s, use of co-generation technology for steam generation and ongoing reservoir efficiency initiatives (ie. eMSAGP)
Greenhouse Gas (GHG) Management
156
Inspections • 9 ERCB inspections were conducted from April 2012 to April 2013,
all of which were satisfactory
─ 3 pipeline inspection
─ 2 well inspections
─ 4 facility inspections
Regulatory Compliance
157

Self-Disclosures MEG reported 8 self-disclosures to the ERCB during the reporting period: • July 19, 2012: Corehole Conversions- Late Submission
– Non-conformance related to late notification of corehole conversions to observation wells.
• August 3, 2012: Water Measurement Potential Non-Compliance – Potential non-conformance with water measurement requirements as
outlined in ERCB Directive 017. MEG investigated of water balance, water meter accuracy and consistency in volumetric reporting to the Petroleum Registry. A follow-up report was submitted in December 2012.
• October 25, 2012: Well Test Frequency Non-Compliance – Non-compliance on well testing requirements during a turnaround period
as prescribed in Directive 17. Testing was compliant following the turnaround.
• November 13, 2012: Secondary Containment Capacity Deficiency – Potential inadequate secondary containment for various tanks at the
Christina Lake Regional Project. An engineering solution has been proposed and follow up with the ERCB is ongoing.
Regulatory Compliance
158

Self-Disclosures (continued)
• February 15, 2013: LP Flare Reliability ─ MEG submitted a Corrective Action Plan to address ongoing Phase 1 Low
Pressure Flare outages. The plan includes installation of a permanent pilot and wind shielding. The work outlined in the plan was completed in April 2013.
• March 15, 2013: Well Re-Entry Without Submission of Well Licence Re-Entry/Resumption Application
─ Non-compliance on work during March, 2013, where MEG re-entered three abandoned wells in preparation of non-routine abandonment and for the purpose of assessment of the well bores. MEG failed to submit the well license re-entry prior to entering the abandoned well bores as per Directive 56 and his since completed proper license requests.
• April 18, 2013: Steam Injection Rate Reduction ─ Non-compliance on reduction in the steam injection rate to one injector
well that exceeded the 30% threshold stated in scheme approval 10773. The injection rate was reduced due to limited capacity of a common steam line. Future occurrences of the non-compliance are not anticipated as the common line now has adequate capacity.
Regulatory Compliance
159

Flaring & Venting • MEG reported 22 flaring/venting notifications to the ERCB
including exceedances and outages. • 6 were planned and 16 were unplanned • Installation of new equipment of Phase 1 HP flare is expected to
result in increased reliability moving forward
Incident Reporting • March 14, 2013 – Pipeline Coating Damage & Repair
─ Damaged coating on abandoned gas lines consistent with initial installation or backfill. No release of gas or fluids associated with the incident. Issue rectified with sleeve repair.
Compliance Reporting
160

Spills • 12 spills occurred at MEG from April 2011 to April 2012 that met the
ERCB reporting requirements. All reports were filed with ERCB and remediation has or is being completed. 2012/13 spill intensity ranks well below CAPP industry average.
Regulatory Compliance
161

• To the best of MEG’s knowledge, the Christina Lake Regional Project is in compliance with all conditions and regulatory requirements related to Approval No.10773.
Compliance
162

CLRP Future Plans
163

Amendments approved April 2012 - April 2013 • Phase 2 infill wells • Gas cap re-pressuring within Phase 2 (Active Development Area) • AF, AG, AH, AP, AQ & AN pads • NCG co-injection pilot at Pads B, C & D
Regulatory Amendments
164
• Facilities changes at Phase 2B and Phase 3 plants (includes addition of blowdown evaporators, reduction in total # of OTSG’s, installation of co-generation facilities)
• Additional McMurray disposal well at 100/11-29-77-5W4/00
Pending Approval
165

166
LRP ADA Future Development
Christina Lake
T77
R5W4 R6
MEG OSL
Approved Development Area
Drilled, producing patterns
Drilled , non-producing patterns
Approved SAGD Patterns
L
AH AG
AF
AQ
AP
AN J
T
U
P
T
V’
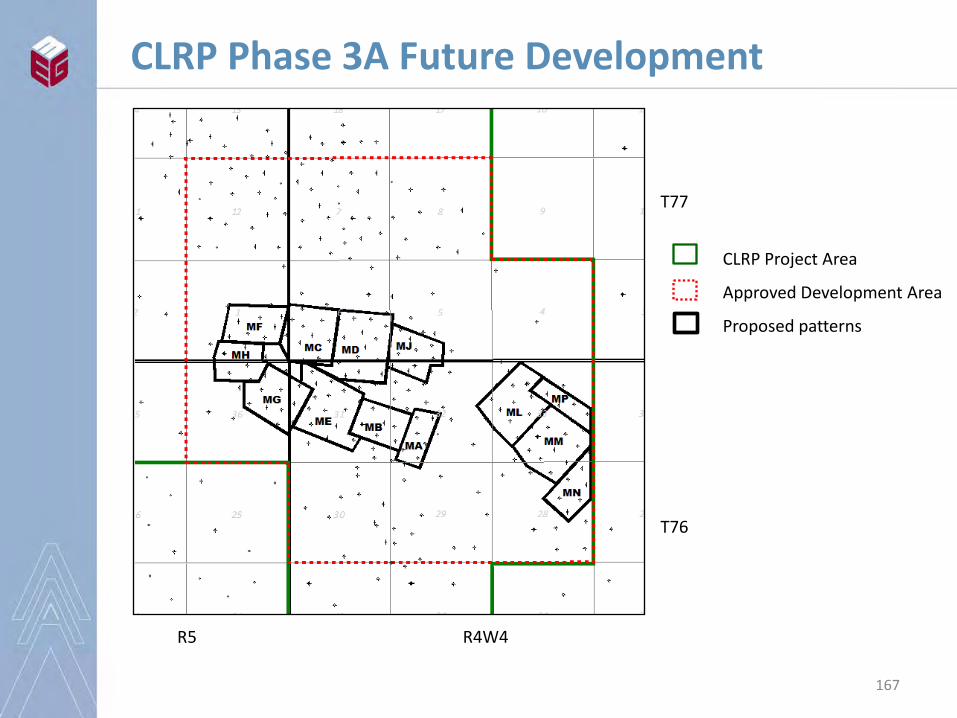
CLRP Project Area
Approved Development Area
Proposed patterns
T77
R4W4 R5
T76
CLRP Phase 3A Future Development
167

• Phase 2B first steam scheduled for Q3/Q4 2013
• Ongoing de-bottlenecking of Phase 2 facilities
• Ongoing construction of Phase 3A facilities
• Ongoing pattern additions within Phase 2 and 3 areas
• Finalization and submission of thermal compatibility program
• Continued development of eMSAGP within Active Development Area
• Ongoing resource assessment
CLRP Future Plans
168
Questions & Comments
169


