Download - Christiansen, Thea.pdf
This master’s thesis is carried out as a part of the education at the
University of Agder and is therefore approved as a part of this
education. However, this does not imply that the University answers
for the methods that are used or the conclusions that are drawn.
University of Agder, 2016
Faculty of Health- and Sports science
Department of Public Health, Sports and Nutrition
The association between parental education,
living arrangements and dietary habits among overweight and obese Norwegian
children aged 6-10 years.
“Frisklivsstudien barn”
Thea Christiansen
Supervisor Tonje Holte Stea
Nina Cecilie Øverby

Acknowledgements The beginning and the planning process of this master thesis started after a presentation of the
project “Frisklivsstudien Barn”. A year of working with this thesis have given me a better
understanding of how important research is, and why public health is so needed and important
for countries and communities.
This year have taught me to not give up and to stay focused and targeted to finish what I have
started. The journey has not been all positive and fun, but I got through it, and I am grateful.
I would like to thank my supervisors Tonje Holte Stea and Nina Cecilie Øverby at UiA, for
always being positive, helpful and constructive.
I want to thank Margaretha Haugen from the Norwegian Institute of Public Health, for taking
the time in helping me with the nutrition calculations in this dataset.
Finally, I would like to thank my friends and family for their interest in this work and for their
support.
Thank you!
Thea Christiansen
Kristiansand, May 2016
Sammendrag Barns kostholds vaner har endret deg de siste tiårene. Barn er mer overvektige og fete, og
sosial ulikhet relatert til dette tema er diskutert i de fleste samfunn.
Hensikten med denne masteroppgaven er å utforske sammenhengen mellom de sosio-
demografiske faktorene bosituasjon og foreldres utdannelse og tilgjengelighet og inntak av
utvalgte matvarer og totalt energi og makronæringsstoff inntak blant overvektig/fete norske
barn i alderen 6-10 år. Sammenbindingen er en utdypning av den teorien som ligger til grunn i
vedlagt artikkel. Sammenbindingen starter med en introduksjon, videre følger en utdypning
av forekomst og ulike målemetoder av overvekt og fedme, årsaker til – og helsekonsekvenser
av overvekt og fedme hos barn og forebyggende tiltak. Deretter følger målet med
masteroppgaven, og beskrivelse av metodevalg og studiedesign, utvalg og rekruttering,
datainnsamling og statistisk analyse. Videre er et utvalg resultater presentert, og en diskusjon
av metodologi. Etter sammenbindingen følger en artikkel med hovedfunnene presentert.
Artikkelen er planlagt innlevert til tidsskriftet Scandinavian Journal of Public Health. Etter
artikkelen er det vedlagt frekvens spørreskjema, samtykkeerklæringer og godkjenning fra
Regional Etisk komité (REK) og Norsk samfunnsvitenskapelig Datatjeneste AS (NSD).
Nøkkelord: Barn, overvekt, foreldres utdannelse, bosituasjon, kostholdsvaner, tilgjengelighet
av matvarer
Abstract Children´s dietary patterns have changed the passed decades. Children are more overweight
and obese, and social inequalities related to this topic are discussed among all societies.
The purpose of the master thesis was to explore the association between the socio-
demographic factors parental education and living arrangements and the availability and
intake of selected food items and total energy intake and macronutrient intake among
overweight and obese Norwegian children aged 6-10 years. The thesis is an extension of the
theory that is used in the article. This thesis begins with an introduction, which further
expands to the elaboration of childhood overweight and obesity occurrence, the causes of the
childhood epidemic and further the consequences of childhood overweight and obesity and
preventive actions. Further, the objective and description of method applied, the study
population, recruitment process, data collection and statistical analysis is explained. Selected
results will be presented in the first part of the thesis. Following this, a discussion of the
selected results and the used methodology is presented. Further, the article is attached
presenting more results. The article is scheduled to be submitted to the Scandinavian Journal
of Public Health,
Following the article, is attached the frequency questionnaire, request forms, consent forms
and research protocol approval from the Regional Commite for Ethics and the ethical
approval and research clearance from the Norwegian Social Science Data Service.
Keywords: Children, overweight, parental education, living arrangements, dietary habits,
food availability
Table of Contents 1.0 Introduction ............................................................................................................................... 8
1.1 Study objectives .............................................................................................................................. 8
2.0 Theory ....................................................................................................................................... 10 2.1 Prevalence of childhood overweight and obesity ................................................................. 10 2.2 Different measuring methods to define childhood overweight and obesity ............... 11 2.2.1 Definitions of overweight and obesity based on BMI ................................................................. 11 2.2.2 Waist circumference and waist – hip ratio ...................................................................................... 12
2.3 Causes of the childhood overweight and obesity epidemic .............................................. 13 2.3.1 Socio-‐demographic and family factors .............................................................................................. 14 2.3.2 Dietary factors .............................................................................................................................................. 16 2.3.3 Sedentary behaviour and physical activity ...................................................................................... 17
2.4 Consequences of overweight and obesity ............................................................................... 18 2.4.1 Physical consequences ............................................................................................................................. 18 2.4.2 Psychological consequences .................................................................................................................. 18
2.5 Preventive actions in reducing childhood overweight and obesity ............................... 18
3.0 Objective ................................................................................................................................... 19
4.0 Method ...................................................................................................................................... 19 4.1 Study design ...................................................................................................................................... 19 4.2 Recruitment and study population ............................................................................................ 19 4.3 Data collection methods ................................................................................................................ 20 4.3.1 Questionnaire ............................................................................................................................................... 20
4.4 Statistical analysis ........................................................................................................................... 21 4.4.1 Variables ......................................................................................................................................................... 21
4.5 Test retest .......................................................................................................................................... 22 4.5.1 Study design .................................................................................................................................................. 22 4.5.2 Recruitment and study population ..................................................................................................... 22 4.5.3 Data collection methods .......................................................................................................................... 22 4.5.4 Questionnaire ............................................................................................................................................... 23 4.5.5 Statistical analysis ...................................................................................................................................... 23
5.0 Results ....................................................................................................................................... 23
5.1 “Frisklivsstudien barn” .................................................................................................................. 23
5.2 Test – retest ....................................................................................................................................... 26
6.0 Discussion ................................................................................................................................ 27
6.1 “Frisklivsstudien barn” .................................................................................................................. 27 6.2 Test – retest ....................................................................................................................................... 28
7.0 Ethnical Considerations ...................................................................................................... 29
8.0 Conclusion ............................................................................................................................... 29
9.0 References ............................................................................................................................... 30
10.0 Appendix ................................................................................................................................ 37
1.0 Introduction The prevalence of overweight has increased globally since 1980 to 2013 (Ng et al., 2014).
And obesity and overweight among children and adolescents is increasing in economically
underprivileged countries (Lobstein et al., 2015). Premature overweight and obesity is
commonly observed in several developing countries, and the prevalence in low – and middle -
income countries is rising rapidly (Gupta, Goel, Shah, & Misra, 2012). All though the
frequency is generally high, the prevalence of overweight and obesity might have reached a
plateau in some developed countries (Bass & Eneli, 2015).
Nationally, the childhood overweight and obesity epidemic seems to have leveled off, where a
stabile prevalence is observed from 2012 - 2016 (Hovengen, Bøhler, & Biehl, 2016).
Childhood overweight and obesity increases the risk of diseases and represent a major public
health concern (Lobstein, Baur, & Uauy, 2004). This is because premature overweight and
obesity if observed to persist in to adulthood (Reilly & Kelly, 2011; Singh, Mulder, Twisk,
Van Mechelen, & Chinapaw, 2008). Type 2 diabetes, hypertension, dyslipidaemia, metabolic
syndrome and obstructive sleep apnea are observed consequences of overweight and obesity
in children (Reilly et al., 2003). Long-term consequences of premature overweight and
obesity are associated with heart disease, cancer and adult diabetes in addition to
musculoskeletal changes and psychosocial diseases (Ebbeling, Pawlak, & Ludwig, 2002;
Reilly et al., 2005).
Thus, the short and long- term consequences pose a financial burden on the healthcare
systems (Trasande & Elbel, 2012). A systematic review of western European countries
estimated the obesity-related healthcare burdens absolute cost to be 10.4 billion euros
(Müller-Riemenschneider, Reinhold, Berghöfer, & Willich, 2008).
To effectively address this public health challenge, it is essential to detect important and
modifiable risk factors contributing to childhood overweight and obesity.
1.1 Study objectives 1. The main objective of the research paper was to examine the association between the
socio-demographic factors living arrangements and parental education and availability
and intake of selected food items and beverages among overweight and obese 6-10
year old Norwegian children.
2. To perform a test-retest study to assess the reliability of selected questions of the
frequency questionnaire used in the quasi-controlled intervention study “Frisklivsstudien
Barn” (FSB).
2.0 Theory
2.1 Prevalence of childhood overweight and obesity Globally, the prevalence of childhood overweight and obesity has increased to an alarming
level in the past few decades (Ebbeling et al., 2002). It is estimated that nearly 42 million
children are overweight and obese (De Onis, Blössner, & Borghi, 2010). Ng et al., (2014)
reported substantial increases in prevalence among children and adolescents in developed
countries, with 24% of boys and 23% of girls being either overweight or obese in 2013
compared to 17% of boys and 16% of girls in 1980. In developing countries, the prevalence
increased from 8 % in 1980 to 13% in 2013 for boys and girls (Ng et al., 2014).
In eight different European countries, children with overweight and obesity have an estimated
prevalence of 19.3-49.0% in boys and 18.4-42.5% in girls, respectively. Across Europe,
countries in middle, northern and eastern Europe report the lowest prevalence of overweight
among pre – school children, while the Mediterranean region and the British islands report the
highest rates (Cattaneo et al., 2010). A study of Ortega et al., (2014) reported that southern
Europe had a higher prevalence of overweight and obesity in adolescents compared to central-
northern Europe (31 vs 21%) respectively.
According to a recently published national study among Norwegian children, a total of 13%
boys and 17% girls were overweight and obesity frequency were 2.3% for boys and 3% for
girls (Hovengen et al., 2016).
The prevalence of childhood overweight and obesity varies within countries and regions
(Low, Chin, & Deurenberg-Yap, 2009). Significant differences between regions of the world
has been identified; approximately 50% or more of the population are overweight or obese in
America (61%), Europe (55%) and Eastern Mediterranean (46%), while a much lower
prevalence is observed in Africa (27%), South - East Asia (14%) and Western Pacific (25%)
(Yatsuya et al., 2014).
2.2 Different measuring methods to define childhood overweight and
obesity
There are several measuring methods one can use to assess childhood overweight and obesity.
Body Mass Index (BMI) is measured as the ratio of bodyweight in kilograms to the square of
the height in meters (kg/m2), and is the most commonly used method of determining
overweight and obesity status (World Health Organization., 1995). BMI has also been
recognized as an indicator of total body fat (Lahti-Koski & Gill, 2004). The Norwegian
national clinical guideline for weighing and measuring children (Helsedirektoratet, 2010) has
recommended the World Health Organization (WHO) reference (de Onis, 2006) to identify
overweight and obesity in children from birth to 5 years of age, whereas the BMI charts
developed for Norwegian children (Juliusson´s curves) has been recommended as a standard
measure for identifying overweight and obesity in children aged 6 – 19 years
(Helsedirektoratet, 2010). Another anthropometric measure is waist circumference and weight
to height ratio, which is important in detecting abdominal obesity, and the risk factors
associated to this measure and to discriminate higher - risk individuals (Bastien, Poirier,
Lemieux, & Després, 2014; Cornier et al., 2011). Among US children aged 2-18 years,
reference values are provided (Fernández, Redden, Pietrobelli, & Allison, 2004).
Additionally, direct methods such as underwater weighing and dual energy X-ray
absorptiometry (DEXA) provides a more accurate estimation of body fat distribution, these
however are not suitable for large scale use because of costs and limited availability (Lobstein
et al., 2004).
2.2.1 Definitions of overweight and obesity based on BMI
IOTF/ Cole´s Index
Internationally acceptable cut off levels for BMI of overweight and obese children aged 2 -18
years is provided by International Obesity Task Force (IOTF), also called Cole´s Index (T. J.
Cole, Bellizzi, Flegal, & Dietz, 2000). IOTF`s classification system is based on cross -
sectional data from 6 different countries on BMI levels by sex and age, which serves the
purpose of representing the normal population (T. J. Cole & Lobstein, 2012). From the study,
age and sex specific reference values (iso – KMI) were provided according to children´s
growth and development, and to somewhat consider gender inequalities (T. J. Cole et al.,
2000).
WHO growth standards
The publication of the WHO child growth standards, which uses age and sex-specific BMI
centiles or standard deviation (SD) scores to define cut offs, have provided another tool for
assessing prevalence of overweight and obesity in infancy and early childhood (de Onis,
Onyango, Van den Broeck, & Chumlea, 2004). The WHO standards were developed based on
results from the WHO Multicentre Growth Reference Study (MGRS) which examined the
growth of healthy infants living in good hygienic conditions in six different countries (Brazil,
Ghana, India, Norway, Oman and the US). The MGRS, conducted between 1997 and 2003,
included a longitudinal component studying infants (n=882) from birth to 24 month, and a
cross-sectional component focusing on children, 18-71 months old (n=6669 (Bhan & Norum,
2004). Although the intention behind developing the WHO child growth standards was to
show optimal growth of all children in this age range, the MGRS only included children from
high social class (except Norway and USA, where social class was not an inclusion criteria),
living under conditions where mothers engaged in fundamental health promoting practices,
such as breastfeeding and non – smoking environment (de Onis, 2006).
2.2.2 Waist circumference and waist – hip ratio Abdominal obesity or visceral fat is adipose tissue located within the abdominal cavity and
around the visceral organs and has been identified as an important risk factor of
cardiovascular disease (CVD) (Bastien et al., 2014). Waist to hip ratio (WHR) and waist
circumference (WC) are indirect measurements used to assess body fat distribution, especially
abdominal adiposity (Amato, Guarnotta, & Giordano, 2013). If the WC (cm) is over half the
height (cm) (WHTR = 0.5), studies have described an increased health risk due to abdominal
obesity, regardless of age and gender (Ashwell & Hsieh, 2005; McCarthy & Ashwell, 2006)
WC on children has shown to correlate with levels of lipids and insulin in children, which
might also be the case for WHR (Freedman, Serdula, Srinivasan, & Berenson, 1999; Maffeis
et al., 2008).
2.2.3 Challenges/limitations with the different measuring methods It is suggested that some countries and world regions should have different BMI cut offs
(Inoue et al., 2000). World Health Organization have reported that the relationship between
BMI and percentage of body fat depends on sex, age and varies across ethical groups, with
special regard to Asian population (World Health Organization, 2004) It is also challenging to
collect and compare prevalence of overweight and obesity between different countries when
traditionally used methods and weight references varies (Cattaneo et al., 2010; Wang &
Lobstein, 2006).
In Norway and Belgium, children compared to the WHO reference were more similar to the
national growth reference, than the WHO standards (Júlíusson, Roelants, Hoppenbrouwers,
Hauspie, & Bjerknes, 2011). WHO growth standards are valuable and presents an
international comparison of growth, however, it might be a matter of debate whether they can
replace the national reference for growth when it comes to the individual child (Hui et al.,
2008; Ziegler & Nelson, 2012). Furthermore, for the use in prevalence-studies, the European
Childhood Obesity Group recommends that the WHO growth charts and the IOTF´s-
definition should be used so that comparisons between epidemiological studies can be
performed (Rolland-Cachera, 2011). De Lorenzo et al., (2013) concluded that measuring total
body fat % would be a better measure than BMI to assess occurrence of overweight and
obesity. BMI does not consider the location of adiposity (Hall & Cole, 2006), and it can
therefore become a risk of underestimating children with overweight and obesity (Javed et al.,
2015).
2.3 Causes of the childhood overweight and obesity epidemic The rising prevalence of overweight and obesity is complex and is a result of genetic factors,
energy-balance, and social-demographic factors (Bass & Eneli, 2015; Han, Lawlor, & Kimm,
2010; Karnik & Kanekar, 2015). Family and school environment is part of a larger society
(community and social environments), where the risk factors for being overweight is not only
influenced by sedentary behaviour, unfavourable dietary habits, and decreased physical
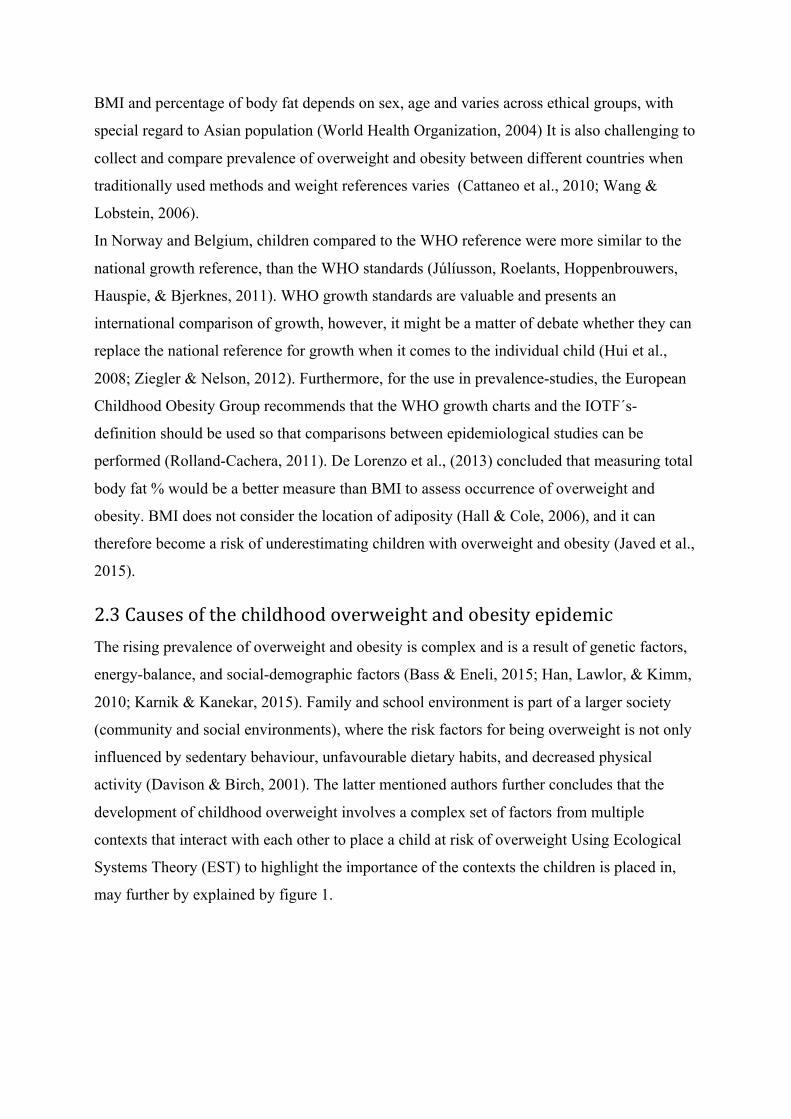
activity (Davison & Birch, 2001). The latter mentioned authors further concludes that the
development of childhood overweight involves a complex set of factors from multiple
contexts that interact with each other to place a child at risk of overweight Using Ecological
Systems Theory (EST) to highlight the importance of the contexts the children is placed in,
may further by explained by figure 1.
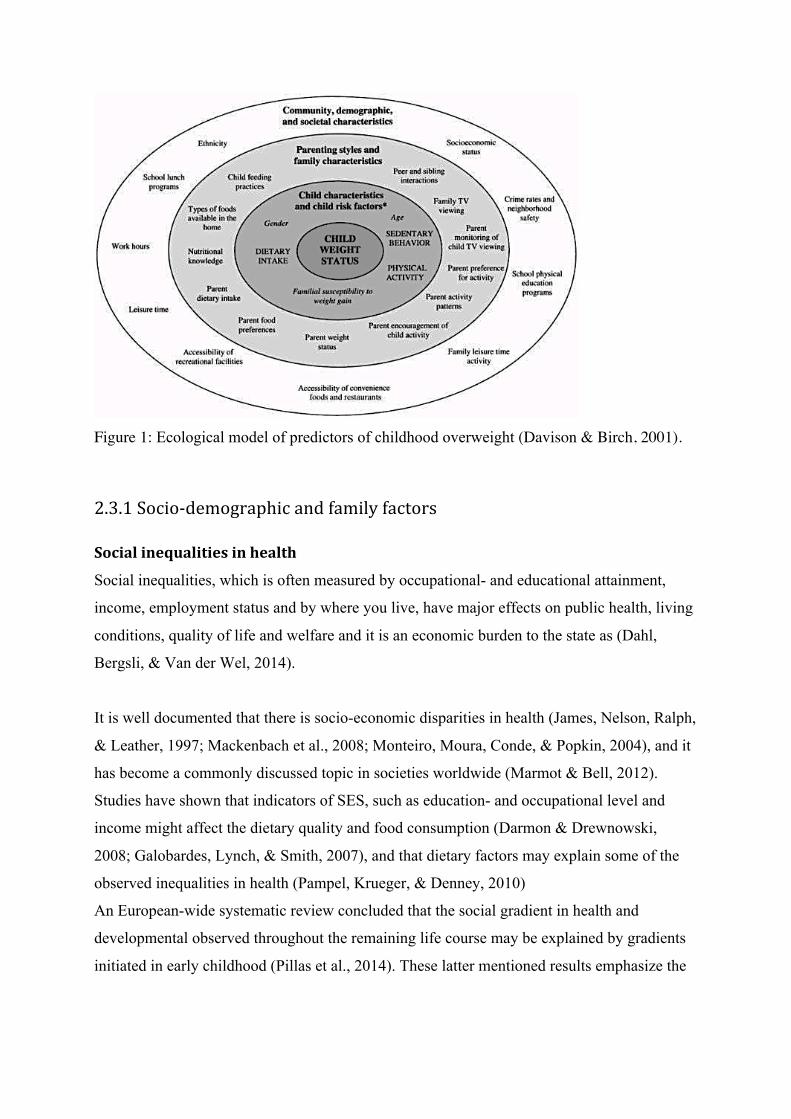
Figure 1: Ecological model of predictors of childhood overweight (Davison & Birch, 2001).
2.3.1 Socio-‐demographic and family factors
Social inequalities in health
Social inequalities, which is often measured by occupational- and educational attainment,
income, employment status and by where you live, have major effects on public health, living
conditions, quality of life and welfare and it is an economic burden to the state as (Dahl,
Bergsli, & Van der Wel, 2014).
It is well documented that there is socio-economic disparities in health (James, Nelson, Ralph,
& Leather, 1997; Mackenbach et al., 2008; Monteiro, Moura, Conde, & Popkin, 2004), and it
has become a commonly discussed topic in societies worldwide (Marmot & Bell, 2012).
Studies have shown that indicators of SES, such as education- and occupational level and
income might affect the dietary quality and food consumption (Darmon & Drewnowski,
2008; Galobardes, Lynch, & Smith, 2007), and that dietary factors may explain some of the
observed inequalities in health (Pampel, Krueger, & Denney, 2010)
An European-wide systematic review concluded that the social gradient in health and
developmental observed throughout the remaining life course may be explained by gradients
initiated in early childhood (Pillas et al., 2014). These latter mentioned results emphasize the
importance of an early prevention approach to tackle the observed social inequalities in
health.
A review reported an inverse association between parental education and adiposity in
children, and considered parental education a better determinant than parental income in
developed countries (Shrewsbury & Wardle, 2008). Studies have reported healthier dietary
habits and lower prevalence of overweight among groups with higher income, education or
occupational level compared to those with lower income, education or occupational level
(Darmon & Drewnowski, 2008; Drewnowski & Darmon, 2005). Unlike many western
countries, a higher percentage of obesity has been observed in children from high income
families living in low and middle - income countries (Dinsa, Goryakin, Fumagalli, &
Suhrcke, 2012; Mistry & Puthussery, 2015).
Family structure
Single parent household, small size families and rural setting are also socio-demographic
factors that have been associated with the risk of childhood overweight and obesity (Parsons,
Power, & Logan, 1999; Shrewsbury & Wardle, 2008).
Since the 1960´s, families have changed structure, function, and culture (Omran, 1971).
The number of divorces have increased, and remained at a high level in Norway
(Statistisk Sentralbyrå, 2015). Parental divorce is commonly accepted these days, but it is
found to have negative effect on children´s health (P. R. Amato & Keith, 1991; Thomas &
Högnäs, 2015). The nationally representative Norwegian Child Growth Study reported that
children of divorced parents had a 54% higher prevalence of general overweight (including
obesity) and 89% higher prevalence of abdominal obesity compared to children of married
parents (Biehl et al., 2014).
Studies have also reported a lower participation among children in organized sport among
children living in single parent households compared to those living in two parent households
(Gorely, Atkin, Biddle, & Marshall, 2009; McMillan, McIsaac, & Janssen, 2016).
Furthermore, children living in single-mother families seems to have a higher risk of being
overweight compared to those living in households with both parents (Gibson et al., 2007;
Strauss & Knight, 1999). Additionally, studies have shown that children with siblings are less
likely to be obese compared to those with no siblings (Chen & Escarce, 2010; Haugaard,
Ajslev, Zimmermann, Ängquist, & Sørensen, 2013). A Norwegian cross-sectional study have
also shown a higher prevalence of overweight and high WC among families living in rural
areas or in municipalities with low population density than those living in more urban areas
(Biehl et al., 2013; Heyerdahl, Aamodt, Nordhagen, & Hovengen, 2012) .
2.3.2 Dietary factors There has been an increase in the consumption of energy dense-foods and portion size over
the past 20 years (Nielsen, Siega-Riz, & Popkin, 2002). Several studies have suggested that
large portion size meals and energy dense snack may be one of the environmental influences
associated to excess energy intake (Hollands et al., 2015; Rolls, Roe, Kral, Meengs, & Wall,
2004). In general, few research studies have shown clear nutrient- or food based determinant
of overweight and obesity. The strongest evidence of increased risk of obesity are diets with a
high dietary fat or low fiber content (Jebb, 2007). A prospective cohort study over 12 years
among 74 091 US female nurses free of known cardiovascular disease, cancer and diabetes at
baseline, showed that those with the greatest increase in intake of dietary fiber gained an
average 1.52 kg less than did those with the smallest increase in intake of dietary fiber,
independent of bodyweight at baseline (Liu et al., 2003). Furthermore, women in the highest
quintile of dietary fiber intake had a 49% lower risk of major weight gain than did women in
the highest quintile (Liu et al., 2003). A systematic review estimated that free availability of
energy dense food in combination with intake of 14 g/day fiber for >2 days was associated
with a 10% decrease in energy intake and body weight loss of 1.9 kg over 3.8 months
(Howarth et al, 2001). The authors concluded that obese individuals may exhibit a greater
suppression of energy intake and body weigh loss compared to lean individuals (Howarth,
Saltzman, & Roberts, 2001). Thus, the Nordic Nutrition Recommendations efforts to increase
dietary fiber in individuals consuming >25 g/day may contribute to decrease the high
prevalence of obesity (Nordic Council of Ministers, 2014).
World Health Organization states that there is convinced evidence that fruit and vegetables
decrease the risk of obesity (World Health Organization, 2012). Therefore, WHO/FAO
consultation report recommends a mean intake of 400 gram fruit and vegetables per day to
prevent chronic diseases including obesity (World Health Organization, 2003). However, a
systematic review and meta-analysis reported that studies do not support that
recommendations to increase vegetables will cause weigh loss (Kaiser et al., 2014). A
A European cross-sectional study reported that adolescents in 9 European countries had a
mean energy intake of 1609 kj/day from beverages, where 30.4% comes from sugar
sweetened beverages, 20.7% from sweetened milk and 18.1% from fruit juice (Duffey et al.,
2012). The extensive prospective cohort studies, the Nurses´ Health Study I and II and the
Health Professionals Follow up- study showed that replacement of 1 serving per day of sugar
sweetened beverages by 1 cup per day of water was associated with 0.49 kg less weight gain
over each 4 year period, and the replacement of fruit juices by water was 0.35 kg (Pan et al.,
2013).
Several studies from Europe have demonstrated that children and adolescents diet is
influenced by parental intake and the availability of unhealthy foods and soft drinks in the
household (Gruber & Haldeman, 2009; Van Lippevelde et al., 2013; Vereecken, Haerens, De
Bourdeaudhuij, & Maes, 2010). Home availability might be influenced by educational
attainment, and a study from seven different European countries showed that soft drinks at
home was more frequently available for children aged 6-8 years with low educated mothers,
compared to those with high educated mothers (Mantziki et al., 2015). Several studies have
reported that home availability/accessibility of fruit and vegetables were positively associated
to the intake (Baranowski, Cullen, & Baranowski, 1999; Rasmussen et al., 2006). The impact
of food availability, however, is not only through home-environment, but also children and
adolescent’s social environment contributes to their choice of dietary intake (Briefel,
Crepinsek, Cabili, Wilson, & Gleason, 2009; Rahman, Cushing, & Jackson, 2011).
2.3.3 Sedentary behaviour and physical activity Physical activity is defined as any bodily movement produced by skeletal muscles that results
in energy expenditure (Caspersen, Powell, & Christenson, 1985).
Physical activity has a significant health benefit, and reduces the risk of developing non-
communicable diseases (NCD), such as coronary heart diseases, insulin -resistance and being
overweight (Sattelmair et al., 2011). In transitioning from childhood to adolescent the
physical activity levels is observed to decline, and the decline is greater among girls,
compared to boys (Brodersen, Steptoe, Boniface, & Wardle, 2007; Nader, Bradley, Houts,
McRitchie, & O’Brien, 2008; Riddoch et al., 2004). Globally, four out of five adolescents do
not meet the criteria of 60 minute physical activity per day (Hallal et al., 2012). Several
studies have demonstrated that daily TV watching is associated with reduced physical activity
levels (Marshall, Biddle, Gorely, Cameron, & Murdey, 2004; Stettler, Signer, & Suter, 2004).
Furthermore, encouraging children to spend time outdoor may be effective in increasing the
physical activity level (Cleland et al., 2008). In addressing the obesity epidemic, schools may
play a central role in promoting healthy living habits (Kaphingst, French, & Story, 2006). A
meta-analysis reviewing 43 studies on school-based interventions reported that interventions
with a physical activity component isolated and combined with healthier dietary habits was
associated with reduced BMI (Miller, 2011).
2.4 Consequences of overweight and obesity
2.4.1 Physical consequences Childhood obesity raises the risk of diseases, preconditions and complications relative to
cardiovascular, musculoskeletal, renal and gastrointestinal systems (Ebbeling et al., 2002).
Overweight and obesity are associated with a number of cardiovascular risk factors in
children and adolescents and further studies have shown that overweight and obesity increases
the risk of developing type 2 diabetes, hypertension, dyslipidaemia, metabolic syndrome and
obstructive sleep apnoea (Daniels et al., 2005). Furthermore, high blood glucose levels,
hypertension and abnormal blood lipid levels can result in premature heart disease, cancer and
adult diabetes (Llewellyn, Simmonds, Owen, & Woolacott, 2016).
2.4.2 Psychological consequences Psychological consequences of obesity are well documented. Obesity in children is associated
with lower self-esteem, and 34% of girls have reported lower self-esteem compared to their
non-obese peers (Strauss, 2000). A review study have described an inverse association
between BMI was reported and paediatric health related quality of life (HRQoL) and impaired
social and physical functioning (Fonseca, Matos, Guerra, & Gomes Pedro, 2009).
2.5 Preventive actions in reducing childhood overweight and obesity To address the high frequency of childhood obesity, a demand for preventive efforts and
interventions among overweight and obese children is needed. There are few previously
conducted programs that have been successful in the prevention of childhood obesity
(Kunnskapssenteret, 2012).
Due to the high rates of overweight and obesity the American Academy of Pediatrics, World
Health Organization (WHO) and the Center for Disease Control (CDC), have recommended
global screening by paediatricians for all children for the risk of overweight and obesity to
prevent disease (Krebs et al., 2007). In Norway, a reform in the national health care system
places more responsibility regarding early prevention and interventions in the course of
diseases on municipal health care institutions (Sosial- og helsedepartementet, 2009). Public
health nurses have been provided guidelines on measuring school – aged children´s height
and weight, in order to screen and monitor their BMI (Helsedirektoratet, 2010).
3.0 Objective The main objective of the family based quasi- controlled intervention study was to increase
physical activity level, decrease sitting-time, promote healthier dietary habits and a favourable
sleeping pattern. Secondarily objective was stabilisation in bodyweight.
In this master thesis, the main objective is to examine the association between the socio-
demographic factors living arrangements and parental education and the availability and
intake of selected food items and total energy intake and macronutrient intake, using the
baseline data from the family based quasi- controlled intervention study.
4.0 Method
4.1 Study design The Norwegian Directory of Health provided new guidelines in 2010 (Helsedirektoratet,
2010). Placing more responsibility on the municipalities to establish “Healthy Living Centres”
(HLCs) to facilitate the adoption of healthy living among all age groups, and to cooperate
with universities for professional development and research (Helsedirektoratet., 2013).
Following this, this cross – sectional study is part of the on-going intervention study
“Frisklivsstudien barn” (FSB) to further explore the main objective of this study.
4.2 Recruitment and study population According to the national clinical guideline, public health nurses are instructed to measure
height and weight of all preschool children and children in 3rd and 8th grade
(Helsedirektoratet, 2010). The participating overweight and obese children, aged 6-10 years
have been recruited through the standardized measurement periods that are initialized in 1st
and 3rd grade. BMI was calculated from height and weight measures according to IOTF´s age
and gender specific cut-off points (T. J. Cole et al., 2000). Parents to children with iso-BMI
≥25kg/m2 received both oral and written information on the FSB study from school nurses
during the recruitment process.
A total of 151 children aged 6-10 years from west, east-and south Norway are included in this
study. Healthy Life Centres (HLCs) and Public Health Clinics (PHCs) in the municipalities
Bergen, Sola, Sandnes, Stavanger, Søgne, Kristiansand (three districts) and Oslo (two
different districts) have participated in the study, and data has been collected by trained health
professionals at the participating HLCs and PHCs
4.3 Data collection methods Data was collected over a period from September to October 2015, April to May 2016, and
September to October 2016. Data collection was conducted in that time period to avoid
possible seasonal variations in dietary intake. When parental consent was given for the child
to participate, the parents of the children included in the FSB study filled out a web-based
frequency questionnaire (appendix 1) providing information on children´s physical activity
and dietary habits. Participants were given a personal identification-number that was used
during all parts of the data collection period. Baseline data from all the participants have been
used in this master thesis, providing information on their children´s lifestyle behaviours as
well as basic demographic and socio-economic variables (e.g. sex, age, living arrangement
and educational attainment).
4.3.1 Questionnaire Only a selection of the questions from FSB´s frequency questionnaire was used for analysis in
this master thesis.
Information regarding intake of food items and beverage was assessed with the question: How
often does your child consume the selected food item? Seven response alternatives were
given; never, 1–3 times per month, once a week, 2–3 times per week, 4–6 times per week,
once or more times a day. And for the consumption of beverages the intervals range were
never, 1–3 glasses per month, 1 glass per week, 2–6 glasses per week, 1 glass per day, 2–3
glasses per day and more than 3 glasses per day. Based on registered frequency of food and
beverage intake, the intake (gram/day) of selected food groups was calculated. Further, it was
calculated total energy intake and the intake of energy from macronutrient (E%) using
FoodCalc and the Norwegian food composition table (Øverby, Johannesen, Jensen,
Skjaevesland, & Haugen, 2014).
Parental education level was assessed with the question: What level of education do you have,
answer for yourself and your partner. The question had six response alternatives, each for
yourself and your partner; (1) elementary school <7 years, (2) elementary school 7 – 10
years, (3) vocational school or high school <3 years, (4) high school – 3 years, (5) 3 years of
high school, (6) college or university ≤4 years, (7) colleges or university ≥4 years. These
response alternatives were then dichotomized into low degree of education (3 years of high
school or less) and high degree of education (college or university ≥4 years).
Information regarding living arrangement was assessed with the question: Which adults does
your child live with? Seven response alternatives was given; (1) both mother and father all
the time, (2) with the mother, (3) with the father, (4) with the mother and her new partner, (5)
with the father and his new partner, (6) grandparents, (7) others. The response alternatives
were then dichotomized into one parent household or two- parent household.
4.4 Statistical analysis In this part of the master thesis descriptive statistics was used to determine the percentage of
overweight and obese children participating in the study, and to determine the percentage of
children living in single and dual parent households. Further, statistical analysis were
performed with independent sample t-test of the two independent groups, assessing children´s
total energy intake, and nutrient macronutrient intake (E%) relative to high or low parental
education and children living in single or dual-parent household. Furthermore, independent
sample t-test was used to compare means of the variables intake and availability of selected
food items and beverages. For all analysis p-values <0.05 was considered as statistically
significant. Data collected from the frequency questionnaire was transmitted to Survey Exact.
All statistical analyses were carried out using the statistical software IBM SPSS version 22
(IBM Corp, 2013).
4.4.1 Variables BMI categories
Height, weight and BMI and iso-BMI are variables used in this study. Trained public health
nurses measured height and weight of all participants in the study, and the children were
weighted wearing light clothing. The BMI (kg/m2) of each child was calculated on the basis
of the height and weight measured, and the child´s BMI were further calculated using
International Obesity Task Force sex and age-specific cut-off points (T. J. Cole et al., 2000).
4.5 Test retest
4.5.1 Study design In addition to examining the association between dietary habits and socioeconomic factors in
this master thesis, a reliability- test, intra- class correlation (ICC) was performed. This
questions availability of selected food items and beverages, parental education and living
arrangements was reliability tested. ICC accounts for the variation in and between the
individual answer to the different questions, and is an appropriate test for examining the
stability between test and retest with regard to intake of selected food items (Wong, Parnell,
Black, & Skidmore, 2012).
4.5.2 Recruitment and study population Leading school nurses in six municipalities (centred in east of Norway) received a mail,
providing information of the test-retest study, following a phone call and additional written
information about the study. Two municipalities agreed to participate, resulting in 5
participating schools. The main reason why leading school nurses did not want to participate
was lack of recourses and too many assigned tasks. Multiple municipalities were already
participating in other local research programs, and did not want to involve parents, children
and school nurses into further studies. The school nurse recruited 41 children aged 6-10 years
from the standardized measurement periods. Parents were given oral and written information
about the study, and written consent was obtained from the parents prior to participation in the
present test-retest study.
4.5.3 Data collection methods The test-retest questionnaire contained 11 items derived from the FSB questionnaire
(appendix 2), and the data collection took place in 2014/2015. When parental consent was
given, the parents of the children received a mail with a link to the web-based frequency
questionnaire, with 14 days between each test. The school nurse measured height and weight
of the children and coded them with the same identification numbers they were given in the
questionnaire. In total, written consent to participate was given for 98 children. 34 did not fill
out the questionnaire and 14 participants only finished the first test. Amongst the 14, 5
reported having trouble with the second test and withdrew from the study and 9 participants
did not completely fill out test 1 or 2.
4.5.4 Questionnaire To test the reliability of the questions used in this study, a test-retest was performed, including
questions relative to socioeconomic factors and the availability of food items and beverages.
The questions regarding intake of selected food items and beverages have been validated prior
to this study (N. C. Øverby et al., 2014). Information regarding availability of candy, salty
snack, diet-soda, sugar-sweetened soda and fruits was assessed with the question: How often
are the selected food item/beverage available? Ten response alternatives was given; never,
less than once a month, less than once a week, once a week, two times a week.. seven days a
week. In the statistical analysis they were scored 0, 0.1, 0.5, 1, 2, 3 .. 7 every day. The
response alternatives were then dichotomized into every day (7 days a week) or not every day.
Further, the questions regarding socioeconomic factors are described in 3.3.1.
4.5.5 Statistical analysis A to-way intraclass-correlation coefficient (ICC) was performed to test the correlation
between the individual questions used in the frequency questionnaire. To test the for statistic
significance 95% confidence interval was used. ICC is classified as very good (>0.81), good
(0.61-0.80), moderate (0.41-0.60) and poor (<0.40).
5.0 Results
5.1 “Frisklivsstudien barn” A total of 151 children, 85 girls and 66 boys, were included in this study. Mean iso-BMI
amongst the children was 23.7, where 33.7% are classified overweight (n=51) and 66.3%
(n=100) are classified obese. 57.0 % of the children lived in dual-parent households with both
parents, 17,4 % lived with their mothers, 9.0% with their mother and her new partner, 0.6%
with their father and his new partner and 16.0% of the children lived part time with both
parents.

Differences in total energy intake and percentage contribution of energy from macronutrients
in the diet of children with high-educated parents compared with those with low-educated
parents were not significant (table 1 and 2).
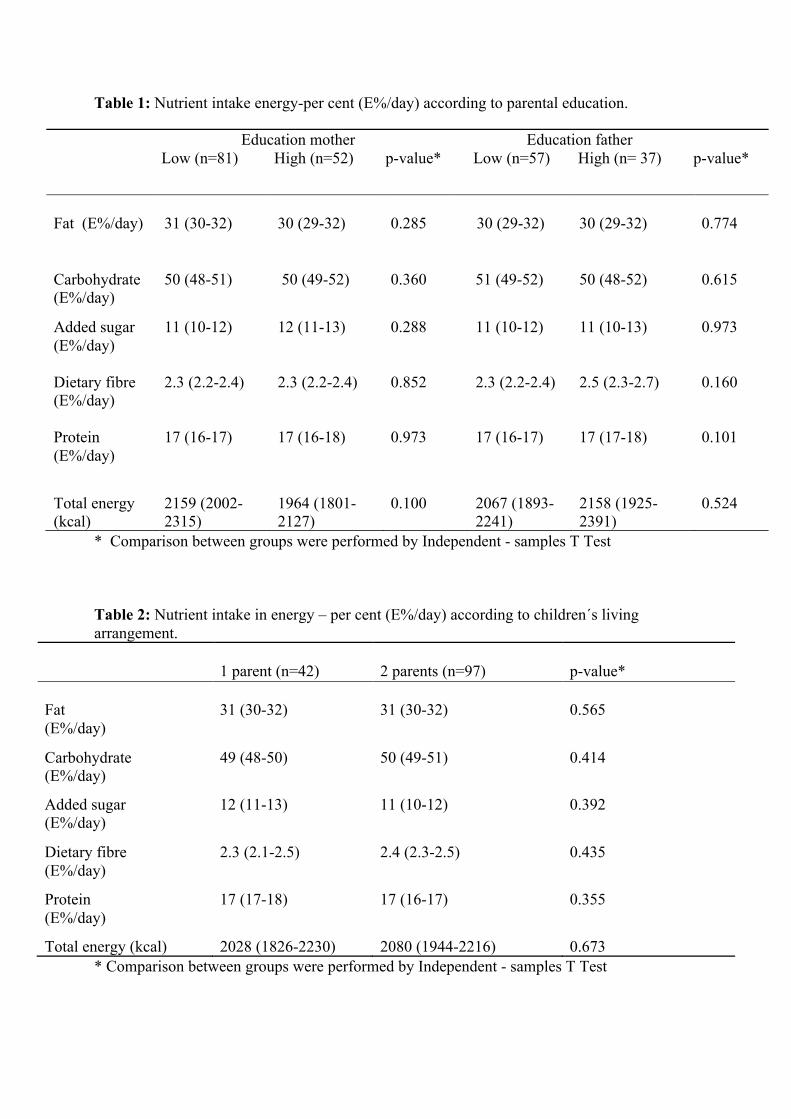
Table 1: Nutrient intake energy-per cent (E%/day) according to parental education.
* Comparison between groups were performed by Independent - samples T Test Table 2: Nutrient intake in energy – per cent (E%/day) according to children´s living arrangement.
1 parent (n=42)
2 parents (n=97)
p-value*
Fat (E%/day)
31 (30-32)
31 (30-32)
0.565
Carbohydrate (E%/day)
49 (48-50) 50 (49-51) 0.414
Added sugar (E%/day)
12 (11-13) 11 (10-12) 0.392
Dietary fibre (E%/day)
2.3 (2.1-2.5) 2.4 (2.3-2.5) 0.435
Protein (E%/day)
17 (17-18) 17 (16-17) 0.355
Total energy (kcal) 2028 (1826-2230) 2080 (1944-2216) 0.673 * Comparison between groups were performed by Independent - samples T Test
Education mother Education father Low (n=81) High (n=52) p-value* Low (n=57) High (n= 37) p-value*
Fat (E%/day)
31 (30-32)
30 (29-32)
0.285
30 (29-32)
30 (29-32)
0.774
Carbohydrate (E%/day)
50 (48-51) 50 (49-52) 0.360 51 (49-52) 50 (48-52) 0.615
Added sugar (E%/day)
11 (10-12) 12 (11-13) 0.288 11 (10-12) 11 (10-13) 0.973
Dietary fibre (E%/day)
2.3 (2.2-2.4)
2.3 (2.2-2.4)
0.852
2.3 (2.2-2.4)
2.5 (2.3-2.7)
0.160
Protein (E%/day)
17 (16-17)
17 (16-18)
0.973
17 (16-17)
17 (17-18)
0.101
Total energy (kcal)
2159 (2002-2315)
1964 (1801-2127)
0.100
2067 (1893-2241)
2158 (1925-2391)
0.524
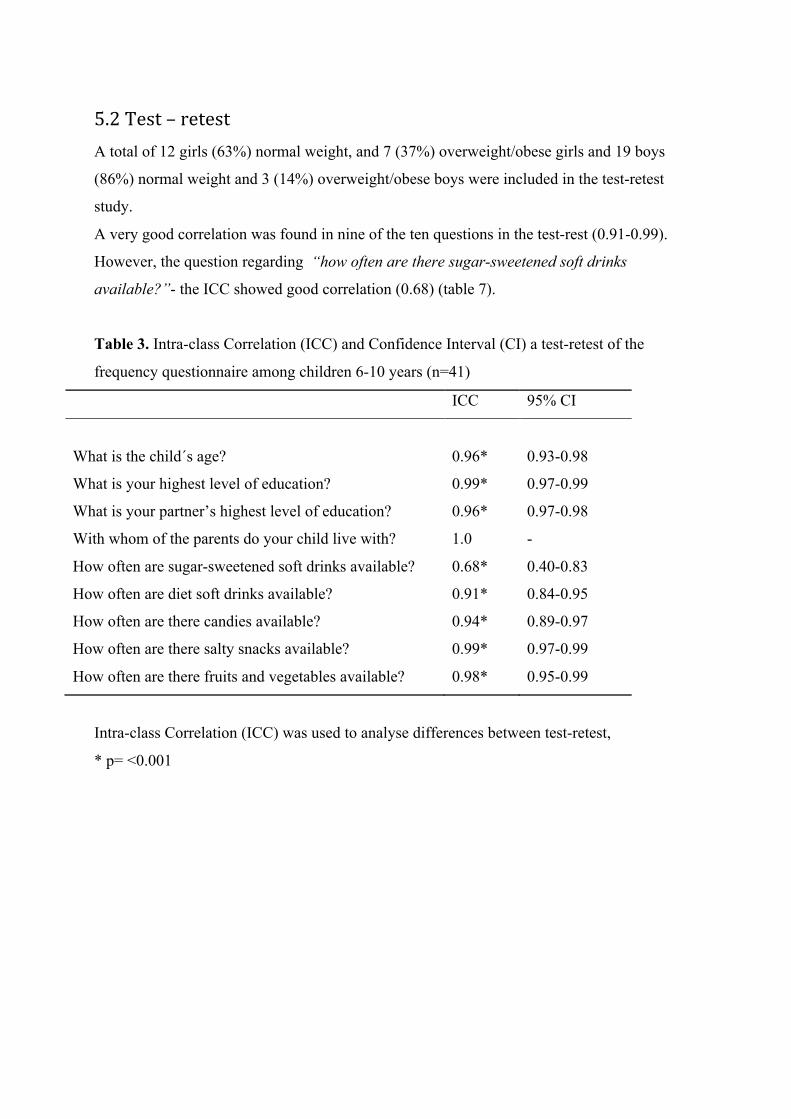
5.2 Test – retest A total of 12 girls (63%) normal weight, and 7 (37%) overweight/obese girls and 19 boys
(86%) normal weight and 3 (14%) overweight/obese boys were included in the test-retest
study.
A very good correlation was found in nine of the ten questions in the test-rest (0.91-0.99).
However, the question regarding “how often are there sugar-sweetened soft drinks
available?”- the ICC showed good correlation (0.68) (table 7).
Table 3. Intra-class Correlation (ICC) and Confidence Interval (CI) a test-retest of the
frequency questionnaire among children 6-10 years (n=41)
ICC 95% CI
What is the child´s age?
0.96*
0.93-0.98
What is your highest level of education? 0.99* 0.97-0.99
What is your partner’s highest level of education? 0.96* 0.97-0.98
With whom of the parents do your child live with? 1.0 -
How often are sugar-sweetened soft drinks available? 0.68* 0.40-0.83
How often are diet soft drinks available? 0.91* 0.84-0.95
How often are there candies available? 0.94* 0.89-0.97
How often are there salty snacks available? 0.99* 0.97-0.99
How often are there fruits and vegetables available? 0.98* 0.95-0.99
Intra-class Correlation (ICC) was used to analyse differences between test-retest,
* p= <0.001
6.0 Discussion
6.1 “Frisklivsstudien barn”
The results from the present study showed no difference in energy intake between those with
high and low educated parents and between those living with one or two parent’s household.
To our knowledge, no other studies have examined the energy intake of overweight and obese
children according to parental education and living arrangements. One longitudinal study,
however, found dietary inequalities related to maternal educational attainment that may
influence inequalities found in obesity development (Emmett & Jones, 2015). In addition, low
educational attainment have ben associated with higher scores on processed energy dense
patterns in both parents and children regardless of weight status (Emmett, Jones &
Northstone, 2015). A study by Shrewsbury & Wardle (2008) has shown that low SES children
have an increased risk of overweight and obesity in addition to having poorer dietary habits.
This is consistent with other observation reported in Norway (Øverby, Stea, Vik, Klepp, &
Bere, 2011). However, no significant difference was found between the groups, which may
highlight the need for future interventions focusing on overweight and obese children´s
dietary habits in relation to their living arrangements and parental education.
The majority of the overweight and obese children in this study lived in dual parent
household. This is contrary to other findings, where children living in single-mother families
have been found to have a greater risk of being overweight compared to those living in
households with both parents (Gibson et al., 2007; Strauss & Knight, 1999). The findings in
the present study suggests that childhood overweight and obesity does not vary between
single-parent households and dual-parent household in major parts of Norway, with respect to
the overweight and obese children. This might further be explained with the minor difference
between high and low SES in Norway.
The present study has both strengths and limitations. First, trained public health nurses have
been responsible for the measuring of height and weight of the children, and the BMI
categorization is performed following IOTF´s criteria (T. J. Cole et al., 2000). This is a major
strength in this cross-sectional study. Further, the distribution of girls and boys are relatively
equal distributed and age differences are minimal, which in the present study gives a good
comparative basis. Data is collected in west, east and south regions of Norway and the
recruitment process has been conducted to cover a major part of the country. In addition, the
data was collected during a short time period, September-October, April- May, which is
assumed to minimize possible seasonal variations in dietary intake (Ma et al., 2006).
This study has limitations. First, the study population consists only of relatively low number
overweight of and obese children, which limited the possibilities of statistical analysis.
Another limitation is the use of self-reported questionnaire. The use of self-reported data may
represent response bias when reporting dietary intake- and habits (Bandini et al., 2003).
Under-reporting of energy- and food intake is a well-established bias in both normal-weight
and overweight individuals (Bandini, Schoeller, Cyr, & Dietz, 1990; Lobstein et al., 2004).
Also, over-reporting is common in overweight and normal weight individuals, where subjects
report healthier dietary habits (Johansson, Solvoll, Bjørneboe, & Drevon, 1998). The lack of
information of parental BMI is a further limitation in this study. The risk of becoming
overweight or obese during childhood increases with parental overweight or obesity
(Danielzik, Langnäse, Mast, Spethmann, & Müller, 2002). It is therefore important to
highlight this as the results may be confounded by parental weight status.
Finally, the present study has a cross-sectional design, which does not allow or causal
inference. Therefore, the results from this study cannot illuminate the mechanisms that link
parental education level and living arrangements and the availability and intake of selected
food items. However, cross- sectional studies are time saving and more cost efficient than
longitudinal studies, and may therefore also contribute with valuable information.
6.2 Test – retest The frequency questionnaire containing question relative to intake of selected food items and
beverages was validated prior to the study (Øverby et al., 2014), however, questions regarding
the socioeconomic factors living arrangements and parental education, and question regarding
the home availability of selected food items and beverages were not. Thus, these questions
were reliability tested, and the results showed good/very good test-retest reliability. This is
indeed positive with regard to the questions used from the FSB questionnaire, and a major
strength in this cross-sectional study.
Further, the distribution of participants is geographically spread and represents both rural and
urban settings. Trained public health nurses have measured the children´s height and weight,
and the categorization of BMI is performed following international BMI cut-offs (T. J. Cole et
al., 2000). Another strength is the 14 days interval between the questionnaires. This gives the
participants limited time to change dietary habits (Metcalf et al., 2003) and minimizes recall
bias (Cook & Beckman, 2006). Test-retest is often used to measure reliability of self-reported
questionnaires (Cook & Beckman, 2006), and it is a cost efficient way to secure the quality of
the questionnaire (Wong et al., 2012).
However, a limitation is that the total sample participating in the test-retest is a relatively
small (n=41), and consisted of both normal weight and overweight/obese children.
7.0 Ethnical Considerations The children´s parents have filled out the frequency questionnaire, and therefore provided this
master thesis with valuable data. The parents are responsible for accepting to participate on
behalf of their child, and the participants were informed that they could drop out of the study
at any time. Regional Committee of Ethics approves the interventions study and informed
written consent is obtained from the parents of the children. It is also obtained written consent
from the participants in the test-retest study, and Regional Committee of Ethics approved the
questions used in the test-retest questionnaire prior to the test-retest study.
8.0 Conclusion In order to work on preventive strategies addressing overweight and obesity among children,
detecting all the determinants and more research and effective interventions are needed in
tackling inequalities in health. It is therefore necessary to strengthen the knowledge about the
prevalence of adiposity and its distribution among children.
Different methodological approaches in research are important to document individual as well
as social causes of obesity (Oellingrath, Hersleth, & Svendsen, 2013).
9.0 References
Amato, M. C., Guarnotta, V., & Giordano, C. (2013). Body composition assessment for the definition of cardiometabolic risk. Journal of Endocrinological Investigation, 36(7), 537-543.
Amato, P. R., & Keith, B. (1991). Parental divorce and the well-being of children: a meta-analysis. Psychological bulletin, 110(1), 26.
Ashwell, M., & Hsieh, S. D. (2005). Six reasons why the waist-to-height ratio is a rapid and effective global indicator for health risks of obesity and how its use could simplify the international public health message on obesity. International journal of food sciences and nutrition, 56(5), 303-307.
Bandini, L. G., Must, A., Cyr, H., Anderson, S. E., Spadano, J. L., & Dietz, W. H. (2003). Longitudinal changes in the accuracy of reported energy intake in girls 10–15 y of age. The American journal of clinical nutrition, 78(3), 480-484.
Bandini, L. G., Schoeller, D. A., Cyr, H. N., & Dietz, W. H. (1990). Validity of reported energy intake in obese and nonobese adolescents. The American journal of clinical nutrition, 52(3), 421-425.
Baranowski, T., Cullen, K. W., & Baranowski, J. (1999). Psychosocial correlates of dietary intake: advancing dietary intervention. Annual review of nutrition, 19(1), 17-40.
Bass, R., & Eneli, I. (2015). Severe childhood obesity: an under-recognised and growing health problem. Postgraduate medical journal, postgradmedj-2014-133033.
Bastien, M., Poirier, P., Lemieux, I., & Després, J.-P. (2014). Overview of epidemiology and contribution of obesity to cardiovascular disease. Progress in Cardiovascular Diseases, 56(4), 369-381.
Bhan, M. K., & Norum, K. R. (2004). The WHO multicentre growth reference study (MGRS): Rationale, planning, and implementation. Food and nutrition bulletin, 25(1 supplement 1).
Biehl, A., Hovengen, R., Grøholt, E.-K., Hjelmesæth, J., Strand, B. H., & Meyer, H. E. (2013). Adiposity among children in Norway by urbanity and maternal education: a nationally representative study. BMC public health, 13(1), 842.
Biehl, A., Hovengen, R., Grøholt, E.-K., Hjelmesæth, J., Strand, B. H., & Meyer, H. E. (2014). Parental marital status and childhood overweight and obesity in Norway: a nationally representative cross-sectional study. BMJ open, 4(6), e004502.
Briefel, R. R., Crepinsek, M. K., Cabili, C., Wilson, A., & Gleason, P. M. (2009). School food environments and practices affect dietary behaviors of US public school children. Journal of the American Dietetic Association, 109(2), S91-S107.
Brodersen, N. H., Steptoe, A., Boniface, D. R., & Wardle, J. (2007). Trends in physical activity and sedentary behaviour in adolescence: ethnic and socioeconomic differences. British journal of sports medicine, 41(3), 140-144.
Caspersen, C. J., Powell, K. E., & Christenson, G. M. (1985). Physical activity, exercise, and physical fitness: definitions and distinctions for health-related research. Public health reports, 100(2), 126.
Cattaneo, A., Monasta, L., Stamatakis, E., Lioret, S., Castetbon, K., Frenken, F., . . . Zaborskis, A. (2010). Overweight and obesity in infants and pre‐school children in the European Union: a review of existing data. Obesity reviews, 11(5), 389-398.
Chen, A. Y., & Escarce, J. J. (2010). Peer Reviewed: Family Structure and Childhood Obesity, Early Childhood Longitudinal Study—Kindergarten Cohort. Preventing chronic disease, 7(3).
Cleland, V., Crawford, D., Baur, L. A., Hume, C., Timperio, A., & Salmon, J. (2008). A prospective examination of children's time spent outdoors, objectively measured physical activity and overweight. International journal of obesity, 32(11), 1685-1693.
Cole, T., & Lobstein, T. (2012). Extended international (IOTF) body mass index cut‐offs for thinness, overweight and obesity. Pediatric obesity, 7(4), 284-294.
Cole, T. J., Bellizzi, M. C., Flegal, K. M., & Dietz, W. H. (2000). Establishing a standard definition for child overweight and obesity worldwide: international survey. Bmj, 320(7244), 1240.
Cook, D. A., & Beckman, T. J. (2006). Current concepts in validity and reliability for psychometric instruments: theory and application. The American journal of medicine, 119(2), 166. e167-166. e116.
Cornier, M.-A., Després, J.-P., Davis, N., Grossniklaus, D. A., Klein, S., Lamarche, B., . . . Towfighi, A. (2011). Assessing adiposity a scientific statement from the American Heart Association. Circulation, 124(18), 1996-2019.
Dahl, E., Bergsli, H., & Van der Wel, K. A. (2014). Sosial ulikhet i helse: En norsk kunnskapsoversikt. Oslo: Høgskolen i Oslo og Akershus.
Daniels, S. R., Arnett, D. K., Eckel, R. H., Gidding, S. S., Hayman, L. L., Kumanyika, S., . . . Williams, C. L. (2005). Overweight in children and adolescents pathophysiology, consequences, prevention, and treatment. Circulation, 111(15), 1999-2012.
Danielzik, S., Langnäse, K., Mast, M., Spethmann, C., & Müller, M. J. (2002). Impact of parental BMI on the manifestation of overweight 5–7 year old children. European journal of nutrition, 41(3), 132-138.
Darmon, N., & Drewnowski, A. (2008). Does social class predict diet quality? The American journal of clinical nutrition, 87(5), 1107-1117.
Davison, K. K., & Birch, L. L. (2001). Childhood overweight: a contextual model and recommendations for future research. Obesity reviews, 2(3), 159-171.
De Lorenzo, A., Bianchi, A., Maroni, P., Iannarelli, A., Di Daniele, N., Iacopino, L., & Di Renzo, L. (2013). Adiposity rather than BMI determines metabolic risk. International journal of cardiology, 166(1), 111-117.
de Onis, M. (2006). WHO child growth standards: length/height-for-age, weight-for-age, weight-for-length, weight-for-height and body mass index-for-age: WHO.
De Onis, M., Blössner, M., & Borghi, E. (2010). Global prevalence and trends of overweight and obesity among preschool children. The American journal of clinical nutrition, 92(5), 1257-1264.
de Onis, M., Onyango, A. W., Van den Broeck, J., & Chumlea, W. C. (2004). Measurement and standardization protocols for anthropometry used in the construction of a new international growth reference. Food Nutr Bull, 25(1 Suppl), S27-36.
Dinsa, G., Goryakin, Y., Fumagalli, E., & Suhrcke, M. (2012). Obesity and socioeconomic status in developing countries: a systematic review. Obesity reviews, 13(11), 1067-1079.
Drewnowski, A., & Darmon, N. (2005). The economics of obesity: dietary energy density and energy cost. The American journal of clinical nutrition, 82(1), 265S-273S.
Duffey, K. J., Huybrechts, I., Mouratidou, T., Libuda, L., Kersting, M., De Vriendt, T., . . . Hallström, L. (2012). Beverage consumption among European adolescents in the HELENA study. European journal of clinical nutrition, 66(2), 244-252.
Ebbeling, C. B., Pawlak, D. B., & Ludwig, D. S. (2002). Childhood obesity: public-health crisis, common sense cure. The lancet, 360(9331), 473-482.
Emmett, P. M., & Jones, L. R. (2015). Diet, growth, and obesity development throughout childhood in the Avon longitudinal study of parents and children. Nutrition reviews, 73(suppl 3), 175-206.
Emmett, P. M., Jones, L. R., & Northstone, K. (2015). Dietary patterns in the Avon Longitudinal Study of Parents and Children. Nutrition reviews, 73(suppl 3), 207-230.
Fernández, J. R., Redden, D. T., Pietrobelli, A., & Allison, D. B. (2004). Waist circumference percentiles in nationally representative samples of African-American, European-American, and Mexican-American children and adolescents. The Journal of pediatrics, 145(4), 439-444.
Fonseca, H., Matos, M. G., Guerra, A., & Gomes Pedro, J. (2009). Are overweight and obese adolescents different from their peers? International Journal of Pediatric Obesity, 4(3), 166-174.
Freedman, D. S., Serdula, M. K., Srinivasan, S. R., & Berenson, G. S. (1999). Relation of circumferences and skinfold thicknesses to lipid and insulin concentrations in children and adolescents: the Bogalusa Heart Study. The American journal of clinical nutrition, 69(2), 308-317.
Galobardes, B., Lynch, J., & Smith, G. D. (2007). Measuring socioeconomic position in health research. British medical bulletin, 81(1), 21-37.
Gibson, L. Y., Byrne, S. M., Davis, E. A., Blair, E., Jacoby, P., & Zubrick, S. R. (2007). The role of family and maternal factors in childhood obesity. Medical Journal of Australia, 186(11), 591.
Gorely, T., Atkin, A. J., Biddle, S. J., & Marshall, S. J. (2009). Family circumstance, sedentary behaviour and physical activity in adolescents living in England: Project STIL. International Journal of Behavioral Nutrition and Physical Activity, 6(1), 33.
Gruber, K. J., & Haldeman, L. A. (2009). Peer Reviewed: Using the Family to Combat Childhood and Adult Obesity. Preventing chronic disease, 6(3).
Gupta, N., Goel, K., Shah, P., & Misra, A. (2012). Childhood obesity in developing countries: epidemiology, determinants, and prevention. Endocrine Reviews, 33(1), 48-70.
Hall, D., & Cole, T. (2006). What use is the BMI? Archives of disease in childhood, 91(4), 283-286.
Hallal, P. C., Andersen, L. B., Bull, F. C., Guthold, R., Haskell, W., Ekelund, U., & Group, L. P. A. S. W. (2012). Global physical activity levels: surveillance progress, pitfalls, and prospects. The lancet, 380(9838), 247-257.
Han, J. C., Lawlor, D. A., & Kimm, S. Y. (2010). Childhood obesity. The lancet, 375(9727), 1737-1748.
Haugaard, L. K., Ajslev, T. A., Zimmermann, E., Ängquist, L., & Sørensen, T. I. (2013). Being an only or last-born child increases later risk of obesity. PloS one, 8(2), e56357.
Helsedirektoratet. (2010). Nasjonale faglige retningslinjer for primærhelsetjenesten. Forebyggning og behandling av overvekt og fedme hos barn. Oslo: Helsedirektoratet.
Helsedirektoratet. (2013). Nasjonale mål og prioriterte områder for 2013. Oslo: Helsedirektoratet.
Heyerdahl, N., Aamodt, G., Nordhagen, R., & Hovengen, R. (2012). [Overweight children--how important is the urban/rural factor?]. Tidsskrift for den Norske laegeforening: tidsskrift for praktisk medicin, ny raekke, 132(9), 1080-1083.
Hollands, G. J., Shemilt, I., Marteau, T. M., Jebb, S. A., Lewis, H. B., Wei, Y., . . . Ogilvie, D. (2015). Portion, package or tableware size for changing selection and consumption of food, alcohol and tobacco. Cochrane Database Syst Rev, 9.
Hovengen, R., Bøhler, L., & Biehl, A. (2016). Barn, miljø og helse. Risiko- og helsefremmende faktorer. Oslo
Howarth, N. C., Saltzman, E., & Roberts, S. B. (2001). Dietary fiber and weight regulation. Nutrition reviews, 59(5), 129-139.
Hui, L., Schooling, C., Cowling, B., Leung, S., Lam, T., & Leung, G. (2008). Are universal standards for optimal infant growth appropriate? Evidence from a Hong Kong Chinese birth cohort. Archives of disease in childhood, 93(7), 561-565.
IBM Corp. (2013). IBM SPSS Statistics for Macintosh, Version 22: IBM Corp, Armonk, NY. Inoue, S., Zimmet, P., Caterson, I., Chunming, C., Ikeda, Y., & Khalid, A. (2000). WHO
Western Pacific Region. The Asia-Pacific perspective: redefining obesity and its treatment. Health Communications Australia.
James, W. T., Nelson, M., Ralph, A., & Leather, S. (1997). Socioeconomic determinants of health. The contribution of nutrition to inequalities in health. BMJ: British Medical Journal, 314(7093), 1545.
Javed, A., Jumean, M., Murad, M. H., Okorodudu, D., Kumar, S., Somers, V., . . . Lopez‐Jimenez, F. (2015). Diagnostic performance of body mass index to identify obesity as defined by body adiposity in children and adolescents: a systematic review and meta‐analysis. Pediatric obesity, 10(3), 234-244.
Jebb, S. (2007). Dietary determinants of obesity. Obesity reviews, 8(s1), 93-97. Johansson, L., Solvoll, K., Bjørneboe, G.-E., & Drevon, C. A. (1998). Under-and
overreporting of energy intake related to weight status and lifestyle in a nationwide sample. The American journal of clinical nutrition, 68(2), 266-274.
Júlíusson, P. B., Roelants, M., Hoppenbrouwers, K., Hauspie, R., & Bjerknes, R. (2011). Growth of Belgian and Norwegian children compared to the WHO growth standards: prevalence below− 2 and above+ 2 SD and the effect of breastfeeding. Archives of disease in childhood, 96(10), 916-921.
Kaiser, K. A., Brown, A. W., Brown, M. M. B., Shikany, J. M., Mattes, R. D., & Allison, D. B. (2014). Increased fruit and vegetable intake has no discernible effect on weight loss: a systematic review and meta-analysis. The American journal of clinical nutrition, 100(2), 567-576.
Kaphingst, K. M., French, S., & Story, M. (2006). The role of schools in obesity prevention. The Future of Children, 16(1), 109-142.
Karnik, S., & Kanekar, A. (2015). Childhood obesity: a global public health crisis. Krebs, N. F., Himes, J. H., Jacobson, D., Nicklas, T. A., Guilday, P., & Styne, D. (2007).
Assessment of child and adolescent overweight and obesity. Pediatrics, 120(Supplement 4), S193-S228.
Kunnskapssenteret. (2012). Systematisk oversikt over effekten av helsefremmende og forebyggende tiltak på kosthold, fysisk aktivitet, overvekt og seksuell helse hos barn og unge. Oslo.
Lahti-Koski, M., & Gill, T. (2004). Defining childhood obesity. Liu, S., Willett, W. C., Manson, J. E., Hu, F. B., Rosner, B., & Colditz, G. (2003). Relation
between changes in intakes of dietary fiber and grain products and changes in weight and development of obesity among middle-aged women. The American journal of clinical nutrition, 78(5), 920-927.
Llewellyn, A., Simmonds, M., Owen, C., & Woolacott, N. (2016). Childhood obesity as a predictor of morbidity in adulthood: a systematic review and meta‐analysis. Obesity reviews, 17(1), 56-67.
Lobstein, T., Baur, L., & Uauy, R. (2004). Obesity in children and young people: a crisis in public health. Obesity reviews, 5(s1), 4-85.
Lobstein, T., Jackson-Leach, R., Moodie, M. L., Hall, K. D., Gortmaker, S. L., Swinburn, B. A., . . . McPherson, K. (2015). Child and adolescent obesity: part of a bigger picture. The lancet.
Low, S., Chin, M. C., & Deurenberg-Yap, M. (2009). Review on epidemic of obesity. Annals Academy of Medicine Singapore, 38(1), 57.
Ma, Y., Olendzki, B. C., Li, W., Hafner, A. R., Chiriboga, D., Hebert, J. R., . . . Ockene, I. S. (2006). Seasonal variation in food intake, physical activity, and body weight in a predominantly overweight population. European journal of clinical nutrition, 60(4), 519-528.
Mackenbach, J. P., Stirbu, I., Roskam, A.-J. R., Schaap, M. M., Menvielle, G., Leinsalu, M., & Kunst, A. E. (2008). Socioeconomic inequalities in health in 22 European countries. New England Journal of Medicine, 358(23), 2468-2481.
Mantziki, K., Vassilopoulos, A., Radulian, G., Borys, J.-M., Du Plessis, H., Gregório, M. J., . . . Visscher, T. L. (2015). Inequities in energy-balance related behaviours and family environmental determinants in European children: baseline results of the prospective EPHE evaluation study. BMC public health, 15(1), 1.
Marmot, M., & Bell, R. (2012). Fair society, healthy lives. Public Health, 126, S4-S10. Marshall, S. J., Biddle, S. J., Gorely, T., Cameron, N., & Murdey, I. (2004). Relationships
between media use, body fatness and physical activity in children and youth: a meta-analysis. International journal of obesity, 28(10), 1238-1246.
McCarthy, H. D., & Ashwell, M. (2006). A study of central fatness using waist-to-height ratios in UK children and adolescents over two decades supports the simple message–‘keep your waist circumference to less than half your height’. International journal of obesity, 30(6), 988-992
McMillan, R., McIsaac, M., & Janssen, I. (2016). Family Structure as a Correlate of Organized Sport Participation among Youth. PloS one, 11(2), e0147403.
Metcalf, P., Scragg, R., Sharpe, S., Fitzgerald, E., Schaaf, D., & Watts, C. (2003). Short-term repeatability of a food frequency questionnaire in New Zealand children aged 1–14 y. European journal of clinical nutrition, 57(11), 1498-1503.
Miller, D. P. (2011). Associations between the home and school environments and child body mass index. Social Science & Medicine, 72(5), 677-684.
Mistry, S., & Puthussery, S. (2015). Risk factors of overweight and obesity in childhood and adolescence in South Asian countries: a systematic review of the evidence. Public Health, 129(3), 200-209.
Monteiro, C. A., Moura, E. C., Conde, W. L., & Popkin, B. M. (2004). Socioeconomic status and obesity in adult populations of developing countries: a review. Bulletin of the World Health Organization, 82(12), 940-946.
Müller-Riemenschneider, F., Reinhold, T., Berghöfer, A., & Willich, S. N. (2008). Health-economic burden of obesity in Europe. European journal of epidemiology, 23(8), 499-509.
Nader, P. R., Bradley, R. H., Houts, R. M., McRitchie, S. L., & O’Brien, M. (2008). Moderate-to-vigorous physical activity from ages 9 to 15 years. Jama, 300(3), 295-305.
Ng, M., Fleming, T., Robinson, M., Thomson, B., Graetz, N., Margono, C., . . . Abera, S. F. (2014). Global, regional, and national prevalence of overweight and obesity in children and adults during 1980–2013: a systematic analysis for the Global Burden of Disease Study 2013. The lancet, 384(9945), 766-781.
Nielsen, S. J., Siega-Riz, A. M., & Popkin, B. M. (2002). Trends in food locations and sources among adolescents and young adults. Preventive medicine, 35(2), 107-113.
Nordic Council of Ministers. (2014). Nordic Nutrition Recommendations 2012:Integrating Nutrition and Physical Activity. Copenhagen
Oellingrath, I. M., Hersleth, M., & Svendsen, M. V. (2013). Association between parental motives for food choice and eating patterns of 12-to 13-year-old Norwegian children. Public health nutrition, 16(11), 2023-2031.
Omran, A. R. (1971). The epidemiologic transition: a theory of the epidemiology of population change. The Milbank Memorial Fund Quarterly, 509-538.
Ortega, F. B., Ruiz, J. R., Labayen, I., Martínez-Gómez, D., Vicente-Rodriguez, G., Cuenca-García, M., . . . Molnar, D. (2014). Health inequalities in urban adolescents: role of physical activity, diet, and genetics. Pediatrics, 133(4), e884-e895.
Øverby, N., Stea, T. H., Vik, F. N., Klepp, K.-I., & Bere, E. (2011). Changes in meal pattern among Norwegian children from 2001 to 2008. Public health nutrition, 14(09), 1549-1554.
Øverby, N. C., Johannesen, E., Jensen, G., Skjaevesland, A.-K., & Haugen, M. (2014). Test-retest reliability and validity of a web-based food-frequency questionnaire for adolescents aged 13-14 to be used in the Norwegian Mother and Child Cohort Study (MoBa). Food & nutrition research, 58.
Pampel, F. C., Krueger, P. M., & Denney, J. T. (2010). Socioeconomic disparities in health behaviors. Annual review of sociology, 36, 349.
Pan, A., Malik, V. S., Hao, T., Willett, W. C., Mozaffarian, D., & Hu, F. B. (2013). Changes in water and beverage intake and long-term weight changes: results from three prospective cohort studies. International journal of obesity, 37(10), 1378-1385.
Parsons, T. J., Power, C., & Logan, S. (1999). Childhood predictors of adult obesity: a systematic review. International journal of obesity, 23.
Pillas, D., Marmot, M., Naicker, K., Goldblatt, P., Morrison, J., & Pikhart, H. (2014). Social inequalities in early childhood health and development: a European-wide systematic review. Pediatric research, 76(5), 418-424.
Rahman, T., Cushing, R. A., & Jackson, R. J. (2011). Contributions of built environment to childhood obesity. Mount Sinai Journal of Medicine: A Journal of Translational and Personalized Medicine, 78(1), 49-57.
Rasmussen, M., Krølner, R., Klepp, K.-I., Lytle, L., Brug, J., Bere, E., & Due, P. (2006). Determinants of fruit and vegetable consumption among children and adolescents: a review of the literature. Part I: quantitative studies. International Journal of Behavioral Nutrition and Physical Activity, 3(1), 22.
Reilly, J. J., Armstrong, J., Dorosty, A. R., Emmett, P. M., Ness, A., Rogers, I., . . . Sherriff, A. (2005). Early life risk factors for obesity in childhood: cohort study. Bmj, 330(7504), 1357.
Reilly, J. J., & Kelly, J. (2011). Long-term impact of overweight and obesity in childhood and adolescence on morbidity and premature mortality in adulthood: systematic review. International journal of obesity, 35(7), 891-898.
Reilly, J. J., Methven, E., McDowell, Z. C., Hacking, B., Alexander, D., Stewart, L., & Kelnar, C. J. (2003). Health consequences of obesity. Archives of disease in childhood, 88(9), 748-752.
Riddoch, C. J., Andersen, L. B., Wedderkopp, N., Harro, M., Klasson-Heggebo, L., Sardinha, L. B., . . . Ekelund, U. (2004). Physical activity levels and patterns of 9-and 15-yr-old European children. Medicine and science in sports and exercise, 36(1), 86-92.
Rolland-Cachera, M. F. (2011). Childhood obesity: current definitions and recommendations for their use. International Journal of Pediatric Obesity, 6(5-6), 325-331.
Rolls, B. J., Roe, L. S., Kral, T. V., Meengs, J. S., & Wall, D. E. (2004). Increasing the portion size of a packaged snack increases energy intake in men and women. Appetite, 42(1), 63-69.
Sattelmair, J., Pertman, J., Ding, E. L., Kohl, H. W., Haskell, W., & Lee, I.-M. (2011). Dose response between physical activity and risk of coronary heart disease a meta-analysis. Circulation, 124(7), 789-795.
Shrewsbury, V., & Wardle, J. (2008). Socioeconomic Status and Adiposity in Childhood: A Systematic Review of Cross‐sectional Studies 1990–2005. Obesity, 16(2), 275-284.
Singh, A. S., Mulder, C., Twisk, J. W., Van Mechelen, W., & Chinapaw, M. J. (2008). Tracking of childhood overweight into adulthood: a systematic review of the literature. Obesity reviews, 9(5), 474-488.
Sosial- og helsedepartementet. (2009). Samhandlingsreformen - Rett behandling – på rett sted – til rett tid (St.meld. nr. 47 2008-2009). Oslo.
Statistisk Sentralbyrå. (2015). Marriages and divorces. Retrieved from http://www.ssb.no/en/befolkning/statistikker/ekteskap/
Stettler, N., Signer, T. M., & Suter, P. M. (2004). Electronic games and environmental factors associated with childhood obesity in Switzerland. Obesity research, 12(6), 896-903.
Strauss, R. S. (2000). Childhood obesity and self-esteem. Pediatrics, 105(1), e15-e15. Strauss, R. S., & Knight, J. (1999). Influence of the home environment on the development of
obesity in children. Pediatrics, 103(6), e85-e85. Thomas, J. R., & Högnäs, R. S. (2015). The effect of parental divorce on the health of adult
children. Longitudinal and life course studies, 6(3), 279. Trasande, L., & Elbel, B. (2012). The economic burden placed on healthcare systems by
childhood obesity. Expert review of pharmacoeconomics & outcomes research, 12(1), 39-45.
Van Lippevelde, W., te Velde, S. J., Verloigne, M., De Bourdeaudhuij, I., Manios, Y., Bere, E., . . . Bringolf-Isler, B. (2013). Associations between home-and family-related factors and fruit juice and soft drink intake among 10-to 12-year old children. The ENERGY project. Appetite, 61, 59-65.
Vereecken, C., Haerens, L., De Bourdeaudhuij, I., & Maes, L. (2010). The relationship between children’s home food environment and dietary patterns in childhood and adolescence. Public health nutrition, 13(10A), 1729-1735.
Wang, Y., & Lobstein, T. (2006). Worldwide trends in childhood overweight and obesity. International Journal of Pediatric Obesity, 1(1), 11-25.
Wong, J. E., Parnell, W. R., Black, K. E., & Skidmore, P. M. (2012). Reliability and relative validity of a food frequency questionnaire to assess food group intakes in New Zealand adolescents. Nutrition journal, 11(1), 1.
World Health Organization. (2003). Diet, nutrition and the prevention of chronic diseases. 916.
World Health Organization. (2004). Appropriate body-mass index for Asian populations and its implications for policy and intervention strategies. Lancet, 363(9403), 157.
World Health Organization. (2012). Global Strategy on Diet, Physical Activity and Health. Promoting fruit and vegetable consumption around the world.
World Health Organization. (1995). Physical status: The use of and interpretation of anthropometry, Report of a WHO Expert Committee.
Yatsuya, H., Li, Y., Hilawe, E. H., Ota, A., Wang, C., Chiang, C., . . . Ozaki, Y. (2014). Global trend in overweight and obesity and its association with cardiovascular disease incidence. Circulation Journal, 78(12), 2807-2818.
Ziegler, E. E., & Nelson, S. E. (2012). The WHO growth standards: strengths and limitations. Current Opinion in Clinical Nutrition & Metabolic Care, 15(3), 298-302.
10.0 Appendix Appendix 1: Frequency questionnaire “Friskllivsstudien barn”
Appendix 2: Frequency questionnaire used in test-retest
Appendix 3: Requests to participate in “Friskllivsstudien barn” and letter of consent
Appendix 4: Requests to participate in test-retest and letter of consent
Appendix 5: Approval from REK
Appendix 6: Approval from NSD
The association between parental education, living arrangements and dietary habits among overweight and obese Norwegian children aged 6-10 years. Author: Thea Christiansen
Master in Public Health
Faculty of health and sports science at University of Agder
E-mail: [email protected]
Link to Scandinavian Journal of Public Health author guidelines: https://uk.sagepub.com/en-
gb/eur/supplementary-files-on-sage-journals-sj-guidelines-for-authors
Abstract
Aims: To examine the association between parental education, living arrangement and the
availability and intake of selected food and beverages among overweight and obese
Norwegian children, 6-10 years old.
Methods: This cross-sectional study included 151 participants. A web-based frequency
questionnaire was used to assess dietary habits, parental education and living arrangements.
Weight and height were measured by public health nurses.
Results: The results showed higher availability of sugar-sweetened soft drinks amongst
children with low educated mothers (2.5 times/week (95% CI, 1.9-3.0)) compared to those
with high educated mothers (1.0 times/week (0.6-1.4)). Children with low educated mothers
had also a higher intake of white bread (21.4 g/day (11.2-31.5) vs 4.4 g/day (2.9-6.0)),
nut/chocolate topping (5.3 g/day (3.0-7.6) vs 1.8 g/day (1.0-2.7)) and candy (6.3 g/day (5.4-
7.2) vs 4.6 g/day (4.0-5.2)). Mean availability of fruit and vegetables was higher amongst
children living in dual parent households (6.0 times/week (5.7-6.4)) compared to those living
in single parent households (5.4 times/week (4.7-6-0)). Finally, a higher intake of vegetables
was shown in children living in single parent households (30.6 g/day (20.9-40.2)) compared
to those living in dual parents households (20.4 g/day (16.5-24.4)).
Conclusion: This study found a higher intake and availability of unhealthy food and
beverages among children with low educated mothers compared to those with high educated
mothers. In addition, the results showed a higher availability of fruit and vegetables, but a
lower intake of vegetables among children living in dual parent households compared to those
living in single parent households.
Keywords: Children, overweight, parental education, living arrangements, dietary habits,
food availability
Background
During the past decades, the prevalence of childhood overweight and obesity has increased
worldwide (1-4). Despite the evidence suggesting a levelling off in the prevalence of
overweight and obesity in developing countries (5-7), a Norwegian study amongst 3rd graders
has shown that 16% of the children are overweight and 4% are obese (8). Childhood
overweight and obesity often persists into adulthood, and may lead to increased risk of
developing chronic disorders during early adulthood (9-11). Type 2 diabetes, hypertension,
dyslipidaemia, metabolic syndrome and obstructive sleep apnea are adverse health outcomes
associated with overweight in children and adolescents (12). These risk factors can result in
premature heart disease, cancer and adult diabetes (13). The link between overweight/obesity
and reduced health among children is complex with genetic, biological, behavioural, social,
cultural and environmental influences (14, 15). One of the main postulated explanations for
the childhood obesity epidemic is increased sedentary behaviour and reduced physical activity
in addition to unfavourable dietary habits (16). However, these factors cannot alone be
responsible for the obesity epidemic.
In the western world, a lower prevalence of overweight and obesity has been found among
groups from higher social strata (17). A systematic review reported an inverse association
between parental education level and adiposity in children (18). In contrast, other review
studies have reported higher prevalence of overweight and obesity amongst those with a
higher social status living in economically unprivileged countries (19, 20). Other socio-
demographic factors, such as single-parent household and family size have also been
associated with paediatric overweight (18).
Since the 1960´s, families have changed structure, function, and culture (21). The number of
divorces has increased, and remained at a high level in Norway (22). It is reported that
children from divorced families have reduced health status and lower levels of well-being
than children from intact families (24, 25). And further research have shown that children
living in single-mother families have increased risk of overweight compared to those living in
two parent households (26, 27).
The purpose of this study is to explore the association between parental education level and
living arrangements with the availability and intake of selected food items in overweight and
obese children.
Methods
Study design and participants
This cross-sectional study is part of an on-going quasi-controlled intervention study,
“Frisklivsstudien barn” (FSB), which aims to promote healthy lifestyle habits in overweight
and obese children and their families. Data from the cross-sectional study was collected in
September to October 2014, April to May 2015 and September to October 2015.
Healthy Life Centres (HLCs) and Public Health Clinics (PHCs) in the municipalities Bergen,
Sola, Sandnes, Stavanger, Søgne, Kristiansand (three districts) and Oslo (two different
districts) have participated in the study, and data has been collected by trained health
professionals at the participating HLCs and PHCs. Overweight and obese children (iso-BMI
≥25kg/m2) and their families are recruited to participate in the present study as a result of
routine screening of weight and height by public health nurses in preschool and 3rd grade.
Prior to participation in the present study, the parents of the overweight and obese children
received both oral and written information on the FSB study. Those who agreed to participate
signed a written consent before filling out a web-based frequency questionnaire providing
information on their children´s lifestyle behaviours as well as basic demographic and socio-
demographic variables (e.g. sex, age, living arrangement and educational attainment).
Questionnaire
In the present study, a selection of the questions from FSB´s frequency questionnaire was
used. Participants were given a personal identification-number that was used during all parts
of the data collection period. The questions regarding intake of selected food items and
beverages have been validated prior to this study (28).
To test the reliability of the questions regarding the availability of food items and beverages,
and the socioeconomic factors; living arrangement and parental education, a test-retest was
performed, including a small sample of 41 children aged between 6-10 years.
Information regarding intake of food items and beverages was assessed with the question:
How often does your child consume the selected food item? Seven response alternatives were
given; never, 1–3 times per month, once a week, 2–3 times per week, 4–6 times per week,
once or more times a day. And for the consumption of beverages the intervals range were
never, 1–3 glasses per month, 1 glass per week, 2–6 glasses per week, 1 glass per day, 2–3
glasses per day and more than 3 glasses per day.
Parental education level was assessed with the question: What level of education do you have,
answer for yourself and your partner. The question had six response alternatives, each for
yourself and your partner; (1) elementary school <7 years, (2) elementary school 7 – 10
years, (3) vocational school or high school <3 years, (4) high school – 3 years, (5) 3 years of
high school, (6) college or university ≤4 years, (7) colleges or university ≥4 years. These
response alternatives were then dichotomized into low degree of education (3 years of high
school or less) and high degree of education (college or university ≥4 years).
Information regarding living arrangement was assessed with the question: Which adults does
your child live with? Seven response alternatives was given; (1) both mother and father all
the time, (2) with the mother, (3) with the father, (4) with the mother and her new partner, (5)
with the father and his new partner, (6) grandparents, (7) others. The response alternatives
were then dichotomized into one parent household or two- parent household.
Information regarding availability of candy, salty snack, diet-soda, sugar-sweetened soda and
fruits was assessed with the question: How often are the selected food item/beverage
available? Ten response alternatives was given; never, less than once a month, less than once
a week, once a week, two times a week.. seven days a week. In the statistical analysis they
were scored 0, 0.1, 0.5, 1, 2, 3 .. 7 every day. The response alternatives were then
dichotomized into every day (7 days a week) or not every day.
BMI categories
BMI (kg/m2) was calculated from height and weight measured by public health nurses. All
children were weighted wearing light clothing and without shoes. Normal weight (<25kg/m2),
overweight (≥ 25kg/m2), obesity (≥30kg/m2) is defined according to the International Obesity
Task Force (IOTF) age and gender specific cut- off points (29).
Data analysis
Descriptive statistics were used to determine the percentage of overweight and obese children.
Further, statistical analysis were performed with independent sample t-test of the two groups,
assessing children´s availability and dietary intake relative to high or low parental education,
and availability and dietary intake between children living in single or dual-parent household.
Furthermore, independent sample t-test was used to compare means of the variables intake
and availability of selected food items and beverages. For all analysis p-values <0.05 was
considered as statistically significant. Data collected from the frequency questionnaire was
transmitted to Survey Exact. All statistical analyses were carried out using the statistical
software IBM SPSS version 22 (30).
Results Mean iso-BMI amongst the children was 23.7, and 33.7% of the children participating in the
present study were classified overweight (n=51) and 66.3% (n=100) were classified obese.
Table 1 presents the availability of food items relative to parental education. The results
showed higher availability of sugar - sweetened soft drinks amongst children with low –
educated mothers (mean intake, 2.5 times/week; 95% CI, 1.9-3.0) compared to those with
high-educated mothers (1.0 times/week 95% CI 0.6-1.4) (p= 0.001), respectively. The results
showed no further differences in availability of the other selected food items and beverages
between children with low-educated parents compared to those with high-educated parents.
Comparing the intake of selected food groups between children with low- and high educated
mothers showed a higher intake of white bread (21.4 g/day (95% CI 11.2-31.5) vs 4.4 g/day
(95% CI 2.9-6.0), (p=0.009)), nut/chocolate topping (5.3 g/day (95% CI 3.0-7.6) vs 1.8 g/day
(95% CI 1.0-2.7), (p=0.021)) and candy (6.3 g/day (95% CI 5.4-7.2) vs 4.6 g/day (95% CI
4.0-5.2), (p= 0.009)) among those with low-educated mothers (Table 2).
Table 4 presents the availability of food items relative to living arrangements, demonstrating
that the mean availability of fruit and vegetables was higher amongst children living with two
parents (6.0 times/week; 95% CI, 5.7-6.4) compared to those living with one parent in the
household (5.4 times/week; 95% CI, 4.7-6-0) (p= 0.034). No difference in availability of
other selected food items and beverages was found between children living with one or two
parents in the household, respectively.
Finally, the results demonstrated a higher vegetable intake 30.6 g/day (95% CI 20.9-40.2)
among children living with one parent in the household compared to those living with two
parents in the household 20.4 g/day (95% CI 16.5-24.4) (p=0.021) (Table 5). No difference in
intake of other selected food items and beverages was found between children living with one
or two parents in the household, respectively.
Discussion
Results from this cross-sectional study showed that the availability of sugar-sweetened soft
drinks was higher among overweight and obese children with low-educated mothers than
those with high-educated mothers. This is consistent to findings in a study from seven
different European countries, where the availability of soft drinks at home was more frequent
for the children aged 6-8 years with low educated mothers, compared to those with high
educated mothers, however, this study did not focus in the child´s weight status (31).
Furthermore, the present study showed that children with low educated mothers had a higher
intake of unhealthy food compared to those with high educated mothers. These results are
also consistent with previous research among 10 year old overweight/obese and normal
weight children, suggesting that children with high educated mothers were more likely to
make healthier food choices than those with low educated mothers (32). Furthermore, the
results from the present study revealed differences in the intake of selected food items, where
children with low educated mothers had a greater intake of white bread, nut/chocolate topping
and candy compared to those with low educated mothers. This result is in line with another
Norwegian study, which showed that low maternal education was associated with poorer
dietary habits, and girls with the least educated mothers were found to have a greater intake of
candy and consumption of soft drinks compared to girls from the most educated mothers (33).
Previous studies have reported an inverse association between maternal educational level and
overweight and obesity among children (8, 34), indicating that a sugar-rich diet may lead to
positive increments in bodyweight.
When examining the association between living arrangement and dietary factors, the results in
the present study showed that children living in dual-parent households reported a higher
availability of fruit and vegetables compared to single-parent households. Another study
among Norwegian children aged 10-12 years indicates that increased accessibility increases
the intake of fruit and vegetables (35). Further, a review study reported that the child´s
perceived availability of vegetables was positively associated with vegetable intake (36).
Baranowski and colleges found similar associations, where a higher intake of fruit and
vegetables was reported when these food items were not only available, but also provided in
accessible location (37). However, the highest intake of vegetables in the present study was
reported amongst children living in single-parent households. Contrary to the findings in this
study, it has been reported that adolescents from single-parent families are less likely to eat
vegetables compared to those living in dual-parent families (38). Furthermore, a study among
Norwegian 6th and 7th grade children found that unhealthy dietary habits was more prevalent
among children living in single-parent families than those living in two-parent families (39).
Another study has shown that children aged 6-11 years living in single-parent households
reports a higher intake of fat and a higher total energy intake compared to those living in dual
parent households, and that overweight and obesity was more prevalent among children in
single parent households compared to children in dual parent household (40).
The present study, however, only represent children classified as overweight and obese. There
is a lack of studies exploring availability and intake of selected food items among
overweight/obese children respective to the child´s living arrangements and parental
education. However, a selection of studies explore the association between maternal
education and single parent families and the risk of unhealthy dietary habits relative to the age
group in the present study, but does not exclusively focus on overweight and obese children.
Previous research on family food environment are related to socio-economic inequalities and
focuses on energy balance related behaviors and prevention of childhood obesity and are
limited to compare overweight and normal weight children (31).
Few previous studies have examined the association between home availability of food and
living arrangements, and results from the present study substantiates that future intervention
studies should focus on overweight/obese children living in single parent household. There is
a need of nutritional education for communities, school management, parents, as well as
children and adolescents to promote healthy living habits (41, 42). Home availability is
studied to have influence on the child´s eating habits (43), and parent´s nutritional knowledge
and health attitudes may impact what type of food the parents make available at home (44,
45).
The present study has both strengths and limitations. First, a major strength of this study is the
measuring of children´s height and weight performed by public health nurses and
categorization into BMI categories was performed following IOTF´s criteria (29). The study
population includes individuals from west, south and east of Norway, and the recruitment
process has been conducted so to cover a major part of Norway. However, this study cannot
rule out the possibility of selection bias, as participants declining to participate are not
controlled for. Further, a validity and reproducibility study have been conducted on
Norwegian adolescents for variables in the questionnaire regarding intake of selected food
items and beverages prior to this study, and showed good test-retest reliability (28). Also, the
inter-rated reliability was assessed for the other variables regarding SES, and home
availability of selected food items and beverages in this study, which showed a medium to
good reliability score.
This study has several limitations. First, the use of self-reported data may represent response-
bias when reporting dietary habits (46). Under-reporting energy- and unhealthy food is widely
reported, and particularly in overweight individuals (47, 48). Also, over-reporting healthier
dietary habits are common in both overweight and normal weight individuals (49). Further,

the availability of fruit and vegetables was significantly lower in children living in single vs
dual parent households, but the intake was higher. However, when exploring the child´s
intake of selected food items, fruit and vegetables are distributed in separate groups, and may
therefore be unevenly distributed compared to the availability of fruit and vegetable group.
Finally, the present study had a cross-sectional design, which does not allow or causal
inference. Therefore, the results from this study cannot illuminate the mechanisms that link
parental education level and living arrangements and the availability and intake of selected
food items.
Conclusion
This study found that children with low educated mothers had a higher availability of sugar-
sweetened soft drinks and they had a higher intake of white bread, nut/chocolate topping and
candy compared to those from high educated mothers. The present study did also find a
higher availability of fruit and vegetables among children living in dual parent families, but
the highest intake of vegetables was found among children living in single parent households.
Acknowledgements
The University of Ager have initiated and organized Frisklivsstudien barn (FSB), which I
have been able to use the baseline data from. I am grateful to the FSB project, and the
participating districts in the study.
Conflict of interest None decalred
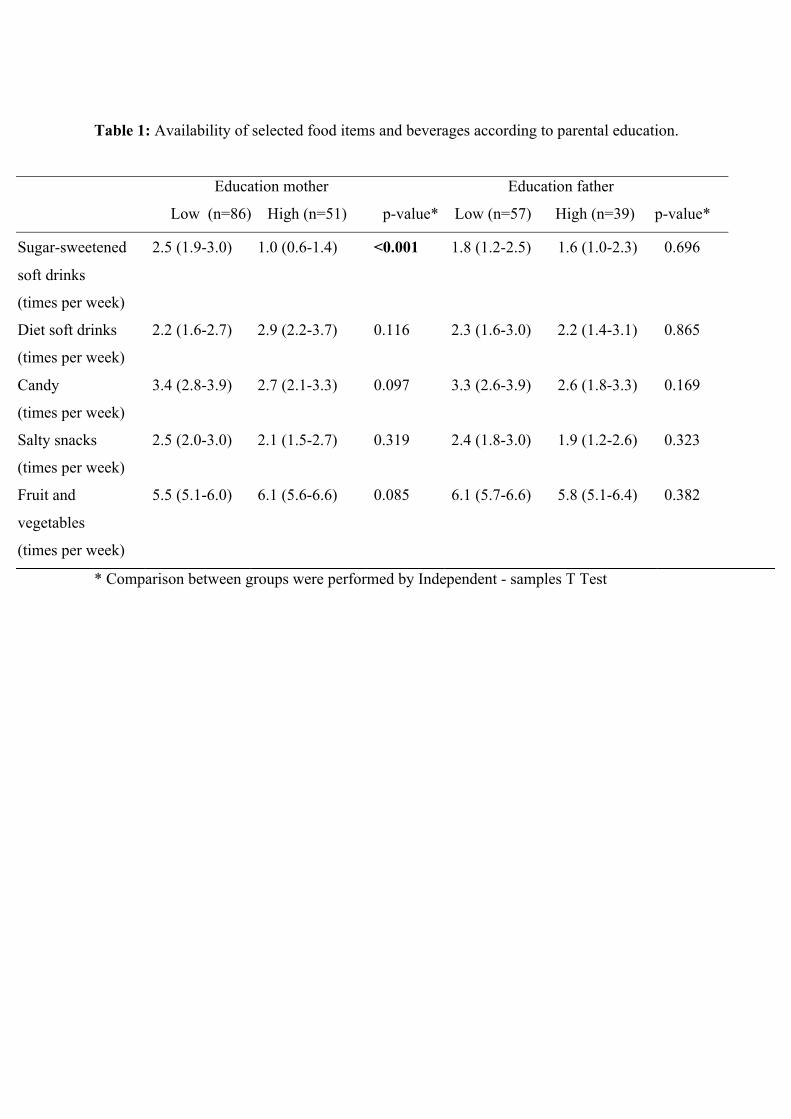
Table 1: Availability of selected food items and beverages according to parental education.
Education mother Education father
Low (n=86) High (n=51) p-value* Low (n=57) High (n=39) p-value*
* Comparison between groups were performed by Independent - samples T Test
Sugar-sweetened
soft drinks
(times per week)
2.5 (1.9-3.0) 1.0 (0.6-1.4) <0.001 1.8 (1.2-2.5) 1.6 (1.0-2.3) 0.696
Diet soft drinks
(times per week)
2.2 (1.6-2.7) 2.9 (2.2-3.7) 0.116 2.3 (1.6-3.0) 2.2 (1.4-3.1) 0.865
Candy
(times per week)
3.4 (2.8-3.9) 2.7 (2.1-3.3) 0.097 3.3 (2.6-3.9) 2.6 (1.8-3.3) 0.169
Salty snacks
(times per week)
2.5 (2.0-3.0) 2.1 (1.5-2.7) 0.319 2.4 (1.8-3.0) 1.9 (1.2-2.6) 0.323
Fruit and
vegetables
(times per week)
5.5 (5.1-6.0) 6.1 (5.6-6.6) 0.085 6.1 (5.7-6.6) 5.8 (5.1-6.4) 0.382
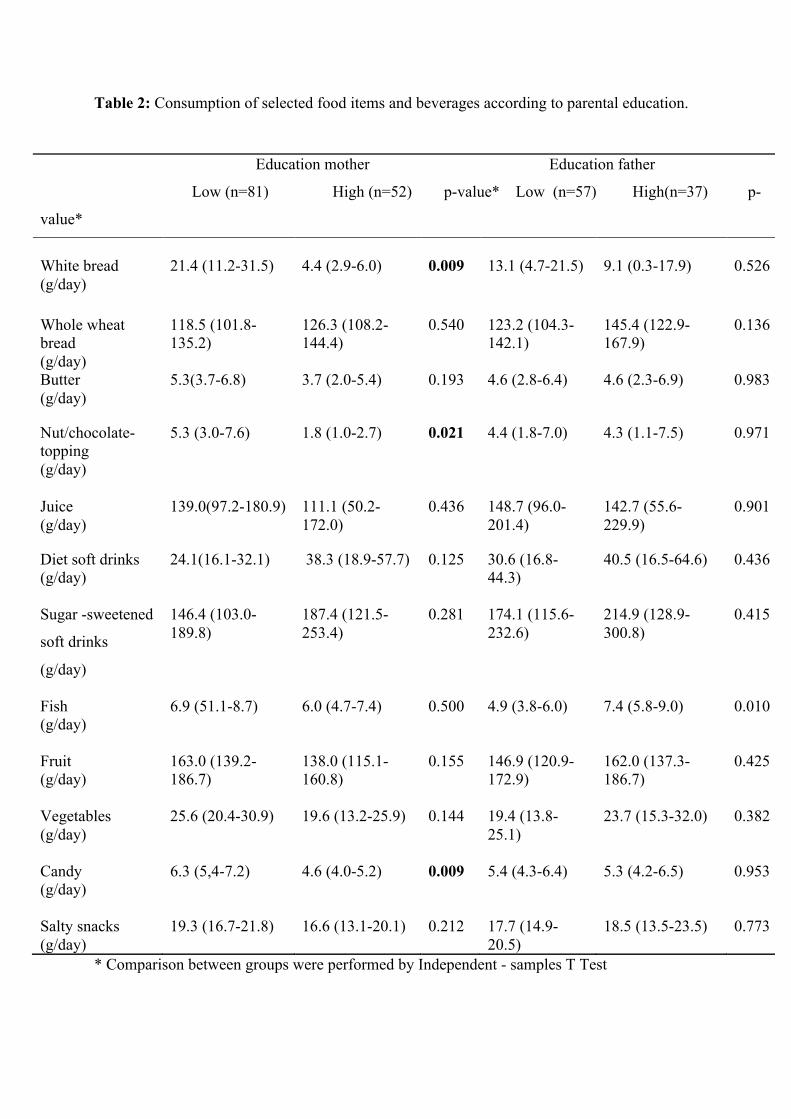
Table 2: Consumption of selected food items and beverages according to parental education.
* Comparison between groups were performed by Independent - samples T Test
Education mother Education father
Low (n=81) High (n=52) p-value* Low (n=57) High(n=37) p-
value*
White bread (g/day)
21.4 (11.2-31.5) 4.4 (2.9-6.0) 0.009 13.1 (4.7-21.5) 9.1 (0.3-17.9) 0.526
Whole wheat bread (g/day)
118.5 (101.8-135.2)
126.3 (108.2-144.4)
0.540 123.2 (104.3-142.1)
145.4 (122.9-167.9)
0.136
Butter (g/day)
5.3(3.7-6.8) 3.7 (2.0-5.4) 0.193 4.6 (2.8-6.4) 4.6 (2.3-6.9) 0.983
Nut/chocolate- topping (g/day)
5.3 (3.0-7.6) 1.8 (1.0-2.7) 0.021 4.4 (1.8-7.0) 4.3 (1.1-7.5) 0.971
Juice (g/day)
139.0(97.2-180.9) 111.1 (50.2-172.0)
0.436 148.7 (96.0-201.4)
142.7 (55.6-229.9)
0.901
Diet soft drinks (g/day)
24.1(16.1-32.1) 38.3 (18.9-57.7) 0.125 30.6 (16.8-44.3)
40.5 (16.5-64.6) 0.436
Sugar -sweetened
soft drinks
(g/day)
146.4 (103.0-189.8)
187.4 (121.5-253.4)
0.281
174.1 (115.6-232.6)
214.9 (128.9-300.8)
0.415
Fish (g/day)
6.9 (51.1-8.7)
6.0 (4.7-7.4)
0.500
4.9 (3.8-6.0)
7.4 (5.8-9.0)
0.010
Fruit (g/day)
163.0 (139.2-186.7)
138.0 (115.1-160.8)
0.155
146.9 (120.9- 172.9)
162.0 (137.3-186.7)
0.425
Vegetables (g/day)
25.6 (20.4-30.9)
19.6 (13.2-25.9)
0.144
19.4 (13.8-25.1)
23.7 (15.3-32.0)
0.382
Candy (g/day)
6.3 (5,4-7.2)
4.6 (4.0-5.2)
0.009
5.4 (4.3-6.4)
5.3 (4.2-6.5)
0.953
Salty snacks (g/day)
19.3 (16.7-21.8)
16.6 (13.1-20.1)
0.212
17.7 (14.9-20.5)
18.5 (13.5-23.5)
0.773
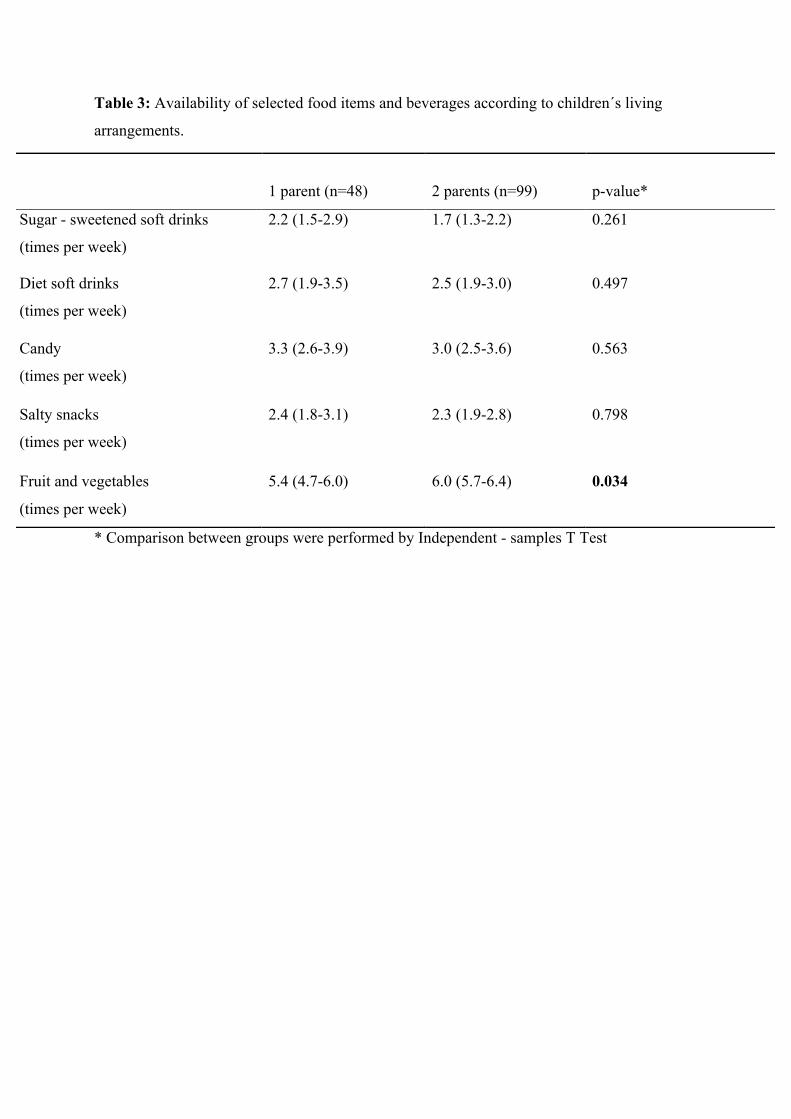
Table 3: Availability of selected food items and beverages according to children´s living
arrangements.
* Comparison between groups were performed by Independent - samples T Test
1 parent (n=48)
2 parents (n=99)
p-value*
Sugar - sweetened soft drinks
(times per week)
2.2 (1.5-2.9) 1.7 (1.3-2.2) 0.261
Diet soft drinks
(times per week)
2.7 (1.9-3.5) 2.5 (1.9-3.0) 0.497
Candy
(times per week)
3.3 (2.6-3.9) 3.0 (2.5-3.6) 0.563
Salty snacks
(times per week)
2.4 (1.8-3.1) 2.3 (1.9-2.8) 0.798
Fruit and vegetables
(times per week)
5.4 (4.7-6.0) 6.0 (5.7-6.4) 0.034
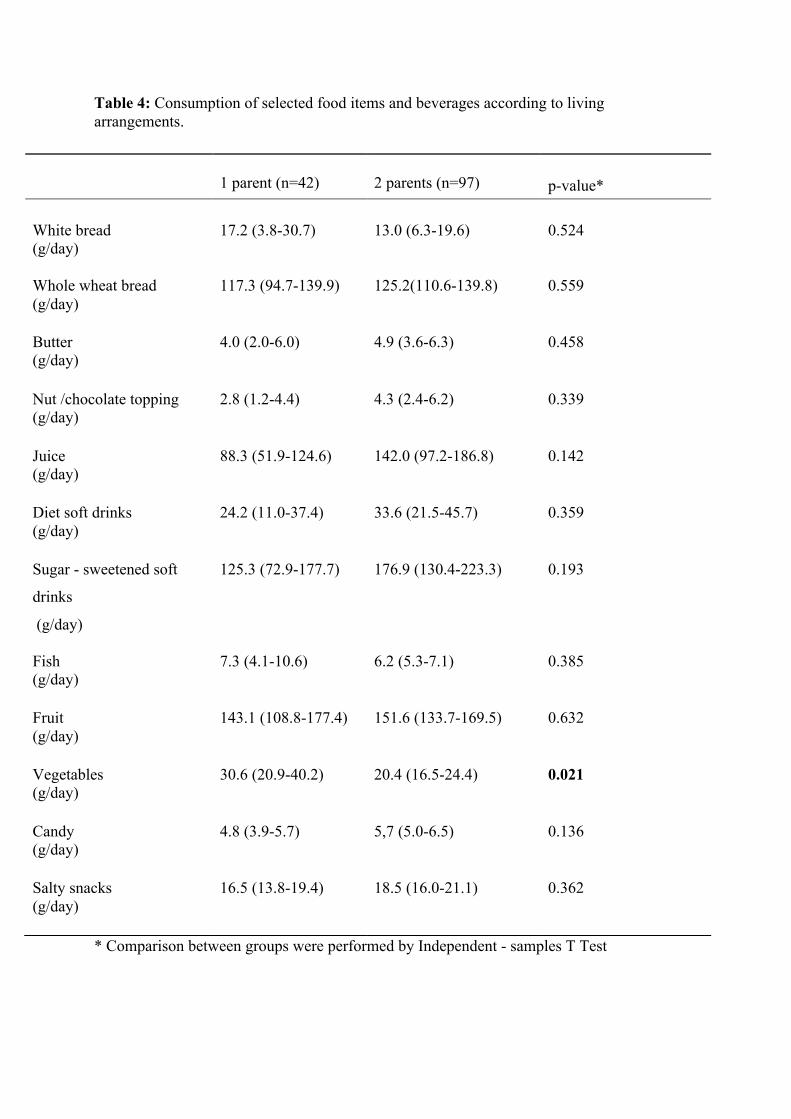
Table 4: Consumption of selected food items and beverages according to living arrangements.
* Comparison between groups were performed by Independent - samples T Test
1 parent (n=42)
2 parents (n=97)
p-value*
White bread (g/day)
17.2 (3.8-30.7) 13.0 (6.3-19.6) 0.524
Whole wheat bread (g/day)
117.3 (94.7-139.9) 125.2(110.6-139.8) 0.559
Butter (g/day)
4.0 (2.0-6.0)
4.9 (3.6-6.3)
0.458
Nut /chocolate topping (g/day)
2.8 (1.2-4.4) 4.3 (2.4-6.2) 0.339
Juice (g/day)
88.3 (51.9-124.6) 142.0 (97.2-186.8) 0.142
Diet soft drinks (g/day)
24.2 (11.0-37.4) 33.6 (21.5-45.7) 0.359
Sugar - sweetened soft
drinks
(g/day)
125.3 (72.9-177.7) 176.9 (130.4-223.3) 0.193
Fish (g/day)
7.3 (4.1-10.6) 6.2 (5.3-7.1) 0.385
Fruit (g/day)
143.1 (108.8-177.4) 151.6 (133.7-169.5) 0.632
Vegetables (g/day)
30.6 (20.9-40.2) 20.4 (16.5-24.4) 0.021
Candy (g/day)
4.8 (3.9-5.7) 5,7 (5.0-6.5) 0.136
Salty snacks (g/day)
16.5 (13.8-19.4) 18.5 (16.0-21.1) 0.362
References
1. Ebbeling, C.B., D.B. Pawlak, and D.S. Ludwig, Childhood obesity: public-health crisis, common sense cure. The lancet, 2002. 360(9331): p. 473-482.
2. Lobstein, T. and M.L. Frelut, Prevalence of overweight among children in Europe. Obesity reviews, 2003. 4(4): p. 195-200.
3. Folkehelseinstituttet, Resultater fra Barnevekststudien 2008 - 2012: Stabil andel barn med overvekt. 2012.
4. Cattaneo, A., et al., Overweight and obesity in infants and pre‐school children in the European Union: a review of existing data. Obesity reviews, 2010. 11(5): p. 389-398.
5. Bergström, E. and H.K. Blomquist, Is the prevalence of overweight and obesity declining among 4‐year‐old Swedish children? Acta paediatrica, 2009. 98(12): p. 1956-1958.
6. Morgen, C.S., et al., Trends in prevalence of overweight and obesity in Danish infants, children and adolescents–are we still on a plateau? PLoS One, 2013. 8(7): p. e69860.
7. Rokholm, B., J.L. Baker, and T.I.A. Sørensen, The levelling off of the obesity epidemic since the year 1999–a review of evidence and perspectives. Obesity reviews, 2010. 11(12): p. 835-846.
8. Biehl, A., et al., Adiposity among children in Norway by urbanity and maternal education: a nationally representative study. BMC Public Health, 2013. 13(1): p. 842.
9. Whitaker, R.C., et al., Predicting obesity in young adulthood from childhood and parental obesity. New England Journal of Medicine, 1997. 337(13): p. 869-873.
10. Herman, K.M., et al., Tracking of obesity and physical activity from childhood to adulthood: the Physical Activity Longitudinal Study. International Journal of Pediatric Obesity, 2009. 4(4): p. 281-288.
11. Deshmukh-Taskar, P., et al., Tracking of overweight status from childhood to young adulthood: the Bogalusa Heart Study. European Journal of Clinical Nutrition, 2006. 60(1): p. 48-57.
12. Daniels, S.R., et al., Overweight in children and adolescents pathophysiology, consequences, prevention, and treatment. Circulation, 2005. 111(15): p. 1999-2012.
13. Llewellyn, A., et al., Childhood obesity as a predictor of morbidity in adulthood: a systematic review and meta‐analysis. Obesity Reviews, 2016. 17(1): p. 56-67.
14. Han, J.C., D.A. Lawlor, and S.Y. Kimm, Childhood obesity. The Lancet, 2010. 375(9727): p. 1737-1748.
15. Karnik, S. and A. Kanekar, Childhood obesity: a global public health crisis. 2015. 16. Dietz, W.H., The obesity epidemic in young children: reduce television viewing and
promote playing. BMJ: British Medical Journal, 2001. 322(7282): p. 313. 17. Parsons, T.J., C. Power, and S. Logan, Childhood predictors of adult obesity: a
systematic review. International Journal of Obesity, 1999. 23. 18. Shrewsbury, V. and J. Wardle, Socioeconomic Status and Adiposity in Childhood: A
Systematic Review of Cross‐sectional Studies 1990–2005. Obesity, 2008. 16(2): p. 275-284.
19. Mistry, S. and S. Puthussery, Risk factors of overweight and obesity in childhood and adolescence in South Asian countries: a systematic review of the evidence. Public health, 2015. 129(3): p. 200-209.
20. Dinsa, G., et al., Obesity and socioeconomic status in developing countries: a systematic review. obesity reviews, 2012. 13(11): p. 1067-1079.
21. Omran, A.R., The epidemiologic transition: a theory of the epidemiology of population change. The Milbank Memorial Fund Quarterly, 1971: p. 509-538.
22. Statistisk Sentralbyrå. Marriages and divorces. 2015; Available from: http://www.ssb.no/en/befolkning/statistikker/ekteskap/.
24. Amato, P.R. and B. Keith, Parental divorce and the well-being of children: a meta-analysis. Psychological bulletin, 1991. 110(1): p. 26.
25. Thomas, J.R. and R.S. Högnäs, The effect of parental divorce on the health of adult children. Longitudinal and life course studies, 2015. 6(3): p. 279.
26. Gibson, L.Y., et al., The role of family and maternal factors in childhood obesity. Medical Journal of Australia, 2007. 186(11): p. 591.
27. Strauss, R.S. and J. Knight, Influence of the home environment on the development of obesity in children. Pediatrics, 1999. 103(6): p. e85-e85.
28. Øverby, N.C., et al., Test-retest reliability and validity of a web-based food-frequency questionnaire for adolescents aged 13-14 to be used in the Norwegian Mother and Child Cohort Study (MoBa). Food & nutrition research, 2014. 58.
29. Cole, T.J., et al., Establishing a standard definition for child overweight and obesity worldwide: international survey. Bmj, 2000. 320(7244): p. 1240.
30. Released, I.C., IBM SPSS Statistics for Macintoch, Version 22.0. 2013, IBM Corp Armonk, NY.
31. Mantziki, K., et al., Inequities in energy-balance related behaviours and family environmental determinants in European children: baseline results of the prospective EPHE evaluation study. BMC public health, 2015. 15(1): p. 1.
32. Cribb, V.L., et al., Is maternal education level associated with diet in 10-year-old children? Public health nutrition, 2011. 14(11): p. 2037-2048.
33. Nilsen, S.M., et al., Adolescents’ health-related dietary patterns by parental socio-economic position, The Nord-Trøndelag Health Study (HUNT). The European Journal of Public Health, 2009: p. ckp137.
34. Júlíusson, P.B., et al., Overweight and obesity in Norwegian children: prevalence and socio‐demographic risk factors. Acta Paediatrica, 2010. 99(6): p. 900-905.
35. Bere, E. and K.-I. Klepp, Changes in accessibility and preferences predict children's future fruit and vegetable intake. International Journal of Behavioral Nutrition and Physical Activity, 2005. 2(1): p. 15.
36. Cook, L.T., et al., Association between home availability and vegetable consumption in youth: A review. Public health nutrition, 2015. 18(04): p. 640-648.
37. Baranowski, T., K.W. Cullen, and J. Baranowski, Psychosocial correlates of dietary intake: advancing dietary intervention. Annual review of nutrition, 1999. 19(1): p. 17-40.
38. Stewart, S.D. and C.L. Menning, Family structure, nonresident father involvement, and adolescent eating patterns. Journal of Adolescent Health, 2009. 45(2): p. 193-201.
39. Øverby, N., et al., Changes in meal pattern among Norwegian children from 2001 to 2008. Public health nutrition, 2011. 14(09): p. 1549-1554.
40. Huffman, F.G., S. Kanikireddy, and M. Patel, Parenthood—a contributing factor to childhood obesity. International Journal of Environmental Research and Public Health, 2010. 7(7): p. 2800-2810.
41. Ochola, S. and P.K. Masibo, Dietary Intake of Schoolchildren and Adolescents in Developing Countries. Annals of Nutrition and Metabolism, 2014. 64(Suppl. 2): p. 24-40.
42. Kunnskapssenteret, 2012 Systematisk oversikt over effekten av helsefremmende og forebyggende tiltak på kosthold, fysisk aktivitet, overvekt og seksuell helse hos barn og unge. Oslo.
43. Rasmussen, M., et al., Determinants of fruit and vegetable consumption among children and adolescents: a review of the literature. Part I: quantitative studies. International Journal of Behavioral Nutrition and Physical Activity, 2006. 3(1): p. 22.
44. Ball, K., D. Crawford, and G. Mishra, Socio-economic inequalities in women's fruit and vegetable intakes: a multilevel study of individual, social and environmental mediators. Public health nutrition, 2006. 9(05): p. 623-630.
45. Konttinen, H., et al., Socio-economic disparities in the consumption of vegetables, fruit and energy-dense foods: the role of motive priorities. Public health nutrition, 2013. 16(05): p. 873-882.
46. Bandini, L.G., et al., Longitudinal changes in the accuracy of reported energy intake in girls 10–15 y of age. The American journal of clinical nutrition, 2003. 78(3): p. 480-484.
47. Bandini, L.G., et al., Validity of reported energy intake in obese and nonobese adolescents. The American journal of clinical nutrition, 1990. 52(3): p. 421-425.
48. Lobstein, T., L. Baur, and R. Uauy, Obesity in children and young people: a crisis in public health. Obesity reviews, 2004. 5(s1): p. 4-85.
49. Johansson, L., et al., Under-and overreporting of energy intake related to weight status and lifestyle in a nationwide sample. The American journal of clinical nutrition, 1998. 68(2): p. 266-274.
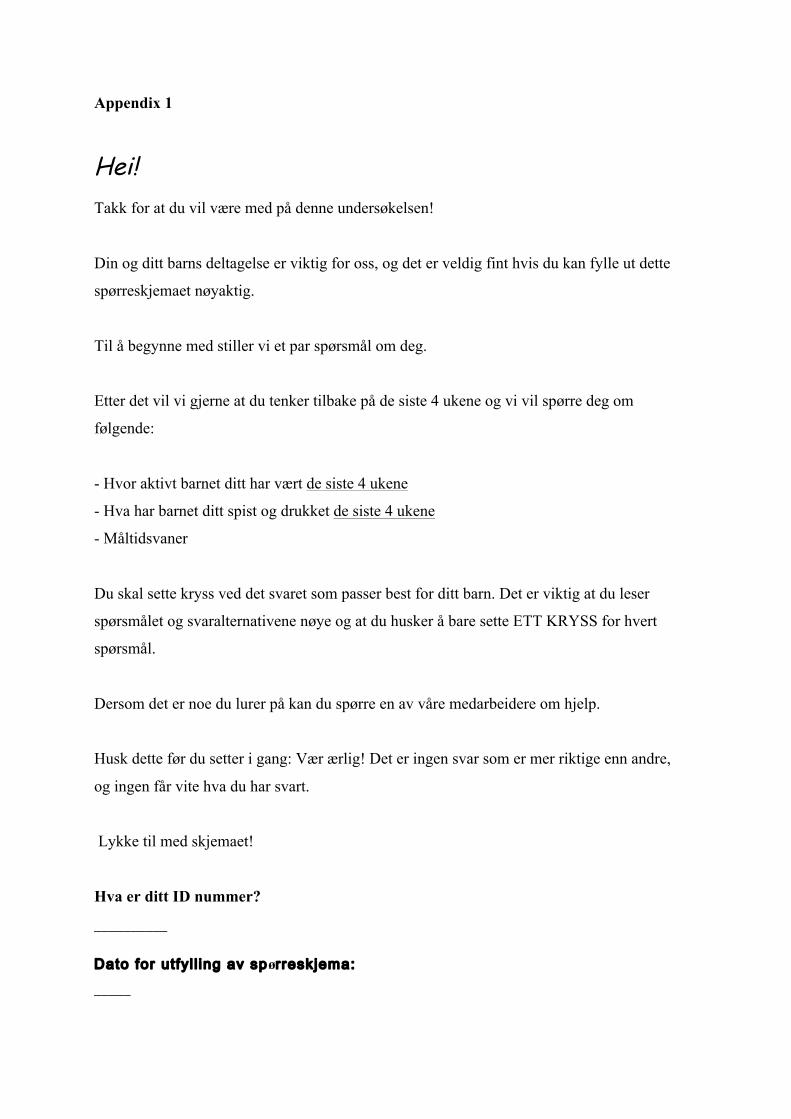
Appendix 1
Hei! Takk for at du vil være med på denne undersøkelsen!
Din og ditt barns deltagelse er viktig for oss, og det er veldig fint hvis du kan fylle ut dette
spørreskjemaet nøyaktig.
Til å begynne med stiller vi et par spørsmål om deg.
Etter det vil vi gjerne at du tenker tilbake på de siste 4 ukene og vi vil spørre deg om
følgende:
- Hvor aktivt barnet ditt har vært de siste 4 ukene
- Hva har barnet ditt spist og drukket de siste 4 ukene
- Måltidsvaner
Du skal sette kryss ved det svaret som passer best for ditt barn. Det er viktig at du leser
spørsmålet og svaralternativene nøye og at du husker å bare sette ETT KRYSS for hvert
spørsmål.
Dersom det er noe du lurer på kan du spørre en av våre medarbeidere om hjelp.
Husk dette før du setter i gang: Vær ærlig! Det er ingen svar som er mer riktige enn andre,
og ingen får vite hva du har svart.
Lykke til med skjemaet!
Hva er ditt ID nummer?
__________
Dato for utfyl l ing av spørreskjema: _____
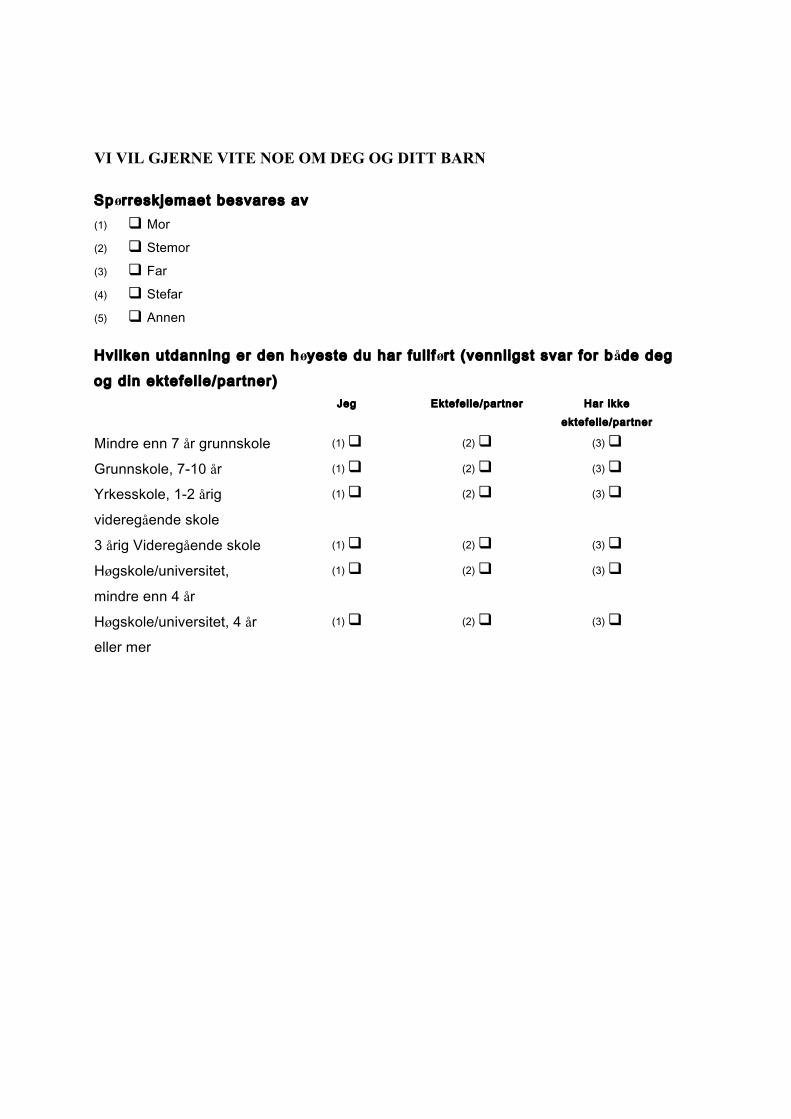
VI VIL GJERNE VITE NOE OM DEG OG DITT BARN
Spørreskjemaet besvares av (1) q Mor
(2) q Stemor
(3) q Far
(4) q Stefar
(5) q Annen
Hvi lken utdanning er den høyeste du har ful l ført (vennligst svar for både deg
og din ektefel le/partner) Jeg Ektefel le/partner Har ikke
ektefel le/partner
Mindre enn 7 år grunnskole (1) q (2) q (3) q
Grunnskole, 7-10 år (1) q (2) q (3) q
Yrkesskole, 1-2 årig
videregående skole
(1) q (2) q (3) q
3 årig Videregående skole (1) q (2) q (3) q
Høgskole/universitet,
mindre enn 4 år
(1) q (2) q (3) q
Høgskole/universitet, 4 år eller mer
(1) q (2) q (3) q
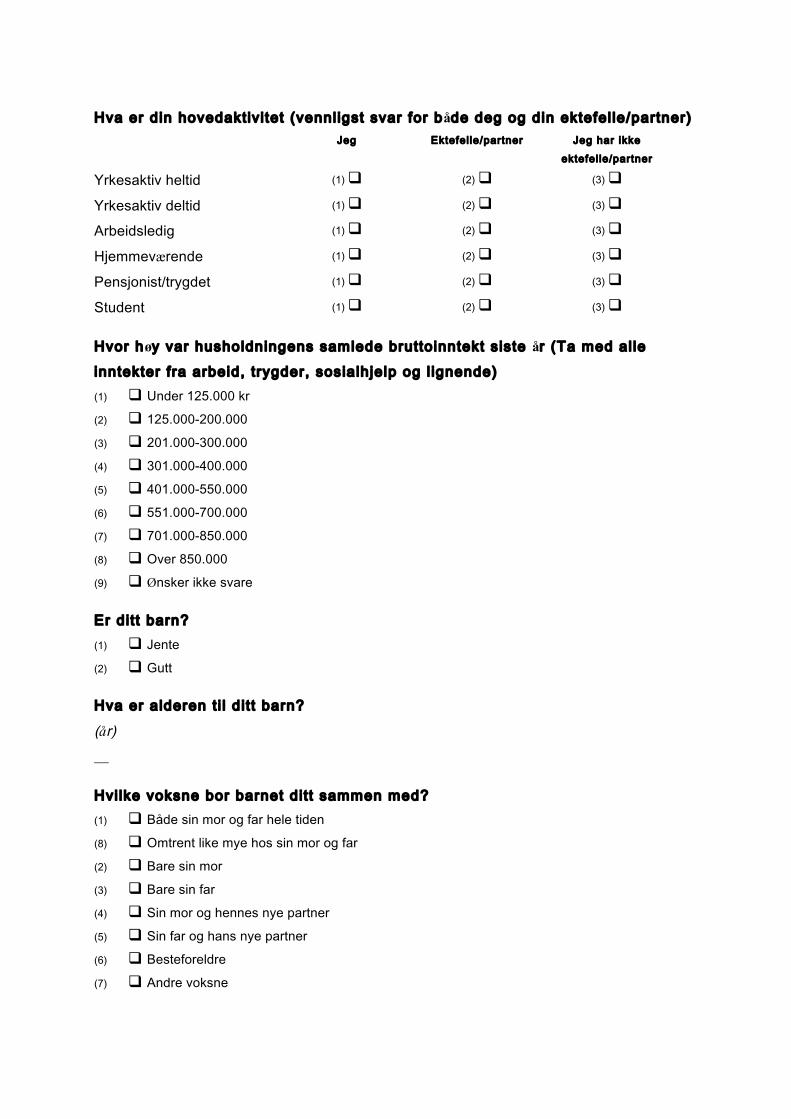
Hva er din hovedaktiv i tet (vennligst svar for både deg og din ektefel le/partner) Jeg Ektefel le/partner Jeg har ikke
ektefel le/partner
Yrkesaktiv heltid (1) q (2) q (3) q
Yrkesaktiv deltid (1) q (2) q (3) q
Arbeidsledig (1) q (2) q (3) q
Hjemmeværende (1) q (2) q (3) q
Pensjonist/trygdet (1) q (2) q (3) q
Student (1) q (2) q (3) q
Hvor høy var husholdningens samlede bruttoinntekt siste år (Ta med al le inntekter fra arbeid, trygder, sosialhjelp og l ignende) (1) q Under 125.000 kr
(2) q 125.000-200.000
(3) q 201.000-300.000
(4) q 301.000-400.000
(5) q 401.000-550.000
(6) q 551.000-700.000
(7) q 701.000-850.000
(8) q Over 850.000
(9) q Ønsker ikke svare
Er dit t barn? (1) q Jente
(2) q Gutt
Hva er alderen t i l d i t t barn?
(år) __
Hvi lke voksne bor barnet dit t sammen med? (1) q Både sin mor og far hele tiden
(8) q Omtrent like mye hos sin mor og far
(2) q Bare sin mor
(3) q Bare sin far
(4) q Sin mor og hennes nye partner
(5) q Sin far og hans nye partner
(6) q Besteforeldre
(7) q Andre voksne
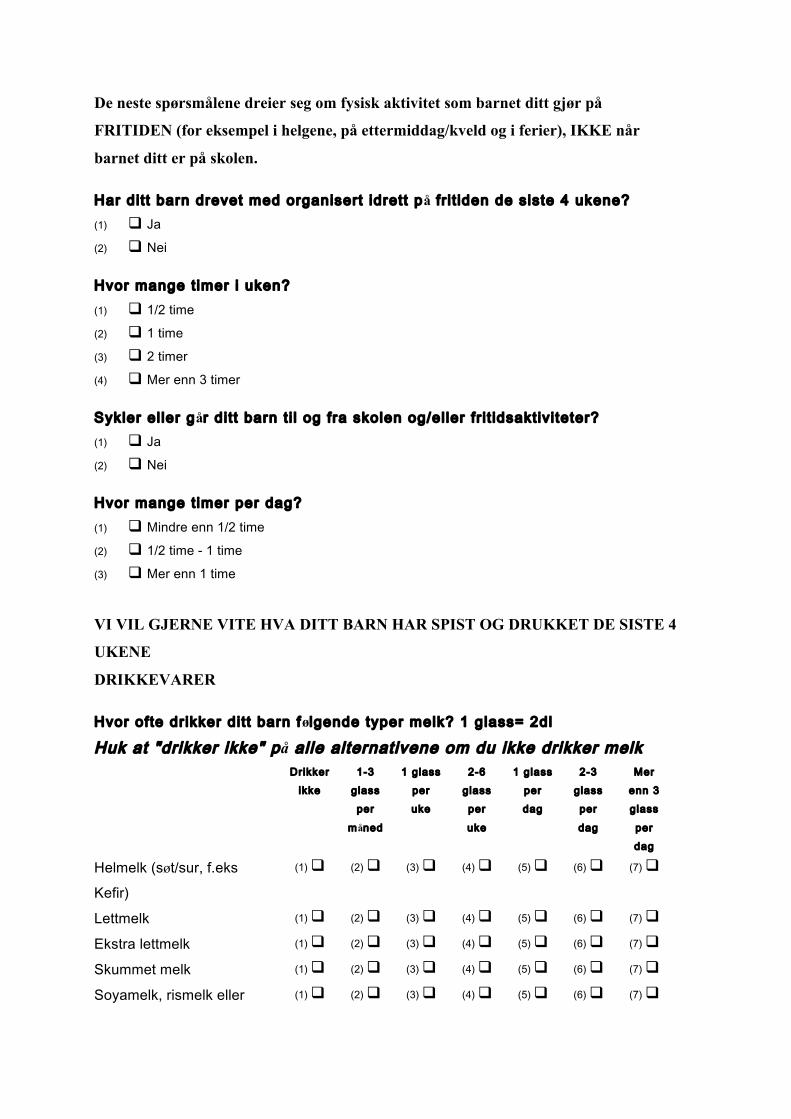
De neste spørsmålene dreier seg om fysisk aktivitet som barnet ditt gjør på
FRITIDEN (for eksempel i helgene, på ettermiddag/kveld og i ferier), IKKE når
barnet ditt er på skolen.
Har dit t barn drevet med organisert idrett på fr i t iden de siste 4 ukene? (1) q Ja
(2) q Nei
Hvor mange t imer i uken? (1) q 1/2 time
(2) q 1 time
(3) q 2 timer
(4) q Mer enn 3 timer
Sykler el ler går dit t barn t i l og fra skolen og/el ler fr i t idsaktiv i teter? (1) q Ja
(2) q Nei
Hvor mange t imer per dag? (1) q Mindre enn 1/2 time
(2) q 1/2 time - 1 time
(3) q Mer enn 1 time
VI VIL GJERNE VITE HVA DITT BARN HAR SPIST OG DRUKKET DE SISTE 4
UKENE
DRIKKEVARER
Hvor ofte drikker dit t barn følgende typer melk? 1 glass= 2dl
Huk at "drikker ikke" på al le alternativene om du ikke drikker melk
Drikker ikke
1-3 glass per
måned
1 glass per uke
2-6 glass per
uke
1 glass per dag
2-3 glass per
dag
Mer enn 3 glass
per dag
Helmelk (søt/sur, f.eks Kefir)
(1) q (2) q (3) q (4) q (5) q (6) q (7) q
Lettmelk (1) q (2) q (3) q (4) q (5) q (6) q (7) q
Ekstra lettmelk (1) q (2) q (3) q (4) q (5) q (6) q (7) q
Skummet melk (1) q (2) q (3) q (4) q (5) q (6) q (7) q
Soyamelk, rismelk eller (1) q (2) q (3) q (4) q (5) q (6) q (7) q
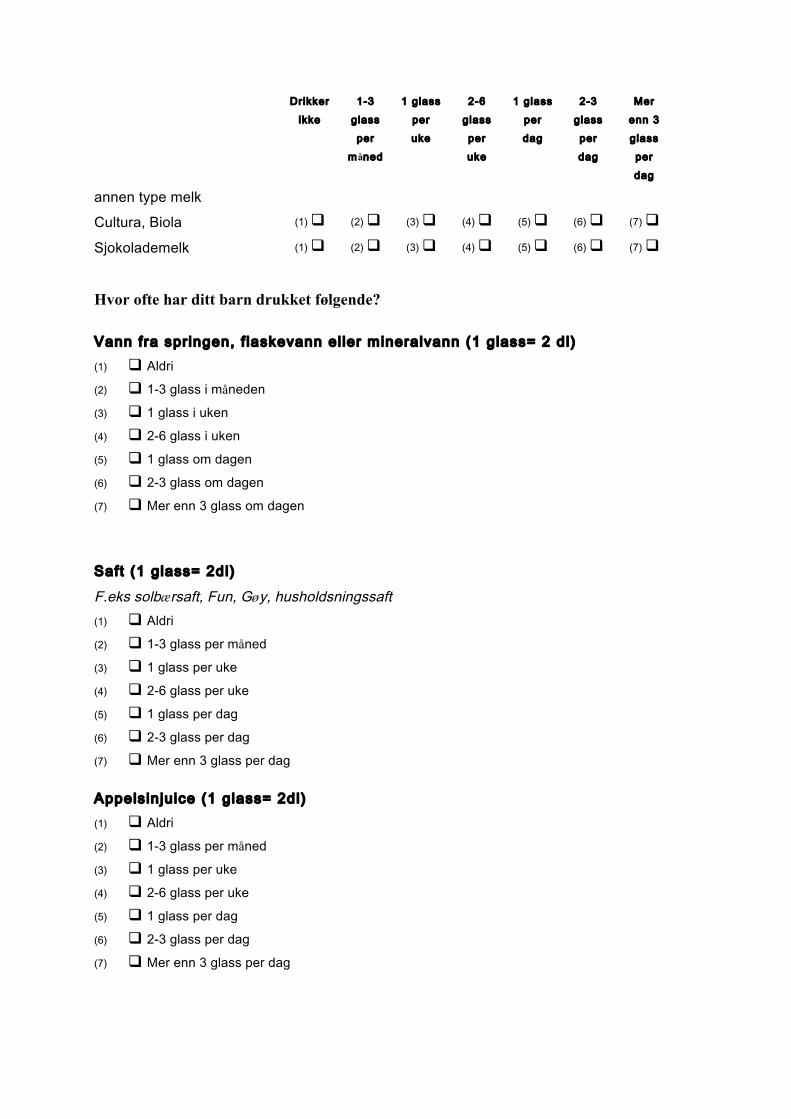
Drikker ikke
1-3 glass per
måned
1 glass per uke
2-6 glass per uke
1 glass per dag
2-3 glass per dag
Mer enn 3 glass per dag
annen type melk Cultura, Biola (1) q (2) q (3) q (4) q (5) q (6) q (7) q
Sjokolademelk (1) q (2) q (3) q (4) q (5) q (6) q (7) q
Hvor ofte har ditt barn drukket følgende?
Vann fra springen, f laskevann el ler mineralvann (1 glass= 2 dl) (1) q Aldri
(2) q 1-3 glass i måneden
(3) q 1 glass i uken
(4) q 2-6 glass i uken
(5) q 1 glass om dagen
(6) q 2-3 glass om dagen
(7) q Mer enn 3 glass om dagen
Saft (1 glass= 2dl)
F.eks solbærsaft, Fun, Gøy, husholdsningssaft (1) q Aldri
(2) q 1-3 glass per måned
(3) q 1 glass per uke
(4) q 2-6 glass per uke
(5) q 1 glass per dag
(6) q 2-3 glass per dag
(7) q Mer enn 3 glass per dag
Appelsinjuice (1 glass= 2dl) (1) q Aldri
(2) q 1-3 glass per måned
(3) q 1 glass per uke
(4) q 2-6 glass per uke
(5) q 1 glass per dag
(6) q 2-3 glass per dag
(7) q Mer enn 3 glass per dag
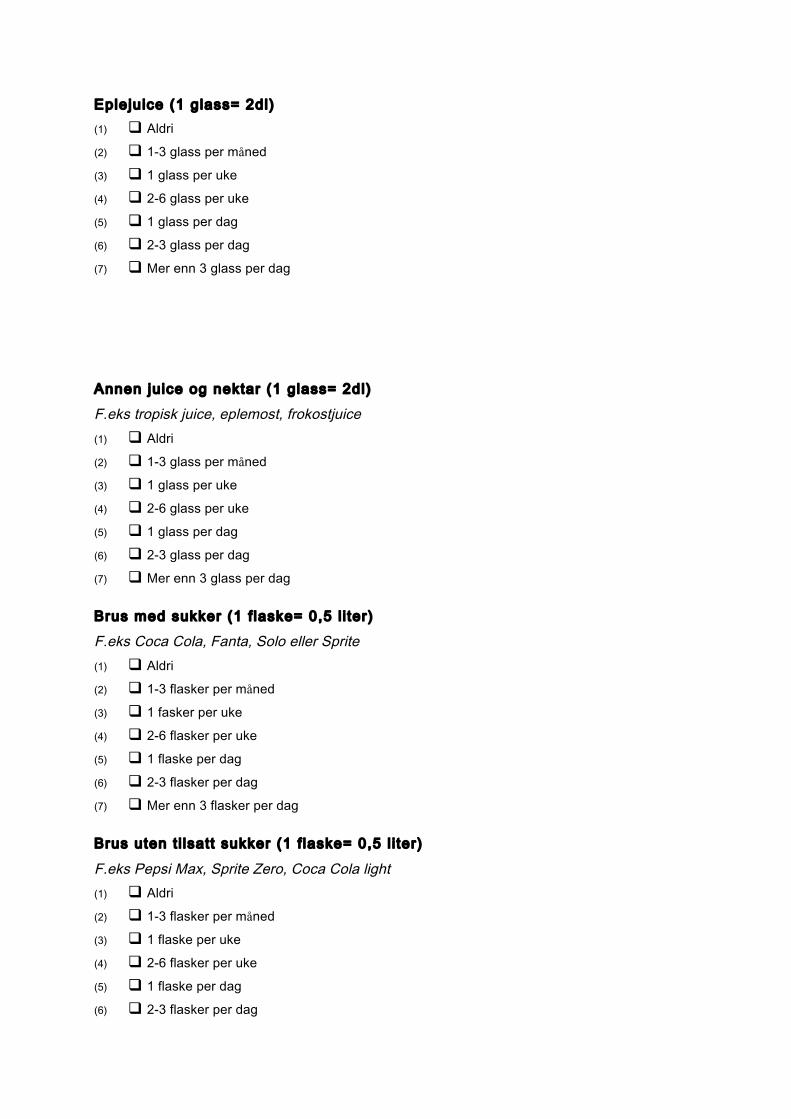
Eplejuice (1 glass= 2dl) (1) q Aldri
(2) q 1-3 glass per måned
(3) q 1 glass per uke
(4) q 2-6 glass per uke
(5) q 1 glass per dag
(6) q 2-3 glass per dag
(7) q Mer enn 3 glass per dag
Annen juice og nektar (1 glass= 2dl) F.eks tropisk juice, eplemost, frokostjuice (1) q Aldri
(2) q 1-3 glass per måned
(3) q 1 glass per uke
(4) q 2-6 glass per uke
(5) q 1 glass per dag
(6) q 2-3 glass per dag
(7) q Mer enn 3 glass per dag
Brus med sukker (1 f laske= 0,5 l i ter) F.eks Coca Cola, Fanta, Solo eller Sprite (1) q Aldri
(2) q 1-3 flasker per måned
(3) q 1 fasker per uke
(4) q 2-6 flasker per uke
(5) q 1 flaske per dag
(6) q 2-3 flasker per dag
(7) q Mer enn 3 flasker per dag
Brus uten t i lsatt sukker (1 f laske= 0,5 l i ter)
F.eks Pepsi Max, Sprite Zero, Coca Cola light (1) q Aldri
(2) q 1-3 flasker per måned
(3) q 1 flaske per uke
(4) q 2-6 flasker per uke
(5) q 1 flaske per dag
(6) q 2-3 flasker per dag
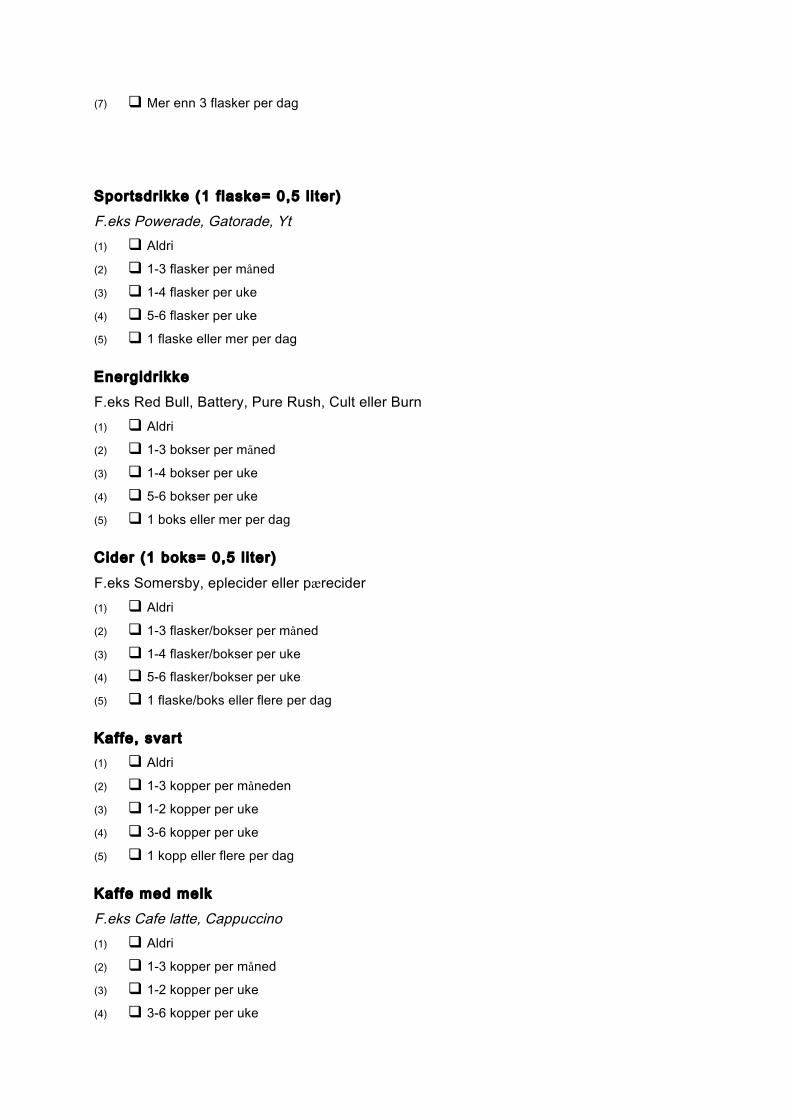
(7) q Mer enn 3 flasker per dag
Sportsdrikke (1 f laske= 0,5 l i ter) F.eks Powerade, Gatorade, Yt (1) q Aldri
(2) q 1-3 flasker per måned
(3) q 1-4 flasker per uke
(4) q 5-6 flasker per uke
(5) q 1 flaske eller mer per dag
Energidrikke F.eks Red Bull, Battery, Pure Rush, Cult eller Burn (1) q Aldri
(2) q 1-3 bokser per måned
(3) q 1-4 bokser per uke
(4) q 5-6 bokser per uke
(5) q 1 boks eller mer per dag
Cider (1 boks= 0,5 l i ter)
F.eks Somersby, eplecider eller pærecider (1) q Aldri
(2) q 1-3 flasker/bokser per måned
(3) q 1-4 flasker/bokser per uke (4) q 5-6 flasker/bokser per uke
(5) q 1 flaske/boks eller flere per dag
Kaffe, svart (1) q Aldri
(2) q 1-3 kopper per måneden
(3) q 1-2 kopper per uke
(4) q 3-6 kopper per uke
(5) q 1 kopp eller flere per dag
Kaffe med melk F.eks Cafe latte, Cappuccino (1) q Aldri
(2) q 1-3 kopper per måned
(3) q 1-2 kopper per uke
(4) q 3-6 kopper per uke
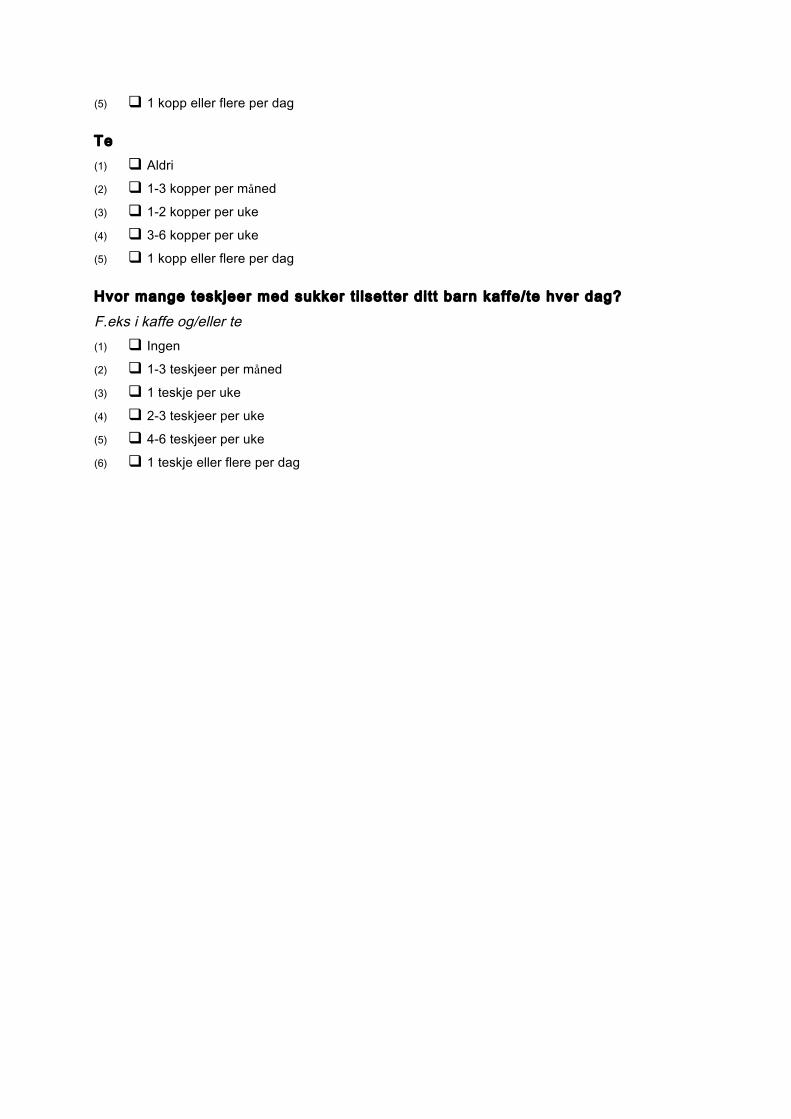
(5) q 1 kopp eller flere per dag
Te (1) q Aldri
(2) q 1-3 kopper per måned
(3) q 1-2 kopper per uke
(4) q 3-6 kopper per uke
(5) q 1 kopp eller flere per dag
Hvor mange teskjeer med sukker t i lsetter dit t barn kaffe/te hver dag? F.eks i kaffe og/eller te (1) q Ingen
(2) q 1-3 teskjeer per måned
(3) q 1 teskje per uke
(4) q 2-3 teskjeer per uke
(5) q 4-6 teskjeer per uke
(6) q 1 teskje eller flere per dag
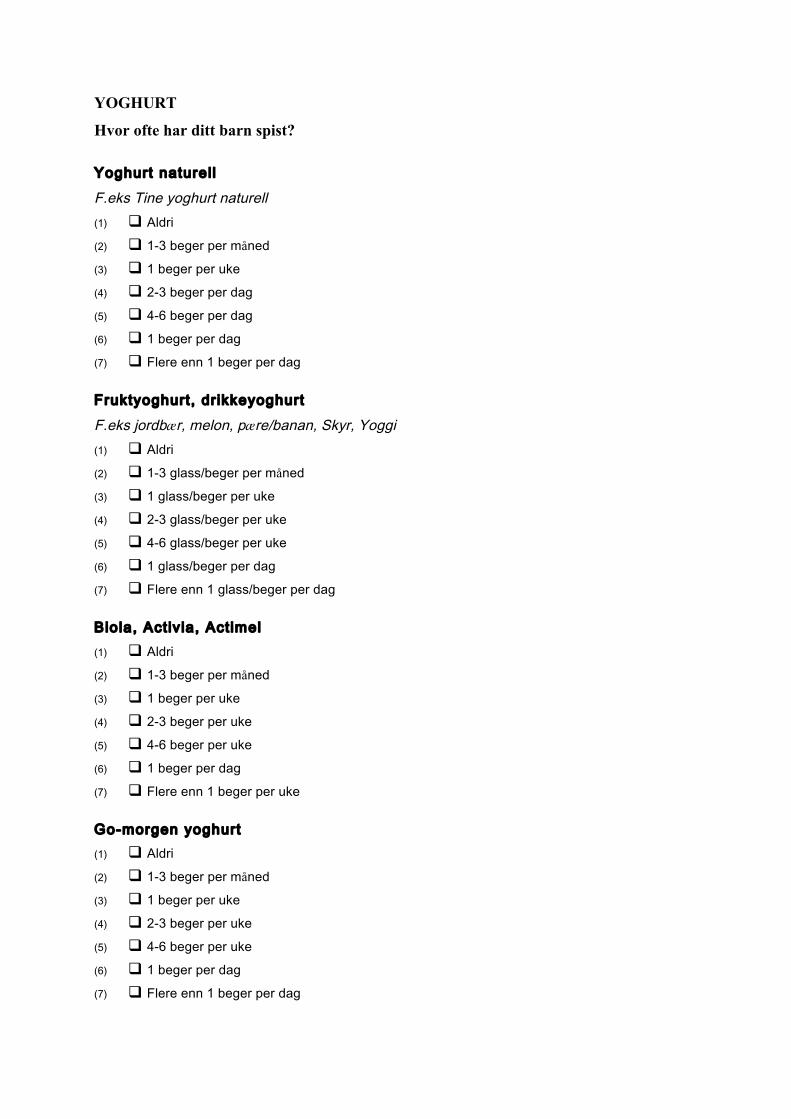
YOGHURT
Hvor ofte har ditt barn spist?
Yoghurt naturel l F.eks Tine yoghurt naturell (1) q Aldri
(2) q 1-3 beger per måned
(3) q 1 beger per uke
(4) q 2-3 beger per dag
(5) q 4-6 beger per dag
(6) q 1 beger per dag
(7) q Flere enn 1 beger per dag
Fruktyoghurt, dr ikkeyoghurt F.eks jordbær, melon, pære/banan, Skyr, Yoggi (1) q Aldri
(2) q 1-3 glass/beger per måned
(3) q 1 glass/beger per uke
(4) q 2-3 glass/beger per uke
(5) q 4-6 glass/beger per uke
(6) q 1 glass/beger per dag
(7) q Flere enn 1 glass/beger per dag
Biola, Activ ia, Actimel (1) q Aldri
(2) q 1-3 beger per måned
(3) q 1 beger per uke
(4) q 2-3 beger per uke
(5) q 4-6 beger per uke
(6) q 1 beger per dag
(7) q Flere enn 1 beger per uke
Go-morgen yoghurt (1) q Aldri
(2) q 1-3 beger per måned
(3) q 1 beger per uke
(4) q 2-3 beger per uke
(5) q 4-6 beger per uke
(6) q 1 beger per dag
(7) q Flere enn 1 beger per dag
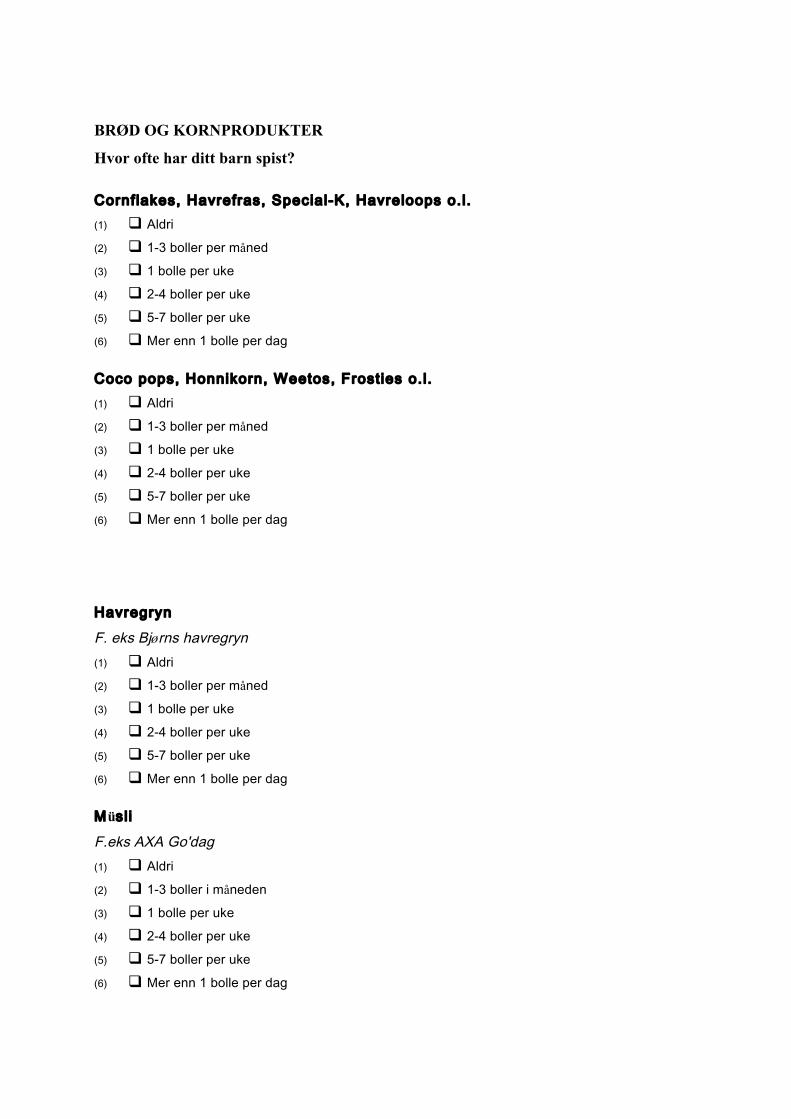
BRØD OG KORNPRODUKTER
Hvor ofte har ditt barn spist?
Cornflakes, Havrefras, Special-K, Havreloops o. l . (1) q Aldri
(2) q 1-3 boller per måned
(3) q 1 bolle per uke
(4) q 2-4 boller per uke
(5) q 5-7 boller per uke
(6) q Mer enn 1 bolle per dag
Coco pops, Honnikorn, Weetos, Frosties o. l . (1) q Aldri
(2) q 1-3 boller per måned
(3) q 1 bolle per uke
(4) q 2-4 boller per uke
(5) q 5-7 boller per uke
(6) q Mer enn 1 bolle per dag
Havregryn
F. eks Bjørns havregryn (1) q Aldri
(2) q 1-3 boller per måned
(3) q 1 bolle per uke
(4) q 2-4 boller per uke
(5) q 5-7 boller per uke
(6) q Mer enn 1 bolle per dag
Müsl i
F.eks AXA Go'dag (1) q Aldri
(2) q 1-3 boller i måneden
(3) q 1 bolle per uke
(4) q 2-4 boller per uke
(5) q 5-7 boller per uke
(6) q Mer enn 1 bolle per dag

Grøt F.eks. havregrøt (1) q Aldri
(2) q 1-3 boller per måned
(3) q 1 bolle per uke
(4) q 2-4 boller per uke
(5) q 5-7 boller per uke
(6) q Mer enn 1 bolle per dag
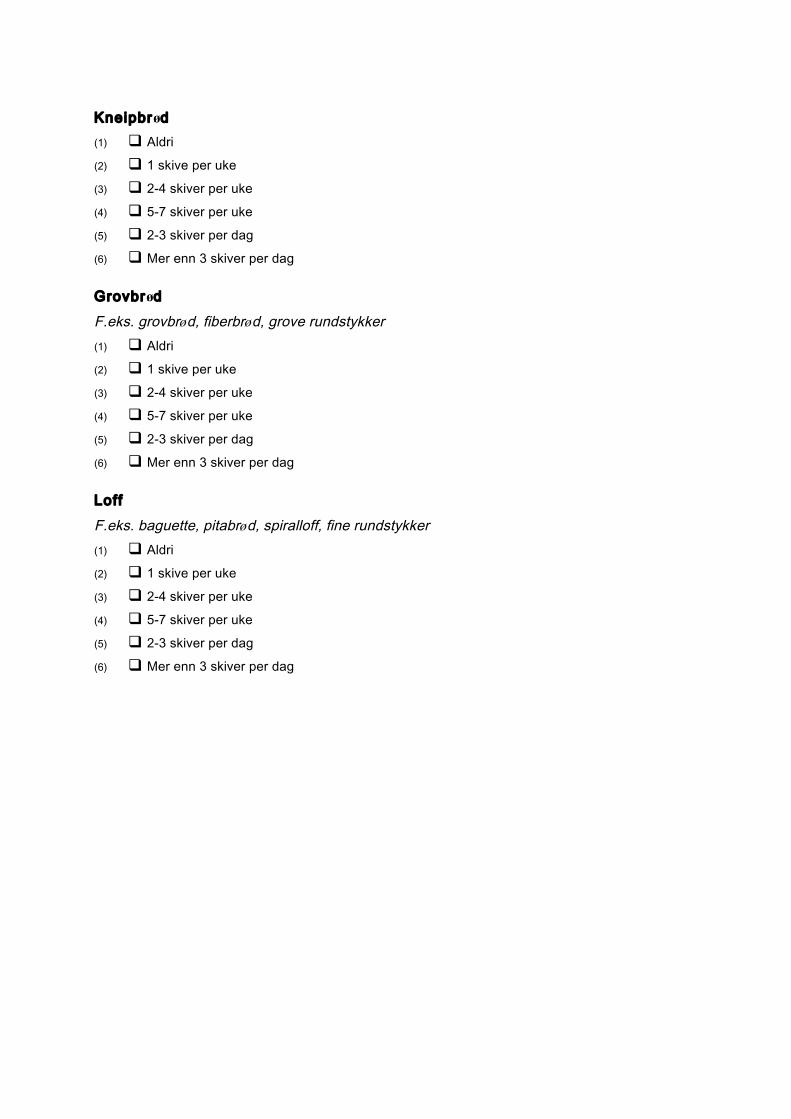
Kneipbrød (1) q Aldri
(2) q 1 skive per uke
(3) q 2-4 skiver per uke
(4) q 5-7 skiver per uke
(5) q 2-3 skiver per dag
(6) q Mer enn 3 skiver per dag
Grovbrød F.eks. grovbrød, fiberbrød, grove rundstykker (1) q Aldri
(2) q 1 skive per uke
(3) q 2-4 skiver per uke
(4) q 5-7 skiver per uke
(5) q 2-3 skiver per dag
(6) q Mer enn 3 skiver per dag
Loff F.eks. baguette, pitabrød, spiralloff, fine rundstykker (1) q Aldri
(2) q 1 skive per uke
(3) q 2-4 skiver per uke
(4) q 5-7 skiver per uke
(5) q 2-3 skiver per dag
(6) q Mer enn 3 skiver per dag
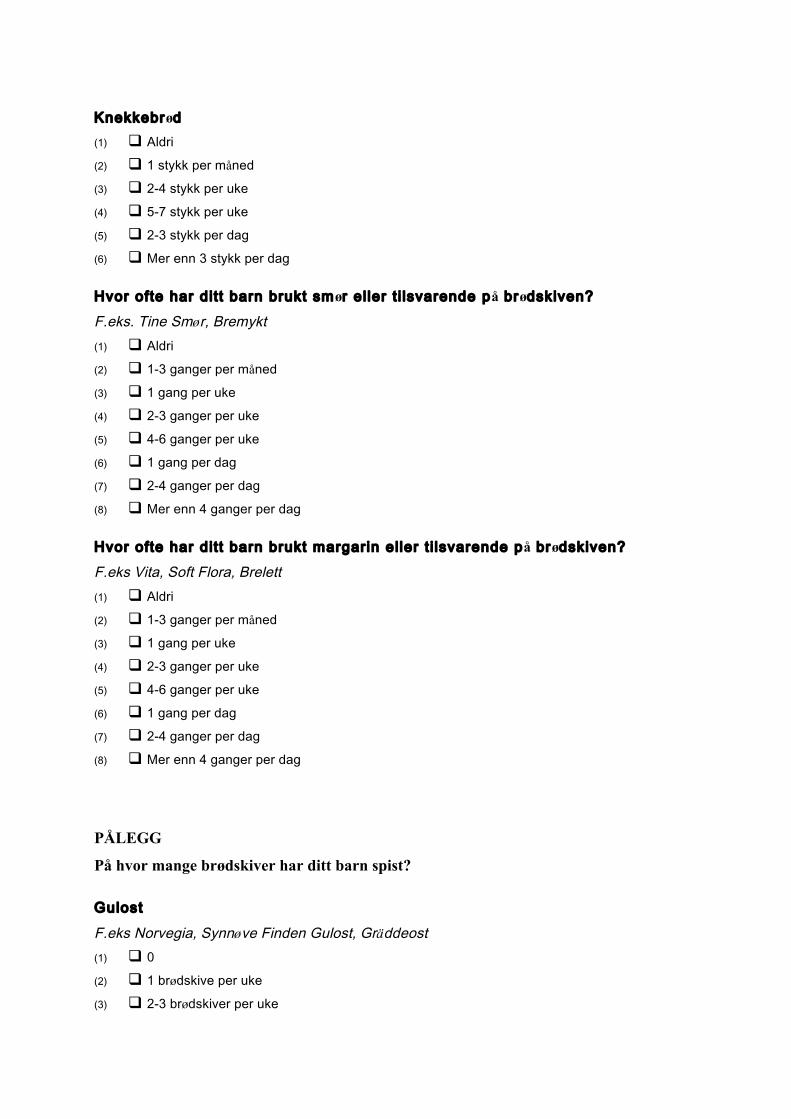
Knekkebrød (1) q Aldri
(2) q 1 stykk per måned
(3) q 2-4 stykk per uke
(4) q 5-7 stykk per uke
(5) q 2-3 stykk per dag
(6) q Mer enn 3 stykk per dag
Hvor ofte har dit t barn brukt smør el ler t i lsvarende på brødskiven? F.eks. Tine Smør, Bremykt (1) q Aldri
(2) q 1-3 ganger per måned
(3) q 1 gang per uke
(4) q 2-3 ganger per uke
(5) q 4-6 ganger per uke
(6) q 1 gang per dag
(7) q 2-4 ganger per dag
(8) q Mer enn 4 ganger per dag
Hvor ofte har dit t barn brukt margarin el ler t i lsvarende på brødskiven? F.eks Vita, Soft Flora, Brelett (1) q Aldri
(2) q 1-3 ganger per måned
(3) q 1 gang per uke
(4) q 2-3 ganger per uke
(5) q 4-6 ganger per uke
(6) q 1 gang per dag
(7) q 2-4 ganger per dag
(8) q Mer enn 4 ganger per dag
PÅLEGG
På hvor mange brødskiver har ditt barn spist?
Gulost
F.eks Norvegia, Synnøve Finden Gulost, Gräddeost (1) q 0
(2) q 1 brødskive per uke
(3) q 2-3 brødskiver per uke
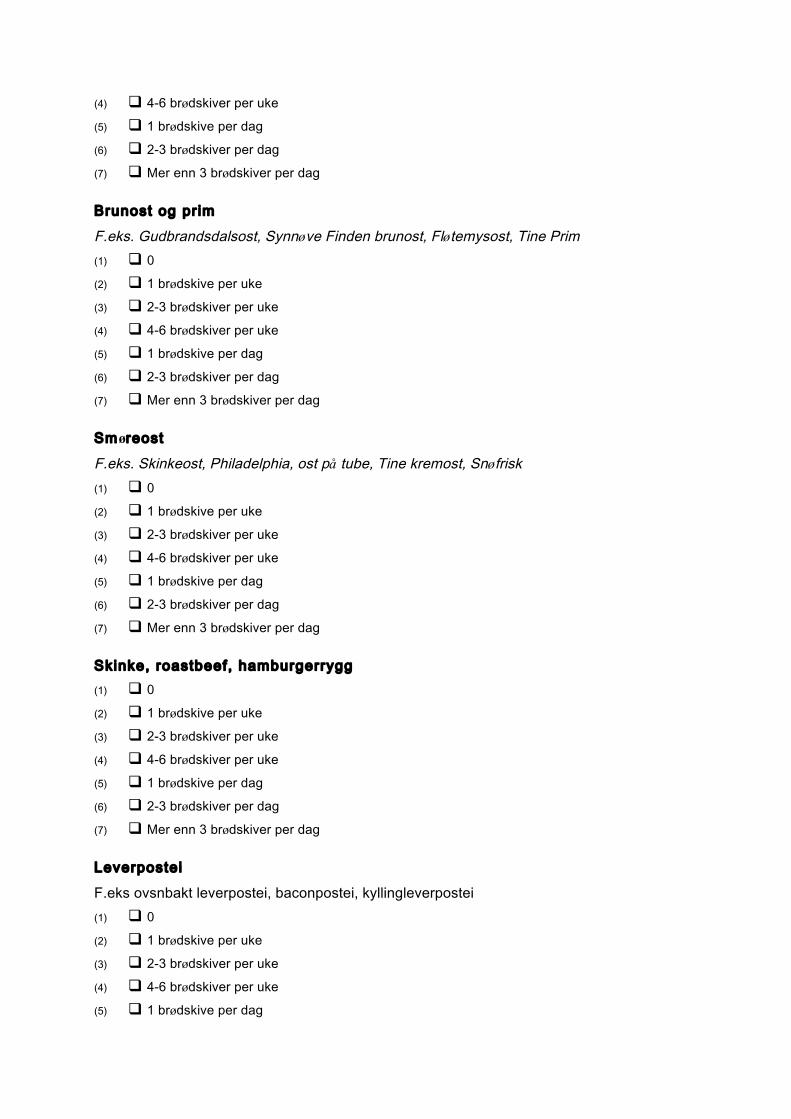
(4) q 4-6 brødskiver per uke
(5) q 1 brødskive per dag
(6) q 2-3 brødskiver per dag
(7) q Mer enn 3 brødskiver per dag
Brunost og prim
F.eks. Gudbrandsdalsost, Synnøve Finden brunost, Fløtemysost, Tine Prim (1) q 0
(2) q 1 brødskive per uke
(3) q 2-3 brødskiver per uke
(4) q 4-6 brødskiver per uke
(5) q 1 brødskive per dag
(6) q 2-3 brødskiver per dag
(7) q Mer enn 3 brødskiver per dag
Smøreost
F.eks. Skinkeost, Philadelphia, ost på tube, Tine kremost, Snøfrisk (1) q 0
(2) q 1 brødskive per uke
(3) q 2-3 brødskiver per uke
(4) q 4-6 brødskiver per uke
(5) q 1 brødskive per dag
(6) q 2-3 brødskiver per dag
(7) q Mer enn 3 brødskiver per dag
Skinke, roastbeef, hamburgerrygg (1) q 0
(2) q 1 brødskive per uke
(3) q 2-3 brødskiver per uke
(4) q 4-6 brødskiver per uke
(5) q 1 brødskive per dag
(6) q 2-3 brødskiver per dag
(7) q Mer enn 3 brødskiver per dag
Leverpostei
F.eks ovsnbakt leverpostei, baconpostei, kyllingleverpostei (1) q 0
(2) q 1 brødskive per uke
(3) q 2-3 brødskiver per uke
(4) q 4-6 brødskiver per uke
(5) q 1 brødskive per dag
(6) q 2-3 brødskiver per dag
(7) q Mer enn 3 brødskiver per dag
Salami, servelat o. l . (1) q 0
(2) q 1 brødskive per uke
(3) q 2-3 brødskiver per uke
(4) q 4-6 brødskiver per uke
(5) q 1 brødskive per dag
(6) q 2-3 brødskiver per dag
(7) q Mer enn 3 brødskiver per dag
Kyll ing- el ler kalkunpålegg (1) q 0
(2) q 1 brødskive per uke
(3) q 2-3 brødskiver per uke
(4) q 4-6 brødskiver per uke
(5) q 1 brødskive per uke
(6) q 2-3 brødskiver per dag
(7) q Mer enn 3 brødskiver per dag
Majonessalat: I tal iensk salat el ler rekesalat o. l . (1) q 0
(2) q 1 brødskive per uke
(3) q 2-3 brødskiver per uke
(4) q 4-6 brødskiver per uke
(5) q 1 brødskive per dag
(6) q 2-3 brødskiver per dag
(7) q Mer enn 3 brødskiver per dag
Egg på brødskive
Kokt, stekt, speilegg, eggerøre (1) q 0
(2) q 1 brødskive per uke
(3) q 2-3 brødskiver per uke
(4) q 4-6 brødskiver per uke
(5) q 1 brødskive per dag
(6) q 2-3 brødskiver per dag
(7) q Mer enn 3 brødskiver per dag
Kaviar F.eks. Mills kaviar, Stabbur-kaviar (1) q 0
(2) q 1 brødskive per uke
(3) q 2-3 brødskiver per uke
(4) q 4-6 brødskiver per uke
(5) q 1 brødskive per dag
(6) q 2-3 brødskiver per dag
(7) q Mer enn 3 brødskiver per dag
Fiskepålegg F.eks. makrell i tomat, tunfisk, sild (1) q 0
(2) q 1 brødskive per uke
(3) q 2-3 brødskiver per uke
(4) q 4-6 brødskiver per uke
(5) q 1 brødskive per dag
(6) q 2-3 brødskiver per dag
(7) q Mer enn 3 brødskiver per dag
Sjokoladepålegg el ler nøt tepålegg F.eks. Nugatti, Sjokonøtt, Milky-Way (1) q 0
(2) q 1 brødskive per uke
(3) q 2-3 brødskiver per uke
(4) q 4-6 brødskiver per uke
(5) q 1 brødskive per dag
(6) q 2-3 brødskiver per dag
(7) q Mer enn 3 brødskiver per dag
Hapå, Banos (1) q 0
(2) q 1 brødskive per uke
(3) q 2-3 brødskiver per uke
(4) q 4-6 brødskiver per uke
(5) q 1 brødskive per dag
(6) q 2-3 brødskiver per dag
(7) q Mer enn 3 brødskiver per dag
Syltetøy (1) q 0
(2) q 1 brødskive per uke
(3) q 2-3 brødskiver per uke
(4) q 4-6 brødskiver per uke
(5) q 1 brødskive per dag
(6) q 2-3 brødskiver per dag
(7) q Mer enn 3 brødskiver per dag
Honning (1) q 0
(2) q 1 brødskive per uke
(3) q 2-3 brødskiver per uke
(4) q 4-6 brødskiver per uke
(5) q 1 brødskive per dag
(6) q 2-3 brødskiver per dag
(7) q Mer enn 3 brødskiver per dag
Peanøt tsmør (1) q 0
(2) q 1 brødskive per uke
(3) q 2-3 brødskiver per uke
(4) q 4-6 brødskiver per uke
(5) q 1 brødskive per uke
(6) q 2-3 brødskiver per dag
(7) q Mer enn 3 brødskiver per dag
HOVEDRETTER- MIDDAG
Hvor ofte har ditt barn spist?
Kjøt tkaker/karbonader (1) q Aldri
(2) q 1-3 ganger per måned
(3) q 1 gang per uke
(4) q 2-4 ganger per uke
(5) q Mer enn 4 ganger per uke
Pølser F.eks. Wienerpølser, grillpølser, ostepølse (1) q Aldri
(2) q 1-3 ganger per måned
(3) q 1 gang per uke
(4) q 2-4 ganger per uke
(5) q Mer enn 4 ganger per uke
Svinekjøt t , oksekjøt t , lammekjøt t
F.eks kotelett, stek, biff (1) q Aldri
(2) q 1-3 ganger per måned
(3) q 1 gang per uke (4) q 2-4 ganger per uke
(5) q Mer enn 4 ganger per uke
Taco (tacoskjel l el ler wraps med kjøt tdeig) (1) q Aldri
(2) q 1-3 ganger per måned
(3) q 1 gang per uke
(4) q 2-4 ganger per uke
(5) q Mer enn 4 ganger per uke
Hamburgere (1) q Aldri
(2) q 1-3 ganger per måned
(3) q 1 gang per uke
(4) q 2-4 ganger per uke
(5) q Mer enn 4 ganger per uke
Pizza (1) q Aldri
(2) q 1-3 ganger per måned
(3) q 1 gang per uke
(4) q 2-4 ganger per uke
(5) q Mer enn 4 ganger per uke
Gryteretter
F.eks. risotto, lapskaus, gryterett med kjøtt (1) q Aldri
(2) q 1-3 ganger per måned
(3) q 1 gang per uke
(4) q 2-4 ganger per uke
(5) q Mer enn 4 ganger per uke
Pastaretter med kjøt t F.eks. lasagne, spaghetti med kjøttsaus (1) q Aldri
(2) q 1-3 ganger per måned
(3) q 1 gang per uke
(4) q 2-4 ganger per uke
(5) q Mer enn 4 ganger per uke
Kyl l ing el ler kalkun F.eks grillet, filét, kyllinglår (1) q Aldri
(2) q 1-3 ganger per måned
(3) q 1 gang per uke
(4) q 2-4 ganger per uke
(5) q Mer enn 4 ganger per uke
Kyl l ingnuggets
F.eks. Prior Nuggets (1) q Aldri
(2) q 1-3 ganger per måned
(3) q 1 gang per uke
(4) q 2-4 ganger per uke
(5) q Mer enn 4 ganger per uke
Kyl l ingburger (1) q Aldri
(2) q 1-3 ganger per måned
(3) q 1 gang per uke
(4) q 2-4 ganger per uke
(5) q Mer enn 4 ganger per uke
Egg, stekt, spei legg el ler omelett (1) q Aldri
(2) q 1-3 ganger per måned
(3) q 1 gang per uke
(4) q 2-4 ganger per uke
(5) q Mer enn 4 ganger per uke
Pai med kjøt t e l ler grønnsaker (1) q Aldri
(2) q 1-3 ganger per måned
(3) q 1 gang per uke
(4) q 2-4 ganger per uke
(5) q Mer enn 4 ganger per uke
Fet f isk
F.eks laks, ørret, makrell (både kokt eller stekt) (1) q Aldri
(2) q 1-3 ganger per måned
(3) q 1 gang per uke
(4) q 2-4 ganger per uke
(5) q Mer enn 4 ganger per uke
Mager f isk F.eks torsk, sei (både kokt eller stekt) (1) q Aldri
(2) q 1-3 ganger per måned
(3) q 1 gang per uke
(4) q 2-4 ganger per uke
(5) q Mer enn 4 ganger per uke
Fiskeprodukter
F.eks fiskeboller, fiskekaker, fiskepudding, fiskepinner (1) q Aldri (2) q 1-3 ganger per måned
(3) q 1 gang per uke
(4) q 2-4 ganger per uke
(5) q Mer enn 4 ganger per uke
Retter med bønner, l inser el ler erter
F.eks falafell, hummus, bønnegryte, linsesuppe (1) q Aldri
(2) q 1-3 ganger per måned
(3) q 1 gang per uke
(4) q 2-4 ganger per uke
(5) q Mer enn 4 ganger per uke
Suppe F.eks tomatsuppe, grønnsakssuppe (1) q Aldri
(2) q 1-3 ganger per måned
(3) q 1 gang per uke
(4) q 2-4 ganger per uke
(5) q Mer enn 4 ganger per uke
Pannekaker (1) q Aldri
(2) q 1-3 ganger per måned
(3) q 1 gang per uke
(4) q 2-4 ganger per uke
(5) q Mer enn 4 ganger per uke
Risensynsgrøt (1) q Aldri
(2) q 1-3 ganger per måned
(3) q 1 gang per uke
(4) q 2-4 ganger per uke
(5) q Mer enn 4 ganger per uke
TILBEHØR TIL MIDDAG
Hvor ofte har ditt barn spist?
Poteter, kokt, most (1) q Aldri
(2) q 1-3 ganger per måned
(3) q 1 gang per uke
(4) q 2-4 ganger per uke
(5) q Mer enn 4 ganger per uke
Pommes fr i tes (1) q Aldri
(2) q 1-3 ganger per måned
(3) q 1 gang per uke
(4) q 2-4 ganger per uke
(5) q Mer enn 4 ganger per uke
Potetsalat el ler grat inerte poteter (1) q Aldri
(2) q 1-3 ganger per måned
(3) q 1 gang per uke
(4) q 2-4 ganger per uke
(5) q Mer enn 4 ganger per uke
Stekte poteter (1) q Aldri
(2) q 1-3 ganger per måned
(3) q 1 gang per uke
(4) q 2-4 ganger per uke
(5) q Mer enn 4 ganger per uke
Ris (1) q Aldri
(2) q 1-3 ganger per måned
(3) q 1 gang per uke uke
(4) q 2-4 ganger per uke
(5) q Mer enn 4 ganger per uke
Nudler/pasta/spaghett i (1) q Aldri
(2) q 1-3 ganger per måned
(3) q 1 gang per uke (4) q 2-4 ganger per uke
(5) q Mer enn 4 ganger per uke
Saus
F.eks brun saus, hvit saus, bernaisesaus (1) q Aldri
(2) q 1-3 ganger per måned
(3) q 1 gang per uke (4) q 2-3 ganger per uke
(5) q 4-6 ganger per uke
(6) q 1 eller flere ganger per dag
Rømme el ler creme fraiche
F.eks dip (1) q Aldri
(2) q 1-3 ganger per måned
(3) q 1 gang per uke
(4) q 2-3 ganger per uke
(5) q 4-6 ganger per uke
(6) q 1 eller flere ganger per dag
Dressing (1) q Aldri
(2) q 1-3 ganger per måned
(3) q 1 gang per uke
(4) q 2-3 ganger per uke
(5) q 4-6 ganger per uke
(6) q 1 eller flere ganger per dag
Ketchup (1) q Aldri
(2) q 1-3 ganger per måned
(3) q 1 gang per uke
(4) q 2-3 ganger per uke
(5) q 4-6 ganger per uke
(6) q 1 eller flere ganger per dag
Sennep (1) q Aldri
(2) q 1-3 ganger per måned
(3) q 1 gang per uke
(4) q 2-3 ganger per uke
(5) q 4-6 ganger per uke
(6) q 1 eller flere ganger per dag
Majones el ler remulade (1) q Aldri
(2) q 1-3 ganger per måned
(3) q 1 gang per uke (4) q 2-3 ganger per uke
(5) q 4-6 ganger per uke
(6) q 1 eller flere ganger per dag
Hvor mange teskjeer med sukker t i lsetter du i grøt /pannekaker? (1) q Ingen
(2) q 1-3 teskjeer per måned
(3) q 1 teskje per uke
(4) q 2-3 teskjeer per uke
(5) q 4-6 teskjeer per uke
(6) q 1 teskje eller flere per dag
Hvor ofte salter du maten? F.eks. tilsatt ekstra salt selv til middag (1) q Aldri
(2) q 1-3 ganger per måned
(3) q 1 gang per uke
(4) q 2-3 ganger per uke
(5) q 4-6 ganger per uke
(6) q 1 eller flere ganger per dag
FRUKT OG GRØNNSAKER
Hvor ofte har ditt barn spist?
Epler (1 eple) (1) q Aldri
(2) q 1-3 ganger per måned
(3) q 1 gang per uke
(4) q 2-3 ganger per uke
(5) q 4-6 ganger per uke
(6) q 1 eller flere ganger per dag
Pære (1 pære) (1) q Aldri
(2) q 1-3 ganger per måned
(3) q 1 gang per uke
(4) q 2-3 ganger per uke
(5) q 4-6 ganger per uke
(6) q 1 eller flere ganger per dag
Banan (1 banan) (1) q Aldri
(2) q 1-3 ganger per måned
(3) q 1 gang per uke
(4) q 2-3 ganger per uke
(5) q 4-6 ganger per uke
(6) q 1 eller flere ganger per dag
Appelsin, mandarin, grapefrukt (1/2- 1 appelsin/madarin/grapefrukt) (1) q Aldri
(2) q 1-3 ganger per måned
(3) q 1 gang per uke
(4) q 2-3 ganger per uke
(5) q 4-6 ganger per uke
(6) q 1 eller flere ganger per dag
Nektarin, fersken el ler plomme (1 nektarin/fersken/plomme) (1) q Aldri
(2) q 1-3 ganger per måned
(3) q 1 gang per uke
(4) q 2-3 ganger per uke
(5) q 4-6 ganger per uke
(6) q 1 eller flere ganger per dag
Melon (1 skive) (1) q Aldri
(2) q 1-3 ganger per måned
(3) q 1 gang per uke
(4) q 2-3 ganger per uke
(5) q 4-6 ganger per uke
(6) q 1 eller flere ganger per dag
Kiwi (1 kiwi) (1) q Aldri
(2) q 1-3 ganger per måned
(3) q 1 gang per uke
(4) q 2-3 ganger per uke
(5) q 4-6 ganger per uke
(6) q 1 eller flere ganger per dag
Ananas (1 skive) (1) q Aldri
(2) q 1-3 ganger per måned
(3) q 1 gang per uke
(4) q 2-3 ganger per uke
(5) q 4-6 ganger per uke
(6) q 1 eller flere ganger per dag
Bær, fr iske el ler frosne (1 bol le) F.eks jordbær, blåbær, solbær, bringebær (1) q Aldri
(2) q 1-3 ganger per måned
(3) q 1 gang per uke
(4) q 2-3 ganger per uke
(5) q 4-6 ganger per uke
(6) q 1 eller flere ganger per dag
Druer (1 neve) (1) q Aldri
(2) q 1-3 ganger per måned
(3) q 1 gang per uke
(4) q 2-3 ganger per uke
(5) q 4-6 ganger per uke
(6) q 1 eller flere ganger per dag
Rosiner (1/2 neve) (1) q Aldri
(2) q 1-3 ganger per måned
(3) q 1 gang per uke
(4) q 2-3 ganger per uke
(5) q 4-6 ganger per uke
(6) q 1 eller flere ganger per dag
Tørket frukt (1/2 neve)
F.eks aprikos, svisker, dadler (1) q Aldri
(2) q 1-3 ganger per måned
(3) q 1 gang per uke
(4) q 2-3 ganger per uke
(5) q 4-6 ganger per uke
(6) q 1 eller flere ganger per dag
Brokkoli (2 buketter) (1) q Aldri
(2) q 1-3 ganger per måned
(3) q 1 gang per uke
(4) q 2-3 ganger per uke
(5) q 4-6 ganger per uke
(6) q 1 eller flere ganger per dag
Blomkål (2 buketter) (1) q Aldri
(2) q 1-3 ganger per måned (3) q 1 gang per uke
(4) q 2-3 ganger per uke
(5) q 4-6 ganger per uke
(6) q 1 eller flere ganger per dag
Løk, hvit løk el ler purre (1 spiseskje) (1) q Aldri
(2) q 1-3 ganger per måned
(3) q 1 gang per uke
(4) q 2-3 ganger per uke
(5) q 4-6 ganger per uke
(6) q 1 eller flere ganger per dag
Avokado (1/2 avokado) (1) q Aldri
(2) q 1-3 ganger per måned
(3) q 1 gang per uke
(4) q 2-3 ganger per uke
(5) q 4-6 ganger per uke
(6) q 1 eller flere ganger per dag
Mais (1/2 kolbe= 2 spiseskjeer) (1) q Aldri
(2) q 1-3 ganger per måned
(3) q 1 gang per uke
(4) q 2-3 ganger per uke
(5) q 4-6 ganger per uke
(6) q 1 eller flere ganger per dag
Sopp (1 spiseskje) (1) q Aldri
(2) q 1-3 ganger per måned
(3) q 1 gang per uke
(4) q 2-3 ganger per uke
(5) q 4-6 ganger per uke
(6) q 1 eller flere ganger per dag
Erter (1 spiseskje) (1) q Aldri
(2) q 1-3 ganger per måned
(3) q 1 gang per uke
(4) q 2-3 ganger per uke
(5) q 4-6 ganger per uke
(6) q 1 eller flere ganger per dag
Blandet salat (1 porsjon) F.eks isbergsalat/hjertesalat/rosso-salat med tomat og agurk (1) q Aldri
(2) q 1-3 ganger per måned
(3) q 1 gang per uke
(4) q 2-3 ganger per uke
(5) q 4-6 ganger per uke
(6) q 1 eller flere ganger per dag
Spinat (2 spiseskjeer) (1) q Aldri
(2) q 1-3 ganger per måned
(3) q 1 gang per uke
(4) q 2-3 ganger per uke
(5) q 4-6 ganger per uke
(6) q 1 eller flere ganger per dag
Grønn, gul, orange el ler rød paprika (1 r ing) (1) q Aldri
(2) q 1-3 ganger per måned
(3) q 1 gang per uke
(4) q 2-3 ganger per uke
(5) q 4-6 ganger per uke
(6) q 1 eller flere ganger per dag
Gulrøt ter (1 gulrot) (1) q Aldri
(2) q 1-3 ganger per måned
(3) q 1 gang per uke
(4) q 2-3 ganger per uke
(5) q 4-6 ganger per uke
(6) q 1 eller flere ganger per dag
Agurk (ca.4-5 cm) (1) q Aldri
(2) q 1-3 ganger per måned (3) q 1 gang per uke
(4) q 2-3 ganger per uke
(5) q 4-6 ganger per uke
(6) q 1 eller flere ganger per dag
Tomat (1 tomat) (1) q Aldri
(2) q 1-3 ganger per måned
(3) q 1 gang per uke
(4) q 2-3 ganger per uke
(5) q 4-6 ganger per uke
(6) q 1 eller flere ganger per dag
Andre grønnsaker Skriv under hva slags grønnsak (1) q Hva: __________
(3) q 1-3 ganger per måned
(4) q 1 gang per uke
(5) q 2-3 ganger per uke
(6) q 4-6 ganger per uke
(7) q 1 eller flere ganger per dag
DESSERT OG KAKER
Hvor ofte har ditt barn spist?
Fløte is (1 kule el ler pinne) F.eks vanilje, krokan, jordbær (1) q Aldri
(2) q 1-3 ganger per måned
(3) q 1 gang per uke
(4) q 2-3 ganger per uke
(5) q 4-6 ganger per uke
(6) q 1 eller flere ganger per dag
Saft is (1 pinne) (1) q Aldri
(2) q 1-3 ganger per måned
(3) q 1 gang per uke
(4) q 2-3 ganger per uke
(5) q 4-6 ganger per uke
(6) q 1 eller flere ganger per dag
Pudding og fromasj (1 beger)
F.eks sjokoladepudding, mandelpudding, karamellpudding, sitronfromasj (1) q Aldri
(2) q 1-3 ganger per måned
(3) q 1 gang per uke
(4) q 2-3 ganger per uke
(5) q 4-6 ganger per uke
(6) q 1 eller flere ganger per dag
Rislunsj og r iskrem (1 beger) F.eks rislunsj, risifrutti, pianodessert (1) q Aldri
(2) q 1-3 ganger per måned
(3) q 1 gang per uke
(4) q 2-3 ganger per uke
(5) q 4-6 ganger per uke
(6) q 1 eller flere ganger per dag
Hvor ofte har ditt barn spist?
Gelé (1 porsjon) (1) q Aldri
(2) q 1-3 ganger per måned
(3) q 1 gang per uke
(4) q 2-3 ganger per uke
(5) q 4-6 ganger per uke
(6) q 1 eller flere ganger per dag
Hermetisk frukt (1 porsjon) F.eks hermetiske aprikoser, pærer, ananas, cocktailblanding (1) q Aldri
(2) q 1-3 ganger per måned
(3) q 1 gang per uke
(4) q 2-3 ganger per uke
(5) q 4-6 ganger per uke
(6) q 1 eller flere ganger per dag
Pai (1 stykke) F.eks eplepai, blåbærpai, sjokoladepai (1) q Aldri
(2) q 1-3 ganger per måned
(3) q 1 gang per uke
(4) q 2-3 ganger per uke
(5) q 4-6 ganger per uke
(6) q 1 eller flere ganger per dag
Fløte, krem (1/2 kopp)
F.eks som tilbehør til jordbær, til kake, varm sjokolade (1) q Aldri
(2) q 1-3 ganger per måned
(3) q 1 gang per uke
(4) q 2-3 ganger per uke
(5) q 4-6 ganger per uke
(6) q 1 eller flere ganger per dag
Vanil jesaus (1/2 kopp)
F.eks som tilbehør til sjokoladepudding, varme bær (1) q Aldri
(2) q 1-3 ganger per måned
(3) q 1 gang per uke
(4) q 2-3 ganger per uke
(5) q 4-6 ganger per uke
(6) q 1 eller flere ganger per dag
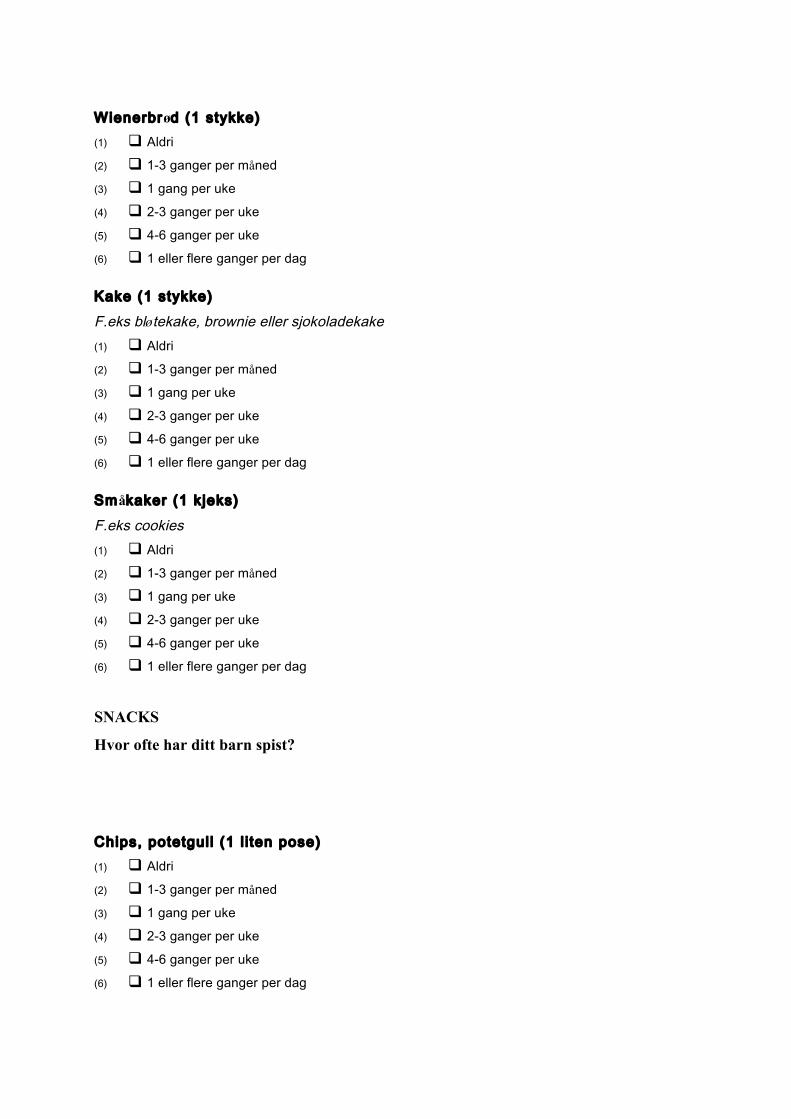
Wienerbrød (1 stykke) (1) q Aldri
(2) q 1-3 ganger per måned
(3) q 1 gang per uke
(4) q 2-3 ganger per uke
(5) q 4-6 ganger per uke
(6) q 1 eller flere ganger per dag
Kake (1 stykke) F.eks bløtekake, brownie eller sjokoladekake (1) q Aldri
(2) q 1-3 ganger per måned
(3) q 1 gang per uke
(4) q 2-3 ganger per uke
(5) q 4-6 ganger per uke
(6) q 1 eller flere ganger per dag
Småkaker (1 kjeks) F.eks cookies (1) q Aldri
(2) q 1-3 ganger per måned
(3) q 1 gang per uke
(4) q 2-3 ganger per uke
(5) q 4-6 ganger per uke
(6) q 1 eller flere ganger per dag
SNACKS
Hvor ofte har ditt barn spist?
Chips, potetgul l (1 l i ten pose) (1) q Aldri
(2) q 1-3 ganger per måned
(3) q 1 gang per uke
(4) q 2-3 ganger per uke
(5) q 4-6 ganger per uke
(6) q 1 eller flere ganger per dag
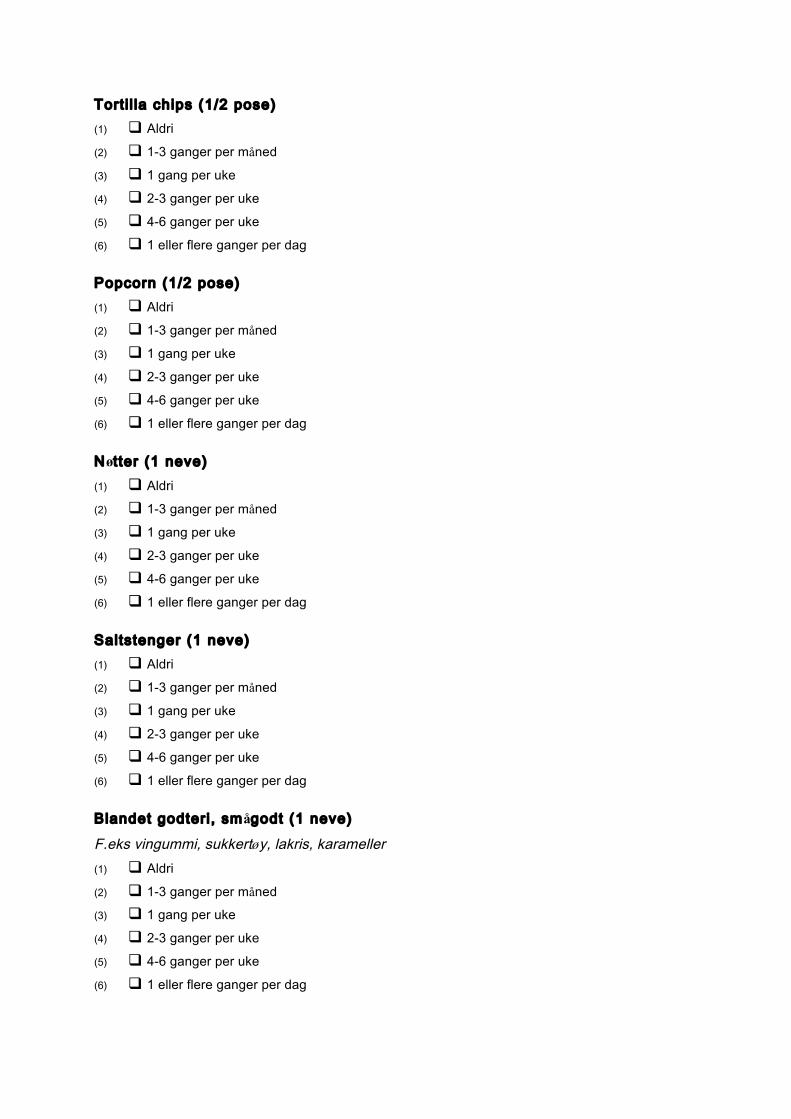
Tort i l la chips (1/2 pose) (1) q Aldri
(2) q 1-3 ganger per måned
(3) q 1 gang per uke
(4) q 2-3 ganger per uke
(5) q 4-6 ganger per uke
(6) q 1 eller flere ganger per dag
Popcorn (1/2 pose) (1) q Aldri
(2) q 1-3 ganger per måned
(3) q 1 gang per uke
(4) q 2-3 ganger per uke
(5) q 4-6 ganger per uke
(6) q 1 eller flere ganger per dag
Nøt ter (1 neve) (1) q Aldri
(2) q 1-3 ganger per måned
(3) q 1 gang per uke
(4) q 2-3 ganger per uke
(5) q 4-6 ganger per uke
(6) q 1 eller flere ganger per dag
Saltstenger (1 neve) (1) q Aldri
(2) q 1-3 ganger per måned
(3) q 1 gang per uke
(4) q 2-3 ganger per uke
(5) q 4-6 ganger per uke
(6) q 1 eller flere ganger per dag
Blandet godteri , smågodt (1 neve)
F.eks vingummi, sukkertøy, lakris, karameller (1) q Aldri
(2) q 1-3 ganger per måned (3) q 1 gang per uke
(4) q 2-3 ganger per uke
(5) q 4-6 ganger per uke
(6) q 1 eller flere ganger per dag
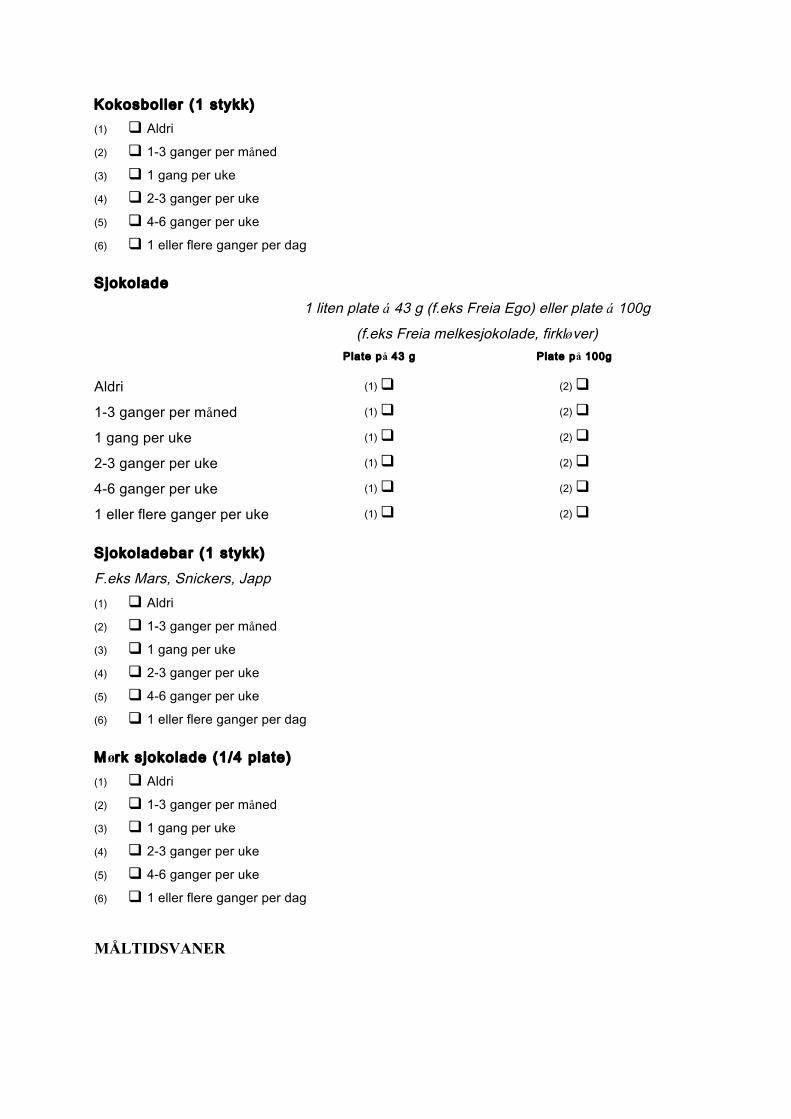
Kokosboller (1 stykk) (1) q Aldri
(2) q 1-3 ganger per måned
(3) q 1 gang per uke
(4) q 2-3 ganger per uke
(5) q 4-6 ganger per uke
(6) q 1 eller flere ganger per dag
Sjokolade 1 liten plate á 43 g (f.eks Freia Ego) eller plate á 100g
(f.eks Freia melkesjokolade, firkløver) Plate på 43 g Plate på 100g
Aldri (1) q (2) q
1-3 ganger per måned (1) q (2) q
1 gang per uke (1) q (2) q
2-3 ganger per uke (1) q (2) q
4-6 ganger per uke (1) q (2) q
1 eller flere ganger per uke (1) q (2) q
Sjokoladebar (1 stykk)
F.eks Mars, Snickers, Japp (1) q Aldri
(2) q 1-3 ganger per måned
(3) q 1 gang per uke
(4) q 2-3 ganger per uke
(5) q 4-6 ganger per uke
(6) q 1 eller flere ganger per dag
Mørk sjokolade (1/4 plate) (1) q Aldri
(2) q 1-3 ganger per måned
(3) q 1 gang per uke
(4) q 2-3 ganger per uke
(5) q 4-6 ganger per uke
(6) q 1 eller flere ganger per dag
MÅLTIDSVANER
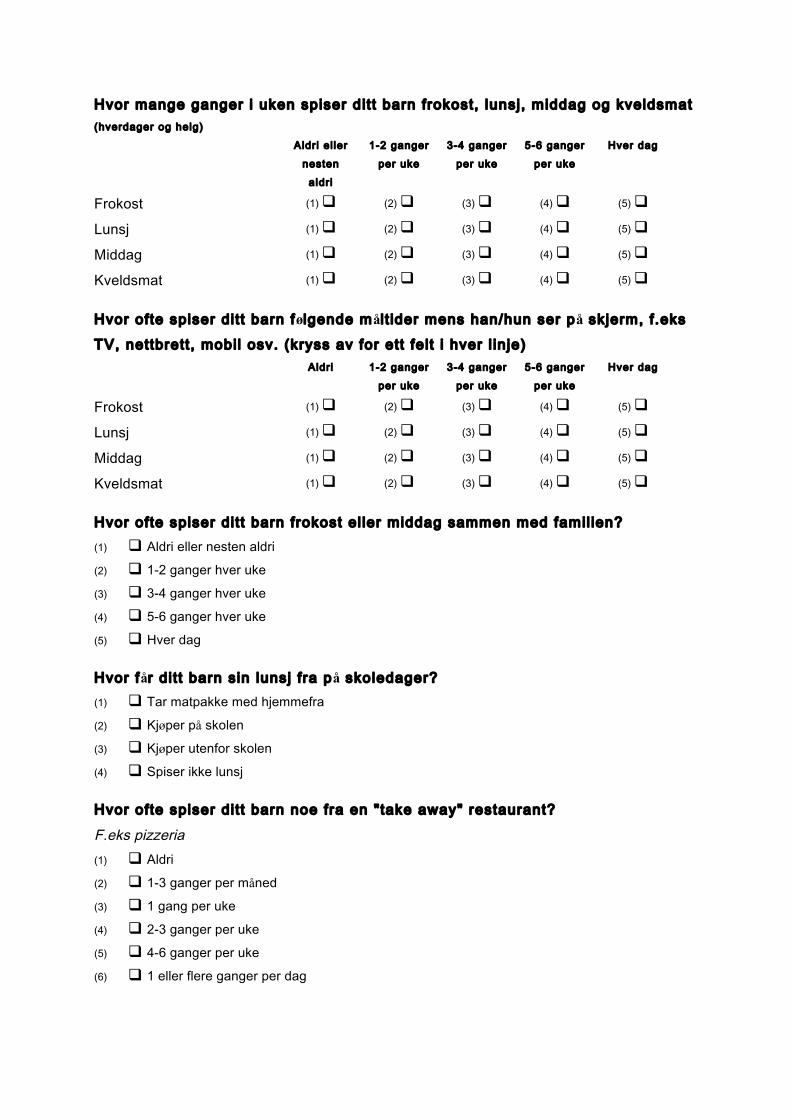
Hvor mange ganger i uken spiser dit t barn frokost, lunsj, middag og kveldsmat (hverdager og helg)
Aldri el ler nesten
aldri
1-2 ganger per uke
3-4 ganger per uke
5-6 ganger per uke
Hver dag
Frokost (1) q (2) q (3) q (4) q (5) q
Lunsj (1) q (2) q (3) q (4) q (5) q
Middag (1) q (2) q (3) q (4) q (5) q
Kveldsmat (1) q (2) q (3) q (4) q (5) q
Hvor ofte spiser dit t barn følgende mål t ider mens han/hun ser på skjerm, f .eks TV, nettbrett, mobil osv. (kryss av for ett felt i hver l in je) Aldri 1-2 ganger
per uke 3-4 ganger
per uke 5-6 ganger
per uke Hver dag
Frokost (1) q (2) q (3) q (4) q (5) q
Lunsj (1) q (2) q (3) q (4) q (5) q
Middag (1) q (2) q (3) q (4) q (5) q
Kveldsmat (1) q (2) q (3) q (4) q (5) q
Hvor ofte spiser dit t barn frokost el ler middag sammen med famil ien? (1) q Aldri eller nesten aldri
(2) q 1-2 ganger hver uke
(3) q 3-4 ganger hver uke
(4) q 5-6 ganger hver uke
(5) q Hver dag
Hvor får dit t barn sin lunsj fra på skoledager? (1) q Tar matpakke med hjemmefra
(2) q Kjøper på skolen
(3) q Kjøper utenfor skolen
(4) q Spiser ikke lunsj
Hvor ofte spiser dit t barn noe fra en "take away" restaurant?
F.eks pizzeria (1) q Aldri
(2) q 1-3 ganger per måned
(3) q 1 gang per uke
(4) q 2-3 ganger per uke
(5) q 4-6 ganger per uke
(6) q 1 eller flere ganger per dag
Hvor ofte spiser dit t barn noe fra en fast food restaurant? F.eks Mc Donalds, Burger King, bensinstasjon (1) q Aldri
(2) q 1-3 ganger per måned
(3) q 1 gang per uke
(4) q 2-3 ganger per uke
(5) q 4-6 ganger per uke
(6) q 1 eller flere ganger per dag
Hvor ofte har dit t barn tatt følgende? Aldri 1-2 ganger
per måned 3-5 ganger per måned
1-2 ganger per uke
3 el ler f lere
ganger per uke
Tran eller andre flytende omega-3 tilskudd (1
spiseskje)
(1) q (2) q (3) q (4) q (5) q
Tran- eller fiskeoljekapsler (1) q (2) q (3) q (4) q (5) q
Multivitamintilskudd (eks.
Nycoplus, Sana Sol,
vitaminbjørner)
(1) q (2) q (3) q (4) q (5) q
Multivitaminer med
mineraler
(1) q (2) q (3) q (4) q (5) q
Jerntabletter (1) q (2) q (3) q (4) q (5) q
Vitamin C (1) q (2) q (3) q (4) q (5) q
Vitamin D (1) q (2) q (3) q (4) q (5) q
Annet
Har ditt barn tatt noe annet kosttilskudd enn det som står nevnt overfor? Hvis ja: hva og hvor ofte?
________________________________________
________________________________________
________________________________________
________________________________________ ________________________________________
Har dit t barn noen former for matvareal lergi? (1) q Ja
(2) q Nei
Hvilken? (1) q Melk
(2) q Egg
(3) q Nøtter
(4) q Skalldyr
(5) q Annet __________
Er det noe barnet dit t unngår å spise? Hvis ja, hva og hvorfor
(1) q Ja __________
(2) q Nei
Er den siste måneden typisk for hva dit t barn pleier å spise t i l vanl ig? Hvis nei,
hvorfor? (1) q Ja
(2) q Nei __________
De neste spørsmålene dreier seg om tilgjengelighet av enkelte matvarer i hjemmet
(der barnet bor det meste av tiden)
Hvor ofte f innes det brus MED sukker t i lg jengelig i hjemmet? (1) q Aldri
(2) q Sjeldnere enn 1 dag i måneden
(3) q Sjeldnere enn 1 dag i uken
(4) q 1 dag i uken
(5) q 2 dager i uken
(6) q 3 dager i uken
(7) q 4 dager i uken
(8) q 5 dager i uken
(9) q 6 dager i uken
(10) q Alltid/hver dag
Hvor ofte f innes det brus UTEN sukker t i lg jengelig i hjemmet? (1) q Aldri
(2) q Sjeldnere enn 1 dag i måneden
(3) q Sjeldnere enn 1 dag i uken
(4) q 1 dag i uken
(5) q 2 dager i uken
(6) q 3 dager i uken
(7) q 4 dager i uken
(8) q 5 dager i uken
(9) q 6 dager i uken
(10) q Alltid/hver dag
Hvor ofte f innes det søt snacks t i lg jengelig i hjemmet? (godteri , iskrem, kaker,
kjeks, bol ler, osv.) (1) q Aldri
(2) q Sjeldnere enn 1 dag i måneden
(3) q Sjeldnere enn 1 dag i uken
(4) q 1 dag i uken
(5) q 2 dager i uken
(6) q 3 dager i uken
(7) q 4 dager i uken
(8) q 5 dager i uken
(9) q 6 dager i uken
(10) q Alltid/hver dag
Hvor ofte f innes det salt snacks t i lg jengelig i hjemmet? (potetgul l , maischips/doritos, ostepop, osv.) (1) q Aldri
(2) q Sjeldnere enn 1 dag i måneden
(3) q Sjeldnere enn 1 dag i uken
(4) q 1 dag i uken
(5) q 2 dager i uken
(6) q 3 dager i uken
(7) q 4 dager i uken
(8) q 5 dager i uken
(9) q 6 dager i uken
(10) q Alltid/hver dag
Hvor ofte f innes det frukt el ler grønnsaker t i lg jengelig i hjemmet? (1) q Aldri
(2) q Sjeldnere enn 1 dag i måneden
(3) q Sjeldnere enn 1 dag i uken
(4) q 1 dag i uken
(5) q 2 dager i uken
(6) q 3 dager i uken
(7) q 4 dager i uken
(8) q 5 dager i uken
(9) q 6 dager i uken
(10) q Alltid/hver dag
De neste spørsmålene dreier seg om årsaker til at du og din familie vil endre
levevaner.
Det er forskjel l ige grunner t i l at mennesker gjør som de gjør. Følgende
påstander handler om grunner for deg og din famil ie t i l å begynne å endre
levevaner (for eksempel spise sunt, være mer fysisk aktiv) el ler fastholde endrede levevaner over t id. Kryss av fra 1-7 for disse påstandene.
Grunner t i l at meg og min famil ie ønsker å endre el ler fastholde endrede
levevaner er: 1
Stemmer aldri
2 3 4
Stemmer av og t i l
5 6 7
Stemmer
al l t id
Jeg ønsker å ta ansvaret for
min families helse
(1) q (2) q (3) q (4) q (5) q (6) q (7) q
Jeg ville føle skyld eller
skam hvis vi ikke hadde
sunne levevaner
(1) q (2) q (3) q (4) q (5) q (6) q (7) q
Jeg personlig tror det er det
beste for helsen til
familien min
(1) q (2) q (3) q (4) q (5) q (6) q (7) q
Fordi andre vil bli skuffet
over meg hvis jeg ikke gjør
det
(1) q (2) q (3) q (4) q (5) q (6) q (7) q
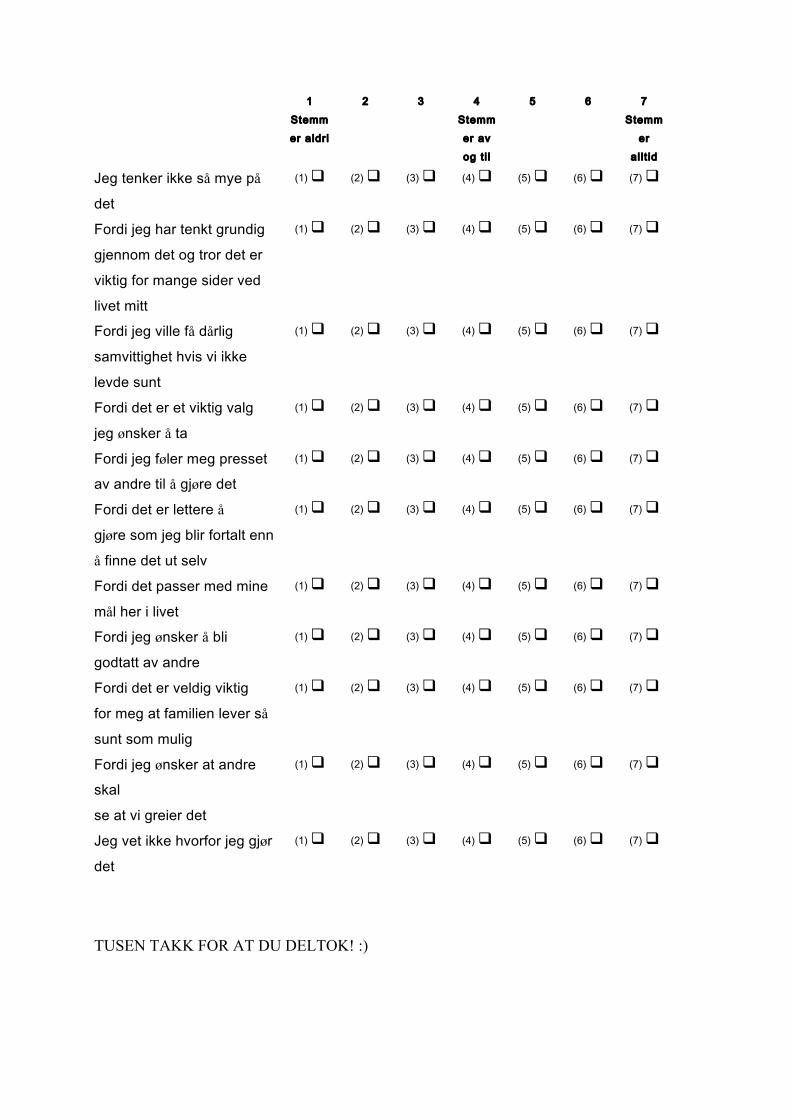
1 Stemmer aldri
2 3 4 Stemmer av og t i l
5 6 7 Stemm
er al l t id
Jeg tenker ikke så mye på
det
(1) q (2) q (3) q (4) q (5) q (6) q (7) q
Fordi jeg har tenkt grundig
gjennom det og tror det er
viktig for mange sider ved
livet mitt
(1) q (2) q (3) q (4) q (5) q (6) q (7) q
Fordi jeg ville få dårlig
samvittighet hvis vi ikke
levde sunt
(1) q (2) q (3) q (4) q (5) q (6) q (7) q
Fordi det er et viktig valg
jeg ønsker å ta
(1) q (2) q (3) q (4) q (5) q (6) q (7) q
Fordi jeg føler meg presset av andre til å gjøre det
(1) q (2) q (3) q (4) q (5) q (6) q (7) q
Fordi det er lettere å
gjøre som jeg blir fortalt enn
å finne det ut selv
(1) q (2) q (3) q (4) q (5) q (6) q (7) q
Fordi det passer med mine
mål her i livet
(1) q (2) q (3) q (4) q (5) q (6) q (7) q
Fordi jeg ønsker å bli
godtatt av andre
(1) q (2) q (3) q (4) q (5) q (6) q (7) q
Fordi det er veldig viktig
for meg at familien lever så
sunt som mulig
(1) q (2) q (3) q (4) q (5) q (6) q (7) q
Fordi jeg ønsker at andre skal
se at vi greier det
(1) q (2) q (3) q (4) q (5) q (6) q (7) q
Jeg vet ikke hvorfor jeg gjør
det
(1) q (2) q (3) q (4) q (5) q (6) q (7) q
TUSEN TAKK FOR AT DU DELTOK! :)
Appendix 2
Hei! Takk for at du vil være med på denne undersøkelsen!
Din og ditt barns deltagelse er viktig for oss, og det er veldig fint hvis du kan fylle ut dette
spørreskjemaet nøyaktig.
Til å begynne med stiller vi et par spørsmål om deg.
Etter det vil vi gjerne at du tenker tilbake på de siste 4 ukene og vi vil spørre deg om
følgende:
- Hvor aktivt barnet ditt har vært de siste 4 ukene
- Hva har barnet ditt spist og drukket de siste 4 ukene
- Måltidsvaner
Du skal sette kryss ved det svaret som passer best for ditt barn. Det er viktig at du leser
spørsmålet og svaralternativene nøye og at du husker å bare sette ETT KRYSS for hvert
spørsmål.
Dersom det er noe du lurer på kan du spørre en av våre medarbeidere om hjelp.
Husk dette før du setter i gang: Vær ærlig! Det er ingen svar som er mer riktige enn andre,
og ingen får vite hva du har svart.
Lykke til med skjemaet!
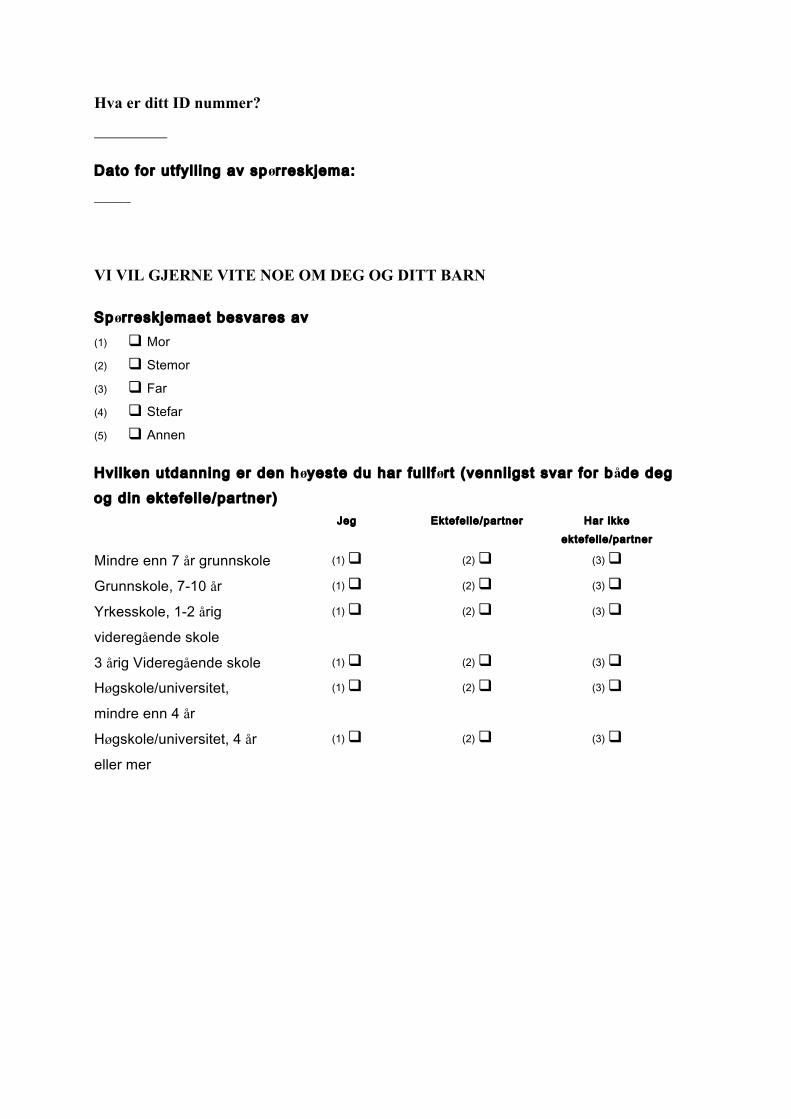
Hva er ditt ID nummer?
__________
Dato for utfyl l ing av spørreskjema:
_____
VI VIL GJERNE VITE NOE OM DEG OG DITT BARN
Spørreskjemaet besvares av (1) q Mor
(2) q Stemor
(3) q Far
(4) q Stefar
(5) q Annen
Hvi lken utdanning er den høyeste du har ful l ført (vennligst svar for både deg og din ektefel le/partner) Jeg Ektefel le/partner Har ikke
ektefel le/partner
Mindre enn 7 år grunnskole (1) q (2) q (3) q
Grunnskole, 7-10 år (1) q (2) q (3) q
Yrkesskole, 1-2 årig
videregående skole
(1) q (2) q (3) q
3 årig Videregående skole (1) q (2) q (3) q
Høgskole/universitet,
mindre enn 4 år
(1) q (2) q (3) q
Høgskole/universitet, 4 år
eller mer
(1) q (2) q (3) q
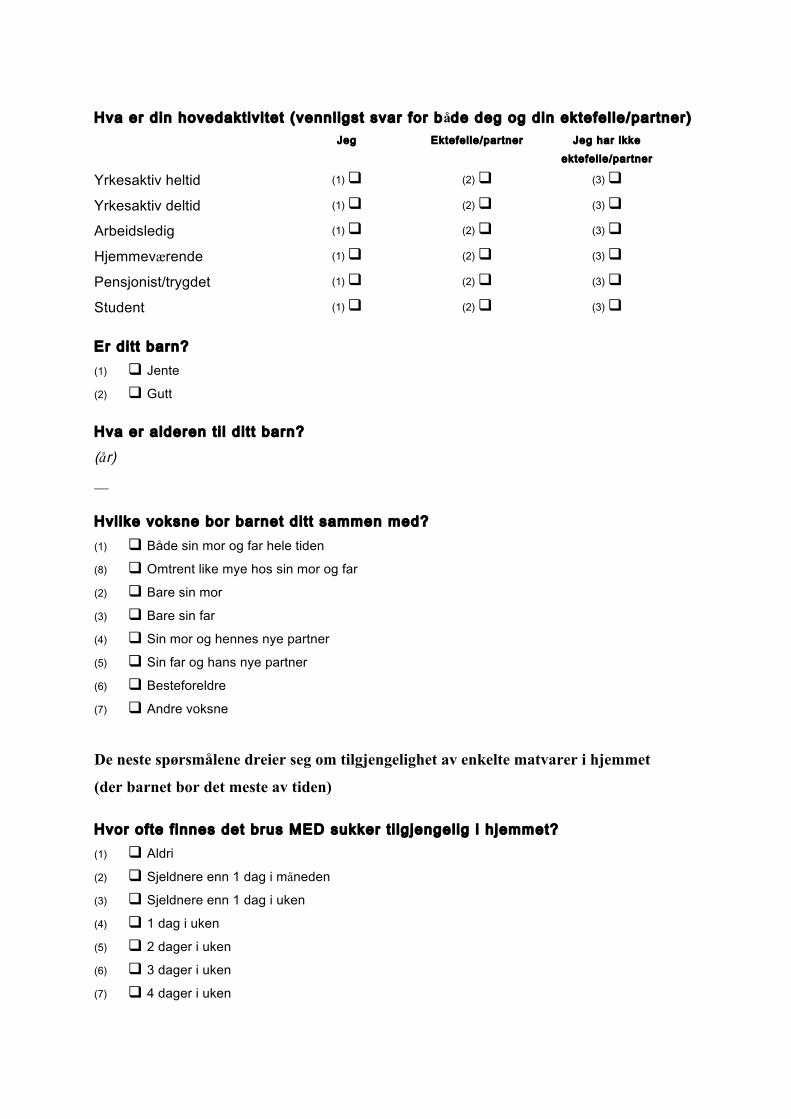
Hva er din hovedaktiv i tet (vennligst svar for både deg og din ektefel le/partner) Jeg Ektefel le/partner Jeg har ikke
ektefel le/partner
Yrkesaktiv heltid (1) q (2) q (3) q
Yrkesaktiv deltid (1) q (2) q (3) q
Arbeidsledig (1) q (2) q (3) q
Hjemmeværende (1) q (2) q (3) q
Pensjonist/trygdet (1) q (2) q (3) q
Student (1) q (2) q (3) q
Er dit t barn? (1) q Jente
(2) q Gutt
Hva er alderen t i l d i t t barn?
(år) __
Hvi lke voksne bor barnet dit t sammen med? (1) q Både sin mor og far hele tiden
(8) q Omtrent like mye hos sin mor og far
(2) q Bare sin mor
(3) q Bare sin far
(4) q Sin mor og hennes nye partner
(5) q Sin far og hans nye partner
(6) q Besteforeldre
(7) q Andre voksne
De neste spørsmålene dreier seg om tilgjengelighet av enkelte matvarer i hjemmet
(der barnet bor det meste av tiden)
Hvor ofte f innes det brus MED sukker t i lg jengelig i hjemmet? (1) q Aldri
(2) q Sjeldnere enn 1 dag i måneden
(3) q Sjeldnere enn 1 dag i uken
(4) q 1 dag i uken
(5) q 2 dager i uken
(6) q 3 dager i uken
(7) q 4 dager i uken

(8) q 5 dager i uken
(9) q 6 dager i uken
(10) q Alltid/hver dag
Hvor ofte f innes det brus UTEN sukker t i lg jengelig i hjemmet? (1) q Aldri
(2) q Sjeldnere enn 1 dag i måneden
(3) q Sjeldnere enn 1 dag i uken
(4) q 1 dag i uken
(5) q 2 dager i uken
(6) q 3 dager i uken
(7) q 4 dager i uken
(8) q 5 dager i uken
(9) q 6 dager i uken
(10) q Alltid/hver dag
Hvor ofte f innes det søt snacks t i lg jengelig i hjemmet? (godteri , iskrem, kaker, kjeks, bol ler, osv.) (1) q Aldri
(2) q Sjeldnere enn 1 dag i måneden
(3) q Sjeldnere enn 1 dag i uken
(4) q 1 dag i uken
(5) q 2 dager i uken
(6) q 3 dager i uken
(7) q 4 dager i uken
(8) q 5 dager i uken
(9) q 6 dager i uken
(10) q Alltid/hver dag
Hvor ofte f innes det salt snacks t i lg jengelig i hjemmet? (potetgul l , maischips/doritos, ostepop, osv.) (1) q Aldri
(2) q Sjeldnere enn 1 dag i måneden
(3) q Sjeldnere enn 1 dag i uken
(4) q 1 dag i uken
(5) q 2 dager i uken
(6) q 3 dager i uken
(7) q 4 dager i uken
(8) q 5 dager i uken
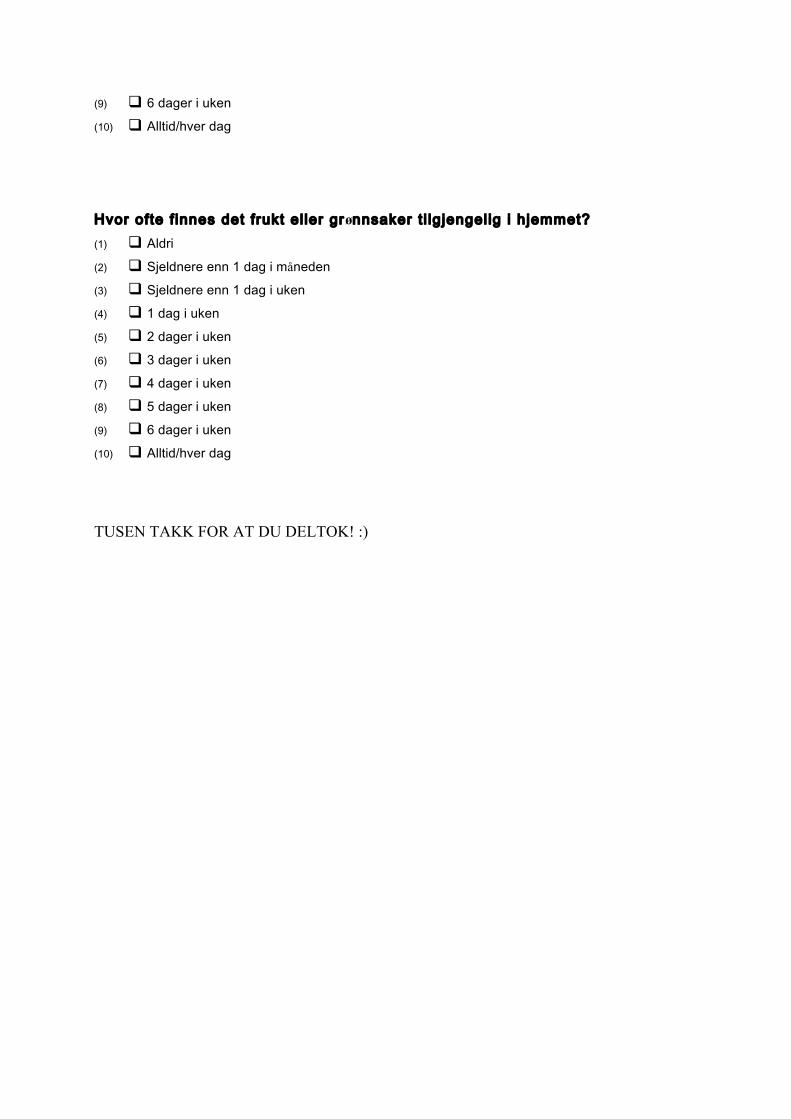
(9) q 6 dager i uken
(10) q Alltid/hver dag
Hvor ofte f innes det frukt el ler grønnsaker t i lg jengelig i hjemmet? (1) q Aldri
(2) q Sjeldnere enn 1 dag i måneden
(3) q Sjeldnere enn 1 dag i uken
(4) q 1 dag i uken
(5) q 2 dager i uken
(6) q 3 dager i uken
(7) q 4 dager i uken
(8) q 5 dager i uken
(9) q 6 dager i uken
(10) q Alltid/hver dag
TUSEN TAKK FOR AT DU DELTOK! :)
Appendix 3
Forespørsel om deltakelse i et forskningsprosjekt
”Helsefremming ved Frisklivssentralene – virker det,
hvordan virker det og hvorfor?”
Bakgrunn og hensikt
Dette er et spørsmål til deg som foresatt til et barn som deltar i kommunens gruppetilbud til barn med begynnende overvekt der det er ønskelig å endre levevaner. Dette gruppetilbudet er del av et forskningsprosjekt der vi ønsker å undersøke nytten av tiltaket. Universitetet i Bergen som er ansvarlig for forskningsprosjektet, samarbeider med Universitetet i Agder, Haukeland Universitetssykehus og flere Frisklivssentraler om undersøkelsen.
Hva innebærer studien?
Som deltaker i forskningsprosjektet ber vi deg om å delta på et intervju sammen med en
helsearbeider, at barnet ditt svarer på noen enkle spørsmål og gjennomfører noen enkle
fysiske tester og at du som foresatt besvarer et spørreskjema som kartlegger deres levevaner
før prosjektstart, og etter henholdsvis 6, 12 og 24 måneder for å kunne gi dere et best mulig
oppfølging underveis og etter avslutning av prosjektet. En del av kartleggingen innebærer at
barnet deres vil bære en aktivitetsmåler rundt armen i én uke, og resten av familien inviteres
også til å bære dette samtidig. Denne aktivitetsmåleren skal ikke skape ubehag eller være
synlig under vanlige klær. Spørreskjemaet tar ca. 20-30 minutter å besvare, og kan fylles ut
via internett hjemme.
Hva skjer med informasjonen om barnet?
Informasjonen som registreres om deg og ditt barn skal dere få tilbakemelding på av en
helsearbeider i prosjektet, og informasjonen skal også kunne brukes som grunnlag for å
skreddersy veiledningen til deres familie. Alle opplysninger blir behandlet uten navn og
fødselsnummer eller andre direkte gjenkjennende opplysninger. En kode knytter ditt barn til
opplysninger og tester gjennom en navneliste. Det er kun autorisert personell knyttet til
prosjektet som har adgang til navnelisten og som kan finne tilbake til barnet. All informasjon
vil bli slettet når undersøkelsen er ferdig. Det vil ikke være mulig å identifisere barnet når
resultatene av studien publiseres.
Frivillig deltakelse Det er frivillig å delta i studien. Du kan når som helst og uten å oppgi noen grunn trekke samtykke til at ditt barn deltar. Dette vil ikke få konsekvenser for barnets videre behandling. Dersom du ønsker at ditt barn skal delta, undertegner du samtykkeerklæringen på neste side. Om du nå sier ja til at barnet deltar, kan du seinere trekke tilbake samtykke uten at det påvirker barnets øvrige tilbud. Dersom du senere ønsker å trekke barnet eller har spørsmål til studien, kan du kontakte Eirik Abildsnes på telefon 90744480 eller Tonje Holte Stea på telefon 41102641.
Samtykke til deltakelse i studien
Jeg er villig til å delta i studien.
---------------------------------------------------------------------------------------------------------------- (Signert av foresatte til barnet, dato)
Jeg bekrefter å ha gitt informasjon om studien til foresatte.
---------------------------------------------------------------------------------------------------------------- (Signert, forskningsprosjektmedarbeider, dato)
Appendix 4
Forespørsel om deltagelse i et forskningsprosjekt.
Spørreskjema om levevaner. Bakgrunn og hensikt
Dette er en henvendelse til foresatte til barn 6-12 år i Søgne.
Bakgrunn for denne spørreundersøkelsen er å kvalitetssikre spørsmål knyttet til fysisk
aktivitet, måltidsrutiner og inntak av mat og drikke som vi planlegger å benytte for å vurdere
effekten av et forskningsprosjekt med målsetning om å fremme sunne levevaner blant barn,
6-12 år.
Hva innebærer det å svare på spørreskjemaet?
Spørsmålene vil bli sendt på mail og du besvarer spørsmålene på data. Etter 14. dager vil du
motta en ny mail, der du på nytt vil bli bedt om å svare på de samme spørsmålene. Det vil ta
ca. 10 minutter å svare på spørsmålene hver gang.
Dersom dere takker ja til deltagelse vil helsesøster ved ditt barns skole gi meg din mailadresse
slik at jeg kan oversende aktuelle spørreskjema, samt at hun vil veie og måle barnet.
Opplysningene om barnet knyttes opp mot spørreskjema ved hjelp av en kode for å sikre
anonymitet.
Hva skjer med informasjonen?
Alle opplysninger blir behandlet uten navn og fødselsnummer eller andre direkte
gjenkjennende opplysninger. En kode knytter ditt barn til opplysningene gjennom en
navneliste. Det er kun autorisert personell knyttet til prosjektet som har tilgang til
opplysningene.
Opplysningene vil kun brukes i dette studiet og all informasjon vil bli slettet når
undersøkelsen er ferdig. Det vil ikke være mulig å identifisere deg eller barnet når resultatene
av studien publiseres.
Frivillig deltagelse
Det er frivillig å delta i studien. Du kan når som helst og uten begrunnelse trekke deg fra
deltagelsen. Dersom du ønsker og delta i denne spørreundersøkelsen, samt at helsesøster veier
og måler ditt barn, undertegner du samtykkeerklæringen på baksiden av arket og returnerer
denne til helsesøster.
Tonje Holte Stea
Førsteamanuensis, Universitetet i Agder
E-post: [email protected]
Samtykke til å delta i studien Jeg er villig til å delta i studien.
(Signert av foresatte til barnet, dato)
Jeg bekrefter at jeg har gitt informasjon om studien til foresatte.
(Signert, helsesøster, dato)
Appendix 5
Region: Saksbehandler: Telefon: Vår dato: Vår referanse:
REK vest Anne BeritKolmannskog
55978496 04.09.2013 2013/1291/REK vest
Deres dato: Deres referanse:
25.06.2013
Vår referanse må oppgis ved alle henvendelser
Besøksadresse:HaukelandUniversitetssykehus,Sentralblokken, 2. etg, Rom4617
Telefon: 55975000E-post: [email protected]: http://helseforskning.etikkom.no/
All post og e-post som inngår isaksbehandlingen, bes adressert til REKvest og ikke til enkelte personer
Kindly address all mail and e-mails tothe Regional Ethics Committee, REKvest, not to individual staff
Eivind MelandUniversitetet i Bergen
2013/1291 Helsefremmende arbeid i Frisklivssentraler - virker det, hvordan virker det og hvorfor?
Universitetet i BergenForskningsansvarlig: Eivind MelandProsjektleder:
Vi viser til søknad om forhåndsgodkjenning av ovennevnte forskningsprosjekt. Søknaden ble behandlet avRegional komité for medisinsk og helsefaglig forskningsetikk (REK vest) i møtet 15.08.2013. Vurderingener gjort med hjemmel i helseforskningsloven (hfl.) § 10, jf. forskningsetikklovens § 4.
ProsjektomtaleHelsedirektoratet anbefaler etablering av frisklivssentraler i alle landets kommuner og beskriverfrisklivssentralenes rolle slik: «- Skal primært gi tilbud om hjelp til endring av levevaner – hvordan få tildette i praksis og skape mestringsopplevelser». Formålet med denne studien er å undersøke hvilken nyttedeltakerne har av disse tilbudene og om de endrer sine levevaner over tid, for eksempel spiser sunnere ellerer mer fysisk aktiv. Studien ser nærmere på tilbudet som gis til overvektige barn og deres familier og tilovervektige voksne med tilleggsrisikofaktorer. Universitetet i Bergen er ansvarlig for studien ogsamarbeider med Universitetet i Agder, Haukeland Universitetssykehus og flere Frisklivssentraler. Studienhar fire delprosjekt som i søknaden er beskrevet slik:1. En randomisert klinisk kontrollert studie av voksne deltagere som får kostholdsopplæring og deltar ifysisk aktivitet som deltagere i en av flere samarbeidende frisklivssentraler. Deltagerne randomiseres til engruppe som må vente ett halvt år på tilbudet og en gruppe som får tilbudet umiddelbart.2. En klyngerandomisert kontrollert studie blant barn og foreldre/ pårørende der bevegelse, deltagelse ogkost er kjerneelementer i intervensjonen.3. Kvalitative intervjustudier blant deltagere i frisklivstilbudet og ansatte i frisklivssentralene.Intervensjonene bygger på en økologisk helseforståelse som fordrer dialog og endring lokalt ved sentralene.De kvalitative studiene inngår i utviklingen av tjenestetilbudet.4. Lokale kvalitetsfremmende studier basert på anonymiserte rutinedata ved de forskjelligefrisklivssentralene. Slike data vil ansatte lokalt kunne bruke til dokumentasjon, kvalitetssikring ogkvalitetsforbedring.
VurderingPå oppfordring fra Helsedirektoratet er det etablert frisklivsentraler mange steder i Norge. Kunnskap omhvordan disse tilbudene oppleves og virker er viktig for den fremtidige driften. Siden disse tilbudene er i enetableringsfase vil mye av kunnskapsgrunnlaget endres over tid. Komiteen mener likevel de fire delstudieneer forsvarlig lagt opp og har ingen innvendinger til den fremlagte protokollen.
Barn under 16 årDelstudie 2 inkluderer barn mellom seks og åtte år. For denne aldersgruppen skal foresatte samtykke til
deltakelse på barnets vegne. I søknaden er det opplyst at deltakelse vil innebærer noen «enkle fysiske testersom kartlegger situasjonen ved start, etter tilbudets avslutning og etter 12 og 24 måneder». Ingen avprosedyrene som benyttes involverer risiko eller ubehag for barnet, men komiteen vil likevel minne om atbarna skal respekteres dersom de viser motvilje mot å delta i disse testene.
Rekruttering og samtykkeStudien er samtykkebasert og informasjonsskrivet gir en nøytral og oversiktlig beskrivelse av prosjektet.Rekruteringsprosedyrene synes forsvarlig lagt opp.
InformasjonssikkerhetForskningsdata skal lagres i samsvar med Universitetet i Bergen sine interne retningslinjer for sikkerdatalagring. Personidentifiserbare forskningsdata skal slettes eller anonymiseres straks det ikke lenger erbehov for dem og senest ved prosjektslutt. Ved eventuelt behov for lengre oppbevaring, må det sendes envelbegrunnet endringssøknad til REK. Denne prosjektgodkjenningen gjelder til prosjektslutt satt til31.12.2017.
VedtakREK Vest godkjenner prosjektet i samsvar med forelagt søknad.
Sluttmelding og søknad om prosjektendringProsjektleder skal sende sluttmelding til REK vest på eget skjema senest 30.06.2018, jf. hfl. §12. Prosjektleder skal sende søknad om prosjektendring til REK vest dersom det skal gjøres vesentligeendringer i forhold til de opplysninger som er gitt i søknaden, jf. hfl. § 11.
KlageadgangDu kan klage på komiteens vedtak, jf. forvaltningslovens § 28 flg. Klagen sendes til REK vest. Klagefristener tre uker fra du mottar dette brevet. Dersom vedtaket opprettholdes av REK vest, sendes klagen videre tilDen nasjonale forskningsetiske komité for medisin og helsefag for endelig vurdering.
Med vennlig hilsen
Ansgar BergKomitéleder
Anne Berit Kolmannskogsekretariatsleder
Kopi til: [email protected]
Appendix 6