
Page 1 of 8 June 12, 2014
Chlorinated Solvents and other Volatile Organic Compounds Pollution in
California Groundwater and
Associated State Water Board Cleanup Programs
June 12, 2014
This fact sheet summarizes chlorinated solvents and other volatile organic compounds (VOCs) in
California groundwater from polluted sites and the resulting impact to drinking water wells. It also
summarizes the oversight implemented by the State Water Resources Control Board (State Water
Board) and nine Regional Water Quality Control Boards (Regional Water Boards) (herein collectively
described as Water Boards) to investigate and cleanup active and historic polluted sites. Excerpts from
the draft California Water Plan Update 2013 are included with additional information provided by recent
studies from the State Water Board Groundwater Ambient Monitoring & Assessment (GAMA) Program,
and Water Board groundwater cleanup programs.
VOCs in groundwater are an issue that needs to be addressed. They represent a direct risk to human
health, as they are one of the most commonly detected pollutants in public supply wells and are a
threat to indoor air quality. Many VOCs, particularly chlorinated VOCs, are environmentally persistent
and do not readily degrade. Cleanup is complex and very expensive, which can be a financial
challenge to small business owners or individuals.
Background
The following background information is an excerpt from the California Water Plan Update 2013 –
Public Review Draft, Chapter 16, Groundwater/Aquifer Remediation, page 16-3 and 16-5. This excerpt
focuses on chlorinated solvents and VOCs most commonly detected in public supply wells. This
information will be updated when the final document becomes available. More information is available
in the full document located at: http://www.waterplan.water.ca.gov/cwpu2013/prd/index.cfm.
Most groundwater extraction and treatment remediation systems are located at sites where volatile organic
compound solvents, such as trichloroethylene (TCE) and [perchloroethylene or tetrachloroethylene] PCE,
have contaminated groundwater. TCE has been used as an industrial cleaning and degreasing agent and PCE
is a degreasing agent and has been the primary chemical used by dry cleaners for decades. Because TCE and
PCE are [dense non-aqueous phase liquids] DNAPLs in free phase, they tend to sink to the bottom of aquifers
or pool on top of low permeability units, they rarely can be excavated and removed. Both compounds are
considered carcinogenic at low concentrations. Remediation systems to extract and treat groundwater
contaminated with such solvents may be required. The total volume of water and the fraction of impacted
water remain unknown.
Dry cleaning business operations present a significant threat to groundwater quality. Past practices commonly
employed by dry cleaners resulted in PCE being discharged onto the ground at the business site or to the
sewer. As many as 15,000 dry cleaning facilities have operated in California. Most of these sites, past and
present, are small businesses in urban areas. The owners of these facilities typically do not have the resources
necessary to fund an investigation and, if necessary, the remediation to remove PCE. Therefore, relatively few
of the current and former dry cleaning sites have been investigated. Remediation at dry cleaning facilities

Page 2 of 8 June 12, 2014
typically involves soil vapor extraction. Where groundwater has been affected, pump and treat systems are
employed.
Recent studies seem to indicate that operating, non-operating, or poorly designed water wells and possibly oil
and gas wells provide conduits whereby chlorinated solvents spread from shallow to deeper aquifers. The
burden of dealing with PCE contamination of drinking water often falls on the water purveyor who pumps the
groundwater and who may have to discontinue use of the well or install costly treatment equipment. The cost
of dealing with the legacy of dry cleaning operations and other sources of chlorinated solvents is estimated to
be in the billions of dollars. Treatment systems to remove PCE and other chlorinated solvents from
groundwater may need to operate for decades.
Except for petroleum USTs, it is difficult to estimate the cost of cleaning contaminated sites. In 1989, the
California Legislature established the Underground Storage Tank Cleanup Fund [USTCF] to reimburse
petroleum UST owners for the costs associated with the cleanup of leaking petroleum USTs. The Fund
disburses about $200 million annually to eligible claimants. In the 1990s, the cost to clean up an individual
UST site typically ranged from $100,000 to $200,000. The cleanup of UST sites contaminated with MTBE
costs significantly more, with reimbursements as high as the Fund’s limit of $1.5 million per site. As of June
2011, the Fund disbursed more than $3.1 billion to eligible claimants since its establishment.
A site where solvent contamination has reached groundwater may require continuous pump and treat
operation for decades and cost millions of dollars. As previously discussed, most sites with solvent discharges
(e.g., dry cleaning facilities) have yet to be investigated and remediated.
Based on cost data from the State Water Resources Control Board and the California Department of Public
Health, Division of Drinking Water and Environmental Management, total groundwater remediation costs in
California, excluding costs of salt management, could approach $20 billion during the next 25 years. The
estimate is based on current costs for remediation, estimated future costs for similar remediation, newly
discovered contamination, and emerging contaminants. Almost all of these costs are associated with
contaminants from previous human activities (legacy contaminants). Current pollution prevention strategies
are expected to result in significantly less discharge of contaminants such as petroleum fuel, solvents, and
perchlorate.
It should be noted that in addition to the pump and treatment remediation technique discussed in the
above excerpt, there are additional remediation techniques used today including: in-situ chemical
oxidation, bio-stimulation, permeable reactive barriers, and many others.
Vapor intrusion to indoor air is the primary risk to human health at many VOC-impacted sites. However,
this fact sheet focuses on groundwater impacts and does not include a detailed discussion of vapor
intrusion to indoor air.
Impacted Drinking Water Wells – Comparison of Petroleum and Chlorinated Solvents
The State Water Board prepared a report to the legislature, in accordance with Assembly Bill 2222 (AB
2222), titled: Communities That Rely on a Contaminated Groundwater Source for Drinking Water (AB
2222 Report), dated January 2013. The AB 2222 report used water quality data from the California
Department of Public Health (CDPH) database, and identified public supply wells with two or more

Page 3 of 8 June 12, 2014
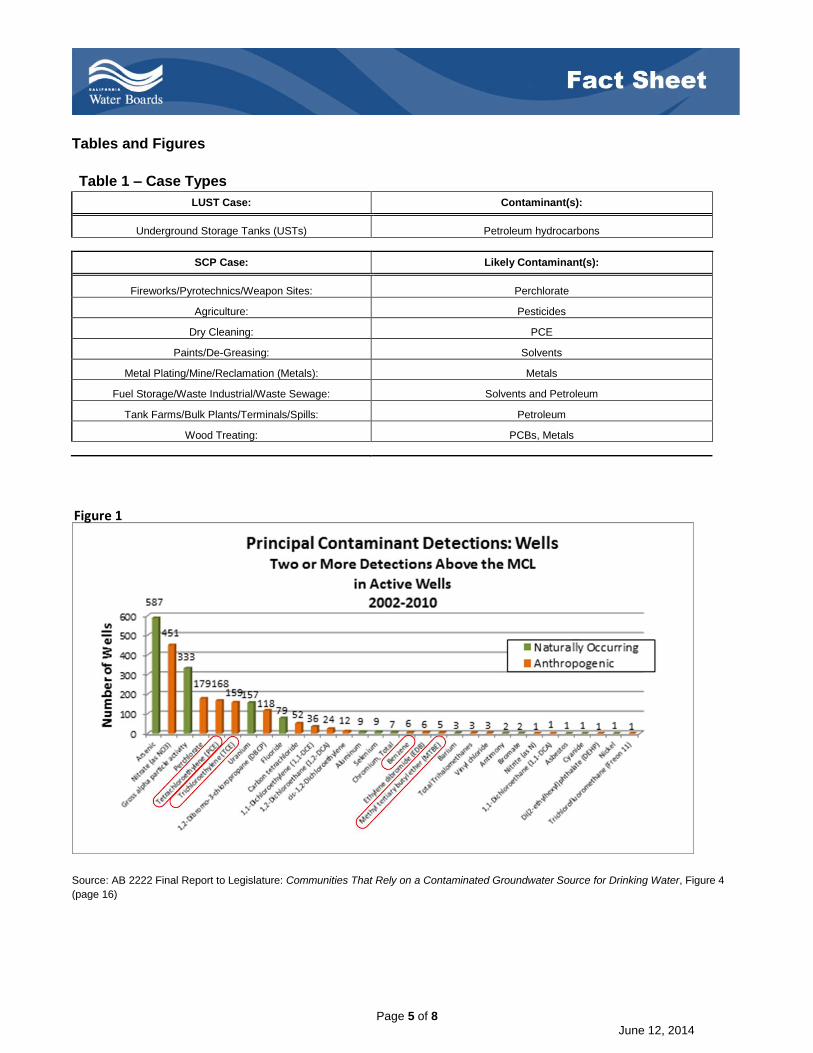
detections of principal contaminants above drinking water standards between 2002 and 2010. A
“principal contaminant” is defined as a chemical detected above a public drinking water standard on two
or more occasions between 2002 and 2010. Figure 1 (below) shows the distribution of principal
contaminants in public supply wells. The AB 2222 Report identified that of the 8,396 public supply
wells, wells with VOC principal contaminants were: 168 wells with PCE; 159 wells with TCE; 6 wells
with benzene; and 5 wells with methyl-tert butyl ether (MTBE). Using the AB 2222 Report dataset, AB
2222 report maps (Figures 2 & 3) show the statewide distribution of public supply wells with 1)
petroleum-type contaminants, MTBE and benzene; and 2) two common solvent contaminants, PCE
and TCE. Comparison of Figures 1 through 4 indicates there is higher probability that impacts to wells
are from solvents and are two orders of magnitude greater than wells impacted with petroleum
contaminants.
In addition to the public supply wells, the GAMA Program Domestic Well Project has sampled over
1,100 domestic wells since 2002. Of the domestic wells sampled, TCE, benzene, MTBE are detected
in three different domestic wells. PCE was not detected above drinking water standards in any of the
domestic wells sampled. It should be noted that the dataset for the domestic wells is limited, thus may
not represent actual statewide groundwater conditions. As such, the CDPH dataset (discussed above)
is considered to be more representative of public use groundwater source conditions in California.
More information regarding the Domestic Well Project can be found at
http://www.waterboards.ca.gov/water_issues/programs/gama/domestic_well.shtml.
Water Board Groundwater Cleanup Programs
The Water Boards oversee cleanup at multiple types of sites with various pollutants in both soil and
groundwater including petroleum UST sites, public and private industrial sites, former and existing
military sites, and land disposal sites. Water Boards oversight for cleanup is regulated by four separate
programs: 1) the Underground Storage Tank (UST) Program, 2) Site Cleanup Program (SCP), 3)
Department of Defense (DOD) Program, and 4) Land Disposal Program. The DOD Program and Land
Disposal Program are not discussed in detail as part of this fact sheet.
As a comparison, Table 1 shows the typical type of cases regulated by the Water Boards under the
UST Program and the SCP. The UST Program is limited to only petroleum-type sites where petroleum
was stored in USTs. The SCP has a much wider range of type of sites and pollutants (largely solvents)
associated with industrial/commercial uses.
Geographic Distribution of Sites – Comparison of LUST and SCP sites
Figures 4 and 5 show the distribution of open1 sites in California for which the Water Boards oversee
cleanup under the UST program and SCP. The figures show open Leaking USTs (LUST) sites (5,517)
and SCP sites (5,667). These maps were generated from the GeoTracker database and ArcGIS™.
The number and distribution of LUST and SCP sites are similar with the majority of sites located in
urbanized areas.
1 “Open” includes both active and inactive sites in the GeoTracker database.

Page 4 of 8 June 12, 2014
Current Funding – Comparison of LUST and Site Cleanup Programs
LUST cases have benefited from the USTCF, which has greatly contributed to moving LUST cases
through closure. The USTCF provides a means for petroleum UST owners and operators to meet the
federal and state requirements of maintaining financial responsibility to pay for any damages arising
from unauthorized releases of petroleum from their UST systems. Since implementation of the USTCF
in 1989, the USTCF has disbursed over $3.2 billion to eligible claimants for LUST cleanup.
Additionally, the UST Program has overseen the cleanup of over 35,000 LUST cases since 1984.
Cleanup for many of these cases, which are small businesses and individuals that could not normally
afford cleanup in its entirety, were funded partially or fully with USTCF revenues up to $1.5 million
each.
In contrast, the SCP has very little revenues to assist small business owners and individuals with
cleanup. The Water Boards’ Cleanup and Abatement Account typically disburses between $1 million to
$5.5 million per year for as few as 4 to 6 SCP cases for small business owners or individuals. For the
vast majority of SCP cases, the responsible party is required to finance the cleanup of their site in its
entirety and pay for agency oversight under the Water Boards’ Cost Recovery Program. Of the 5,667
open SCP cases, only 2,366 (42%) are in the Cost Recovery Program. For oversight and
administration of the program, the Water Boards receive approximately $15 million of funding per year
from the Cost Recovery Program for these 2,366 cases. For oversight of the remaining 3,301 cases
that are not in the Cost Recovery Program, the Water Boards receive approximately $2 million per year
from the State General Fund (less than $606 per case per year for oversight).
Cleanup Status – Comparison of the LUST & SCP Cases
Figures 6 and 7 show the case status trends for both the LUST and SCP cases, respectively. The
LUST cases graph shows a distinct declining trend for open cases. This trend may be attributed to: 1)
the USTCF revenues available for assisted site cleanup and agency oversight, 2) the propensity for
natural attenuation of petroleum, and 3) the decrease in new LUST cases due to new secondary
containment requirements.
In contrast, the SCP cases graph shows a gradual increasing trend for open cases that appears to
have stabilized since 2011. The lack of a declining trend under the SCP may be attributed to: 1) the
low percent of cases (42%) in the Cost Recovery Program, 2) limited resources for oversight of non-
Cost Recovery Program cases, 3) high priority cases monopolizing oversight, and 4) complexity and
high cost to cleanup SCP sites.
Conclusions
The USTCF demonstrates a successful funding model for moving cleanup sites through closure by
providing funding for continuous oversight and assisting small business owners/individuals for cleanup.
The direct cost recovery model used by the SCP has been less successful and the backlog of SCP
sites and impacted wells will likely continue in the future unless additional funding for SCP can be
identified.
Page 5 of 8 June 12, 2014
Tables and Figures
Table 1 – Case Types
LUST Case: Contaminant(s):
Underground Storage Tanks (USTs) Petroleum hydrocarbons
SCP Case: Likely Contaminant(s):
Fireworks/Pyrotechnics/Weapon Sites: Perchlorate
Agriculture: Pesticides
Dry Cleaning: PCE
Paints/De-Greasing: Solvents
Metal Plating/Mine/Reclamation (Metals): Metals
Fuel Storage/Waste Industrial/Waste Sewage: Solvents and Petroleum
Tank Farms/Bulk Plants/Terminals/Spills: Petroleum
Wood Treating: PCBs, Metals
Source: AB 2222 Final Report to Legislature: Communities That Rely on a Contaminated Groundwater Source for Drinking Water, Figure 4
(page 16)
Figure 1

Page 6 of 8 June 12, 2014
Source: AB 2222 Report dataset; locations are approximate. Source: AB 2222 Report dataset; locations are approximate.
Note: The two above maps were compiled using the AB 2222 Report dataset. They were modified from the original report to show MTBE (5) and benzene (6) impacted wells on a single map,
and to show TCE (159) and PCE (168) impacted wells on a single map.
Figure 2 Figure 3

Page 7 of 8 June 12, 2014
Source: GeoTracker as of 6/1/2014 (5,517 sites) Source: GeoTracker as of 6/1/2014 (5,667 sites)
Figure 4 Figure 5

Page 8 of 8 June 12, 2014
Note: New Cases are cases opened during the calendar year. Open cases include all active and inactive open cases and include new
cases. Total Cases include all open and closed cases.
Figure 6
Figure 7
Figure 6


![Effects of the Abused Inhalant Toluene on the Mesolimbic ... · nitrite, (2) anesthetic gas nitrous oxide, and (3) volatile solvents, fuels, and anesthetics [1]. Volatile solvents](https://cdn.vdocuments.us/doc/165x107/5f066e857e708231d417f681/effects-of-the-abused-inhalant-toluene-on-the-mesolimbic-nitrite-2-anesthetic.jpg)


